Bilateral effects of non-tariff measures on international ...

World TrAde reporT 2012
94
This section reviews available sources of information on non-tariff measures (NTMs) and services measures, evaluating their relative strengths and weaknesses. It uses available information to establish a number of “stylized facts” regarding the incidence of NTMs and services measures in general. It looks in particular at technical barriers to trade, sanitary and phytosanitary measures and domestic regulation in services.
C. An inventory of non-tariff measures and services measures

II – TRADE AND PUBLIC POLICIES: A CLOSER LOOk AT NON-TARIFF MEASURES IN THE 21ST CENTURY
95
C. A
N IN
VE
NTO
RY
OF N
ON
-TAR
IFF
ME
AS
UR
ES
AN
D S
ER
VIC
ES
ME
AS
UR
ES
Some key facts and findings
• Progress is being made on improving the quality and availability
of data on non-tariff measures and services measures, but much
remains to be done.
• Availabledatadonotshowanyclearincreasingtrendin
the overall use of non-tariff measures in the last decade.
• Technicalbarrierstotradeandsanitaryandphytosanitary
measures appear to have become prominent, according to official
WTO information. This is confirmed by survey data from both
developing and developed economies.
• Proceduralobstaclesareaparticularsourceofconcernfor
exporters from developing countries.
• Althoughthereissomeevidencethatmeasuresrestrictingtrade
in services have decreased over time in developed economies,
a serious limitation of available data on applied regimes in
the services area makes it difficult to distinguish between market
access, national treatment and domestic regulation.
Contents 1 SourcesofinformationonNTMsandservicesmeasures 96
2 StylizedfactsaboutNTMsrelatedtotradeingoods 105
3 Servicesmeasures 122
4 Conclusions 126
AppendixC.1:DatahandlingmethodologyintheUNCTAD’sTradeAnalysisInformationSystem(TRAINS) 131
AppendixC.2:Regressionresults 133

World TrAde reporT 2012
96
Thissectionsurveysavailablesourcesofinformationonnon-tariff measures (NTMs) and services measures,evaluates their relative strengths and weaknesses,summarizesthecontentoftheprincipaldatabases,andusesthisinformationtoestablishanumberof“stylizedfacts” about these types of measures. This last taskturnedout tobesurprisinglydifficultduetosignificantgapsindataandtonumerousshortcomingsinthedatathat do exist. Despite these limitations, the followingdiscussionattemptstocapturemanykeyfeaturesofthecurrentNTM landscapeand todocumentanumberoftrends in their use over time. As far as servicesmeasuresareconcerned,thedatalimitationsappeartobe even more severe than in the case of NTMs. Inparticular,thecurrentdataonservicesmeasuresdonotallow clear distinctions to be drawn between marketaccess, national treatment (i.e. the principle of givingothersthesametreatmentasone’sownnationals)anddomesticregulationissues.
The scarcity of data on non-tariff measures andservicesmeasuresstemsinlargepartfromthenatureofthesemeasures,whichfindtheirultimateexpressionin complex legal documents rather than in easilyquantifiable tariff schedules. The universe of NTMsencompassesallmeasuresthataffecttradeotherthantariffs,butsincemostregulatoryactionundertakenbygovernments can at least potentially influence trade,the set of possible NTMs is huge and its bordersindistinct. Similar considerations apply to servicesmeasures. On the goods side, this section examinesthe available evidence, with a particular attention totechnical barriers to trade (TBT) and sanitary andphytosanitary (SPS) measures (covering food safetyand animal and plant health). Traditional quantitativeandprice-basedmeasuresarealsodiscussed,butthefact that TBT/SPS measures are among the mostfrequently encountered NTMs and raise some of themostdifficult challenges from theWTO’sperspectivejustifiestheadditionalattentionpaidtothesekindsofmeasures. On the services side, the section takesstock of all measures affecting trade in services, tothe extent possible, before focusing on domesticregulation.
Statistics on non-tariff measures and servicesmeasuresare collectedbymanydifferent institutionsfor a variety of purposes. As a result, data are oftenpresented in formats that are not amenable toquantitativeanalysis,withsignificantgapsincoverageforparticularcountriesandtimeperiods.Whenreliableinformation isavailable, itmaystillprovidenoclueastohowstrictlymeasuresareapplied,orwhether theyareapplied inadiscriminatorymanner.Mostdatasetssimply present counts of the number of measures ineffectataparticularplaceandtime,butthesecountshave no natural economic interpretation and saynothing about the restrictiveness of individualmeasures.Forthesereasonsandothers,theavailabledata on NTMs and services measures can only becharacterizedassparseandincomplete.
The remainderof the section is organizedas follows.Section C.1 reviews the main sources of statisticalinformation on non-tariff measures and servicesmeasures, paying particular attention to areas wherethedataaredeficient.SectionC.2extractsanumberofstylized factsonNTMs ingoods fromtheprincipaldatabases. Section C.3 provides a similar account ofstylized facts about services measures. Section C.4containsconcludingremarks.
1. SourcesofinformationonNTMsandservicesmeasures
This sub-section presents the main sources ofinformation on non-tariff measures and assesses thecoverage and quality of the data they provide. BothinternalWTOsourcesandexternalnon-WTOsourcesare examined. The following overview highlights thediversityofthesourcesandofthemodesinwhichthedata are collected, distinguishing betweennotifications, monitoring, specific trade concerns,official data collection or business surveys. AdistinctionismadebetweeninformationonNTMsandinformationonimpedimentstotraderelatedtoNTMs.It also shows that despite this diversity, the data arepatchyatbest.Eachdatasourceshedslightonasmallpartoftheuniverse.Thelightitshedsdependsonthespecific purpose for which the data have beencollectedaswellasonhowtheyhavebeencollected,i.e. whether a measure is simply reported/notified orwhether there isacomplaint relating to themeasure.In any case, considerable caution is warranted ininterpretingtheavailableevidence.
(a) WTOinternalsourcesofinformation
One important source of information on WTOmembers’ trade policies are their schedules ofconcessions/commitments.Theseschedules,however,provide useful information on the policies thatmembershavecommitted toapply rather thanon thepolicies they actually apply. WTO agreements alsoinclude multiple provisions aimed at improving thetransparency of policy measures affecting trade.These provisions can be grouped into the followingfour categories: (a) publication requirements;(b) notification requirements; (c) the Trade PolicyReviewMechanismandthemonitoringreports;(d)thepossibility of raising specific trade concerns in theSPS and TBT committees and in the disputesettlementmechanism(DSM).
(i) Schedules of concessions/commitments
Theschedulesofconcessionsforgoodsmostlycontaininformation on members’ tariff commitments but theyalso cover their commitments regarding the use of anumber of non-tariff measures that affect trade inagricultural products as well as their so-called “non-tariffconcessions”.TheagriculturalNTMcommitments

II – TRADE AND PUBLIC POLICIES: A CLOSER LOOk AT NON-TARIFF MEASURES IN THE 21ST CENTURY
97
C. A
N IN
VE
NTO
RY
OF N
ON
-TAR
IFF
ME
AS
UR
ES
AN
D S
ER
VIC
ES
ME
AS
UR
ES
includetariffquotas(wherebyquantitiesinsideaquotaarechargedlowerimportdutyratesthanthoseoutside)as well as commitments limiting subsidization inagriculture (total Aggregate Measurement of Support(AMS)commitmentfordomesticsupport,andbudgetaryoutlaysandquantityreductioncommitmentsforexportsubsidies). As for the non-tariff concessions (Part III),theywereeither addedaspart of theUruguayRoundnegotiations (but only by a few members) or after theUruguayRoundaspartofacountry’sWTOaccessionprocess.1 Both tariff and non-tariff commitments arealso available electronically in the Consolidated TariffSchedules database. Note that the commitments ascompiled in the database are not easily comparableacrossproductsandmembers.2
The schedules of commitments for services set outmarket access and national treatment commitments.Foreachserviceonwhichacommitmentismade,theschedule indicates, under each of the four modes ofsupply, any limitations on market access or nationaltreatment which the member is allowed to maintain.Limitations not recorded in the schedules in this wayareillegal.Theschedulesthuscombinea“positivelist”ofcoveredserviceswitha“negativelist”oflimitations.They guarantee a minimum standard of access;members are always free to grant more favourablelevels of market access and national treatment thanare specified in their schedules, on a most-favourednation(MFN)orequaltreatmentbasis,andmanydoso(seeSectionD.3).
(ii) Publication requirements and enquiry points
Article X.1 of the General Agreement on Tariffs andTrade (GATT) requires the prompt publication of alltrade regulations “in such a manner as to enablegovernments and traders to become acquainted withthem”. Several other WTO agreements contain morespecific publication requirements. In the TBTAgreement, for instance, Article 2.9.1 requires thepublicationofanoticewhenthegovernmentenvisagesintroducing a technical regulation which is not basedon internationalstandardsandmayhaveasignificanteffect on trade. Similarly, Article 2.11 requires thepublication of all technical regulations which havebeen adopted. Identical provisions also apply toconformity assessment procedures. Besides thosepublication requirements, the TBT Agreement alsoincludes provisions requiring the establishment ofenquiry points able to answer enquiries and providerelevant documents regarding technical regulations,standardsandconformityassessmentprocedures.
The purpose of publication requirements and enquirypoints is to contribute to transparency by informingothermembersingeneral,andproducersinexportingmembers in particular (see Article X as well as, forinstance, Articles 1, 2 and 3 of Annex B of the SPSAgreement).Publicationrequirementsandnotifications
(seebelow)tendtocomplementeachother.TheSPSand TBT agreements require the notification of draftregulationstotheWTOSecretariatandthepublicationof the adopted regulations. An important differencebetween notification and publication requirements isthat the former is centralized in the WTO Secretariatwhile the latter merely involves making informationpublicly available. Another difference is that whilenotificationsmustbetransmittedtotheWTOinoneofthe three official languages (English, French orSpanish),publicationsareinthenationallanguage.
(iii) Notifications
TheWTOframeworkcontainsmorethan200differentlegal notification requirements, the large majority ofwhich relate to non-tariff measures. NotificationrequirementsundertheWTOarehighlydiverse.3First,whileavastmajorityofrequirementsobligememberstoprovideinformationontheirownpolicies,someare“reverse”notifications,whichallowmemberstoidentifymeasures imposed by other members. Secondly,notificationsdifferfromeachotherwithregardtohowfrequently they are required. Most of those coveringlawsandregulationsareone-off requirements,withaseparate obligation to notify any changes thereafter.The notifications that provide information on themeasures themselves typically take two differentforms:theyareeitheradhocor(semi-)annual.Thirdly,abouthalfofthenotificationrequirementscoverNTMsthattypicallyapplytospecificproducts.Inthosecases,notification templates generally require members toindicate which products are covered. The other halfrelates to measures (e.g. laws and regulations) thataffect, or could potentially affect, all products(e.g.pre-shipmentinspectionorcustomsvaluation).
A comparison of the list of notifications with the2010versionoftheInternationalClassificationofNon-tariffMeasures suggests that notifications covermostof the categories (see Table C.2). The internationalclassification comprises 16 broad categories ofmeasures, of which only three do not seem to becoveredatallbyWTOnotificationrequirements.Thoseare finance measures, distribution restrictions andrestrictions on post-sales services. All the othercategoriesareat leastpartlycovered(i.e.anumberofsub-categoriesarecoveredwhileothersarenot).
Where notification requirements broadly match NTMcategories, however, they do not necessarily cover themeasuresthatcouldbeclassifiedtherein.Inthecaseofsanitary and phytosanitary measures, for example,Article 7 and Annex B of the SPS Agreement requiregovernmentstonotifynewSPSregulationswhicharenotbasedon internationalstandardsandhaveasignificanteffectonthetradeofothermembers,andtonotifythoseat an early stage, i.e. when amendments can still beintroduced.Measuresthatwereinplacebeforetheentryinto force of the SPS Agreement need not be notified,nor is there an obligation to notify the final measures

World TrAde reporT 2012
98
whentheyenterintoforce.Thismeansthatsomeofthemeasures in place were not notified and that some ofthose notified may have been amended before beingimplementedorevennotimplementedatall.
Notifications provide an incomplete and sometimesmisleading account of the incidence of non-tariffmeasures.4 First, WTO members do not necessarilycomplywith theirnotification requirements.While thelevel of compliance is not easy to measure, a simplecount of notifications for selected requirementssuggeststhatatleastinsomeareas,itisrelativelylow.AsdiscussedinmoredetailinSectionE.4,difficultiesfacedbymembersinmakingtheirnotificationsmaybepartofthereasonforthelowcompliance,butthemainexplanation is certainly that governments have noincentivetonotify,or,worse,mayhaveanincentivenotto notify. Secondly, notifications serve variouspurposes (Bacchetta et al., 2012). Some of themclearlydonotaimatprovidinganexhaustiveinventoryofallthemeasuresintheareatheycover. IntheSPSandTBTagreements, forexample,notificationsservetoallowothermemberstoparticipateintheformationof new regulations. This explains why there is norequirement tonotifymeasures inplacebefore1995(when the agreements came into effect) or finalmeasures. Thirdly, the “quality” of the informationprovided varies significantly among notifications.5Again, the quality criteria may be debatable, but inmany cases, notifications fail to provide preciseinformationonimportantdimensionsofthemeasures,such as product coverage or the time period duringwhichthemeasureremainsinplace.
Only a sub-set of the information collected throughnotifications is stored in searchable databases.6 TheWTO Secretariat has developed informationmanagement systems to facilitate access to all theinformation on SPS and TBT measures provided bymembers through the various existing transparency
mechanisms. The TBT Information ManagementSystemandtheSPSInformationManagementSystemare “one-stop” systems that allow users to accessinformation on TBT or SPS measures that membergovernments have notified to the WTO as specifictradeconcernsraisedintheSPSorTBTCommitteeorthroughmembergovernments’enquirypoints.ThetwoinformationmanagementsystemsarenotexactlyNTMdatabases.Theyaredocumentdatabaseswhichmakeit possible to search relevant documents by code,bynotifyingmember,bydate,byproductorbykeyword.
Access to all information from notifications will besubstantially improved with the new Integrated TradeIntelligence Portal (I-TIP) which is currently beingdeveloped by the WTO Secretariat to provide unifiedaccess to all information on trade and trade policymeasuresavailableattheWTO.
In services, the transparency-related notificationobligation is contained in Article III:3 of theGeneral Agreement on Trade in Services (GATS). Itrequires WTO members to notify measures that“significantlyaffecttrade”inservicescoveredbytheirspecific commitments. As of end-2011, just over400 notifications in total had been received.7FigureC.1showsthenumberofnotificationsreceivedperyearsince2000.
Considering the high number of sectors withcommitments by the 153 WTO members as of end-2011 (on average, developing countries havecommitments inmorethan50sectorsanddevelopedcountries nearly 110 sectors), it seems apparent thatthenumberofnotificationsreceivedinanygivenyearcannot account for the entire set of measures thatshouldhavebeennotifiedbymembers.OnedifficultyformembersregardingtheGATS is that thescopeofmeasurestobenotifiedisnotnecessarilyclear,astheGATS provides no further guidance on the
FigureC.1:GATS Article III:3 notifications received, 2000-2011 (numberofnotifications)
2000 2001 2002 2003 2004 2005 2006 2007 2008 2009 2010 2011
50
25
30
35
40
45
20
15
10
5
0
Source:WTOSecretariat.
II – TRADE AND PUBLIC POLICIES: A CLOSER LOOk AT NON-TARIFF MEASURES IN THE 21ST CENTURY
99
C. A
N IN
VE
NTO
RY
OF N
ON
-TAR
IFF
ME
AS
UR
ES
AN
D S
ER
VIC
ES
ME
AS
UR
ES
interpretationoftheterm“significantlyaffecting”tradein services. However, as already mentioned, lowcompliancewiththenotificationrequirementsismostlyan incentive issue. In committed sectors, memberswouldhavenoincentiveto“incriminate”themselvesbynotifying measures that somehow violated theircommitments. They might also have an interest inbeing non-transparent about measures that“significantly”liberalizedaccesstocommittedsectors,astheymightbefacedwithrequeststobindanysuch,notnecessarilyknown,liberalization.
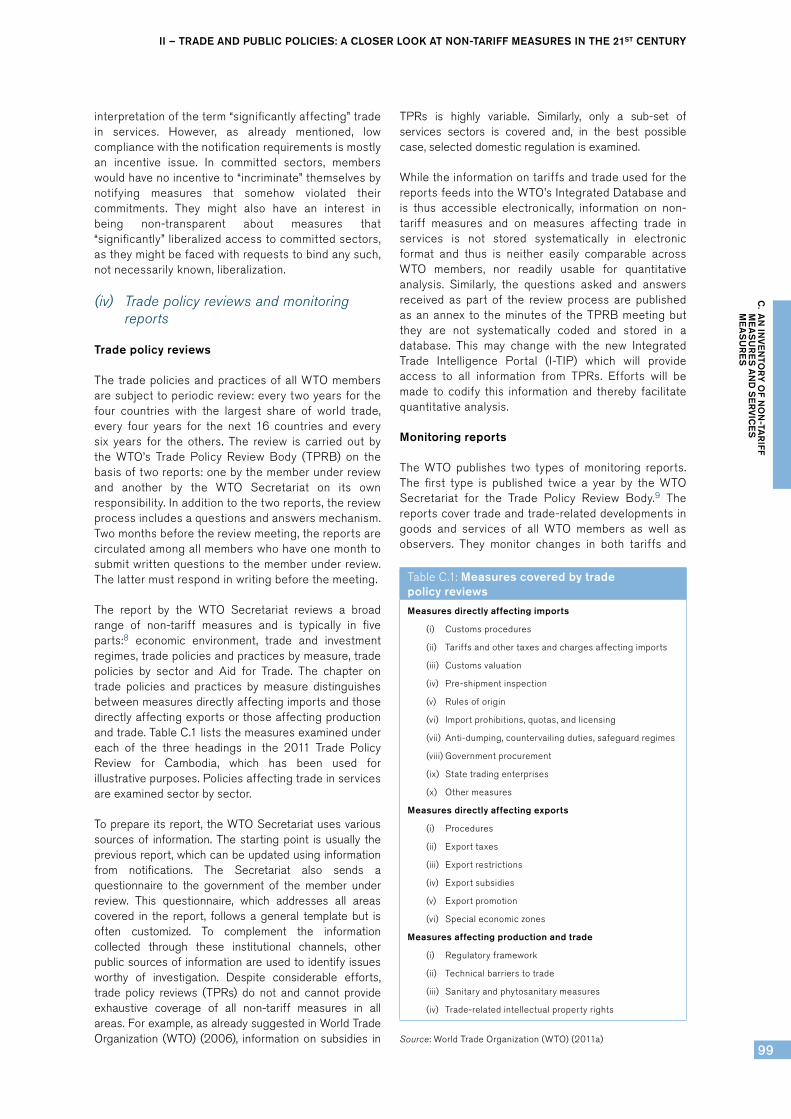
(iv) Trade policy reviews and monitoring reports
Trade policy reviews
ThetradepoliciesandpracticesofallWTOmembersaresubjecttoperiodicreview:everytwoyearsforthefour countries with the largest share of world trade,every four years for the next 16 countries and everysix years for the others. The review is carried out bythe WTO’s Trade Policy Review Body (TPRB) on thebasisoftworeports:onebythememberunderreviewand another by the WTO Secretariat on its ownresponsibility.Inadditiontothetworeports,thereviewprocessincludesaquestionsandanswersmechanism.Twomonthsbeforethereviewmeeting,thereportsarecirculatedamongallmemberswhohaveonemonthtosubmitwrittenquestionstothememberunderreview.Thelattermustrespondinwritingbeforethemeeting.
The report by the WTO Secretariat reviews a broadrange of non-tariff measures and is typically in fiveparts:8 economic environment, trade and investmentregimes,tradepoliciesandpracticesbymeasure,tradepolicies by sector and Aid for Trade. The chapter ontrade policies and practices by measure distinguishesbetweenmeasuresdirectlyaffectingimportsandthosedirectlyaffectingexportsorthoseaffectingproductionandtrade.TableC.1liststhemeasuresexaminedundereach of the three headings in the 2011 Trade PolicyReview for Cambodia, which has been used forillustrativepurposes.Policiesaffectingtradeinservicesareexaminedsectorbysector.
Toprepare itsreport, theWTOSecretariatusesvarioussourcesof information.Thestartingpoint isusually thepreviousreport,whichcanbeupdatedusinginformationfrom notifications. The Secretariat also sends aquestionnaire to the government of the member underreview. This questionnaire, which addresses all areascovered in the report, followsageneral templatebut isoften customized. To complement the informationcollected through these institutional channels, otherpublicsourcesofinformationareusedtoidentifyissuesworthy of investigation. Despite considerable efforts,trade policy reviews (TPRs) do not and cannot provideexhaustive coverage of all non-tariff measures in allareas.Forexample,asalreadysuggestedinWorldTradeOrganization (WTO) (2006), informationonsubsidies in
TPRs is highly variable. Similarly, only a sub-set ofservices sectors is covered and, in the best possiblecase,selecteddomesticregulationisexamined.
WhiletheinformationontariffsandtradeusedforthereportsfeedsintotheWTO’sIntegratedDatabaseandis thus accessible electronically, information on non-tariff measures and on measures affecting trade inservices is not stored systematically in electronicformat and thus is neither easily comparable acrossWTO members, nor readily usable for quantitativeanalysis. Similarly, the questions asked and answersreceived as part of the review process are publishedasanannex to theminutesof theTPRBmeetingbutthey are not systematically coded and stored in adatabase. This may change with the new IntegratedTrade Intelligence Portal (I-TIP) which will provideaccess to all information from TPRs. Efforts will bemade to codify this information and thereby facilitatequantitativeanalysis.
Monitoring reports
The WTO publishes two types of monitoring reports.The first type is published twice a year by the WTOSecretariat for the Trade Policy Review Body.9 Thereportscovertradeandtrade-relateddevelopmentsingoods and services of all WTO members as well asobservers. They monitor changes in both tariffs and
TableC.1:Measures covered by trade policy reviews
Measures directly affecting imports
(i) Customsprocedures
(ii) Tariffsandothertaxesandchargesaffectingimports
(iii) Customsvaluation
(iv) Pre-shipmentinspection
(v) Rulesoforigin
(vi) Importprohibitions,quotas,andlicensing
(vii) Anti-dumping,countervailingduties,safeguardregimes
(viii)Governmentprocurement
(ix) Statetradingenterprises
(x) Othermeasures
Measures directly affecting exports
(i) Procedures
(ii) Exporttaxes
(iii) Exportrestrictions
(iv) Exportsubsidies
(v) Exportpromotion
(vi) Specialeconomiczones
Measures affecting production and trade
(i) Regulatoryframework
(ii) Technicalbarrierstotrade
(iii) Sanitaryandphytosanitarymeasures
(iv) Trade-relatedintellectualpropertyrights
Source:WorldTradeOrganization(WTO)(2011a)

World TrAde reporT 2012
100
non-tariff measures as well as in a broad range ofmeasuresaffectingtradeinservices.ThesecondtypeofreportispublishedbytheWTOSecretariattogetherwith the secretariats of the OECD and UNCTADfollowing a request by the G20 to monitor trade andinvestment measures.10 These reports, which onlycoverG20countries,arealsoissuedtwiceayear.
Thesourcesof informationused for the two typesofreportsaresimilar.Bothreportsmostlyuseinformationcollected through a request for information sent toWTOmembers, informal reversenotificationsand thepress. This information is then submitted to therespective members for verification. The data aremadeavailableinpublicreportsandstoredinspread-sheets, but not in a database. Like all the otherinformationontradeandtradepolicycollectedbytheWTO, however, it will be made available through thenewIntegratedTradeIntelligencePortal(I-TIP)portal.
WTOmembershaverecognizedtheusefulnessofthetrade monitoring exercise. There is broad consensusfor its continuation and strengthening as well as forthe related briefings by the Director-General ininternationalforasuchastheG20.11
(v) Specific trade concerns and disputes
Specific trade concerns
WTOmembershaveusedboth theTBTand theSPScommittees as fora to discuss issues related tospecificmeasurestakenbyothermembers.Thesearereferred to as “specific trade concerns” and relatevariouslytoproposedmeasuresnotifiedtotheTBTorSPS committees in accordance with the notificationrequirements in the relevant agreement, or tomeasures currently in force. Committee meetings, orinformal discussions between members held on themargins of such meetings, afford members theopportunity to review trade concerns in a bilateral ormultilateralsettingandtoseekfurtherclarification.
Specific trade concerns raised by members are asource of potentially interesting information on theeffectsofnon-tariffmeasures.Specifictradeconcernspointoutparticularobstaclesfacedbyexportersfromthe country raising the concern in a given exportmarket.TheinformationtheyprovideontheeffectsofNTMs is thus similar to that provided by businesssurveys. The main difference is that specific tradeconcerns are channelled through governments.Exporters facing an obstacle may complain to thegovernment, which may or may not raise the issue attheWTO.Thismeansthatspecifictradeconcernsmayprovide a distorted picture of the trade-restrictive ortrade-distortiveeffectsofTBTandSPSmeasures.Anumberofconcernsmayneverbe raised.12Moreover,therearenoreasonstobelievethattheonesthatgetraised are statistically representative of all theTBT/SPSrelatedtradedistortionsfacedbymembers.
As already mentioned, the TBT InformationManagement System and the SPS InformationManagementSystemallowuserstotrack,andperformsearcheson,specifictradeconcernsraisedintheTBTor SPS committees but they are not suitable forquantitative analysis. The WTO Secretariat has thuscoded all the relevant information on specific tradeconcerns and created two databases: one on TBTmeasures and one on SPS measures. The TBTSpecific Trade Concerns (STC) Database providesinformation on the 317 concerns raised in the TBTCommittee between January 1995 and June 2011.13The SPS STC Database provides information on the312 concerns raised between January 1995 andDecember 2010. Each of these corresponds to aconcernraisedbyoneormoremembersinrelationtoameasuretakenbyoneoftheirtradingpartners.Sincesome of these measures might have been notified tothe WTO, the concern might be related to one orseveral notifications of the member taking themeasure.Themaindifficultywiththecodificationwasto attribute product codes from the HarmonizedSystem(thesystemusedbyparticipatingcountriestoclassifytradedgoodsonacommonbasis).14
Disputes
Disputes initiatedbymembersunder theWTOdisputemechanismareanothersourceofpotentiallyinterestinginformationon theeffectsofnon-tariffmeasures.TheWTOSecretariatmaintainsadatabaseon“requestsforconsultations”, the first step in formally initiating adispute in the WTO. As of 31 December 2011, thedatabase had information on 427 such requests.15These data do not indicate the type of non-tariffmeasure at issue in the disputes, but the WTOagreement(s)andprovision(s)citedineachdisputearelisted. Using the latter, it is possible to obtain anestimateofthenumberofcasesinvolvingeachtypeofnon-tariff measure. When doing this, however, it isimportanttobearinmindthatforeconomicandpoliticalreasons,anumberofNTM-relatedtradedistortionsmaygounchallenged.Aswithspecifictradeconcerns,thereis no reason to believe that the measures challengedwerestatistically representativeofall theNTM-relatedtradedistortionsfacedbymembers.16
Another problem with this approach is that for anydispute, complainants tend to cite a large number ofprovisionswhichhaveallegedlybeenbreached,whilein fact some of the provisions are duplicates orintimately related to other provisions. The GATT, forexample,iscitedinmostdisputesbecauseitincludesthebasicrulesthatapplytotradeingoods.Moreover,even when a complainant brings a dispute under amorespecificagreement,suchastheTBTAgreement,it may also include claims under the GATT, such asunder Article III:4. This means that a simple count ofthenumberofprovisionscitedinthecaseswouldleadtoanover-estimationofthenumberofNTMsthathavebeenchallenged.

II – TRADE AND PUBLIC POLICIES: A CLOSER LOOk AT NON-TARIFF MEASURES IN THE 21ST CENTURY
101
C. A
N IN
VE
NTO
RY
OF N
ON
-TAR
IFF
ME
AS
UR
ES
AN
D S
ER
VIC
ES
ME
AS
UR
ES
Santana and Jackson (2012) proposea methodologytoobtainamorepreciseviewofthetypesofmeasuresthat are the subject of WTO dispute settlement byadjusting for the citation to the GATT in disputeswhere that agreement may have played a secondaryrole. Using this methodology, they have compiled adataset on WTO disputes based largely on thedatabaseof requests for consultationsmaintainedbythe WTO legal division.17 This dataset is not publiclyavailable,butit isconsistentwithadatabaseonWTOdisputes accessible on the World Bank’s website(seebelow). Intheirdataset,JacksonandSantanadonot“doublecount”requestsforconsultationsthatreferto the GATT when the reference is likely to be ofsecondary importance to the main claim of violation(i.e.aspecializedagreementoranotherGATTarticle).Theyhavealsorestrictedcoveragetodisputesrelatedtotrade ingoods.Thiscoversa totalof393disputesout of the 427 filed under the Dispute SettlementUnderstanding(DSU)asof31December2011.
(b) Non-WTOsourcesofinformation
(i) Data collected from official sources
TRAINS and Market Access Map
The most complete collection of publicly availableinformation on non-tariff measures is the TradeAnalysisandInformationSystem(TRAINS)developedby the United Nations Conference on Trade andDevelopment (UNCTAD). UNCTAD started collectingNTM information in 1994 and simultaneouslydeveloped the TRAINS database.18 TRAINS providesinformationontrade,tariffsandNTMsbyHarmonizedSystem(HS)tariffline.NTMswereclassifiedaccordingto a customized Coding System of Trade ControlMeasures, which distinguished six core categories ofNTMs.Thedatabaseincludesbetweenoneandsevenyears of NTM information for 86 countries over theperiod 1992 to 2010. For some countries/years, inparticular after 2001, data were collected only for asub-setofNTMcategories.Varioussourceswereusedto provide data, including, where available, WTOsources such as notifications.19 Overall, the coverageis patchy, resulting in blank cells which are difficultto interpret.Theycansignifymissingdataor indicatethat a particular NTM is not applied to a particulartariffline.
In the early 2000s, it became clear that the TRAINSdatabase required substantial improvement and thatthe Coding System needed an update to reflect newpractices.In2005,theSecretaryGeneralofUNCTADlaunchedaprojectaimedat revamping thedefinition,classification, collection and quantification of non-tariff measures.20 Under the guidance of a Group ofEminent Persons, a multi-agency team composed ofexperts from all international agencies active in theNTM area started working on the project. In 2009,the multi-agency team proposed an updated and
modified version of the old Coding System including16 categories (see Table C.2) which brought theclassification closer to the regulatory framework.21A pilot project on the collection and quantification ofNTMs was carried out by UNCTAD and theInternationalTradeCentre(ITC),withaviewtotestingthe new classification. With the support of two UNregional commissions, UNCTAD and ITC collectedNTM information in seven developing countries.22Basedon the lessons learned in thepilotproject, theupdatedNTMclassificationwasfinalizedandadopted.
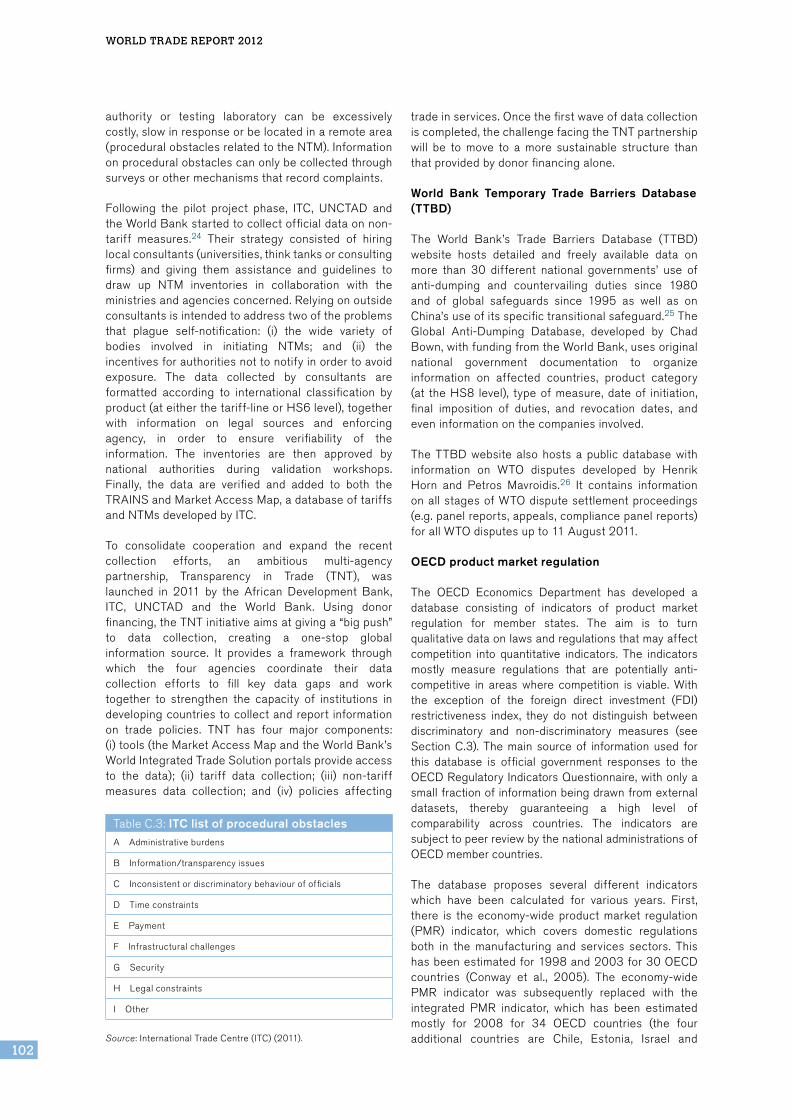
Theupdatedclassificationalsointroducedtheconceptof“proceduralobstacles”,definedas“issuesrelatedtothe process of application of an NTM, rather than tothe measure itself” (United Nations Conference onTrade and Development (UNCTAD), 2010: xvii). Aninitiallistofproceduralobstacleswasestablishedandtested in a series of interviews with exportingcompaniescarriedoutaspartofthepilotproject(seethe discussion of business surveys below).23 On thebasisof lessonslearnedinthepilotproject,theinitiallistofproceduralobstacleswasrevisedandexpanded.
Table C.3 presents the ten broad categories ofproceduralobstacles in the listcurrentlyusedby ITC.The distinction between a non-tariff measure and aprocedural obstacle can sometimes be very subtle,and is best illustrated with an example. To import aproduct, it may be necessary to have a specificcertification (an NTM); however, the certification
TableC.2:International classification of non-tariff measuresA Sanitaryandphytosanitarymeasures
B Technicalbarrierstotrade
C Pre-shipmentinspectionandotherformalities
D Pricecontrolmeasures
E Licences,quotas,prohibitionsandotherquantity controlmeasures
F Charges,taxesandotherpara-tariffmeasures
G Financemeasures
H Anti-competitivemeasures
I Trade-relatedinvestmentmeasures
J Distributionrestrictions*
K Restrictionsonpost-salesservices*
L Subsidies(excludingexportsubsidies)*
M Governmentprocurementrestrictions*
N Intellectualproperty*
O Rulesoforigin*
P Exportrelatedmeasures*
Source: United Nations Conference on Trade and Development(UNCTAD)(2010).
Note: *indicatesthatnoofficial information iscollectedbyUNCTADfor this category which is only used to collect information from theprivatesectorthroughsurveysandwebportals.
World TrAde reporT 2012
102
authority or testing laboratory can be excessivelycostly,slowinresponseorbelocatedinaremotearea(proceduralobstaclesrelatedtotheNTM).Informationonproceduralobstaclescanonlybecollectedthroughsurveysorothermechanismsthatrecordcomplaints.
Following the pilot project phase, ITC, UNCTAD andtheWorldBankstartedtocollectofficialdataonnon-tariff measures.24 Their strategy consisted of hiringlocalconsultants(universities,thinktanksorconsultingfirms) and giving them assistance and guidelines todraw up NTM inventories in collaboration with theministriesandagenciesconcerned.Relyingonoutsideconsultantsisintendedtoaddresstwooftheproblemsthat plague self-notification: (i) the wide variety ofbodies involved in initiating NTMs; and (ii) theincentivesforauthoritiesnottonotifyinordertoavoidexposure. The data collected by consultants areformatted according to international classification byproduct(ateitherthetariff-lineorHS6level),togetherwith information on legal sources and enforcingagency, in order to ensure verifiability of theinformation. The inventories are then approved bynational authorities during validation workshops.Finally, the data are verified and added to both theTRAINSandMarketAccessMap,adatabaseoftariffsandNTMsdevelopedbyITC.
To consolidate cooperation and expand the recentcollection efforts, an ambitious multi-agencypartnership, Transparency in Trade (TNT), waslaunched in 2011 by the African Development Bank,ITC, UNCTAD and the World Bank. Using donorfinancing,theTNTinitiativeaimsatgivinga“bigpush”to data collection, creating a one-stop globalinformation source. It provides a framework throughwhich the four agencies coordinate their datacollection efforts to fill key data gaps and worktogether to strengthen the capacity of institutions indevelopingcountriestocollectandreport informationon trade policies. TNT has four major components:(i)tools(theMarketAccessMapandtheWorldBank’sWorldIntegratedTradeSolutionportalsprovideaccessto the data); (ii) tariff data collection; (iii) non-tariffmeasures data collection; and (iv) policies affecting
tradeinservices.Oncethefirstwaveofdatacollectioniscompleted,thechallengefacingtheTNTpartnershipwill be to move to a more sustainable structure thanthatprovidedbydonorfinancingalone.
World Bank Temporary Trade Barriers Database (TTBD)
The World Bank’s Trade Barriers Database (TTBD)website hosts detailed and freely available data onmore than 30 different national governments’ use ofanti-dumping and countervailing duties since 1980and of global safeguards since 1995 as well as onChina’suseofitsspecifictransitionalsafeguard.25TheGlobal Anti-Dumping Database, developed by ChadBown,withfundingfromtheWorldBank,usesoriginalnational government documentation to organizeinformation on affected countries, product category(at theHS8 level), typeofmeasure,dateof initiation,final imposition of duties, and revocation dates, andeveninformationonthecompaniesinvolved.
TheTTBD website also hosts a public database withinformation on WTO disputes developed by HenrikHorn and Petros Mavroidis.26 It contains informationonallstagesofWTOdisputesettlementproceedings(e.g.panelreports,appeals,compliancepanelreports)forallWTOdisputesupto11August2011.
OECD product market regulation
The OECD Economics Department has developed adatabase consisting of indicators of product marketregulation for member states. The aim is to turnqualitativedataonlawsandregulationsthatmayaffectcompetition into quantitative indicators. The indicatorsmostly measure regulations that are potentially anti-competitive in areas where competition is viable. Withthe exception of the foreign direct investment (FDI)restrictiveness index, they do not distinguish betweendiscriminatory and non-discriminatory measures (seeSectionC.3). Themain sourceof informationused forthis database is official government responses to theOECDRegulatoryIndicatorsQuestionnaire,withonlyasmallfractionofinformationbeingdrawnfromexternaldatasets, thereby guaranteeing a high level ofcomparability across countries. The indicators aresubjecttopeerreviewbythenationaladministrationsofOECDmembercountries.
The database proposes several different indicatorswhich have been calculated for various years. First,there is the economy-wide product market regulation(PMR) indicator, which covers domestic regulationsboth in the manufacturing and services sectors. Thishasbeenestimatedfor1998and2003for30OECDcountries (Conway et al., 2005). The economy-widePMR indicator was subsequently replaced with theintegrated PMR indicator, which has been estimatedmostly for 2008 for 34 OECD countries (the fouradditional countries are Chile, Estonia, Israel and
TableC.3:ITC list of procedural obstaclesA Administrativeburdens
B Information/transparencyissues
C Inconsistentordiscriminatorybehaviourofofficials
D Timeconstraints
E Payment
F Infrastructuralchallenges
G Security
H Legalconstraints
I Other
Source:InternationalTradeCentre(ITC)(2011).
II – TRADE AND PUBLIC POLICIES: A CLOSER LOOk AT NON-TARIFF MEASURES IN THE 21ST CENTURY
103
C. A
N IN
VE
NTO
RY
OF N
ON
-TAR
IFF
ME
AS
UR
ES
AN
D S
ER
VIC
ES
ME
AS
UR
ES
Slovenia)aswellasforBrazil,China, India, Indonesia,Russia and South Africa (Wölfl et al., 2009). Theintegrated PMR indicator covers general regulatoryissues in fields such as public control and pricecontrols, legal and administrative barriers to marketentry, and barriers to trade and investment. It alsocovers some industry-specific regulatory policies,notably in air and rail passenger transport, rail androadfreight,telecommunicationsandretaildistribution.
Secondly,inparallelwiththePMRindicator,theOECDhas developed a set of indicators covering regulationin specific sectors or specific aspects of regulation.Thesectoralindicatorscoverthreenon-manufacturingsectors, and in particular network industries such asenergy(electricityandgas),transport(air,railandroadtransport), and communication (post andtelecommunications) as well as retail trade andprofessional services (Conway and Nicoletti, 2006).The energy, transport and communications (ETC)regulationindicatorcoversmeasuresaffectingmarketentry and public ownership plus vertical integrationandmarketstructure,butonlyinasubsetofthesevenindustries.The retaildistribution indicatorcovers fourentry regulations (registration, licences and permits,largeoutletrestrictions,andprotectionofincumbents)andtwoconductregulations(shopopeninghoursandprice controls). Finally, the professional servicesindicator covers three market entry and four conductregulations.TheFDI (regulatory) restrictiveness indexcovers four types of measures: (i) foreign equityrestrictions; (ii) screening and prior approvalrequirements; (iii) rules for key personnel; and(iv) other restrictions on the operation of foreignenterprises (Kalinovaetal.,2010).The latest revisionof the index covers these four typesofmeasures forall primary sectors (agriculture, forestry, fishing andmining),investmentsinrealestate,fivemanufacturingsub-sectors and eight services sectors. The FDIrestrictiveness indicator is available for 1997, 2003,2006and2010for48countries.
Comparedwithotherindicatorsofservicesmeasures,thefamilyofOECDregulationindicatorshasanumberof advantages. First, the information summarized bythe indicators is “objective”, in the sense that it isbased on rules, regulations and market conditionsrather thanonperceptionscaptured throughsurveys.Secondly, these indicators provide the broadestcoverage of sectors and areas, and the longest timeseries currently available to compare product marketregulation across countries. As discussed in moredetailinSectionC.3,thePMRindicatorscoverawidearrayofmeasures relevant to theservicessectorbutthey do not match the GATS categories of measures(marketaccessandnationaltreatmentlimitations;anddomesticregulation).Moreover,theyareonlyavailableforarelativelysmallgroupofmostlyrichcountries.27
(ii) Business concerns
Most of the sources discussed so far are sources ofofficial information, whether notified to the WTO orcollected from governmental sources. Officialinformationhasanumberofdistinctadvantages.First,it isgenerallyreliable. Itcanbelinkedbacktoa legaltextand,at least for theWTOsources, it isapprovedbygovernments.Secondly,inmostcasesitiscollectedin a systematic way.28 However, it also has a fewdisadvantages,foremostamongthemthatthedataaregenerated/reported by the countries imposing thenon-tariff measures. Some of these countries maywant toavoidattractingattention to theiradoptionofnewNTMs,ortheymaysimplynotdeemthemworthyofreporting, inwhichcasethe incidenceofNTMsforindividualcountriesand inaggregatemeasurescouldbeunderstated.Furthermore,whileevidencesuggeststhat how NTMs are applied or administered canbecome a “procedural barrier to trade”, governmentshave absolutely no incentive to document obstaclesrelating to the specific way in which measures areapplied.
Questions relating to procedural obstacles may bebetteraddressedusingbusinesssurveysorinformationonfirms’ownperceptionsof thedifficulties they facedoing business in various markets. Data on exporterperceptions provide a valuable complement to datafromofficialsourcesbecausetheyhelpidentifythosemeasuresthatareperceivedasimpedimentstotrade.Thesesortsofdata,however,reflectfirms’ judgmentsandmaybesubjecttovariousbiases.Businessesmayexaggerateproceduralobstacles–or,onthecontrary,minimize them – depending on the circumstances.They may also be unable to identify the specificpoliciesofconcern,ormaymisidentifythem.Moreover,surveys, because of problems related to sample sizeand self-selection of respondents, do not alwaysguaranteerigorousandsignificantresults.29Similarly,with websites where exporters can file complaints,self-selectionleadstoabiasedstatisticalsample.
Two sources of business data are presented in thissub-section and used in the next sub-section sincetheydealdirectlywithnon-tariffmeasures.Thefirstisa set of 11 business surveys conducted by ITC indeveloping countries. The second is the CoRe NTMs(compilationofreportedNTMs)DatabasecompiledbyMartinezetal.(2009),whichincorporatesinformationfrom the United States Trade Representative’sNational Trade Estimate Reports on Foreign TradeBarriers and the European Union’s Market Access –Trade Barriers database. These two sources give anoverview of barriers faced by firms from two of thelargestdevelopedeconomies.Otherbusinesssurveysfocusingon“easeofdoingbusiness”indicatorsarenotdiscussedhere(eventhoughtheymaycontainrelevantinformation)sincetheyrequiremoreattentiontomakesurethecorrectmeasuresareidentified.30

World TrAde reporT 2012
104
ITC business surveys
Since the end of the pilot project in 2009 (see sub-section 1(b)(i) above), the ITC has carried out large-scalecompanysurveysonnon-tariffmeasuresinmorethanadozendevelopingandleast-developedcountriesonallcontinents.31Thesurveyscoverat least90percent of the total export value of each participatingcountry(excludingmineralsandarms).32Theeconomyis divided into 13 sectors, and all sectors accountingformorethan2percentoftotalexportsareincludedinthesurvey.Bothexportingandimportingcompaniesare covered. The survey methodology involves atwo-stepapproach.
Inthefirststep,companiesthatexperienceburdensomenon-tariff measures are identified through phoneconversationswithallthecompaniesinthesample.Thesecond step then consists of face-to-face interviewswiththecompaniesthatreporteddifficultieswithNTMsinthephoneconversations.Atrainedinterviewerhelpsrespondentsidentifytherelevantregulation,thenatureoftheproblem,theaffectedproducts(six-digit leveloftheHarmonizedSystem),thepartnercountryexportingor importing the product and the country applying theregulation (partner, transit or home country). The ITCdoesnotimplementthesurvey,butguidesandsupportsalocalsurveycompanyandexpertsindoingthis.Uponfinalizing the survey, its results are presented anddiscussed at a dissemination workshop, which bringstogetherallnationalstakeholdersandfostersadialogueonNTMissues.
Compilation of NTMs reported by US and EU exporters
Over the lastdecade, theOfficeofEconomicsof theUnitedStatesInternationalTradeCommission(USITC)has been engaged in compiling a unified databaseusing the EU’s Market Access – Trade BarriersDatabaseand theNationalTradeEstimateReportonForeign Trade Barriers issued by the United StatesTrade Representative (USTR), as well as the WTO’strade policy reviews. The first version of the USITCNTMdatabasedatesbackto2002andisdescribedinManifold (2002) and Donnelly and Manifold (2005).ItwaslaterupdatedbyMartinezetal.(2009).
The EU’s Market Access – Trade Barriers Databaseprovidesasnapshotofnon-tariffbarriersfacedoutsideoftheEUbyexportersfromEUmembers.ItisbasedoncomplaintsregisteredbyEUexportersandprocessedbytheEuropeanCommission.Thedatabasehas32sectorsand seven main categories of measures: tariffs andduties, trade defence instruments, non-tariff barriers,investment-relatedbarriers, intellectual property rights-related barriers, other (export-related) measures andservices-specificmeasures.Eachofthosecategoriesisfurther divided into a number of sub-categories. Non-tariff barriers, for instance, are sub-divided into:registration, documentation and customs; quantitative
restrictions and related measures; competition issues;standards, sanitary and other technical measures;government procurement; subsidies; other non-tariffmeasures; and sanitary and phytosanitary measures.TheUSITCdatabasedoesnot includetariffsandtradedefence instruments and EU data are reclassifiedaccordingtotheUSITCclassification.
TheNationalTradeEstimate(NTE)ReportonForeignTrade Barriers is issued annually by the USTR. ItsprimaryfocusisonforeignbarrierstoUSexports.TheNTE isnotasimplebusinesssurvey. It isbaseduponinformationcompiledwithintheUSTR,theDepartmentofCommerceand theDepartmentofAgricultureandother US government agencies. It is supplementedwith information provided in response to a noticepublished in the Federal Register (the official journalof the US Government), and with information frommembers of the private sector trade advisorycommittees and US embassies abroad. While eachcountry is reviewed in a different way, the discussiontypicallyfocusesonindividualmeasuresbysector.
Global Trade Alert
In 2009, the Centre for Economic Policy Research(CEPR) teamed up with independent researchinstitutes from around the world to create the GlobalTrade Alert (GTA) initiative.33 Their objective was toincrease the information available on state measuresthatmayaffecttradingpartners’commercialinterests,broadly defined as imports, exports, foreigninvestments (including intellectual property), andforeignemployees.CEPRbelievedthatacombinationof peer pressure plus up-to-date, comprehensiveinformation would help avoid the historic mistakes ofprotectionismofpreviouseras. Inaddition to trackinggovernmentmeasurestakenduringthecurrentglobaleconomicdownturn,theGTAprovidesresearchersandgovernmentofficialswithinformationonnewpatternsof state intervention that are problematic from theperspectiveofmaintainingopenborders.
Regional nodes, a network of independent researchinstitutesandtradeexpertsfromallovertheglobe,areresponsible formonitoringstatemeasures introducedintheirownregion(andelsewhere).TheGTAinitiativealsoencourages thirdparties to submitmeasures forscrutiny, and welcomes dialogue with implementingjurisdictions concerning the measures they haveintroduced. The Evaluation Group, consisting of theleaders of the regional nodes and chaired by therepresentative of the network hub (CEPR), isresponsibleforassessingthisinformationanddecidingwhether to publish it on the GTA website. The GTAdoes not confine itself to the measures that arecoveredbytheexistingbodyofWTOagreements.NordoestheinitiativepronounceontheWTOlegalityofameasureorwhetherameasureis“protectionist”.
II – TRADE AND PUBLIC POLICIES: A CLOSER LOOk AT NON-TARIFF MEASURES IN THE 21ST CENTURY
105
C. A
N IN
VE
NTO
RY
OF N
ON
-TAR
IFF
ME
AS
UR
ES
AN
D S
ER
VIC
ES
ME
AS
UR
ES
2. StylizedfactsaboutNTMsrelatedtotradeingoods
Currently available databases on non-tariff measures,despitetheshortcomingsdiscussedabove,canbeusedto address important questions about trade in goods,includingwhether such measures have increased overtime, how important SPS and TBT measures arecompared with other types of NTMs, and how firmsperceive the obstacles they face in internationalmarkets.Thissub-sectionposesseveralsuchquestionsabout NTMs and provides answers in the form ofdescriptive statistics inorder toestablish anumberofstylized facts about NTMs. Only with a reliable setof facts can researchers hope to make progress inaddressingmorefundamentalquestionsaboutNTMs.
(a) Isthereevidenceofanincreasingmedium-tolong-termtrendinNTMs?
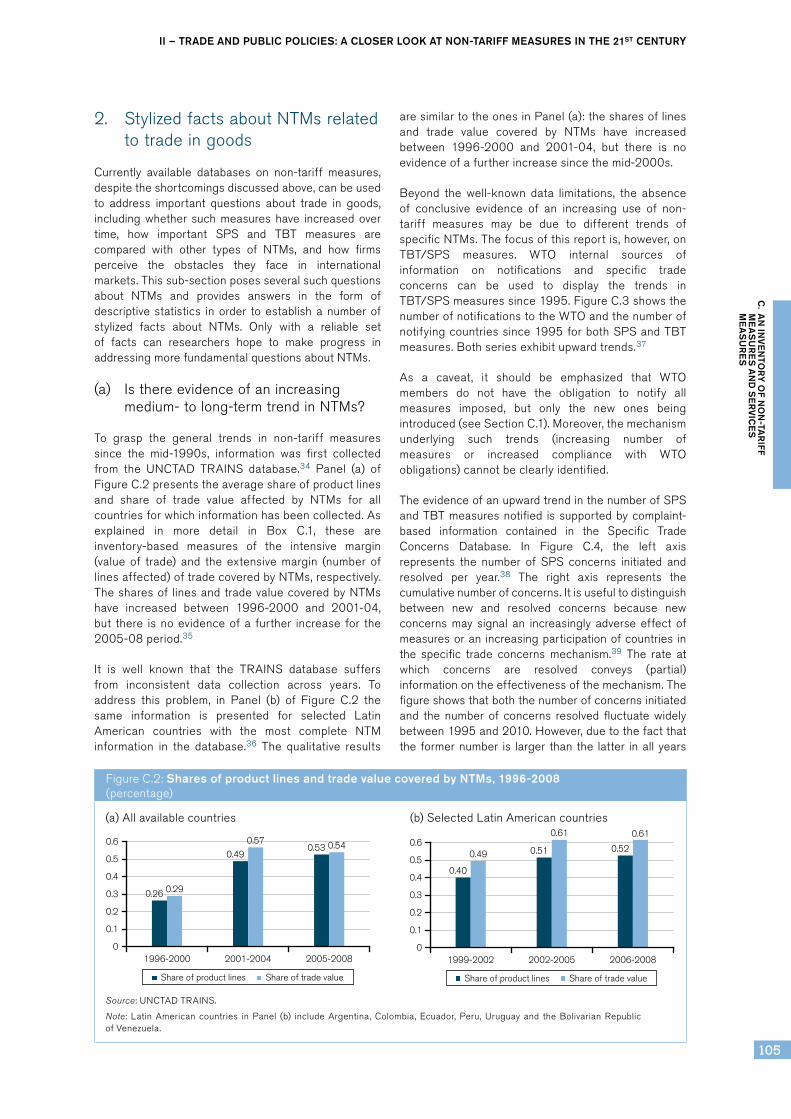
To grasp the general trends in non-tariff measuressince the mid-1990s, information was first collectedfrom the UNCTAD TRAINS database.34 Panel (a) ofFigureC.2presentstheaverageshareofproductlinesand share of trade value affected by NTMs for allcountriesforwhichinformationhasbeencollected.Asexplained in more detail in Box C.1, these areinventory-based measures of the intensive margin(value of trade) and the extensive margin (number oflinesaffected)oftradecoveredbyNTMs,respectively.Thesharesof linesandtradevaluecoveredbyNTMshave increased between 1996-2000 and 2001-04,but there isnoevidenceofa further increase for the2005-08period.35
It is well known that the TRAINS database suffersfrom inconsistent data collection across years. Toaddress this problem, in Panel (b) of Figure C.2 thesame information is presented for selected LatinAmerican countries with the most complete NTMinformation in the database.36 The qualitative results
aresimilartotheonesinPanel(a):thesharesoflinesand trade value covered by NTMs have increasedbetween 1996-2000 and 2001-04, but there is noevidenceofafurtherincreasesincethemid-2000s.
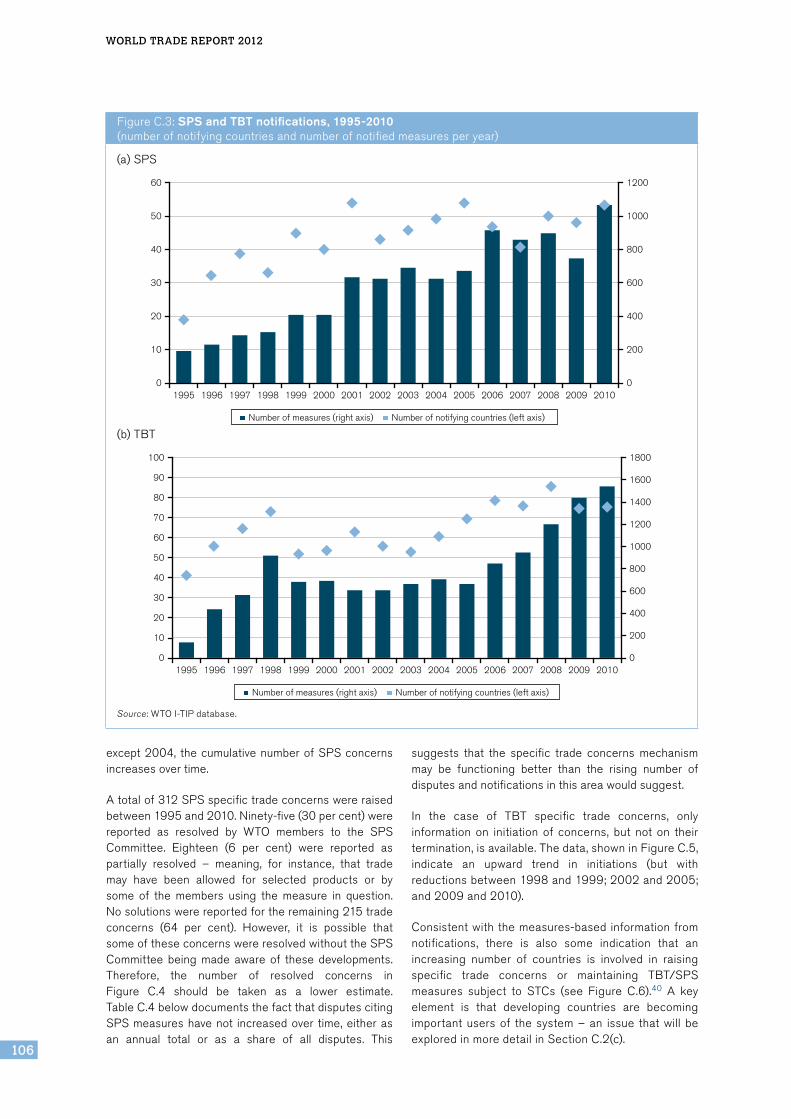
Beyond the well-known data limitations, the absenceof conclusive evidence of an increasing use of non-tariff measures may be due to different trends ofspecificNTMs.Thefocusofthisreportis,however,onTBT/SPS measures. WTO internal sources ofinformation on notifications and specific tradeconcerns can be used to display the trends inTBT/SPSmeasuressince1995.FigureC.3showsthenumberofnotificationstotheWTOandthenumberofnotifyingcountriessince1995forbothSPSandTBTmeasures.Bothseriesexhibitupwardtrends.37
As a caveat, it should be emphasized that WTOmembers do not have the obligation to notify allmeasures imposed, but only the new ones beingintroduced(seeSectionC.1).Moreover,themechanismunderlying such trends (increasing number ofmeasures or increased compliance with WTOobligations)cannotbeclearlyidentified.
TheevidenceofanupwardtrendinthenumberofSPSandTBTmeasuresnotified issupportedbycomplaint-based information contained in the Specific TradeConcerns Database. In Figure C.4, the left axisrepresents the number of SPS concerns initiated andresolved per year.38 The right axis represents thecumulativenumberofconcerns.Itisusefultodistinguishbetween new and resolved concerns because newconcerns may signal an increasingly adverse effect ofmeasuresoran increasingparticipationofcountries inthe specific trade concerns mechanism.39 The rate atwhich concerns are resolved conveys (partial)informationontheeffectivenessofthemechanism.Thefigureshowsthatboththenumberofconcernsinitiatedand the number of concerns resolved fluctuate widelybetween1995and2010.However,duetothefactthatthe formernumber is larger than the latter inall years
FigureC.2:Shares of product lines and trade value covered by NTMs, 1996-2008 (percentage)
1999-2002
0.40
0.49 0.51
0.61
0.52
0.61
2002-2005 2006-2008
0.5
0.6
0.4
0.3
0.2
0.1
0
Share of product lines Share of trade value
1996-2000 2001-2004 2005-2008
0.5
0.6
0.4
0.3
0.2
0.1
0
Share of product lines Share of trade value
0.26 0.29
0.49
0.570.53 0.54
Source:UNCTADTRAINS.
Note: Latin American countries in Panel (b) include Argentina, Colombia, Ecuador, Peru, Uruguay and the Bolivarian RepublicofVenezuela.
(a)Allavailablecountries (b)SelectedLatinAmericancountries
World TrAde reporT 2012
106
FigureC.3:SPS and TBT notifications, 1995-2010 (numberofnotifyingcountriesandnumberofnotifiedmeasuresperyear)
1995 1996 1997 19991998 2000 20022001 2003 2004 20062005 2007 20092008 2010
60
30
40
50
20
10
1200
600
800
1000
400
200
00
Number of notifying countries (left axis)Number of measures (right axis)
1995 1996 1997 19991998 2000 20022001 2003 2004 20062005 2007 20092008 2010
100 1800
601200
70
1400
40800
30600
501000
90
80
1600
20 400
10 200
00
Number of notifying countries (left axis)Number of measures (right axis)
Source:WTOI-TIPdatabase.
(a)SPS
(b)TBT
except2004, thecumulativenumberofSPSconcernsincreasesovertime.
Atotalof312SPSspecifictradeconcernswereraisedbetween1995and2010.Ninety-five(30percent)werereported as resolved by WTO members to the SPSCommittee. Eighteen (6 per cent) were reported aspartially resolved – meaning, for instance, that trademay have been allowed for selected products or bysome of the members using the measure in question.Nosolutionswerereportedfortheremaining215tradeconcerns (64 per cent). However, it is possible thatsomeoftheseconcernswereresolvedwithouttheSPSCommittee being made aware of these developments.Therefore, the number of resolved concerns inFigure C.4 should be taken as a lower estimate.TableC.4belowdocumentsthefactthatdisputescitingSPSmeasureshavenot increasedover time,eitherasan annual total or as a share of all disputes. This
suggests that the specific trade concerns mechanismmay be functioning better than the rising number ofdisputesandnotificationsinthisareawouldsuggest.
In the case of TBT specific trade concerns, onlyinformation on initiation of concerns, but not on theirtermination,isavailable.Thedata,showninFigureC.5,indicate an upward trend in initiations (but withreductionsbetween1998and1999;2002and2005;and2009and2010).
Consistentwiththemeasures-basedinformationfromnotifications, there is also some indication that anincreasing number of countries is involved in raisingspecific trade concerns or maintaining TBT/SPSmeasures subject to STCs (see Figure C.6).40 A keyelement is that developing countries are becomingimportantusersof thesystem–an issue thatwill beexploredinmoredetailinSectionC.2(c).

II – TRADE AND PUBLIC POLICIES: A CLOSER LOOk AT NON-TARIFF MEASURES IN THE 21ST CENTURY
107
C. A
N IN
VE
NTO
RY
OF N
ON
-TAR
IFF
ME
AS
UR
ES
AN
D S
ER
VIC
ES
ME
AS
UR
ES
Because thenumber of “resolved” concerns is basedonanassumption in the caseofTBT, thedescriptivestatistics on TBT are to be interpreted with somecaution.Moreover,nodirectcomparisoncanbemadebetween SPS concerns (upper panel) and TBTconcerns(lowerpanel).
The specific trade concerns data can also provideinformation on the amount of trade affected byTBT/SPS concerns. Firstly, Figure C.7 shows theaverage amount of trade per concern initiated. Thefigure shows that, onaverage, the import valueof aninitiated trade concern has been quite stable since1995, with the exception of two peaks at the end ofeachdecade.InthecaseofSPSconcerns,thepeaksoccurred in 1997-98 and in 2008. As for TBTconcerns,therewasapeakin1999-2000andanothersmalleronein2010.41
Thesepeaksareduetothefilingofconcernsinvolvinga wide set of HS2 lines between two or more majortrading countries. In the case of the SPS peaks,the first is mainly due to two separate concerns, oneon pharmaceutical products raised by the UnitedStates, Switzerland, Brazil, Canada, Australia andothers against the European Union in 1997, andanother on dairy products raised by the EuropeanUnionagainstPolandin1998.TheSPSpeakin2008ismainlyduetoacomplaintbytheUnitedStatesandChina,amongothercountries,againstJapanonmeat,dairyandmostvegetableproducts.
For TBT concerns, the earlier peak is also a “doublepeak” spanning the years 1999 and 2000. In 1999,aTBTconcernwasraisedagainsttheEuropeanUnionbyalargesetofcountries includingtheUnitedStates,China and Japan, involving a wide range of sectors
FigureC.4:New and resolved SPS specific trade concerns, 1995-2010 (numberofconcerns)
FigureC.5:New TBT specific trade concerns, 1995-2010 (numberofconcerns)
1995
Num
ber o
f new
and
reso
lved
con
cern
s
Cum
ulat
ive
num
ber o
f act
ive
conc
erns
1996 1997 19991998 2000 20022001 2003 2004 20062005 2007 20092008 2010
45
25
35
40
30
15
20
10
5
250
150
200
100
50
00
Number of resolved concernsNumber of new concerns Cumulative
20
00
19
99
19
98
19
97
19
96
19
95
20
01
20
02
20
03
20
04
20
05
20
06
20
07
20
08
20
09
20
10
50
25
30
35
40
45
20
15
10
5
0
Source:WTOSTCDatabase.
Source:WTOSTCDatabase.

World TrAde reporT 2012
108
including miscellaneous chemical products, variousmetals,electricalmachineryandtoys.Anotherconcernwas raised in 2000 by the United States, Canada,Japan and others against the European Union onelectrical machinery and instruments. Finally, a TBTpeakin2010wasmainlyduetoaconcernraisedbytheEuropeanUnionagainst theUnitedStates, involvingawidesetofsectors,includingchemicalsandplastics.
Secondly, inventory-based measures of the incidenceofnon-tariffmeasures,namely frequencyandcoverageratios, have been calculated (see Box C.1 formethodology). In this case, too, a specific tradeconcern inTBT is assumed tobe “resolved” if, after itsinitiation, it is not raised again for two years; no directcomparison can be made between SPS concerns (seeFigure C.8(a)) and TBT concerns (see Figure C.8(b)),especiallyontheabsoluteamountoftradecovered.The
general message is, however, that frequency andcoverage ratios are increasing (although not evenly),indicatingthatSPSandTBTmeasuressubjecttospecifictrade concerns are affecting an increasing number ofproductlinesandanincreasingamountoftrade.42
Evidence from disputes on trends in TBT/SPSmeasures is inconclusive. According to Santana andJackson(2012),thenumberofdisputescitingtheSPSandTBTagreementsfellbetween1995and2011,butthedropwasconsistentwiththeoveralldeclineinthenumberofdisputesduringthisperiod(seeTableC.4).Requests for consultations related to SPS measuresfellfrom18in1995-2000tosevenin2007-11,buttheshare of SPS cases in the total number of disputesincreased to 11 per cent from 9 per cent betweenthesetwoperiods.DisputescitingtheTBTAgreementnumbered24intheearlierperiodandjusteightinthe
FigureC.6:Maintaining and raising countries in specific trade concerns, 1995-2010 (numberofcountries)
20
00
19
99
19
98
19
97
19
96
19
95
20
01
20
02
20
03
20
04
20
05
20
06
20
07
20
08
20
09
20
10
40
50
60
30
20
10
0
Raising countriesMaintaining countries
20
00
19
99
19
98
19
97
19
96
19
95
20
01
20
02
20
03
20
04
20
05
20
06
20
07
20
08
20
09
20
10
40
50
60
30
20
10
0
Raising countriesMaintaining countries
Source:WTOI-TIPdatabase.
Note:IntheTBTdataset,aconcernisassumedtobe“resolved”ifnotraisedagainfortwoormoreyears.A“raising”countryistheonewhichcomplainsaboutaTBT/SPSmeasureimposedbya“maintaining”countryintherelevantWTOcommittee.
(a)SPS
(b)TBT

II – TRADE AND PUBLIC POLICIES: A CLOSER LOOk AT NON-TARIFF MEASURES IN THE 21ST CENTURY
109
C. A
N IN
VE
NTO
RY
OF N
ON
-TAR
IFF
ME
AS
UR
ES
AN
D S
ER
VIC
ES
ME
AS
UR
ES
FigureC.7:Average value of initiated SPS and TBT concerns, 1995-2010 (US$billion)
20
00
19
99
19
98
19
97
19
96
19
95
20
01
20
02
20
03
20
04
20
05
20
06
20
07
20
08
20
09
20
10
1.5
2 40
35
30
25
20
15
10
5
0
1
0.5
0
Average import value per new TBT concern (right axis)
Average import value per new SPS concern (left axis)
Source:WTOSTCDatabase.
FigureC.8:Coverage ratio and frequency index of STCs aggregated by year, 1995-2010
20
00
19
99
19
98
19
97
19
96
19
95
20
01
20
02
20
03
20
04
20
05
20
06
20
07
20
08
20
09
20
10
0.07
0.09
0.08
0.05
0.06
0.02
0.03
0.1
0.04
0.01
0
Frequency indexCoverage ratio
20
00
19
99
19
98
19
97
19
96
19
95
20
01
20
02
20
03
20
04
20
05
20
06
20
07
20
08
20
09
20
10
0.02
0.01
0.015
0.025
0.005
0
Frequency indexCoverage ratio
Source:WTOI-TIPdatabase.
Note:IntheTBTdataset,aconcernisassumedtobe“resolved”ifnotraisedagainfortwoormoreyears.
(a)SPS
(b)TBT
World TrAde reporT 2012
110
BoxC.1: Methodology for constructing indices from UNCTAD TRAINS and STC databases
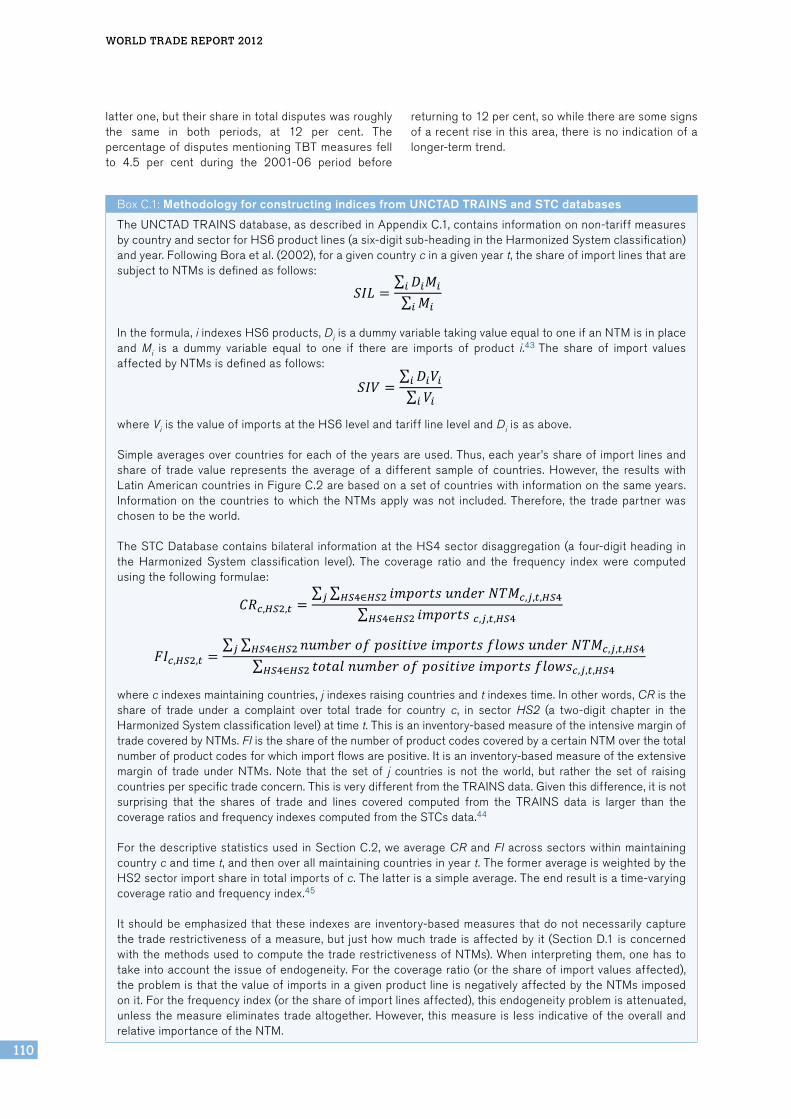
TheUNCTADTRAINSdatabase,asdescribedinAppendixC.1,containsinformationonnon-tariffmeasuresbycountryandsectorforHS6productlines(asix-digitsub-headingintheHarmonizedSystemclassification)andyear.FollowingBoraetal.(2002),foragivencountrycinagivenyeart,theshareofimportlinesthataresubjecttoNTMsisdefinedasfollows:
19
(a) SPS (b) TBT Source: WTO STC Database. Note: In the TBT dataset, a concern is assumed to be “resolved” if not raised again for two or more years. Box C.1: Methodology for constructing indices from UNCTAD TRAINS and STC databases The UNCTAD TRAINS database, as described in Appendix C.1, contains information on non-tariff measures by country and sector for HS6 product lines (a six-digit sub-heading in the Harmonized System classification) and year. Following Bora et al. (2002), for a given country c in a given year t, the share of import lines that are subject to NTMs is defined as follows:
𝑆𝑆𝑆𝑆𝑆𝑆 =𝐷𝐷!𝑀𝑀!!
𝑀𝑀!!
In the formula, i indexes HS6 products, Di is a dummy variable taking value equal to one if an NTM is in place and Mi is a dummy variable equal to one if there are imports of product i.43 The share of import values affected by NTMs is defined as follows:
𝑆𝑆𝑆𝑆𝑆𝑆 =𝐷𝐷!𝑉𝑉!!
𝑉𝑉!!
where Vi is the value of imports at the HS6 level and tariff line level and Di is as above. Simple averages over countries for each of the years are used. Thus, each year’s share of import lines and share of trade value represents the average of a different sample of countries. However, the results with Latin American countries in Figure C.2 are based on a set of countries with information on the same years. Information on the countries to which the NTMs apply was not included. Therefore, the trade partner was chosen to be the world. The STC Database contains bilateral information at the HS4 sector disaggregation (a four-digit heading in the Harmonized System classification level). The coverage ratio and the frequency index were computed using the following formulae:
𝐶𝐶𝐶𝐶!,!"!,! =𝑖𝑖𝑖𝑖𝑖𝑖𝑖𝑖𝑖𝑖𝑖𝑖𝑖𝑖 𝑢𝑢𝑢𝑢𝑢𝑢𝑢𝑢𝑢𝑢 𝑁𝑁𝑁𝑁𝑁𝑁!,!,!,!"!!"!∈!"!!
𝑖𝑖𝑖𝑖𝑖𝑖𝑖𝑖𝑖𝑖𝑖𝑖𝑖𝑖 !,!,!,!"!!"!∈!"!
𝐹𝐹𝐹𝐹!,!"!,! =𝑛𝑛𝑛𝑛𝑛𝑛𝑛𝑛𝑛𝑛𝑛𝑛 𝑜𝑜𝑜𝑜 𝑝𝑝𝑝𝑝𝑝𝑝𝑝𝑝𝑝𝑝𝑝𝑝𝑝𝑝𝑝𝑝 𝑖𝑖𝑖𝑖𝑖𝑖𝑖𝑖𝑖𝑖𝑖𝑖𝑖𝑖 𝑓𝑓𝑓𝑓𝑓𝑓𝑓𝑓𝑓𝑓 𝑢𝑢𝑢𝑢𝑢𝑢𝑢𝑢𝑢𝑢 𝑁𝑁𝑁𝑁𝑁𝑁!,!,!,!"!!"!∈!"!!
𝑡𝑡𝑜𝑜𝑜𝑜𝑜𝑜𝑜𝑜 𝑛𝑛𝑛𝑛𝑛𝑛𝑛𝑛𝑛𝑛𝑛𝑛 𝑜𝑜𝑜𝑜 𝑝𝑝𝑝𝑝𝑝𝑝𝑝𝑝𝑝𝑝𝑝𝑝𝑝𝑝𝑝𝑝 𝑖𝑖𝑖𝑖𝑖𝑖𝑖𝑖𝑖𝑖𝑖𝑖𝑖𝑖 𝑓𝑓𝑓𝑓𝑓𝑓𝑓𝑓𝑓𝑓!,!,!,!"!!"!∈!"!
where c indexes maintaining countries, j indexes raising countries, i indexes HS4 sectors and t indexes time. In other words, CR is the share of trade under a complaint over total trade for country c, in sector HS2 (a two-digit chapter in the Harmonized System classification level) at time t. This is an inventory-based measure of the intensive margin of trade covered by NTMs. FI is the share of the number of product codes covered by a certain NTM over the total number of product codes for which import flows are positive. It is an inventory-based measure of the extensive margin of trade under NTMs. Note that the set of j countries is not the world, but rather the set of raising countries per specific trade concern. This is very different from the TRAINS data. Given this difference, it is not
43 Subscripts c and t are omitted for expositional simplicity.
Intheformula,iindexesHS6products,DiisadummyvariabletakingvalueequaltooneifanNTMisinplaceand Mi is a dummy variable equal to one if there are imports of product i.43 The share of import valuesaffectedbyNTMsisdefinedasfollows:
19
(a) SPS (b) TBT Source: WTO STC Database. Note: In the TBT dataset, a concern is assumed to be “resolved” if not raised again for two or more years. Box C.1: Methodology for constructing indices from UNCTAD TRAINS and STC databases The UNCTAD TRAINS database, as described in Appendix C.1, contains information on non-tariff measures by country and sector for HS6 product lines (a six-digit sub-heading in the Harmonized System classification) and year. Following Bora et al. (2002), for a given country c in a given year t, the share of import lines that are subject to NTMs is defined as follows:
𝑆𝑆𝑆𝑆𝑆𝑆 =𝐷𝐷!𝑀𝑀!!
𝑀𝑀!!
In the formula, i indexes HS6 products, Di is a dummy variable taking value equal to one if an NTM is in place and Mi is a dummy variable equal to one if there are imports of product i.43 The share of import values affected by NTMs is defined as follows:
𝑆𝑆𝑆𝑆𝑆𝑆 =𝐷𝐷!𝑉𝑉!!
𝑉𝑉!!
where Vi is the value of imports at the HS6 level and tariff line level and Di is as above. Simple averages over countries for each of the years are used. Thus, each year’s share of import lines and share of trade value represents the average of a different sample of countries. However, the results with Latin American countries in Figure C.2 are based on a set of countries with information on the same years. Information on the countries to which the NTMs apply was not included. Therefore, the trade partner was chosen to be the world. The STC Database contains bilateral information at the HS4 sector disaggregation (a four-digit heading in the Harmonized System classification level). The coverage ratio and the frequency index were computed using the following formulae:
𝐶𝐶𝐶𝐶!,!"!,! =𝑖𝑖𝑖𝑖𝑖𝑖𝑖𝑖𝑖𝑖𝑖𝑖𝑖𝑖 𝑢𝑢𝑢𝑢𝑢𝑢𝑢𝑢𝑢𝑢 𝑁𝑁𝑁𝑁𝑁𝑁!,!,!,!"!!"!∈!"!!
𝑖𝑖𝑖𝑖𝑖𝑖𝑖𝑖𝑖𝑖𝑖𝑖𝑖𝑖 !,!,!,!"!!"!∈!"!
𝐹𝐹𝐹𝐹!,!"!,! =𝑛𝑛𝑛𝑛𝑛𝑛𝑛𝑛𝑛𝑛𝑛𝑛 𝑜𝑜𝑜𝑜 𝑝𝑝𝑝𝑝𝑝𝑝𝑝𝑝𝑝𝑝𝑝𝑝𝑝𝑝𝑝𝑝 𝑖𝑖𝑖𝑖𝑖𝑖𝑖𝑖𝑖𝑖𝑖𝑖𝑖𝑖 𝑓𝑓𝑓𝑓𝑓𝑓𝑓𝑓𝑓𝑓 𝑢𝑢𝑢𝑢𝑢𝑢𝑢𝑢𝑢𝑢 𝑁𝑁𝑁𝑁𝑁𝑁!,!,!,!"!!"!∈!"!!
𝑡𝑡𝑜𝑜𝑜𝑜𝑜𝑜𝑜𝑜 𝑛𝑛𝑛𝑛𝑛𝑛𝑛𝑛𝑛𝑛𝑛𝑛 𝑜𝑜𝑜𝑜 𝑝𝑝𝑝𝑝𝑝𝑝𝑝𝑝𝑝𝑝𝑝𝑝𝑝𝑝𝑝𝑝 𝑖𝑖𝑖𝑖𝑖𝑖𝑖𝑖𝑖𝑖𝑖𝑖𝑖𝑖 𝑓𝑓𝑓𝑓𝑓𝑓𝑓𝑓𝑓𝑓!,!,!,!"!!"!∈!"!
where c indexes maintaining countries, j indexes raising countries, i indexes HS4 sectors and t indexes time. In other words, CR is the share of trade under a complaint over total trade for country c, in sector HS2 (a two-digit chapter in the Harmonized System classification level) at time t. This is an inventory-based measure of the intensive margin of trade covered by NTMs. FI is the share of the number of product codes covered by a certain NTM over the total number of product codes for which import flows are positive. It is an inventory-based measure of the extensive margin of trade under NTMs. Note that the set of j countries is not the world, but rather the set of raising countries per specific trade concern. This is very different from the TRAINS data. Given this difference, it is not
43 Subscripts c and t are omitted for expositional simplicity.
whereViisthevalueofimportsattheHS6levelandtarifflinelevelandDiisasabove.
Simpleaveragesovercountriesforeachoftheyearsareused.Thus,eachyear’sshareofimportlinesandshare of trade value represents the average of a different sample of countries. However, the results withLatinAmericancountriesinFigureC.2arebasedonasetofcountrieswithinformationonthesameyears.Informationon thecountries towhich theNTMsapplywasnot included.Therefore, the tradepartnerwaschosentobetheworld.
TheSTCDatabasecontainsbilateral informationattheHS4sectordisaggregation(afour-digitheading inthe Harmonized System classification level). The coverage ratio and the frequency index were computedusingthefollowingformulae:
19
(a) SPS (b) TBT Source: WTO STC Database. Note: In the TBT dataset, a concern is assumed to be “resolved” if not raised again for two or more years. Box C.1: Methodology for constructing indices from UNCTAD TRAINS and STC databases The UNCTAD TRAINS database, as described in Appendix C.1, contains information on non-tariff measures by country and sector for HS6 product lines (a six-digit sub-heading in the Harmonized System classification) and year. Following Bora et al. (2002), for a given country c in a given year t, the share of import lines that are subject to NTMs is defined as follows:
𝑆𝑆𝑆𝑆𝑆𝑆 =𝐷𝐷!𝑀𝑀!!
𝑀𝑀!!
In the formula, i indexes HS6 products, Di is a dummy variable taking value equal to one if an NTM is in place and Mi is a dummy variable equal to one if there are imports of product i.43 The share of import values affected by NTMs is defined as follows:
𝑆𝑆𝑆𝑆𝑆𝑆 =𝐷𝐷!𝑉𝑉!!
𝑉𝑉!!
where Vi is the value of imports at the HS6 level and tariff line level and Di is as above. Simple averages over countries for each of the years are used. Thus, each year’s share of import lines and share of trade value represents the average of a different sample of countries. However, the results with Latin American countries in Figure C.2 are based on a set of countries with information on the same years. Information on the countries to which the NTMs apply was not included. Therefore, the trade partner was chosen to be the world. The STC Database contains bilateral information at the HS4 sector disaggregation (a four-digit heading in the Harmonized System classification level). The coverage ratio and the frequency index were computed using the following formulae:
𝐶𝐶𝐶𝐶!,!"!,! =𝑖𝑖𝑖𝑖𝑖𝑖𝑖𝑖𝑖𝑖𝑖𝑖𝑖𝑖 𝑢𝑢𝑢𝑢𝑢𝑢𝑢𝑢𝑢𝑢 𝑁𝑁𝑁𝑁𝑁𝑁!,!,!,!"!!"!∈!"!!
𝑖𝑖𝑖𝑖𝑖𝑖𝑖𝑖𝑖𝑖𝑖𝑖𝑖𝑖 !,!,!,!"!!"!∈!"!
𝐹𝐹𝐹𝐹!,!"!,! =𝑛𝑛𝑛𝑛𝑛𝑛𝑛𝑛𝑛𝑛𝑛𝑛 𝑜𝑜𝑜𝑜 𝑝𝑝𝑝𝑝𝑝𝑝𝑝𝑝𝑝𝑝𝑝𝑝𝑝𝑝𝑝𝑝 𝑖𝑖𝑖𝑖𝑖𝑖𝑖𝑖𝑖𝑖𝑖𝑖𝑖𝑖 𝑓𝑓𝑓𝑓𝑓𝑓𝑓𝑓𝑓𝑓 𝑢𝑢𝑢𝑢𝑢𝑢𝑢𝑢𝑢𝑢 𝑁𝑁𝑁𝑁𝑁𝑁!,!,!,!"!!"!∈!"!!
𝑡𝑡𝑜𝑜𝑜𝑜𝑜𝑜𝑜𝑜 𝑛𝑛𝑛𝑛𝑛𝑛𝑛𝑛𝑛𝑛𝑛𝑛 𝑜𝑜𝑜𝑜 𝑝𝑝𝑝𝑝𝑝𝑝𝑝𝑝𝑝𝑝𝑝𝑝𝑝𝑝𝑝𝑝 𝑖𝑖𝑖𝑖𝑖𝑖𝑖𝑖𝑖𝑖𝑖𝑖𝑖𝑖 𝑓𝑓𝑓𝑓𝑓𝑓𝑓𝑓𝑓𝑓!,!,!,!"!!"!∈!"!
where c indexes maintaining countries, j indexes raising countries, i indexes HS4 sectors and t indexes time. In other words, CR is the share of trade under a complaint over total trade for country c, in sector HS2 (a two-digit chapter in the Harmonized System classification level) at time t. This is an inventory-based measure of the intensive margin of trade covered by NTMs. FI is the share of the number of product codes covered by a certain NTM over the total number of product codes for which import flows are positive. It is an inventory-based measure of the extensive margin of trade under NTMs. Note that the set of j countries is not the world, but rather the set of raising countries per specific trade concern. This is very different from the TRAINS data. Given this difference, it is not
43 Subscripts c and t are omitted for expositional simplicity.
wherecindexesmaintainingcountries,jindexesraisingcountriesand tindexestime.Inotherwords,CRistheshare of trade under a complaint over total trade for country c, in sector HS2 (a two-digit chapter in theHarmonizedSystemclassificationlevel)attimet.Thisisaninventory-basedmeasureoftheintensivemarginoftradecoveredbyNTMs.FIistheshareofthenumberofproductcodescoveredbyacertainNTMoverthetotalnumberofproductcodesforwhichimportflowsarepositive.Itisaninventory-basedmeasureoftheextensivemargin of trade under NTMs. Note that the set of j countries is not the world, but rather the set of raisingcountriesperspecifictradeconcern.ThisisverydifferentfromtheTRAINSdata.Giventhisdifference,itisnotsurprising that the shares of trade and lines covered computed from the TRAINS data is larger than thecoverageratiosandfrequencyindexescomputedfromtheSTCsdata.44
ForthedescriptivestatisticsusedinSectionC.2,weaverageCRandFIacrosssectorswithinmaintainingcountrycandtimet,andthenoverallmaintainingcountriesinyeart.TheformeraverageisweightedbytheHS2sectorimportshareintotalimportsofc.Thelatterisasimpleaverage.Theendresultisatime-varyingcoverageratioandfrequencyindex.45
Itshouldbeemphasized that these indexesare inventory-basedmeasures thatdonotnecessarilycapturethetraderestrictivenessofameasure,but justhowmuchtradeisaffectedbyit(SectionD.1isconcernedwiththemethodsusedtocomputethetraderestrictivenessofNTMs).Wheninterpretingthem,onehastotakeintoaccounttheissueofendogeneity.Forthecoverageratio(ortheshareofimportvaluesaffected),theproblemisthatthevalueofimportsinagivenproductlineisnegativelyaffectedbytheNTMsimposedonit.Forthefrequencyindex(ortheshareofimportlinesaffected),thisendogeneityproblemisattenuated,unlessthemeasureeliminatestradealtogether.However, thismeasure is less indicativeof theoverallandrelativeimportanceoftheNTM.
latterone,buttheirshareintotaldisputeswasroughlythe same in both periods, at 12 per cent. ThepercentageofdisputesmentioningTBTmeasuresfellto 4.5 per cent during the 2001-06 period before
returningto12percent,sowhiletherearesomesignsofarecentriseinthisarea,thereisnoindicationofalonger-termtrend.

II – TRADE AND PUBLIC POLICIES: A CLOSER LOOk AT NON-TARIFF MEASURES IN THE 21ST CENTURY
111
C. A
N IN
VE
NTO
RY
OF N
ON
-TAR
IFF
ME
AS
UR
ES
AN
D S
ER
VIC
ES
ME
AS
UR
ES
(b) AreTBT/SPSmeasuresmoreprevalentthanothertypesofnon-tariffmeasures?
(i) Evidence from official sources
RecentanalysisbytheUnitedNationsConferenceonTrade and Development (UNCTAD) (2012), usingnewly collected data on non-tariff measures in30developingcountriesplustheEuropeanUnionandJapan suggests a significant prevalence of TBT andSPSmeasuresoverotherNTMs.Together, theycovermoreproductsand trade value than “hardmeasures”,such as price and quantity control measures. Thisanalysis, using the new classification of NTMsdiscussed in Section C.1, includes separate sub-categories allowing TBT and SPS measures to bedistinguished.Theformeraremoreprevalentthanthelatter – a fact that is in line with the descriptiveevidence on the number of measures notified to theWTO (see Figure C.3). In particular, the averagecountry imposesTBTmeasuresonabout30percentof products and trade and SPS measures on about15percentofproductsandtrade.46
(ii) Evidence from business surveys
The ITCbusinesssurveysprovide furtherevidenceofthepredominanceofTBT/SPSmeasuresinnon-tariffmeasures, or at least in those NTMs perceived asburdensome by firms in the 11 developing and least-developed countries where surveys have beenconducted.Thedataclassificationusedinthesurveysis similar but not identical to the multi-agencyclassificationoutlinedinTableC.2andTableC.3.TBTand SPS measures are not shown separately in theITCsurveysduetothedifficultyofdistinguishingthesemeasures from survey responses, but taken together
they correspond to the sum of the categories“technicalrequirements”and“conformityassessment”.ReportsofburdensomeNTMs includebothmeasuresappliedbyimportingcountriesandmeasuresimposedby the home country. The former are referred to as“import-related measures” while the latter areclassifiedas“export-relatedmeasures”.
FigureC.9showsthebreakdownofreportednon-tariffmeasures by type of measure averaged over the11 countries surveyed to date. Since some countriesare larger than others, a simple average (i.e. thearithmetic mean) may give undue weight to smallercountries at the expense of larger ones. However,using a trade-weighted average (taking the value ofeach country’s exports in 2010 as weights) does notappeartohaveamajorimpactonshares.
Theshareoftechnicalrequirementsintotalnon-tariffmeasures is somewhat smaller when the simpleaverage is used (17 per cent) than when the trade-weightedaverageisused(23percent),butthereverseis true for conformity assessment (31 per centcompared with 24 per cent). The sum of thesetwo categories is roughly the same in either case(around 48 per cent), which means that TBT/SPSmeasurescomprisenearly half of allNTMs, includingexport-relatedmeasures.Theirshareinimport-relatedmeasures is even higher at around 64 per cent,regardless of the weighting structure. Of all“challenging”NTMsreportedbyexportingcompanies,about75percentareappliedbypartnercountriesand25percentbyhomecountries.Around10percentoffirms reportanegative impacton theirbusiness fromrules of origin, whereas other measures are seen aslesschallenging.
TableC.4:Agreements cited in disputes related to trade in goods, 1995-2011 (percentageandnumber)
1995-2000 2001-2006 2007-2011 1995-2011
Anti-dumping 16.0 29.1 29.2 22.6
Agriculture 19.1 14.9 13.8 16.8
Textilesandclothing 7.7 0.7 0.0 4.1
Customsvaluation 4.6 2.2 4.6 3.8
GATT(adjusted)a 55.7 59.0 53.8 56.5
Governmentprocurement 2.1 0.0 0.0 1.0
Importlicensing 13.4 6.0 1.5 8.9
Rulesoforigin 1.5 1.5 3.1 1.8
Subsidiesandcountervailingmeasures 19.6 25.4 24.6 22.4
Safeguards 6.2 17.2 6.2 9.9
Sanitaryandphytosanitarymeasures 9.3 9.0 10.8 9.4
Technicalbarrierstotrade 12.4 6.0 12.3 10.2
Trade-relatedinvestmentmeasures 8.2 4.5 6.2 6.6
Total number of disputes in goods 194 134 65 393
Source:WTOSecretariatestimates.
Note:Although therewere427 requests forconsultationsfiledunder theDisputeSettlementUnderstandingasof31December2011, thistablefocuseson393disputes ingoods, i.e. itexcludes25disputeswithclaimsmainly involvingTRIPSandninedisputeswithclaimsmainlyinvolvingtheGATS.aThistablefollowsthemethodologyofSantanaandJackson(2012)toeliminateduplicatecitationsoftheGATT.

World TrAde reporT 2012
112
The ITC data can be further broken down by sub-category of non-tariff measures. These are shown inFigure C.10 for TBT/SPS measures (i.e. technicalrequirements plus conformity assessment). Productcertification, which is perceived as burdensome by37per centof reportingfirms, is themost frequentlycited type of measure in this group. It is followed byproduct testing at 9 per cent, and inspectionrequirementat8percent.Together,thesethreeNTMsub-typesareresponsibleformorethanhalfofallfirmcomplaintsaboutTBT/SPSmeasures.
FigureC.9:Burdensome NTMs by type of measure, 2010 (percentage)
Simple averageTechnical requirements 17%
Conformityassessment
31%
Pre-shipmentinspection
5%
Para-tariffmeasures
6%
Quantity controlmeasures 4%
Rules of origin10%
Other import-related
measures 2%
Export-relatedmeasures 25%
Technical requirements 23%
Conformityassessment
24%
Pre-shipmentinspection
4%
Para-tariffmeasures
5%
Quantity controlmeasures 4%
Rules of origin9%
Other import-related
measures 4%
Export-relatedmeasures 27%
Trade-weighted average
Source:ITCbusinesssurveysonNTMs.
Note: Surveys were conducted in 11 developing and least-developed economies: Burkina Faso, Egypt, Jamaica, Kenya,Madagascar, Mauritius, Morocco, Paraguay, Peru, Rwanda andUruguay.Mineralsandarmsareexcludedfromthesurvey.
Complying with product certification requirements inexport markets can entail significant costs forexporting firms. Some recent numerical examples ofthese costs are summarized in Section D, Box D.5.These examples relate to costs confronting firmsexporting from the United States, but productcertification may pose an even greater challenge forexporters located in developing and least-developedeconomies, since they may have fewer financial andinstitutional resources to draw upon than firms indevelopedcountries.
Problems relating to home country certification ofexportsarenearlyasextensiveforfirmsascertificationindestinationcountries,ascanbeseeninFigureC.11.Theexport-relatedmeasuresmostfrequentlycitedbyfirms are certification requirements (26 per cent),export inspection (23 per cent) and obtaining exportlicences/permits (13 per cent). Together, thesethreecategoriesaccountformorethan60percentoffirmcomplaintsaboutexport-relatedmeasures.
AsnotedinSectionC.1,theITCsurveysarebasedoninterviewswithfirms inasmallnumberofdevelopingeconomies, and as a result the responses do notrepresent the concerns and experiences ofbusinesses indevelopedcountries.The three largestdeveloped economies (the United States, theEuropeanUnionandJapan)allcollectdataandissuereports on trade barriers facing their exporters inforeignmarkets, but ingeneral these figuresarenotpublicly available in a format that is amenable toempirical analysis. This situation has been partlyremediedbyresearchersattheUSInternationalTradeCommission,Martinezetal.(2009),whoseCoReNTMdatabase merges business surveys from the UnitedStatesandtheEuropeanUnionwithinformationfromWTOtradepolicyreviewsusingasingle(idiosyncratic)data classification. Figure C.12 makes use of thisdatabase,butitexcludestheWTOfiguresinordertofocus solely on the concerns of developed economyexporters.
Data for the United States are sourced from theUSNationalTradeEstimate(NTE)whilefiguresfortheEuropean Union come from the EU’s Market AccessDatabase. Strictly speaking, the US NTE is not asurvey, but rather a report based on the findings ofseveral US government agencies and embassiesabroad, as well as from private firms. However, thefigures should still provide important insight into theprioritiesofAmericanexporters.
ThetopfiveproblemsfacingUSexportersareimport-relatedmeasures (24percent), investmentmeasures(20percent),standardsandtesting(12percent),SPSmeasures(10percent)andintellectualpropertyrights(9percent).TheleadingconcernsofEUfirmsareSPSmeasures (35 per cent), standards and testing(16 per cent), anti-competitive practices (9 per cent),intellectual property rights (7 per cent) and import-

II – TRADE AND PUBLIC POLICIES: A CLOSER LOOk AT NON-TARIFF MEASURES IN THE 21ST CENTURY
113
C. A
N IN
VE
NTO
RY
OF N
ON
-TAR
IFF
ME
AS
UR
ES
AN
D S
ER
VIC
ES
ME
AS
UR
ES
related measures (6 per cent). The sum of “SPSmeasures”and “standardsand testing” inFigureC.12shouldberoughlyequivalenttoTBT/SPSmeasuresasdefined inSectionA.1.TBT/SPSmeasuresappear tobe a major concern for the European Union,representingmorethanhalf(52percent)ofallissuesreported by EU exporters. However, the equivalentshare for the United States is much lower, at22percent.Reasonsforthisdisparityareunclear,butitcouldbeattributable todifferences inmethodologybetween the US NTE data and the EU’s MarketAccessDatabase.
An important difference between the ITC surveys andthe US/EU reports is the relatively high importanceattached to intellectual property rights by the largedeveloped economies. According to the CoRe NTMdata,intellectualpropertyrightsaccountfor9percentof complaints from US exporters and 7 per cent ofcomplaints from EU firms. On the other hand, just0.3 per cent of firms reporting burdensome NTMs intheITCsurveyscitedintellectualpropertyasaproblem.
The data on disputes in Table C.4 show that requestsfor consultations citing the SPS and TBT agreementsrespectivelyrepresented11percentand12percentofallcasesoverthelastfiveyears.Althoughthesesharesarenotexactlysmall,otheragreementswerecitedmoreoften, including GATT-adjusted (54 per cent), anti-dumping (29 per cent), subsidies/countervailingmeasures (25 per cent) and the Agreement onAgriculture (14 per cent). This could lead one toconclude that firms’ complaints about TBT/SPSmeasuresdonotnecessarilytranslateintogovernmentaction at the level of the multilateral trading system.On theotherhand, it couldalsobe takenasevidencethat the specific trade concern mechanism may beresolving complaints before they develop into fully-fledgedtradedisputes.
(c) IsthereanydifferenceinNTMusebetweendevelopedanddevelopingeconomies?47
TheSTCDatabaseshedslightonthetypeofcountriesmostinvolvedinthemechanism.FigureC.13presents
FigureC.10:TBT/SPS import-related measures by sub-type, 2010 (percentage)
0 5 10 15 20 25 30 35 40
Product certification 37.3
Special authorization due to riskof food-borne disease
Others
Restricted or prohibited useof substances(other than food)
Regulation on GMOs andother foreign species
Product identity requirements
Hygienic practices during production
Importer registration for health,safety, etc.
Restricted or prohibited useof substances in food
Prohibition for health, safety, etc.
Packaging
Authorization requirement for health,safety, etc.
Product registration
Tolerance limits for residuesor contaminants
Product characteristics including quality,performance
Fumigation
Origin of materials and parts
Labelling
Testing
Inspection requirement
8.7
7.9
6.0
4.4
4.1
3.6
3.5
2.9
2.6
2.5
2.5
1.5
1.5
1.2
1.2
1.2
1.2
1.0
5.3
Source:ITCbusinesssurveysonNTMs.
Note:Surveyswereconducted in11developingand least-developedeconomies:BurkinaFaso,Egypt, Jamaica,Kenya,Madagascar,Mauritius,Morocco,Paraguay,Peru,RwandaandUruguay.Mineralsandarmsareexcludedfromthesurvey.

World TrAde reporT 2012
114
thenumberof“maintaining”and“raising”countriesbyincome group, calculated as their share in the totalnumberofcountriesintherespectiveincomegroup.48The results are clear-cut: developed countriesparticipate more in the specific trade concernsmechanism than developing countries. Moreover,
econometric analysis shows that theamountof tradecovered by concerns (coverage ratio and frequencyindex) is higher when the maintaining country isdeveloped than when the maintaining country isdeveloping, both for SPS and for TBT measuressubject to specific trade concerns.49 However, the
FigureC.11:NTMs applied by home country on exports by sub-type, 2010 (percentage)
0 5 10 15 20 25 30
Other export quantitative restrictions
Export price control measures
Export prohibitions
Measures on re-export
Export subsidies
Export quotas
Export registration
Other export related measures
Other technical export measures
Licensing or permit to export
Export taxes and charges
Export inspection
Certification required bythe exporting country 26.1
23.1
12.6
10.0
8.6
7.3
5.5
1.9
3.4
0.5
0.5
0.4
0.1
Source:ITCbusinesssurveysonNTMs.
Note:Surveyswereconducted in11developingand least-developedeconomies:BurkinaFaso,Egypt, Jamaica,Kenya,Madagascar,Mauritius,Morocco,Paraguay,Peru,RwandaandUruguay.Mineralsandarmsareexcludedfromthesurvey.
FigureC.12:Non-tariff measures facing US and EU exporters, 2009 (percentage)
0 5 10 15 20 25 30
State-trading
Taxes
Export-related
Corruption
Customsprocedures
Anti-competitivepractices
Governmentprocurement
SPS measures
Intellectualproperty
Investment-related
Standards,testing, etc.
Import-related 24
20
12
10
9
7
5
5
4
2
1
1
0 5 10 15 20 25 403530
State-trading
Corruption
Export-related
Governmentprocurement
Customsprocedures
Investment-related
Taxes
Intellectualproperty
Import-related
Standards,testing, etc.
Anti-competitivepractices
SPS measures 35
16
9
7
6
6
5
6
4
4
0
0
Source:Martinezetal.(2009).
UnitedStates EuropeanUnion
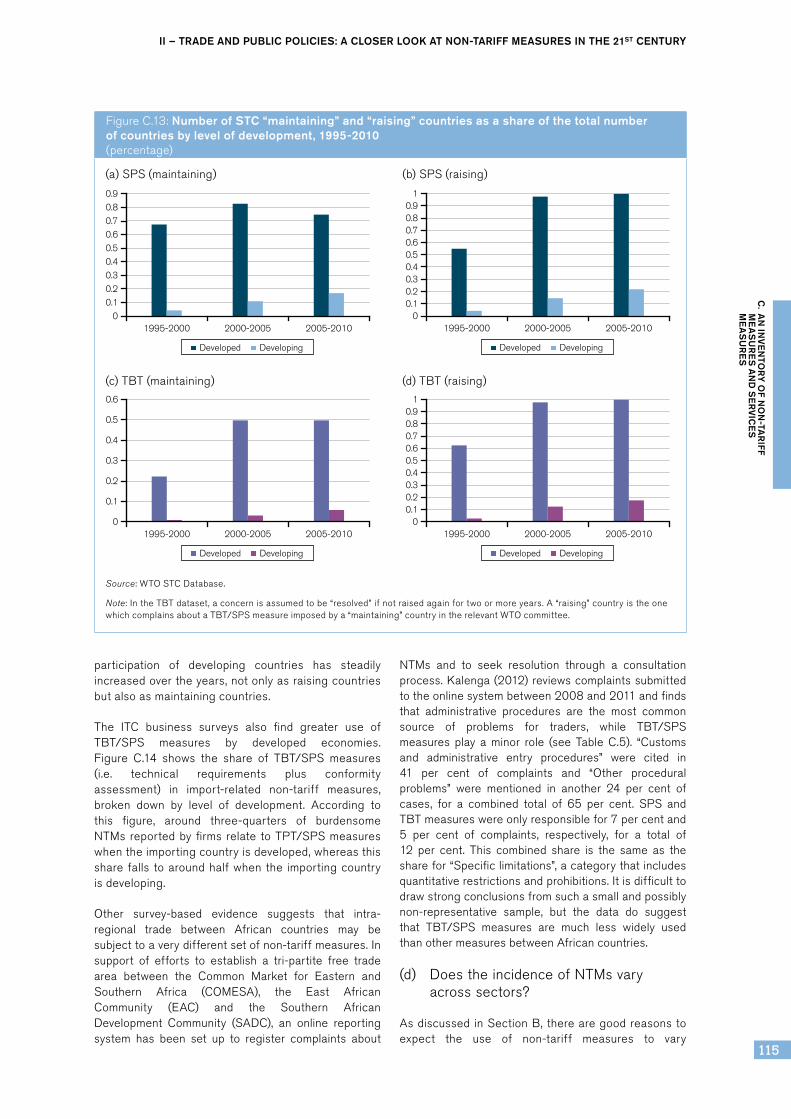
II – TRADE AND PUBLIC POLICIES: A CLOSER LOOk AT NON-TARIFF MEASURES IN THE 21ST CENTURY
115
C. A
N IN
VE
NTO
RY
OF N
ON
-TAR
IFF
ME
AS
UR
ES
AN
D S
ER
VIC
ES
ME
AS
UR
ES
participation of developing countries has steadilyincreasedovertheyears,notonlyasraisingcountriesbutalsoasmaintainingcountries.
The ITC business surveys also find greater use ofTBT/SPS measures by developed economies.Figure C.14 shows the share of TBT/SPS measures(i.e. technical requirements plus conformityassessment) in import-related non-tariff measures,broken down by level of development. According tothis figure, around three-quarters of burdensomeNTMs reportedbyfirms relate toTPT/SPSmeasureswhentheimportingcountryisdeveloped,whereasthisshare falls toaroundhalfwhen the importingcountryisdeveloping.
Other survey-based evidence suggests that intra-regional trade between African countries may besubjecttoaverydifferentsetofnon-tariffmeasures.Insupport of efforts to establish a tri-partite free tradearea between the Common Market for Eastern andSouthern Africa (COMESA), the East AfricanCommunity (EAC) and the Southern AfricanDevelopment Community (SADC), an online reportingsystem has been set up to register complaints about
NTMs and to seek resolution through a consultationprocess.Kalenga(2012)reviewscomplaintssubmittedtotheonlinesystembetween2008and2011andfindsthat administrative procedures are the most commonsource of problems for traders, while TBT/SPSmeasures play a minor role (see Table C.5). “Customsand administrative entry procedures” were cited in41 per cent of complaints and “Other proceduralproblems” were mentioned in another 24 per cent ofcases, for a combined total of 65 per cent. SPS andTBTmeasureswereonlyresponsiblefor7percentand5 per cent of complaints, respectively, for a total of12 per cent. This combined share is the same as thesharefor“Specificlimitations”,acategorythatincludesquantitativerestrictionsandprohibitions.Itisdifficulttodrawstrongconclusionsfromsuchasmallandpossiblynon-representative sample, but the data do suggestthat TBT/SPS measures are much less widely usedthanothermeasuresbetweenAfricancountries.
(d) DoestheincidenceofNTMsvaryacrosssectors?
AsdiscussedinSectionB,therearegoodreasonstoexpect the use of non-tariff measures to vary
FigureC.13:Number of STC “maintaining” and “raising” countries as a share of the total number of countries by level of development, 1995-2010 (percentage)
Source:WTOSTCDatabase.
Note:IntheTBTdataset,aconcernisassumedtobe“resolved”ifnotraisedagainfortwoormoreyears.A“raising”countryistheonewhichcomplainsaboutaTBT/SPSmeasureimposedbya“maintaining”countryintherelevantWTOcommittee.
1995-2000 2000-2005 2005-2010
0.6
0.8
0.5
0.7
0.9
0.4
0.3
0.2
0.1
0
Developed Developing
1995-2000 2000-2005 2005-2010
0.5
0.6
0.4
0.3
0.2
0.1
0
Developed Developing
1995-2000 2000-2005 2005-2010
0.6
0.80.9
0.5
0.7
1
0.40.30.20.1
0
Developed Developing
1995-2000 2000-2005 2005-2010
0.6
0.80.9
0.5
0.7
1
0.40.30.20.1
0
Developed Developing
(a)SPS(maintaining)
(c)TBT(maintaining)
(b)SPS(raising)
(d)TBT(raising)

World TrAde reporT 2012
116
significantly across sectors. Indeed, NTMs appear toaffect certain sectors disproportionately, but theextentoftheimpactissensitivetothewaythatsectorsaredefined.Unfortunately,thereisconsiderablescopefor confusion due to the existence of multiplecompetingstatisticaldefinitions.Forexample,at leastthree definitions of agricultural products are widelyused: the definition from the WTO Agreement onAgriculture (AOA), the definition that appears in theWTO’s statistical publications based on the StandardInternational Trade Classification (SITC), and the first24 chapters of the Harmonized System (HS) tradenomenclature.
The AOA definition is the narrowest as it reflectsnegotiating concerns rather than analyticalrequirements. The SITC-based WTO definition is the
broadest, but it is poorly suited toempirical researchsince tariffsaregenerallydefined in termsof theHSclassification.Chapters1to24oftheHSclassificationrepresent a reasonable compromise between anintuitiveunderstandingofwhatconstitutesagriculturalproductsandanalytical tractability.For this reason, itis adopted as our standard definition, with non-agricultural products defined negatively as all otherproducts. This should not be confused with non-agriculturalproductsasusedinon-agriculturalmarketaccess(NAMA)negotiations,whicharedefinedasallnon-AOA products. The main difference betweenthese definitions is the treatment of fish and fishproducts,whichare taken tobeagricultural productsin this report but are treated as non-agriculturalproductsinAOA/NAMA.NeithertheAOAnortheHSdefinitionincludeswood,whichmaybehighlyrelevanttotheSPSAgreementsincewoodproductshavebeenknown toharbour invasivespecies thatcanbehighlydamagingtotheimportingcountry.50
Using theSTCDatabase,onecangetasenseof thetype of sectors most affected by specific tradeconcerns.Afirstdistinctionisbetweentheagricultureand non-agricultural sectors. Concerns about SPSmeasuresoverwhelminglyaffecttheagriculturesector(251of the267specific tradeconcerns forwhichanHS sector could be identified, that is 94 per cent).51For TBT measures, out of the 283 specific tradeconcerns for which an HS sector could be identified,82 (29 per cent) are in agriculture and 184(65percent)inothersectors.52However,econometricanalysis shows that the coverage ratio and thefrequency index of TBT measures subject to specifictradeconcernsarehigher inagriculturalsectors thannon-agriculturalones.53
For both SPS and TBT measures, frequency indexesandcoverageratiosarelowerinsectorscharacterizedby a higher incidence of intermediate products.54 Asargued in Section B, the theory of trade agreementsunderoffshoringpredictsthat,inthepresenceoftrade
FigureC.14:Burdensome NTMs applied by partner countries by level of development, 2010 (percentage)
Developed Developing
50
60
70
80
90
100
40
30
20
10
0
TBT/SPS All other measures
74.4
25.6
50.6
49.4
Source:ITCbusinesssurveysonNTMs.
Note: Surveys were conducted in 11 developing and least-developed economies: Burkina Faso, Egypt, Jamaica, Kenya,Madagascar, Mauritius, Morocco, Paraguay, Peru, Rwanda andUruguay.Mineralsandarmsareexcludedfromthesurvey.
TableC.5:Complaints about NTMs in COMESA-EAC-SADC, 2008-11 (numberandpercentage)
Number of complaints
Share in total
1:Governmentparticipationintradeandrestrictivepracticestoleratedbygovernments 37 10
2:Customsandadministrativeprocedures 151 41
3:Technicalbarrierstotrade(TBT) 19 5
4:Sanitaryandphytosanitary(SPS)measures 24 7
5:Specificlimitations 43 12
6:Chargesonimports 7 2
7:Otherproceduralproblems 87 24
Total 368 100
Source:COMESA-EAC-SADConlineNTMcomplaintsystem,Kalenga(2012).

II – TRADE AND PUBLIC POLICIES: A CLOSER LOOk AT NON-TARIFF MEASURES IN THE 21ST CENTURY
117
C. A
N IN
VE
NTO
RY
OF N
ON
-TAR
IFF
ME
AS
UR
ES
AN
D S
ER
VIC
ES
ME
AS
UR
ES
in intermediate inputs and bilateral price bargainingbetween foreign suppliers and domestic buyers, thelevel of the behind-the-border non-tax regulatorypolicies applied to foreign exports is set higher thanwouldbeefficient,becauseofrent-shifting(i.e.shiftingprofits from the foreign to the domestic producer)(Staiger,2012).55Theregressionsof the incidenceofTBT/SPS measures on the sectoral share ofintermediateproductsdonotconstitutearigoroustestof the theory of trade agreements under offshoring.Suchatestwouldrequiredetaileddataontheintensityof intermediate products and the amount of bilateralbargaining. However, the result that the amount oftrade covered by specific trade concerns is lower inintermediate-intensive sectors seems to indicate thatmotivationsother thanrent-shiftingmaydrivetheuseof TBT/SPS measures in these sectors (see SectionE.4foradetaileddiscussion).
Evidence that agricultural products aredisproportionately affected by non-tariff measures isechoed in the ITCbusinesssurveysand illustratedbyFigureC.15,whichshowstheincidenceofburdensomeNTMsbysectorofthereportingfirms.56Intotal,about53 per cent of businesses said they were negativelyaffected by NTMs or related obstacles to trade, butthissharewashigherforbusinessesintheagriculturalsector (60percent)and loweramongmanufacturingfirms (51 per cent). These shares were calculated bytaking the simple average over the 11 availablecountriesintheITCsurveys,butthecontrastbetweenagriculture and manufacturing is somewhat strongerwhenaveragesareweightedbyexportsineachsector.Inthiscase,theincidenceofNTMsinagriculturewas63 per cent, whereas it was only 45 per cent formanufacturing.
Notonlyistheincidenceofnon-tariffmeasureshigherin the agricultural sector, but different types of
measures are also used compared with themanufacturing sector. Figure C.16 shows thedistributionofNTMsbytypeofmeasureinagricultureandmanufacturing.Exportersofagriculturalproductsreport more problems related to TBT/SPS measures(i.e. technical requirements plus conformityassessment) than exporters of manufactured goods(59percentfortheformer,34percentforthelatter).Ontheotherhand,pre-shipmentinspection,para-tariffmeasures57 and rules of origin (i.e. laws, regulationsand administrative procedures which determine aproduct’s country of origin) are comparatively more
FigureC.15:Incidence of NTMs by sector, 2010 (percentage)
Total Agriculture Manufacturing
50
60
70
40
30
20
10
0
Simple average Trade weighted average
53.4 51.2
60.1 62.5
50.845.1
Source:ITCbusinesssurveysonNTMs.
Note: Surveys were conducted in 11 developing and least-developed economies: Burkina Faso, Egypt, Jamaica, Kenya,Madagascar, Mauritius, Morocco, Paraguay, Peru, Rwanda andUruguay.Mineralsandarmsareexcludedfromthesurvey.
FigureC.16:Type of NTM by sector, 2010 (percentage)
Para-tariffmeasures 4%
Quantity controlmeasures 3%
Export-relatedmeasures 23%
Quantity controlmeasures 5%
Rules of origin6%
Finance measures 2%
Other import-relatedmeasures 1%
Export-relatedmeasures 23%
Technical requirements 24%
Technical requirements 10%
Conformityassessment
36%
Conformity assessment 24%
Pre-shipmentinspection 3%
Pre-shipment inspection 8%Para-tariff measures 8%
Rules of origin 14%
Agriculture
Manufacturing
Other import-relatedmeasures 2%
Source:ITCbusinesssurveysonNTMs.
Note: Surveys were conducted in 11 developing and least-developed economies: Burkina Faso, Egypt, Jamaica, Kenya,Madagascar, Mauritius, Morocco, Paraguay, Peru, Rwanda andUruguay.Mineralsandarmsareexcludedfromthesurvey.
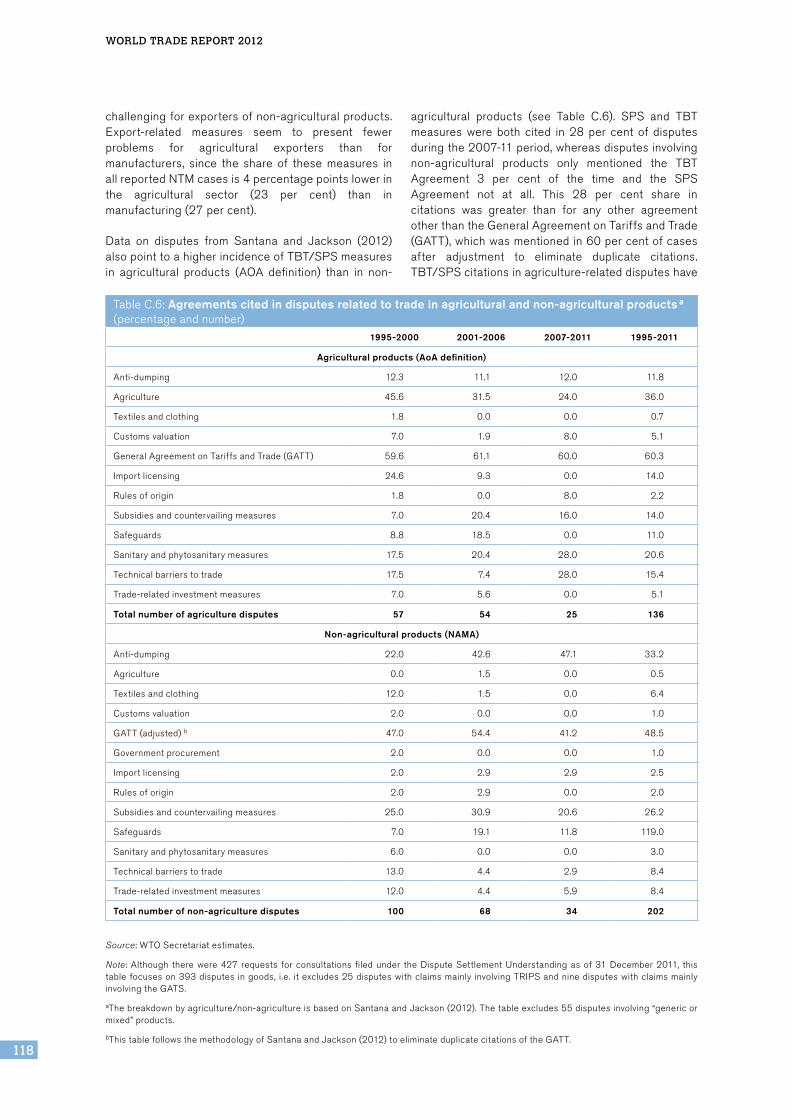
World TrAde reporT 2012
118
challengingforexportersofnon-agriculturalproducts.Export-related measures seem to present fewerproblems for agricultural exporters than formanufacturers, since the share of these measures inallreportedNTMcasesis4percentagepointslowerinthe agricultural sector (23 per cent) than inmanufacturing(27percent).
Data on disputes from Santana and Jackson (2012)alsopointtoahigherincidenceofTBT/SPSmeasuresin agricultural products (AOA definition) than in non-
agricultural products (see Table C.6). SPS and TBTmeasures were both cited in 28 per cent of disputesduringthe2007-11period,whereasdisputesinvolvingnon-agricultural products only mentioned the TBTAgreement 3 per cent of the time and the SPSAgreement not at all. This 28 per cent share incitations was greater than for any other agreementotherthantheGeneralAgreementonTariffsandTrade(GATT),whichwasmentionedin60percentofcasesafter adjustment to eliminate duplicate citations.TBT/SPScitationsinagriculture-relateddisputeshave
Source:WTOSecretariatestimates.
Note:Although therewere427 requests forconsultationsfiledunder theDisputeSettlementUnderstandingasof31December2011, thistablefocuseson393disputes ingoods, i.e. itexcludes25disputeswithclaimsmainly involvingTRIPSandninedisputeswithclaimsmainlyinvolvingtheGATS.
aThebreakdownbyagriculture/non-agricultureisbasedonSantanaandJackson(2012).Thetableexcludes55disputesinvolving“genericormixed”products.
bThistablefollowsthemethodologyofSantanaandJackson(2012)toeliminateduplicatecitationsoftheGATT.
TableC.6: Agreements cited in disputes related to trade in agricultural and non-agricultural productsa (percentageandnumber)
1995-2000 2001-2006 2007-2011 1995-2011
Agricultural products (AoA definition)
Anti-dumping 12.3 11.1 12.0 11.8
Agriculture 45.6 31.5 24.0 36.0
Textilesandclothing 1.8 0.0 0.0 0.7
Customsvaluation 7.0 1.9 8.0 5.1
GeneralAgreementonTariffsandTrade(GATT) 59.6 61.1 60.0 60.3
Importlicensing 24.6 9.3 0.0 14.0
Rulesoforigin 1.8 0.0 8.0 2.2
Subsidiesandcountervailingmeasures 7.0 20.4 16.0 14.0
Safeguards 8.8 18.5 0.0 11.0
Sanitaryandphytosanitarymeasures 17.5 20.4 28.0 20.6
Technicalbarrierstotrade 17.5 7.4 28.0 15.4
Trade-relatedinvestmentmeasures 7.0 5.6 0.0 5.1
Total number of agriculture disputes 57 54 25 136
Non-agricultural products (NAMA)
Anti-dumping 22.0 42.6 47.1 33.2
Agriculture 0.0 1.5 0.0 0.5
Textilesandclothing 12.0 1.5 0.0 6.4
Customsvaluation 2.0 0.0 0.0 1.0
GATT(adjusted)b 47.0 54.4 41.2 48.5
Governmentprocurement 2.0 0.0 0.0 1.0
Importlicensing 2.0 2.9 2.9 2.5
Rulesoforigin 2.0 2.9 0.0 2.0
Subsidiesandcountervailingmeasures 25.0 30.9 20.6 26.2
Safeguards 7.0 19.1 11.8 119.0
Sanitaryandphytosanitarymeasures 6.0 0.0 0.0 3.0
Technicalbarrierstotrade 13.0 4.4 2.9 8.4
Trade-relatedinvestmentmeasures 12.0 4.4 5.9 8.4
Total number of non-agriculture disputes 100 68 34 202

II – TRADE AND PUBLIC POLICIES: A CLOSER LOOk AT NON-TARIFF MEASURES IN THE 21ST CENTURY
119
C. A
N IN
VE
NTO
RY
OF N
ON
-TAR
IFF
ME
AS
UR
ES
AN
D S
ER
VIC
ES
ME
AS
UR
ES
also increased over time, rising from 18 per cent in1995-2001to28percentin2007-11.
(e) WhatkindsofproceduralobstaclesareassociatedwithNTMs?
Non-tariff measures pose many challenges forexporting firms, but more often than not it is themanner of implementation rather than the measureitself that causesproblems for businesses.Asnotedin Section C.1, these implementation issues arereferredtoas“proceduralobstacles”inthenewmulti-agency data classification on NTMs. For example, acountry could have very high standards for importedgoods,makingitdifficultforexporterstocomplywiththese standards. On the other hand, exporters thatmanaged to comply with the regulations might stillhave problems demonstrating their compliance, orelse might face long delays before their goods areadmitted into the importingcountry. In the firstcase,an exporter could perceive the NTM itself to be themain impediment to trade, whereas in the secondcase they might view the procedural obstacle as thesourceoftheirdifficulty.
Inpractice,dataonproceduralobstaclescanonlybecollected through surveys such as the ITC businesssurveys. Figure C.17 shows shares of reported non-tariff measures in the ITC surveys with and withoutprocedural obstacles associated with them. Theaverageshareofproceduralobstaclesis77percentifwe take the simple average over the 11 countrieswhere surveys have been conducted. The use of atrade-weightedaverage reduces this share slightly to72percent.
The types of procedural obstacles that businessesreportareshown inFigureC.18.Themostcommonlymentioned obstacle is “time constraints”, includingdelays related to regulations and short deadlinesfor submitting documentation. This accounts for35 per cent of reported obstacles, followed by“high/informal payments” at 22 per cent, and“administrative burdens” at 17 per cent. There aresmallersharesforotherreportedproceduralobstacles.
The incidence of procedural obstacles varies widelyacross different types of non-tariff measures(see Figure C.19). For example, nearly 80 per cent offirms reporting burdensome conformity assessmentmeasures also encountered procedural obstacles. Ontheotherhand,theincidenceofproceduralobstaclesintechnicalrequirementswasjust55percent.Proceduralobstacleswerereportedlessfrequentlyforgovernmentprocurement restrictions (0 per cent), subsidies (also0 per cent) and price control measures (25 per cent),including anti-dumping and countervailing measures.They occurred most frequently in measures related tointellectual property (100 per cent) and export-relatedmeasures(88percent).
(f) HowhaveNTMsevolvedsincetheglobalfinancialcrisis?
The sharp declines in global trade and output thatfollowedthefinancialcrisisin2008-09raisedfearsofare-runofthe1930s,whenprotectionismexacerbatedand prolonged the Great Depression. Efforts by theWTOandotherstomonitortradepolicydevelopmentsin the aftermath of the crisis initially found that mostcountrieshadmanagedin2009-10toavoidtheworst
FigureC.17:Share of NTMs with and without procedural obstacles, 2010 (percentage)
FigureC.18:Shares of reported procedural obstacles by type, 2010 (percentage)
Simple average Trade-weighted average
50
60
70
80
90
100
40
30
20
10
0
NTM only NTM with PO
23.5
76.5 71.7
28.3
Time constraints 35%
Discriminatorybehaviour
6%
Information ortransparency
issues 5%
Informal orunusually highpayment 22%
Lack offacilities 8%
Recognition,accreditation 1%
Other 2%
Unspecified 4% Technical requirements17%
Source:ITCbusinesssurveysonNTMs.
Note: Surveys were conducted in 11 developing and least-developed economies: Burkina Faso, Egypt, Jamaica, Kenya,Madagascar, Mauritius, Morocco, Paraguay, Peru, Rwanda andUruguay.Mineralsandarmsareexcludedfromthesurvey.
Source:ITCbusinesssurveysonNTMs.
Note: Surveys were conducted in 11 developing and least-developed economies: Burkina Faso, Egypt, Jamaica, Kenya,Madagascar, Mauritius, Morocco, Paraguay, Peru, Rwanda andUruguay.Mineralsandarmsareexcludedfromthesurvey.

World TrAde reporT 2012
120
forms of protectionism, but developments in 2011point to increasing trade friction and a rise in thenumber of restrictive trade measures. To the extentthattradepolicyhasbecomemorerestrictiverecently,itappearsthatmostoftheincreaseisduetonon-tariffmeasures.
TableC.7summarizesevidencefromWTOmonitoringreports since 2008. The number of new restrictivemeasuresrosefrom53in2008to346in2009attheheightofthecrisis.Newrestrictivemeasuresthenfellbackto306in2010butincreasedagainto344inthefirst 10 months of 2011. The number of liberalizingmeasures was slightly greater than the number ofrestrictive ones in 2010, which suggests little or nochange in theoverall level of protectionism that year.However, there was a net increase in the number ofrestrictivemeasuresin2011,asliberalizingactionsfellto304from323inthepreviousyear,whilerestrictiveonesroseto344from306.
Only 8 per cent of restrictive measures introduced in2008 were tariffs, but this share rose to 16 per centin2009,thento20percentin2010beforefallingbackto19percentinthefirsttenmonthsof2011.TableC.7excludesTBTandSPSmeasures,sothetariffshareissomewhat exaggerated. SPS and TBT measures areintentionally not tracked in WTO monitoring reports inorder to avoid having to make any judgment as towhether such measures are justified on public policygrounds.
In the aftermath of the crisis, countries immediatelyresorted to trade “remedies”, such as anti-dumpingactions and countervailing duties, as evidenced by asharp increase in the number of restrictive measuresfrom38 in2008to196 in2009,but this later fell to132in2010andto104in2011.In2010,thenumberofrestrictivetraderemedieswasroughlyequaltothenumber of liberalizing measures, bringing their netcontributiontothestockofrestrictivetrademeasuresclose to zero, while in 2011 liberalizing actionsoutnumberedrestrictiveones.
One notable feature of Table C.7 is the spike in thenumber of restrictive non-tariff measures from 30 in2010 to81 in2011.At thesame time, thenumberofliberalizing NTMs fell from 23 to 13. The recentincrease in restrictive measures is attributable to anumber of developments, including stricter importcontrolsandlicensingrequirementsinsomecountries,as well as import prohibitions imposed on someJapanese goods following the Fukushima nuclearaccident in March 2011. Some of the main countriesimposing the new measures in 2011 were Indonesia,IndiaandArgentina.
EvidencefromtheWTO’smonitoringreports leadsusto conclude that the use of non-tariff measures hasrisen relative to tariffs since the financial crisis,althoughthereareexceptionsfor individualcountries.In every year since 2008, new restrictive non-tariffmeasures have outnumbered liberalizing actions.Meanwhile, thenumberof liberalizing tariffmeasures
FigureC.19:Shares of NTMs with and without procedural obstacles by type of NTM, 2010 (percentage)
0 10 40 50 70 80 100603020 90
Rules of origin
Export-related measures
Government procurement
Intellectual property
Anti-competitive measures
Subsidies
Price control measures
Quantity control measures
Finance measures
Pre-shipment inspection
Para-tariff measures
Conformity assessment
Technical requirements 44.7
20.5
28.9
32.9
28.2
27.5
75.0
100.0
19.4
100.0
100.0
18.8
12.5
55.3
79.5
71.1
67.1
71.8
72.5
25.0
80.6
81.2
87.5
NTM only NTM with PO
Source:ITCbusinesssurveysonNTMs.
Note:Surveyswereconducted in11developingand least-developedeconomies:BurkinaFaso,Egypt, Jamaica,Kenya,Madagascar,Mauritius,Morocco,Paraguay,Peru,RwandaandUruguay.Mineralsandarmsareexcludedfromthesurvey.
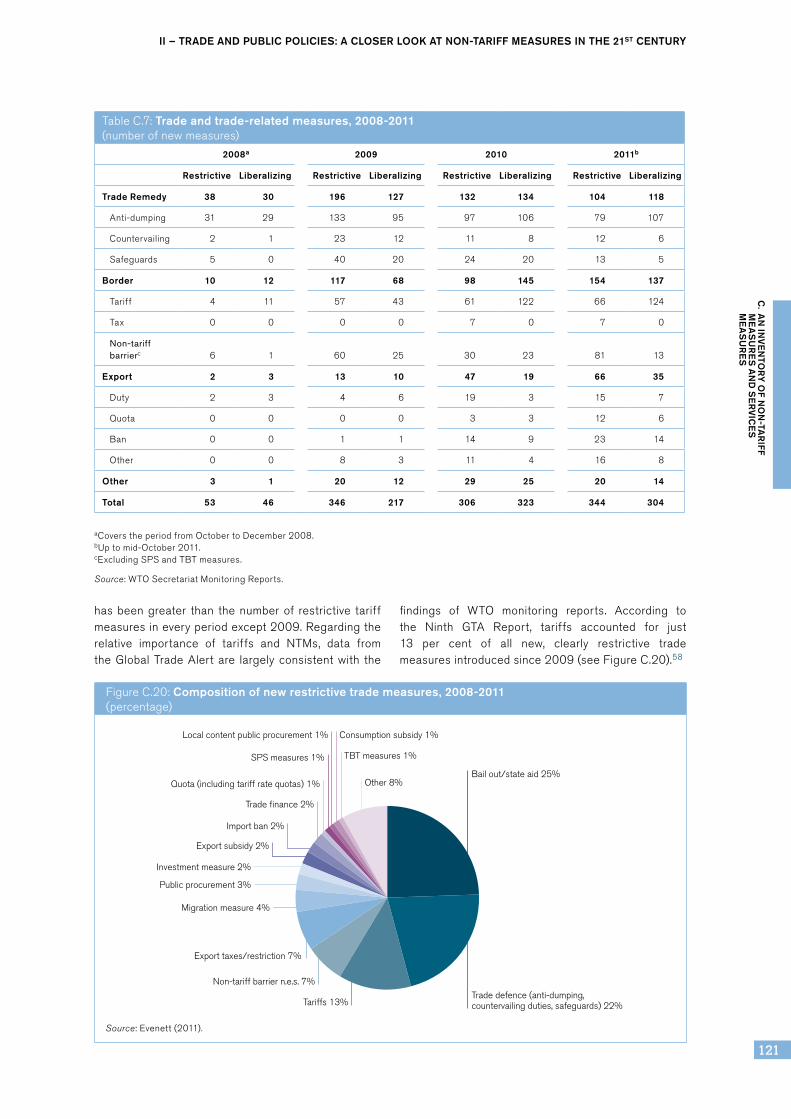
II – TRADE AND PUBLIC POLICIES: A CLOSER LOOk AT NON-TARIFF MEASURES IN THE 21ST CENTURY
121
C. A
N IN
VE
NTO
RY
OF N
ON
-TAR
IFF
ME
AS
UR
ES
AN
D S
ER
VIC
ES
ME
AS
UR
ES
TableC.7: Trade and trade-related measures, 2008-2011 (numberofnewmeasures)
2008a 2009 2010 2011b
Restrictive Liberalizing Restrictive Liberalizing Restrictive Liberalizing Restrictive Liberalizing
Trade Remedy 38 30 196 127 132 134 104 118
Anti-dumping 31 29 133 95 97 106 79 107
Countervailing 2 1 23 12 11 8 12 6
Safeguards 5 0 40 20 24 20 13 5
Border 10 12 117 68 98 145 154 137
Tariff 4 11 57 43 61 122 66 124
Tax 0 0 0 0 7 0 7 0
Non-tariff barrierc 6 1 60 25 30 23 81 13
Export 2 3 13 10 47 19 66 35
Duty 2 3 4 6 19 3 15 7
Quota 0 0 0 0 3 3 12 6
Ban 0 0 1 1 14 9 23 14
Other 0 0 8 3 11 4 16 8
Other 3 1 20 12 29 25 20 14
Total 53 46 346 217 306 323 344 304
aCoverstheperiodfromOctobertoDecember2008.bUptomid-October2011.cExcludingSPSandTBTmeasures.
Source:WTOSecretariatMonitoringReports.
hasbeengreater than thenumberof restrictive tariffmeasuresineveryperiodexcept2009.Regardingtherelative importance of tariffs and NTMs, data fromtheGlobalTradeAlertare largelyconsistentwith the
findings of WTO monitoring reports. According tothe Ninth GTA Report, tariffs accounted for just13 per cent of all new, clearly restrictive trademeasuresintroducedsince2009(seeFigureC.20).58
FigureC.20:Composition of new restrictive trade measures, 2008-2011 (percentage)
Source:Evenett(2011).
Bail out/state aid 25%
Trade defence (anti-dumping, countervailing duties, safeguards) 22%Tariffs 13%
Non-tariff barrier n.e.s. 7%
Investment measure 2%
Export subsidy 2%
Import ban 2%
Export taxes/restriction 7%
Migration measure 4%
Public procurement 3%
Trade finance 2%
Quota (including tariff rate quotas) 1%
SPS measures 1%
Local content public procurement 1% Consumption subsidy 1%
TBT measures 1%
Other 8%
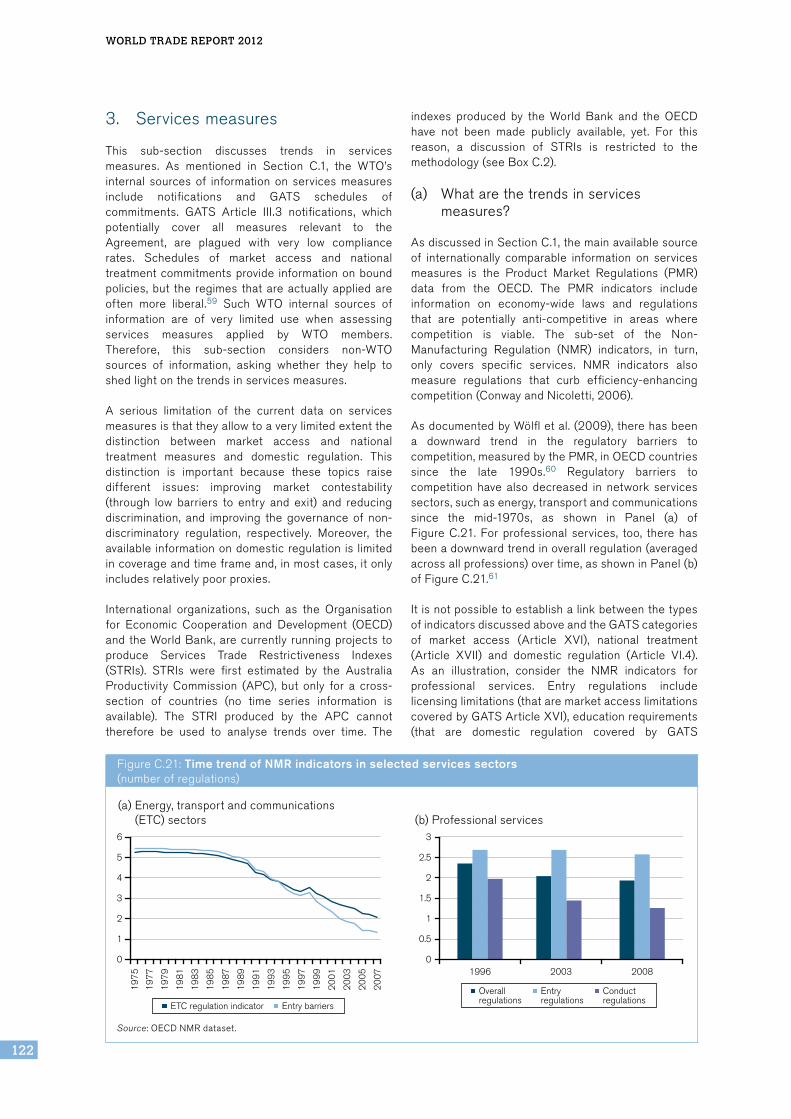
World TrAde reporT 2012
122
3. Servicesmeasures
This sub-section discusses trends in servicesmeasures. As mentioned in Section C.1, the WTO’sinternal sources of information on services measuresinclude notifications and GATS schedules ofcommitments. GATS Article III.3 notifications, whichpotentially cover all measures relevant to theAgreement, are plagued with very low compliancerates. Schedules of market access and nationaltreatmentcommitmentsprovide informationonboundpolicies,but the regimes thatareactuallyappliedareoften more liberal.59 Such WTO internal sources ofinformation are of very limited use when assessingservices measures applied by WTO members.Therefore, this sub-section considers non-WTOsources of information, asking whether they help toshedlightonthetrendsinservicesmeasures.
A serious limitation of the current data on servicesmeasuresisthattheyallowtoaverylimitedextentthedistinction between market access and nationaltreatment measures and domestic regulation. Thisdistinction is important because these topics raisedifferent issues: improving market contestability(through low barriers to entry and exit) and reducingdiscrimination, and improving the governance of non-discriminatory regulation, respectively. Moreover, theavailableinformationondomesticregulationis limitedincoverageandtimeframeand,inmostcases,itonlyincludesrelativelypoorproxies.
International organizations, such as the Organisationfor Economic Cooperation and Development (OECD)andtheWorldBank,arecurrently runningprojects toproduce Services Trade Restrictiveness Indexes(STRIs). STRIs were first estimated by the AustraliaProductivity Commission (APC), but only for a cross-section of countries (no time series information isavailable). The STRI produced by the APC cannottherefore be used to analyse trends over time. The
indexes produced by the World Bank and the OECDhave not been made publicly available, yet. For thisreason, a discussion of STRIs is restricted to themethodology(seeBoxC.2).
(a) Whatarethetrendsinservicesmeasures?
AsdiscussedinSectionC.1,themainavailablesourceof internationally comparable information on servicesmeasures is the Product Market Regulations (PMR)data from the OECD. The PMR indicators includeinformation on economy-wide laws and regulationsthat are potentially anti-competitive in areas wherecompetition is viable. The sub-set of the Non-Manufacturing Regulation (NMR) indicators, in turn,only covers specific services. NMR indicators alsomeasure regulations that curb efficiency-enhancingcompetition(ConwayandNicoletti,2006).
AsdocumentedbyWölfletal.(2009),therehasbeena downward trend in the regulatory barriers tocompetition,measuredbythePMR,inOECDcountriessince the late 1990s.60 Regulatory barriers tocompetition have also decreased in network servicessectors,suchasenergy,transportandcommunicationssince the mid-1970s, as shown in Panel (a) ofFigure C.21. For professional services, too, there hasbeenadownwardtrendinoverallregulation(averagedacrossallprofessions)overtime,asshowninPanel(b)ofFigureC.21.61
ItisnotpossibletoestablishalinkbetweenthetypesofindicatorsdiscussedaboveandtheGATScategoriesof market access (Article XVI), national treatment(Article XVII) and domestic regulation (Article VI.4).As an illustration, consider the NMR indicators forprofessional services. Entry regulations includelicensinglimitations(thataremarketaccesslimitationscoveredbyGATSArticleXVI),educationrequirements(that are domestic regulation covered by GATS
FigureC.21:Time trend of NMR indicators in selected services sectors (numberofregulations)
Source:OECDNMRdataset.
1996 2003 2008
2.5
3
2
1.5
1
0.5
0
Overallregulations
Entryregulations
Conductregulations
19
75
19
77
19
79
19
81
19
83
19
85
19
87
19
89
19
91
19
93
19
95
19
97
19
99
20
01
20
03
20
05
20
07
5
6
4
3
2
1
0
ETC regulation indicator Entry barriers
(a)Energy,transportandcommunications(ETC)sectors (b)Professionalservices

II – TRADE AND PUBLIC POLICIES: A CLOSER LOOk AT NON-TARIFF MEASURES IN THE 21ST CENTURY
123
C. A
N IN
VE
NTO
RY
OF N
ON
-TAR
IFF
ME
AS
UR
ES
AN
D S
ER
VIC
ES
ME
AS
UR
ES
Article VI.4) and quotas/economic needs tests forforeignproviders(thatareatthesametimelimitationstomarketaccessandnational treatment, respectivelycoveredbyGATSArticlesXVIandXVII).Theindicatorfor conduct regulation covers anti-competitiveregulations on prices and fees, advertising, form ofbusiness and inter-professional cooperation. Whileregulationsontheformofbusinessaremarketaccess
limitations covered by GATS Article XVI, the otherregulations are more generally covered by the GATSunder Article I as “measures affecting trade inservices”. A downward trend of product marketregulation in services may reflect a reduction inlimitationstomarketaccessornationaltreatment,butit may also be due to changes in the stringency ofdomesticregulation.
BoxC.2: Trade restrictiveness indexes for services
TheAustralianProductivityCommission(APC)pioneeredtheestimationofaServicesTradeRestrictivenessIndex (STRI) (Findlay and Warren, 2000). The APC compiled information on measures in the 1990s thatpotentially restricted trade in services, covering a wide range of sectors across countries. Most of theinformationwasbasedonthetextsofregulations,butsomesectorsalsoincludeinformationfromoutcomemeasuresandthede facto implementationofregulations.Inconstructingtheindex,theAPCdistinguishedbetweenmeasuresaffectingmarketentry (fixedcosts)and thoseaffecting thepost-entryoperationsofafirm(variablecosts).Withineachcategory,measurescaneitherbenon-discriminatoryordiscriminatory.Forexample,anon-discriminatorymeasureaffectingmarketentrymaylimitthenumberofserviceproviders inthetelecommunicationssectorofagivencountryregardlessofnationality,whereasadiscriminatorymeasurewouldimposenationalquotasforforeignfirmsorceilingsonmaximumforeignequityparticipation.Similarly,anon-discriminatorymeasureaffectingpost-entryoperationsmaystipulate,forinstance,aminimumcapitalrequirement for all insurance firms, whereas a discriminatory measure would entail additional capitalrequirementsforforeignsuppliers(FrancoisandHoekman,2010).
Scoreswereassignedforeachrestrictionbyexpertsonthebasisofajudgementaboutitsstringency.Forinstance, aneconomy that restricts thenumberofbanking licenceswasassignedahigher score thananeconomythatissuesnewbankinglicenceswithonlyprudentialrequirements.Next,thedifferentrestrictionswere combined in a weighted average, once again according to an expert value judgement about theirrelative economic cost. For example, restrictions on banking licences were assigned larger weights thanrestrictions on the temporary movement of people. The weights were chosen so that the resultingrestrictiveness index score ranges from zero to one. De facto, the trade restrictiveness index for eacheconomycomprisestwoindexes–aforeigntraderestrictivenessindexandadomestictraderestrictivenessindex. The foreign index score includes both discriminatory and non-discriminatory restrictions, while thedomesticindexscorecoversonlynon-discriminatoryrestrictions.Hence,thedifferencebetweenthescoresofthetwoindexesisameasureofthediscriminationagainstforeigners(McGuire,2008).SomestudiesinthetradeliteraturehaveusedtheseSTRIstoestimatethepriceeffectsofservicesmeasures,takingaccountofstandarddeterminantsofperformanceforthesectorconcerned.
Beyond the limited country and time coverage, there are several limitations of such an STRI, outlined byGrünfeldandMoxnes(2003).Firstly,theSTRIisnotatariffequivalent;thusitdoesnotprovideinformationon price or cost impacts. Secondly, it does not measure anti-competitive practices, such as price-fixing,market-sharingarrangementsandcartels,whichconstituteimpedimentstoservicestrade.Thirdly,itisonlycomputed for six industries: banking, telecommunications, maritime services, distribution (wholesale andretail),educationandprofessionalservices(engineering,architecturalandlegal).
TheconstructionofSTRIsusingamethodologyofscoresandweightsbasedonexpert judgement isalsobeingcarriedoutinon-goingWorldBankresearch.Discriminationagainstforeignsuppliersforeachservicessectorandmodeofsupply ismappedonafive-pointscalerangingfrom0(fornorestrictions)to1(highlyrestricted), with three intermediate levels of restrictiveness (0.25, 0.50 and 0.75). Sector results areaggregated across modes of supply using weights that reflect the judgement of experts on the relativeimportanceofthedifferentmodesforasector.Forexample,“temporarymovementofsuppliers”(mode4)isimportant for professional services, but not for telecommunications, whereas “commercial presence” orforeigndirect investment (mode3) is thedominantmode for contestingamarket.Next, sectorSTRIsareaggregated into a single measure for the services sector as a whole in each country using sector GDPsharesorFDIsharesasweights(GootiizandMattoo,2009a).
Themajor limitationof theestimatesbasedon theSTRIs is that they relyon the judgementofexperts todeterminetheseverityofdifferentrestrictions.Thislendsanunavoidableelementofsubjectivitytotheindex(GootiizandMattoo,2009b).Inaddition,thereareconceptualproblemswiththeweightsused.
World TrAde reporT 2012
124
Another distinction that is only partially captured byPMR indicators is theonebetweendiscriminatoryandnon-discriminatory services measures (as defined inSection B.2).62 This distinction is important for policy-making. Using data for 34 economies in the AsiaPacific,EuropeanandAmericanregions,Nguyen-Hong(2000) finds that price-cost margins of engineeringfirms are negatively affected by non-discriminatorymeasures that restrictentryandpositivelyaffectedbydiscriminatory measures on foreign establishment andoperation. Increases in price-cost margins areinterpretedasindirectevidenceoftherent-creating(i.e.profit-generating) effects of restrictions, whilereductions in such margins are interpreted as indirectevidence of cost-creating effects. This suggests thatnon-discriminatory measures are likely to raise costs,while discriminatory policies such as nationality orresidency requirements generate additional profits fordomesticincumbents(FrancoisandHoekman,2010).
TheAustraliaProductivityCommission’sSTRIisafirstsourceofinformationondiscriminationagainstforeignproviders of services. Findlay and Warren (2000)present ample evidence that there is significantdiscrimination, both in the establishment of foreignservices providers and in the conduct of theiroperations. As argued in Box C.2, the amount ofdiscriminationiscalculatedasthedifferencebetweentheforeignSTRIandthedomesticSTRI.
Secondly,someevidenceontheextentofdiscriminationcan be gathered from the OECD PMR indicator“discriminatory procedures” (DPs). This indicatorincludes information on whether there is “general”discrimination and “competition” discrimination againstforeign firms. Among the questions pertaining to“generaldiscrimination”,thereisoneaskingwhetherthecountry “has specific provisions which require orencourageexplicitrecognitionofthenationaltreatmentprinciplewhenapplyingregulations,soastoguaranteenon-discriminationbetweenforeignanddomesticfirms,goods or services”.63 Like the general PMR indicator,discriminatory procedures have also, on average,decreasedovertime.64
A third source of information on discrimination inservices regulations is contained in the OECD’s FDI
Restrictiveness Index. The index summarizes, for anumber of manufacturing and services sectors, theextent to which foreign investment is restricted. Thisconstitutes, by definition, a discriminatory restriction.Based on the OECD data, three indexes that arerelevant to services sectors have been created: anoverall index; an index for electricity, transport andcommunicationssectors;andanindexforprofessionalservices.65 These indexes provide information onGATSmode3restrictions.
FDI restrictiveness in services varies acrosscountries,asshowninKalinovaetal.(2010).66Thereis also some evidence of a downward trend in FDIrestrictiveness indicators, both for the overall indexand for the ETC and professional services indexes.Fortheoverallindex,Panel(a)ofFigureC.22clearlyshowsthat theunweightedaverageacrosscountriesdecreasesovertime,whiletheGDPweightedaverageis more stable over time, probably because richcountries start from low levels of FDI restrictions.Likewise,Panel(b)ofFigureC.22showsadownwardtrend in the unweighted averages, and a less clearpattern of GDP weighted averages, of the ETC andprofessionalservicesindicators.Regressionanalysis,however, reveals that the overall, ETC andprofessional services indexes all decrease over thesampleperiod.67Moreover,asdiscussed inBoxC.3,most of the reduction in the FDI restrictivenessindexes is driven by a reduction in foreign equityrestrictions.
(b) Domesticregulation
Measuringdomestic regulation inservices isdifficult.Most, ifnotall,domestic regulation issector-specific.Toprovideacoupleofexamples,specificqualificationand licensing requirements and procedures apply toprofessional services providers, such as architects orengineers;technicalstandardsoncapitalrequirementsdisciplinetheprovisionoffinancialservicesbyfinancialintermediaries. Moreover, a regulation may not beburdensomeper se, but ratherbecauseof theway inwhichitisimplemented.Giventheinherentdifficultiesinmeasuringdomesticregulation,itishardlysurprisingthatmostavailableproxiesareratherpoor.
Forexample, theuseofactualFDIflowsasweights introducesabiasbecausehighly restrictedsectorsarelikelytoexperiencelessFDIandthereforeareallocatedtoolowaweight.Similarly,usingGDPweights,sectorssuchashealth,withrelativelylargesharesofGDP,aresubjecttoalownumberofrestrictions,whereasthosewithlowsharesofGDP,suchastransport,electricityandfinance,aregenerallyhighlyrestrictedsectors.
ArecentstudybytheOECD(2009)analysesalternativestotheexpert-basedmethodologyforconstructingSTRIs.Itarguesthatalesssubjectiveweightingschemecouldbebasedonimpactanalysis–estimatingthedirectimpactofdifferentservicesmeasuresontradeusingregressiontechniques.Thestudyalsoidentifiesprincipalcomponentanalysis(PCA)asapossibleweightingscheme.Exploringthestatisticalpropertiesoftheunderlyingdata,thismethodfirstgroupstogetherindividualmeasuresthatarehighlycorrelated.Itthencreates weights based on each group’s contribution to the overall variation in the observed outcome, i.e.servicestrade.

II – TRADE AND PUBLIC POLICIES: A CLOSER LOOk AT NON-TARIFF MEASURES IN THE 21ST CENTURY
125
C. A
N IN
VE
NTO
RY
OF N
ON
-TAR
IFF
ME
AS
UR
ES
AN
D S
ER
VIC
ES
ME
AS
UR
ES
FigureC.22:FDI restrictiveness in services, evolution over time (indexbetween0and1)
Source:OECDFDIrestrictivenessdatabase.
1997 2003 2006 2010
0.2
0.25
0.15
0.1
0.05
0
Index GDP weighted index
1997 2003 2006 2010
0.2
0.25
0.3
0.15
0.1
0.05
0
ETC Index PS Index
GDP weighted ETC index GDP weighted PS index
(a)Overallindex(b)Energy,transportandcommunications(ETC)and
professionalservices(PS)
DespitetheabsenceofaclearcorrespondencewiththeGATS, PMR indicators have been used in the tradeliteraturetoproxyfordomesticregulationmentionedinGATSArticleVI.4.Inparticular,KoxandNordås(2007)selectthesub-setofindicatorsthat,accordingtothem,comesclosest tocovering the regulationmentioned inGATS Article VI.4. They drop all of the state controlmeasures,reconstructingthePMRindicatorusingonlytwomain components (with equal weight): “barriers toentry”and“barrierstotradeandinvestment”.
Barriers to entry is an equal-weight aggregation of“regulatoryandadministrativeopacity”,“administrativeburden on start-ups” and “barriers to competition”.Barriers to trade and investment is an equal-weightaggregation of “discriminatory procedures” and“regulatory barriers”. As partly acknowledged by theauthors themeselves, it is however unclear to whatextentthereconstructedPMRcapturestheregulatorybarriers that come closer to the ones falling underGATSArticleVI.4.
Among the PMR indicators, the one that is mostcloselyrelatedtodomesticregulationinGATSArticleVI.4 is “licences and permits system” (LPS). Thisindicator comprises three questions (with equalweights): (i) whether the “silence is consent” rule isused (i.e. licences are issued automatically if thecompetentlicensingofficehasnotactedbytheendofthe statutory response period); (ii) whether there aresingle contact points (“one-stop shops”) for gettinginformationonnotificationsand licences; (iii)whethertherearesinglecontactpointsforissuingoracceptingnotificationsandlicences.
A“yes”answerreceivesascoreofzero;thereforethelower the indicator, the less burdensome are thelicensing requirements. For the sample of 39 OECDand large developing countries on which PMRinformation exists in 1998, 2003 and 2008, there issome evidence that licence and permit systems havebecomelessburdensomeovertime.68
BoxC.3: Decomposition of changes in FDI restrictiveness
The FDI restrictiveness index is constructed as the sum of four components: foreign equity restrictions(FER), screening and approval (SCR), restrictions on key foreign personnel (KPE) and other restrictions(OTR).Theaveragepercentagecontributionofeachcomponenttothegrowthrateinthetotalindexbetween1997and2010isdecomposedusingthefollowingformula:
33
and for the ETC and professional services indexes. For the overall index, Panel (a) of Figure C.22 clearly shows that the unweighted average across countries decreases over time, while the GDP weighted average is more stable over time, probably because rich countries start from low levels of FDI restrictions. Likewise, Panel (b) of Figure C.22 shows a downward trend in the unweighted averages, and a less clear pattern of GDP weighted averages, of the ETC and professional services indicators. Regression analysis, however, reveals that the overall, ETC and professional services indexes all decrease over the sample period.67 Moreover, as discussed in Box C.3, most of the reduction in the FDI restrictiveness indexes is driven by a reduction in foreign equity restrictions. Figure C.22: FDI restrictiveness in services, evolution over time (index between 0 and 1) (a) Overall index (b) ETC and professional services (PS) Source: OECD FDI restrictiveness database Box C.3: Decomposition of changes in FDI restrictiveness The FDI restrictiveness index is constructed as the sum of four components: foreign equity restrictions (FER), screening and approval (SCR), restrictions on key foreign personnel (KPE) and other restrictions (OTR). The average percentage contribution of each component to the growth rate in the total index between 1997 and 2010 is decomposed using the following formula:
𝛾𝛾!""#!!"#" = 𝛾𝛾!"#!""#!!"#"𝜃𝜃!"#!""# + 𝛾𝛾!"#!""#!!"#"𝜃𝜃!"#!""# + 𝛾𝛾!"#!""#!!"#"𝜃𝜃!"#!""# + 𝛾𝛾!"#!""#!!"#"𝜃𝜃!"#!""# where γ’s represent growth rates between 1997 and 2010 and θi is the share of sub-indicator i in the FDI restrictiveness index in 1997. The results, averaged across countries, are presented in Table C.8. FER constituted the most important component of the overall index in 1997 (64.6 per cent) and represented the component with the largest percentage change (-33.7 per cent). All other components accounted for smaller shares in 1997 and smaller growth rates (in absolute value). Table C.8: Decomposition of growth of FDI restrictiveness in total services, 1997-2010
Source: OECD FDI restrictiveness database. The same decomposition was performed for ETC and professional services. The results are similar for ETC sectors, where most of the change in the ETC indicator (-38 per cent) was driven by the change in FER (-33.6 per cent). In professional services, FER still represent the most important component of the index. However, this component did not change much over time. Thus, the overall reduction of 29 per cent in the professional services index was mainly driven by reductions in SCR and OTR, with very small contributions from SCR and KPE. b) Domestic regulation
Measuring domestic regulation in services is difficult. Most, if not all, domestic regulation is sector-specific. To provide a couple of examples, specific qualification and licensing requirements and
differences across regions, with lower levels of restrictions in Latin America and European economies in transition (in 2004) compared with East Asia and the Middle East.
67 Specifically, the index is regressed on a time trend, with inclusion of country fixed effects to control for country-specific unobserved heterogeneity. The estimated coefficient on the time trend is negative and statistically significant. Results are available upon request.
whereγ ’s representgrowthratesbetween1997and2010andθi is theshareofsub-indicator i intheFDIrestrictivenessindexin1997.
The results, averaged across countries, are presented in Table C.8. FER constituted the most importantcomponent of the overall index in 1997 (64.6 per cent) and represented the component with the largestpercentagechange(-33.7percent).Allothercomponentsaccountedforsmallersharesin1997andsmallergrowthrates(inabsolutevalue).
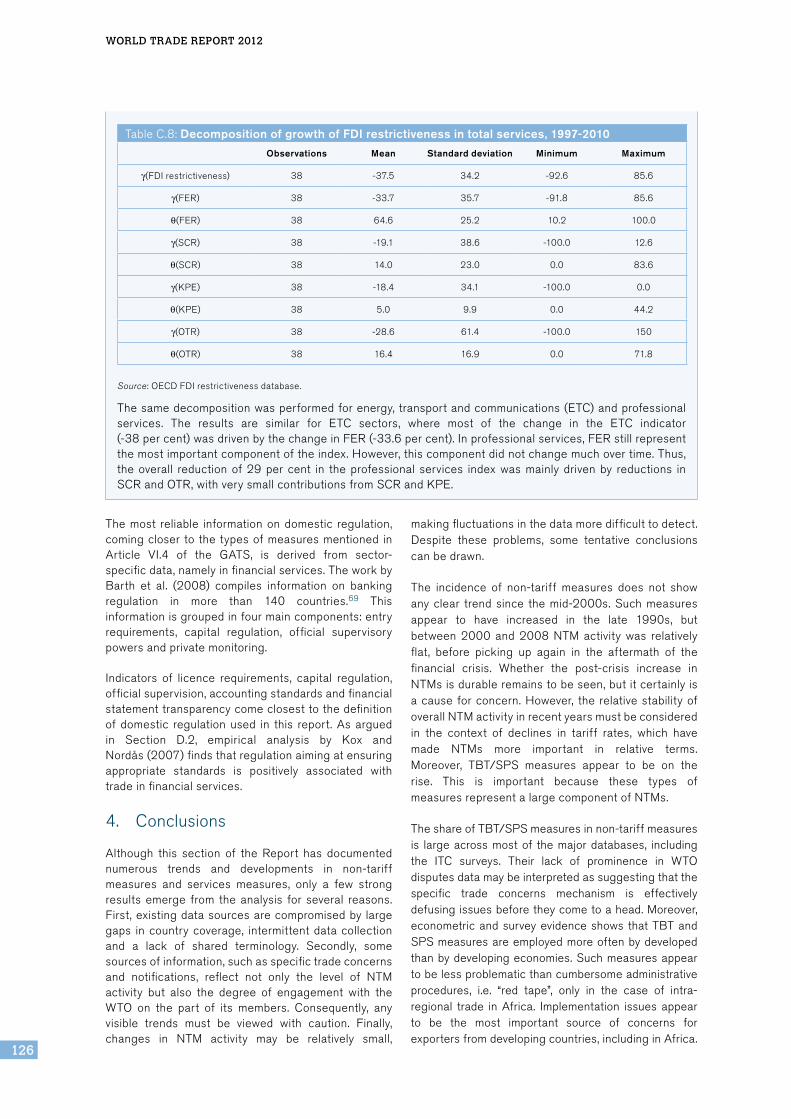
World TrAde reporT 2012
126
Themost reliable informationondomestic regulation,comingcloser to thetypesofmeasuresmentioned inArticle VI.4 of the GATS, is derived from sector-specificdata,namelyinfinancialservices.TheworkbyBarth et al. (2008) compiles information on bankingregulation in more than 140 countries.69 Thisinformationisgroupedinfourmaincomponents:entryrequirements, capital regulation, official supervisorypowersandprivatemonitoring.
Indicators of licence requirements, capital regulation,officialsupervision,accountingstandardsandfinancialstatementtransparencycomeclosesttothedefinitionofdomestic regulationused in this report.Asarguedin Section D.2, empirical analysis by Kox andNordås(2007)findsthatregulationaimingatensuringappropriate standards is positively associated withtradeinfinancialservices.
4. Conclusions
Although this section of the Report has documentednumerous trends and developments in non-tariffmeasures and services measures, only a few strongresultsemerge from theanalysis for several reasons.First,existingdatasourcesarecompromisedby largegaps incountrycoverage, intermittentdatacollectionand a lack of shared terminology. Secondly, somesourcesofinformation,suchasspecifictradeconcernsand notifications, reflect not only the level of NTMactivity but also the degree of engagement with theWTO on the part of its members. Consequently, anyvisible trends must be viewed with caution. Finally,changes in NTM activity may be relatively small,
makingfluctuationsinthedatamoredifficulttodetect.Despite these problems, some tentative conclusionscanbedrawn.
The incidence of non-tariff measures does not showanyclear trendsince themid-2000s.Suchmeasuresappear to have increased in the late 1990s, butbetween 2000 and 2008 NTM activity was relativelyflat, before picking up again in the aftermath of thefinancial crisis. Whether the post-crisis increase inNTMsisdurableremainstobeseen,butitcertainlyisacause forconcern.However, the relativestabilityofoverallNTMactivityinrecentyearsmustbeconsideredin the context of declines in tariff rates, which havemade NTMs more important in relative terms.Moreover, TBT/SPS measures appear to be on therise. This is important because these types ofmeasuresrepresentalargecomponentofNTMs.
TheshareofTBT/SPSmeasuresinnon-tariffmeasuresis largeacrossmostof themajordatabases, includingthe ITC surveys. Their lack of prominence in WTOdisputesdatamaybeinterpretedassuggestingthatthespecific trade concerns mechanism is effectivelydefusingissuesbeforetheycometoahead.Moreover,econometricandsurveyevidenceshows thatTBTandSPSmeasuresareemployedmoreoftenbydevelopedthanbydevelopingeconomies.Suchmeasuresappeartobelessproblematicthancumbersomeadministrativeprocedures, i.e. “red tape”, only in the case of intra-regional trade in Africa. Implementation issues appearto be the most important source of concerns forexportersfromdevelopingcountries,includinginAfrica.
TableC.8:Decomposition of growth of FDI restrictiveness in total services, 1997-2010
Observations Mean Standard deviation Minimum Maximum
γ(FDIrestrictiveness) 38 -37.5 34.2 -92.6 85.6
γ(FER) 38 -33.7 35.7 -91.8 85.6
θ(FER) 38 64.6 25.2 10.2 100.0
γ(SCR) 38 -19.1 38.6 -100.0 12.6
θ(SCR) 38 14.0 23.0 0.0 83.6
γ(KPE) 38 -18.4 34.1 -100.0 0.0
θ(KPE) 38 5.0 9.9 0.0 44.2
γ(OTR) 38 -28.6 61.4 -100.0 150
θ(OTR) 38 16.4 16.9 0.0 71.8
Source:OECDFDIrestrictivenessdatabase.
Thesamedecompositionwasperformedforenergy,transportandcommunications(ETC)andprofessionalservices. The results are similar for ETC sectors, where most of the change in the ETC indicator(-38percent)wasdrivenbythechangeinFER(-33.6percent).Inprofessionalservices,FERstillrepresentthemostimportantcomponentoftheindex.However,thiscomponentdidnotchangemuchovertime.Thus,theoverall reductionof29per cent in theprofessional services indexwasmainlydrivenby reductions inSCRandOTR,withverysmallcontributionsfromSCRandKPE.

II – TRADE AND PUBLIC POLICIES: A CLOSER LOOk AT NON-TARIFF MEASURES IN THE 21ST CENTURY
127
C. A
N IN
VE
NTO
RY
OF N
ON
-TAR
IFF
ME
AS
UR
ES
AN
D S
ER
VIC
ES
ME
AS
UR
ES
Although available data are problematic in severalrespects, thefactthatsimilarresultsareobtainedfrommultiple data sources lends some confidence to thesefindings. Other research on non-tariff measures alsopoints in a similar direction. In particular, the greaterimportance of TBT/SPS measures is echoed by Andoand Obashi (2010), who find that “non-core” NTMs(including SPS and TBT measures) have higherfrequency ratios than other types of measures incountriesintheAssociationofSoutheastAsianNations(ASEAN),andFliess(2003),whoreportsthat“technicalmeasures”faroutweighothertypesofmeasures.Beghin(2006)alsodocumentsanincreaseintheshareof“non-core”measuresinNTMsfrom55percentto85percentbetween 1994 and 2004. In the future, better datacollectioncouldprovideamuchmoredetailedpictureofthestateofNTMs,andTBT/SPSmeasuresinparticular.
Turningtoservicesmeasures,thedatasituationisevenmore problematic than for non-tariff measures.A major issue is the weakness of the transparencyprovisionsintheGATS.Thenotificationrequirements,inparticular, are very limited. Using available non-WTO
sourcesof information, this reporthasdocumentedanincreasingtrendinmarketcontestabilityinanumberof(mostlyOECD)countriesduringthelastdecades.Thereisalsosomeevidencethatdiscrimination(inthesenseof domestic services and service suppliers beingtreated differently than their foreign equivalents) hasdecreased in the last decade. However, a seriouslimitation of available data is the difficulty indistinguishing between market access, nationaltreatmentanddomesticregulation.
Theproxiesfordomesticregulationaregenerallypoorand not very informative, except for some sector-specificdatainfinancialservices.Clearly,transparencyisamajorchallengeintheareaofservicesmeasures.Current efforts are geared towards collectinginformationonapplied regimes inmarketaccessandnationaltreatment.Fordomesticregulation,adifficultyistoidentifythemeasuresthatpotentiallyaffecttradein the regulatory regime of a country. Section E.4discussesvariousoptionsfortheWTOifitistoplayamore significant role in improving transparency inthisarea.

World TrAde reporT 2012
128
Endnotes1 Thememberswhoincludednon-tariffconcessionsintheir
schedulesofcommitmentsduringtheUruguayRoundareBelize,Cameroon,Egypt,ElSalvador,Malta,Indonesia,Senegal,andTrinidadandTobago.Inmostcases,theseconcessionsprovidefortheeliminationofnon-automaticlicencerequirementsoncertainproducts.Thosewhoincludednon-tariffconcessionsintheirschedulesaspartoftheirWTOaccessionprocessareChina,SaudiArabia,ChineseTaipei,UkraineandVietNam.
2 Thetariffquotasareexpressedinvariousquantityunitsandthein-quotaandout-of-quotatariffsareoftenspecificormixed.Asforthecommitmentstolimitdomesticsupport,theyareexpressedinnationalcurrenciesfrom1994.
3 Foradetaileddiscussionofthediversityofnotificationsanditscauses,seeBacchettaetal.(2012).
4 Bacchettaetal.(2012)discussinmoredetailthemetricsofthecomplianceandqualityofnotificationsandthereasonswhybothareoftenlow.
5 Collins-WilliamsandWolfe(2010)discussthequalityoftheinformationprovidedbysubsidiesnotifications.
6 NotethatlikeallotherWTOdocuments,notificationsareaccessiblethroughtheWTO’sDocumentsOnlineportal.
7 Thenumberofnotificationscorrespondsroughlytothenumberofmeasuresnotifiedaseachchangeinlegislationisnotifiedseparatelyandeachchangeinlegislationtypicallyinvolvesonemeasure.
8 Reportsbroadlyfollowastandardtemplatebutthereisanadhoccomponent.
9 ItisapreparatorycontributiontothereportbytheDirector-GeneralthatiscalledforinParagraphGofAnnex3oftheMarrakeshAgreementandthataimstoassisttheTPRBtoundertakeanannualoverviewofdevelopmentsintheinternationaltradingenvironmentwhicharehavinganimpactonthemultilateraltradingsystem.SeeWT/TPR/OV/W/1toWT/TPR/OV/W/3andWT/TPR/OV/1to13.
10 Thesecondseriesstartedinlate2008(thefirstreportwasdistributedinJanuary2009)inthecontextoftherecentglobalfinancialandeconomiccrisis.See,forexample,theReportonG20tradeandinvestmentmeasures(May2010toOctober2010)dated4November2010.
11 InthecontextoftheFourthAppraisaloftheTPRM,delegationsindicatedtheirdesiretobringthismattertotheattentionofMinistersattheEighthMinisterialConference,andtoprepareaMinisterialDecisionaimedatthecontinuationandstrengtheningofthetrademonitoringexerciseundertheTPRB.SeeSectionVIIIofWTOdocumentWT/MIN(11)6of25November2011.TheAppraisalwasapprovedbyallmembers.
12 MemberssometimesrequesttheWTOSecretariattoputconcernsontheagendabutwithdrawthembeforetheyarepresentedtotheCommittee,arguingthatabilateralarrangementhasbeenfound.
13 DocumentsG/SPS/GEN/204/Rev.11andG/TBT/GEN/74/Rev.9providesummariesofthespecifictradeconcernsraisedrespectivelyintheSPSandtheTBTcommittees.
14 Thedatasetandthemethodologyareavailableathttp://www.wto.org/english/res_e/publications_e/wtr12_dataset_e.htm.
15 Whilethisdatabaseisnotpublic,theWorldBankmaintainsapublicdatabaseonWTOdisputes.SeeSectionC.1(b).
16 Thedisputesthemselvesareonlyasub-setofalltheconflictsthatarisebetweenmembers.Inthisperspective,AppellateBodycasescanbeseenasthetipofthe“greatpyramid”oftheWTOlegalorder,withmostoftheimportantnormativeandconflictresolutionworkdonemuchclosertothebaseofthepyramid(Wolfe,2005).
17 SantanaandJackson(2012)havealsoreviewedandcomplementedadatasetofrequestsforconsultationsundertheGATTdisputesettlementcoveringtheperiod1948-1989.TheoriginaldatasetwaspreparedbyReinhardt(1996)onthebasisofHudec(1993).
18 UNCTAD’scollaborationwithAsociaciónLatinoamericanadeIntegración(ALADI)standsoutasitsmostsuccessfulattemptatengagingregionalorganizationsinthecollectionofNTMinformation.Since1997,ALADIhasbeencollectingNTMinformationforanumberofcountriesintheregionandprovidingthisinformationtoUNCTADonanannualbasis.ThedatacollectedbyALADIisfullycompatiblewiththeUNCTADTRAINSdatabase.ALADImembercountriesareamongthefewforwhichtheNTMinformationinTRAINShasbeenregularlyupdatedovertheperiod1997to2010.SeeSectionC.2.
19 Amongthesourcesusedwerevariousgovernmentpublications(officialjournals),publicationsfrominternationalorganizationssuchasESCAP’sTISNET,WTOnotifications,theGermanForeignTradeInformationOffice(BFAI),theFrenchInternationalTradeMonitor(MOCI),theGermanInstituteforEconomicResearch(IFO)ortheBritishBusinessJournal.
20 Formoredetailsonthisproject,seeUnitedNationsConferenceonTradeandDevelopment(UNCTAD)(2010).
21 Thisinternationalclassificationwillberevisedonaregularbasis.ThenextupdatewillbereleasedinApril2012.
22 ThesevenpilotprojectcountrieswereBrazil,Chile,India,Philippines,Thailand,TunisiaandUganda.
23 TheinitiallistofproceduralobstaclescanbefoundinAnnex3ofUnitedNationsConferenceonTradeandDevelopment(UNCTAD)(2010).
24 ByMarch2012,datahadbeencollectedforabout40countriesandithadbeendisseminatedforeightofthem.
25 Accessibleat:http://go.worldbank.org/W5AGKE6DH0.
26 SeealsothediscussionofdisputesasasourceofinformationonNTMsinSectionC.1.(a).
27 Moreover,itisnotclearwhetherthePMRindicatorstakeintoaccounttheenforcementofmeasures.However,ConwayandNicoletti(2006)arguethatNMRindicatorspartlytakeintoaccounttheimpactofpolicyenforcement.
28 Thisisnotalwaystrueinthecaseofnotifications.Asdiscussed,therearereasonstobelievethatcompliancewithcertainrequirementsmaybelow.
29 SeePartIIofUnitedNationsConferenceonTradeandDevelopment(UNCTAD)(2010)foradiscussionofquantificationmethodologiessuitedtosurveydata.OneproblemdiscussedinAppendix1ofInternationalTradeCentre(ITC)(2011)isthatmanycountrieslackasystematicbusinessregistercoveringallsectors,whichmakesrandomsamplingineachsectordifficult.

II – TRADE AND PUBLIC POLICIES: A CLOSER LOOk AT NON-TARIFF MEASURES IN THE 21ST CENTURY
129
C. A
N IN
VE
NTO
RY
OF N
ON
-TAR
IFF
ME
AS
UR
ES
AN
D S
ER
VIC
ES
ME
AS
UR
ES
30 Foranoverviewofbusinesssurveys,seeOrganisationforEconomicCo-operationandDevelopment(OECD)(2005).WorldBank(2008a,2008b)reporttheresultsoftworecentWorldBankinitiativestocollectNTMdatathroughinterviewsrespectivelyin13mostlyAsiancountriesandinEastAfricancountries,respectively.
31 SelectedNTMsurveycountriesincludeBurkinaFaso,Egypt,Jamaica,Kenya,Madagascar,Mauritius,Morocco,Paraguay,Peru,RwandaandUruguay.
32 SeethedetaileddescriptionofITC’sNTMsurveymethodology,includingthesamplingtechniqueinInternationalTradeCentre(ITC)(2011).
33 Wolfe(2012)comparestheGTAandWTOmonitoringmechanisms.
34 AsexplainedinAppendixC.1,thedataavailableonUNCTADTRAINSrefertotheoldNTMclassification.Thereisnoexactcorrespondencebetweentheoldandnewclassification.TheuseofdatafromUNCTADTRAINSupto2008ismadebecauseitistheonlysourceofofficialdatathatallowsidentifyingtrends.
35 Cautionshouldbetakenininterpretingtheseresults,however,becauseofgapsinthedataandalsobecausepartoftheinformationcomesfromWTOnotifications.Theincentivestonotifyandcompliancerateschangeovertime.
36 Panel(b)ofFigureC.2hasbeenconstructedwiththesub-setofLatinAmericancountrieswithNTMinformationin1999,2001,2003,2004,2005,2006and2008.ThiscomprehensiveinformationwasdevelopedbyALADIandincludedinUNCTADTRAINS.Notethatthetimeperiodsslightlydifferinthetwopanelsbecauseofdataavailability.
37 TheaveragenumberofSPSnotificationsissuedpermemberhasfluctuatedwidelybetween2005and2009,thoughintheprioryearsithasshownanincreasingtrend.ForTBTnotifications,thetrendinthenumberofnotificationspermembersomehowreverses,withwidefluctuationsuntil2005andamarkedincreasesincethen.
38 TheSPSSTCDatabaseincludesinformationontheterminationofeachconcern,whichisprovidedbymembersinthecontextoftheSPSCommitteediscussions.Thedataincludedinthefigurearebetween1995and2010.Sixteennewconcernswereissuedin2011,butthereisnoinformationonthenumberofconcernsresolvedin2011.
39 Unfortunately,withtheinformationathand,itisnotpossibletodistinguishbetweenthesetwochannels.Athirdhypothesisisthattherecouldbesomesubstitutionbetweenthedispute-settlementmechanismandthespecifictradeconcernsmechanism.
40 BecauseinformationonthedateofresolutionofTBTspecifictradeconcernsisnotavailableintherawdata,wemakethefollowingassumptionintheconstructionofFigureC.6:weclassifyaTBTconcernas“resolved”inyeartifitisnotraisedagainfortwoormoreyearsafteryeart.Forinstance,ifaspecifictradeconcernisfirstraisedintheTBTCommitteein1999,re-raisedin2000,andnotre-raisedinanyfollowingyear,itisassumedtobe“resolved”in2000.AscomparedtoSPS,thenumberofTBTconcernsassumedtobe“resolved”isthereforerelativelyhigh.ThispartlyreflectsthefactthatasignificantshareofTBTconcernsareraisedononlyoneortwooccasions,asamatterofclarificationorfurtherinformation.Theseconcerns–forthepurposesofthisanalysis–areassumedtobe“resolved”.
41 Theresultsareessentiallyunchangediftradevaluesareexpressedinrealterms,deflatingthemwiththeUSConsumerPriceIndex(CPI).
42 Theseresultsarestatisticallysignificant.Thecoefficientofatimetrendinaregressionwiththecoverageratio(orthefrequencyindex)asdependentvariableispositiveandsignificantatthe1percentlevel,bothforSPSandforTBTconcerns.Theregressionsincludesector,countryandcountry-sectorfixedeffectstocontrolforunobservedsector-,country-andcountry-sectorspecificvariables.
43 Subscriptscandtareomittedforexpositionalsimplicity.
44 Infact,themeasurescomputedfromthetwodatabasesarenotcomparable;therefore,theyareassigneddifferentnames.
45 TheregressionsinBoxB.6useinsteadthecountry,HS2sectorandtime-specificindexesindicatedintheequations.
46 Pre-shipmentinspections,whichunderthepreviousclassificationweregroupedtogetherwithTBTandSPSmeasuresunderthecategoryof“technicalmeasures”,coveronaverage20percentofproductsandoftradevalue.
47 DevelopedeconomiescomprisethemembersoftheEuropeanUnion(27),Switzerland,Norway,theUnitedStates,Canada,Japan,AustraliaandNewZealand.Developingeconomiescompriseallothercountries,includingtheCommonwealthofIndependentStates(CIS).Countrycoveragedependsondataavailability.
48 ThistakesintoaccountthefactthatWTOmembershipincludesmanymoredevelopingthandevelopedcountries.ItshouldberemindedthatintheSTCDatabasetheEuropeanUnionisconsideredasingledevelopedcountry.Asnotedabove,a“raising”countryistheonewhichcomplainsaboutaTBT/SPSmeasureimposedbya“maintaining”countryintherelevantWTOCommittee.
49 Werunregressionsofthecoverageratioorthefrequencyindexonadummyequaltooneifthemaintainingcountrybelongstothegroupofdevelopedcountriesandzerootherwise.Thecoefficientsonsuchdummyarepositiveandsignificant.Theregressionisatthetwo-digitlevelofdisaggregationintheHS1988-92nomenclature,becausethisisthehighestlevelofdisaggregationatwhichfrequencyandcoverageratioscanbecalculated.Regressionanalysisispreferredinthiscontextbecauseitallowstocontrolforomittedvariablesusingfixedeffects.Inparticular,theinclusionofsector-yearfixedeffectsallowstocontrolforunobservedheterogeneitywithinasectorovertime.Countryfixedeffectscannotbeincluded,duetocollinearitywiththevariableofinterest(developedcountrydummy).Theresultsareavailableuponrequest.
50 AnexampleistheEmeraldAshBorer,abeetlethatwasintroducedintoNorthAmericafromAsiainthe1990s,andwhichhassincedevastatedashtreepopulations.ThetotaldiscountedcostoftheinfestationtotheUnitedStatesaloneisestimatedatUS$10.7billionbyKovacsetal.(2010).
51 AsarguedbyUnitedNationsConferenceonTradeandDevelopment(UNCTAD)(2012),theuseofSPSmeasuresislargelylimitedtoagriculturalsectorsandproductsfromanimaloriginbecausetheircontrolisessentialforensuringthehealthandwell-beingofconsumersandtheprotectionoftheenvironment.
52 Twentyconcerns(6percent)coverbothagriculturalandnon-agriculturalproducts.TheresultsarequitesimilarwhendistinguishingbetweenAOAandNAMAproducts.Inthiscase,theresultsforSPSandTBTconcernsareasfollows.ForSPS,85percentofspecifictradeconcernsareinAOAproductsand7percentinNAMAproducts,with8percentcoveringboth.ForTBT,22percentofspecifictradeconcernsareinAOA,57percentinNAMAand21percentinboth.

World TrAde reporT 2012
130
53 Werunregressionsofthecoverageratioorthefrequencyindexonadummyequaltooneifaspecifictradeconcernaffectsanyofthefirst24chaptersoftheHarmonizedSystem(HS)tradenomenclature.Thecoefficientonsuchadummyvariableispositiveandsignificant.Theregressionsincludecountry-yearfixedeffectstocontrolforunobservedheterogeneitywithina(maintaining)countryovertime.Sectorfixedeffectscannotbeincluded,duetocollinearitywiththevariableofinterest(agriculturalsectordummy).Theresultsareavailableuponrequest.
54 SeeAppendixTableC.1inAppendixC.2.IntermediateintensityismeasuredastheshareofHS6productsclassifiedaspartsandcomponentsinthetotalnumberofHS6productsbelongingtoachapter(HS2).
55 TheinstitutionalimplicationsofthetheoryoftradeagreementsunderoffshoringareanalysedindetailinSectionE.
56 Companiesthatcouldnotbeaffiliatedtoasectorareexcludedfromthiscalculation.
57 Para-tariffmeasurescomprisevarioustaxesandchargesotherthantariffsandcustomsduties.
58 Referstomeasuresclassifiedas“RED”inGTAreports,whichclearlyrestricttrade.
59 SeeHoekman(1996),Barthetal.(2006),AdlungandRoy(2009)andGootiizandMattoo(2009a).Barthetal.(2006),forinstance,showthat,inthefinancialservicessector,appliedpolicyinasampleof123countriesismuchmoreliberalthanwhatwascommittedtointheGATS.
60 Thisgeneraltrendofincreasedmarketcontestabilitycanbeexplainedbytheraisingawarenessthatreformsthatpromoteprivatecorporategovernanceandcompetition(wheretheseareviable)havethepotentialtoboosteconomy-wideproductivitygrowth(NicolettiandScarpetta,2003).Moreover,strongercompetitioninproductmarketsmayalsohaveapositiveeffectonemployment.Wölfletal.(2009)argue,however,thattheaggregatetrendmaskswidedifferencesinreformacrosscountriesandovertime.
61 FigureC.21(b)alsoincludesthetrendsdisaggregatedbytypeofregulation,entryorconduct.Itsuggeststhatconductregulationshavedecreasedovertimemoremarkedlythanentryregulations.Regressionanalysisconfirmsthatthedownwardtrendisstatisticallysignificantonlyforoverallandconductregulation,notforentryregulation.Intheregressions,theNMRindexisregressedonatimetrend,includingcountry-professionfixedeffects.Thecoefficientonthetimetrendisnegativeandstatisticallysignificant.Theresultsareavailableuponrequest.
62 Discriminatory(non-discriminatory)measuresaffectdomesticandforeignservicesandservicessuppliersdifferently(equally).
63 OtherquestionsusedtocompiletheDPsindicatorgobeyondnationaltreatment.Forthisreason,DPsisanimperfectproxyfordiscriminationinthesenseofnationaltreatmentlimitations(GATSArticleXVII).
64 Inparticular,aregressionofDPonatimetrendandthefullsetofcountryfixedeffectsgivesanegativeandstatisticallysignificantcoefficient.Thesampleincludeshoweveronly39countries(mostlyOECDmembersandsomelargedevelopingcountriessuchasBrazil,ChinaandtheRussianFederation,amongothers)forthreeyears(1998,2003and2008).
65 Theoverallindexincludesthefollowingsectors(withequalweights):electricitydistribution,wholesaletrade,retailtrade,transport,hotelsandrestaurants,media,telecommunications,banking,insurance,otherfinanceandbusinessservices.Theelectricity,transportandcommunicationsindexonlyincludes(withequalweights)electricitydistribution,transport(landandair,withrespectivesub-weightsofonehalf)andtelecommunications.Theprofessionalservicesindexincludeslegalservices,accountingandaudit,architecturalservicesandengineeringservices(alwayswithequalweights).
66 SeealsoUnitedNationsConferenceonTradeandDevelopment(UNCTAD)(2006).ThisstudyclassifiesandscoresFDIrestrictionsinservicessectorsfor50developingandtransitioneconomiesin2004.ItalsofindsconsiderablevariationinFDIrestrictivenessacrosscountries.Moreover,itreportssystematicdifferencesacrossregions,withlowerlevelsofrestrictionsinLatinAmericaandEuropeaneconomiesintransition(in2004)comparedwithEastAsiaandtheMiddleEast.
67 Specifically,theindexisregressedonatimetrend,withinclusionofcountryfixedeffectstocontrolforcountry-specificunobservedheterogeneity.Theestimatedcoefficientonthetimetrendisnegativeandstatisticallysignificant.Resultsareavailableuponrequest.
68 Inparticular,aregressionofLPSonatimetrendandthefullsetofcountryfixedeffectsgivesanegativeandstatisticallysignificantcoefficient.Theresultsareavailableuponrequest.
69 Thefirstsurveyincluded117countriesin1998-2000.Thesecondincluded152countriesin2002-03.Thelastsurveyincluded142countriesin2005-07.
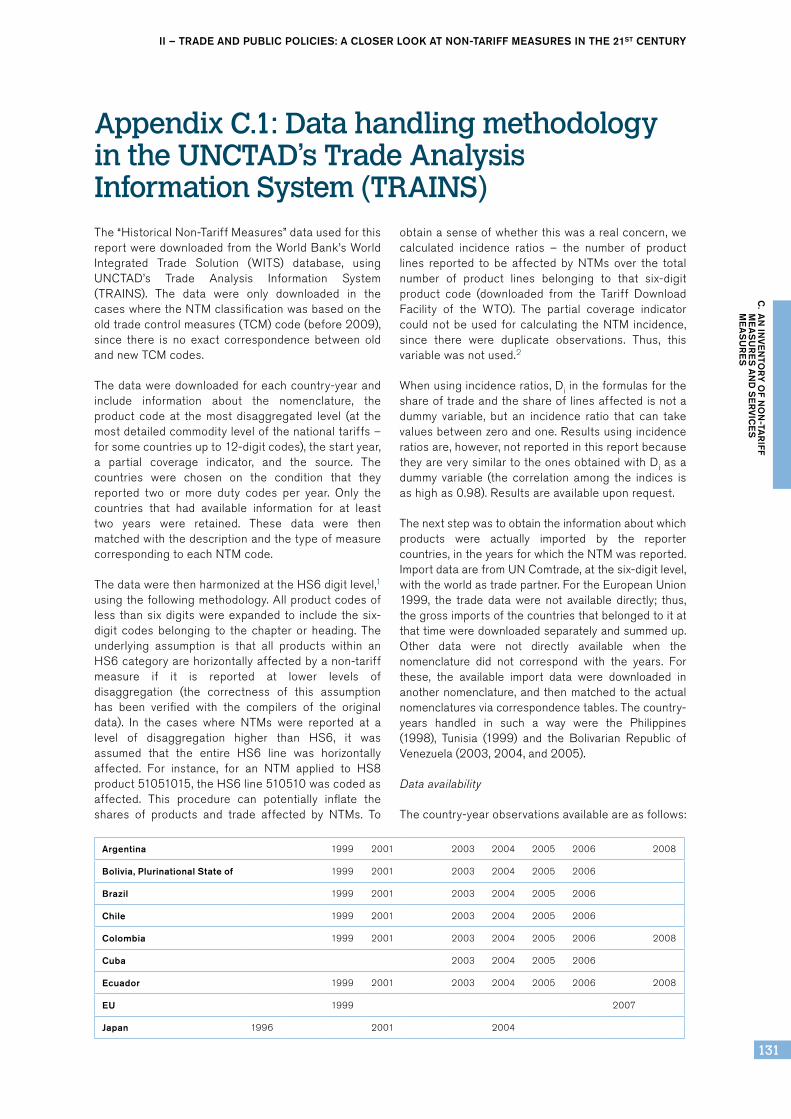
II – TRADE AND PUBLIC POLICIES: A CLOSER LOOk AT NON-TARIFF MEASURES IN THE 21ST CENTURY
131
C. A
N IN
VE
NTO
RY
OF N
ON
-TAR
IFF
ME
AS
UR
ES
AN
D S
ER
VIC
ES
ME
AS
UR
ES
The“HistoricalNon-TariffMeasures”datausedforthisreportweredownloadedfromtheWorldBank’sWorldIntegrated Trade Solution (WITS) database, usingUNCTAD’s Trade Analysis Information System(TRAINS). The data were only downloaded in thecaseswheretheNTMclassificationwasbasedontheoldtradecontrolmeasures(TCM)code(before2009),since there is no exact correspondence between oldandnewTCMcodes.
Thedataweredownloadedforeachcountry-yearandinclude information about the nomenclature, theproduct code at the most disaggregated level (at themostdetailedcommoditylevelofthenationaltariffs–forsomecountriesupto12-digitcodes),thestartyear,a partial coverage indicator, and the source. Thecountries were chosen on the condition that theyreported two or more duty codes per year. Only thecountries that had available information for at leasttwo years were retained. These data were thenmatchedwiththedescriptionandthetypeofmeasurecorrespondingtoeachNTMcode.
ThedatawerethenharmonizedattheHS6digitlevel,1usingthefollowingmethodology.Allproductcodesofless thansixdigitswereexpanded to include thesix-digit codes belonging to the chapter or heading. Theunderlying assumption is that all products within anHS6categoryarehorizontallyaffectedbyanon-tariffmeasure if it is reported at lower levels ofdisaggregation (the correctness of this assumptionhas been verified with the compilers of the originaldata). In the cases where NTMs were reported at alevel of disaggregation higher than HS6, it wasassumed that the entire HS6 line was horizontallyaffected. For instance, for an NTM applied to HS8product51051015,theHS6line510510wascodedasaffected. This procedure can potentially inflate theshares of products and trade affected by NTMs. To
obtainasenseofwhetherthiswasarealconcern,wecalculated incidence ratios – the number of productlines reported to be affected by NTMs over the totalnumber of product lines belonging to that six-digitproduct code (downloaded from the Tariff DownloadFacility of the WTO). The partial coverage indicatorcouldnotbeused forcalculating theNTM incidence,since there were duplicate observations. Thus, thisvariablewasnotused.2
Whenusingincidenceratios,Diintheformulasfortheshareoftradeandtheshareoflinesaffectedisnotadummy variable, but an incidence ratio that can takevaluesbetweenzeroandone.Resultsusingincidenceratiosare,however,notreportedinthisreportbecausetheyareverysimilartotheonesobtainedwithDiasadummy variable (the correlation among the indices isashighas0.98).Resultsareavailableuponrequest.
Thenextstepwastoobtaintheinformationaboutwhichproducts were actually imported by the reportercountries,intheyearsforwhichtheNTMwasreported.ImportdataarefromUNComtrade,atthesix-digitlevel,withtheworldastradepartner.FortheEuropeanUnion1999, the trade data were not available directly; thus,thegrossimportsofthecountriesthatbelongedtoitatthattimeweredownloadedseparatelyandsummedup.Other data were not directly available when thenomenclature did not correspond with the years. Forthese, the available import data were downloaded inanothernomenclature,andthenmatchedtotheactualnomenclaturesviacorrespondencetables.Thecountry-years handled in such a way were the Philippines(1998), Tunisia (1999) and the Bolivarian Republic ofVenezuela(2003,2004,and2005).
Data availability
Thecountry-yearobservationsavailableareasfollows:
Appendix C.1: data handling methodology in the UNCTAd’s Trade Analysis Information System (TrAINS)
Argentina 1999 2001 2003 2004 2005 2006 2008
Bolivia, Plurinational State of 1999 2001 2003 2004 2005 2006
Brazil 1999 2001 2003 2004 2005 2006
Chile 1999 2001 2003 2004 2005 2006
Colombia 1999 2001 2003 2004 2005 2006 2008
Cuba 2003 2004 2005 2006
Ecuador 1999 2001 2003 2004 2005 2006 2008
EU 1999 2007
Japan 1996 2001 2004
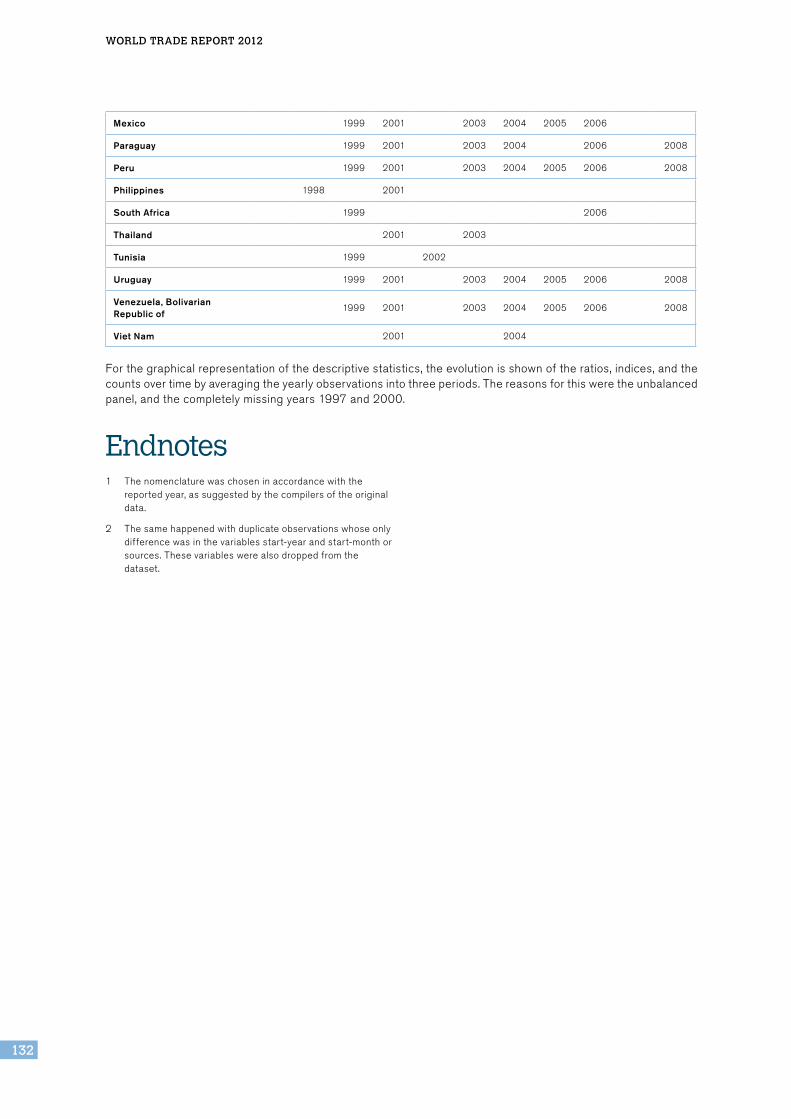
World TrAde reporT 2012
132
Mexico 1999 2001 2003 2004 2005 2006
Paraguay 1999 2001 2003 2004 2006 2008
Peru 1999 2001 2003 2004 2005 2006 2008
Philippines 1998 2001
South Africa 1999 2006
Thailand 2001 2003
Tunisia 1999 2002
Uruguay 1999 2001 2003 2004 2005 2006 2008
Venezuela, Bolivarian Republic of
1999 2001 2003 2004 2005 2006 2008
Viet Nam 2001 2004
Forthegraphicalrepresentationofthedescriptivestatistics,theevolutionisshownoftheratios,indices,andthecountsovertimebyaveragingtheyearlyobservationsintothreeperiods.Thereasonsforthisweretheunbalancedpanel,andthecompletelymissingyears1997and2000.
1 Thenomenclaturewaschoseninaccordancewiththereportedyear,assuggestedbythecompilersoftheoriginaldata.
2 Thesamehappenedwithduplicateobservationswhoseonlydifferencewasinthevariablesstart-yearandstart-monthorsources.Thesevariableswerealsodroppedfromthedataset.
Endnotes

II – TRADE AND PUBLIC POLICIES: A CLOSER LOOk AT NON-TARIFF MEASURES IN THE 21ST CENTURY
133
C. A
N IN
VE
NTO
RY
OF N
ON
-TAR
IFF
ME
AS
UR
ES
AN
D S
ER
VIC
ES
ME
AS
UR
ES
AppendixTableC.1: Coverage ratio and frequency index: intermediate-intensive sectors
SPS TBT
Coverage ratio Frequency index Coverage ratio Frequency index
(1) (2) (3) (4)
Intermediateintensity -0.225*** -0.0991*** -0.00987** -0.0300***
(0.0434) (0.0207) (0.00402) (0.00254)
Observations 3,808 3,614 11,760 10,715
R-squared 0.411 0.381 0.273 0.314
Notes:Country-yearfixedeffectsincludedinallregressions.Robuststandarderrorsinparentheses.***p<0.01,**p<0.05.
Appendix C.2: regression results