c AIRBORNE DOPPLER RADAR DETECTION OF LOW … · AIRBORNE DOPPLER RADAR DETECTION OF LOW ALTITUDE...
12
c c AIRBORNE DOPPLER RADAR DETECTION OF LOW ALTITUDE WINDSHEAR 1 E.M. BRACALENTE, C.L. BRITT', W.R. JONES NASA LANGLEY RESEARCH CENTER, HAMPTON, VA. r" 3- --.. Y e 23665 N9 1 - I1 689 Abstract 4 As part of an integrated vindshear program, the Federal Aviation Administration, jointly with NASA, is sponsoring a research effort to develop airborne sensor technology for the detection of low altitude vindshear during aircraft take-off and landing. One sensor being considered is microvave Doppler radar operating at X-band or above. Using a Microburst/ Clutter/Radar simulation program, a preliminary feasibility study was conducted to assess the per- formance of Doppler radars for this application. Preliminary results from this study are presented. Analysis show, that using bin-to-bin ACC, clutter filtering, limited detection range, and suitable antenna tilt management, vindshear from a "vet" microburst can be accurately detected 10 to 65 sec- onds (.75 to 5 Km) in front of the aircraft. Although a performance improvement can be obtained at higher frequency, the baseline X-band system simulated detected the presence of a vindshear hazard for the "dry" microburst. Although this study indicates the feasibility of using an air- borne Doppler radar to detect low altitude micro- burst windshear. further detailed studies --includ- ing future flight experiments -- will be required to completely characterize the capabilities and limitations. Key Words Aviation safety, vindshear detection and avoid- ance, vindshear hazard index. airborne remote sen- sor technology, microvave Doppler radar. Nomenclature A/D A/C AGC C CSD CSR D dB dBv dBz F 8 G I&Q k b FR Analog to Digital Automatic Gain Control Aircraft Speed of light, m/s Clutter Spectral Density Clutter-to-Signal ratio Rain drop diameter, mm Decibels Decibels relative rn 1 vatt Reflectivity factor in Decibels Hazard factor Radial component of hazard factor Acceleration of gravity, m/s2 Peak antenna gain In-phase and Quadrature Boltzmann's constant, Joules/Kelvin Refractive index factor for rain *Affiliation: Research Triangle Inst., Hampton. VA 1 n NRCS Pn PS pt PRF Rg RT SAR SCR SNR TS Tilt V "C wh WX ze 9 A I One-vay rain attenuation loss Receiver bandvidth lots factor Natural log (to the base e) Total raln reflectivity per unit volume Normalized Radar Cross Section System noise power. vatts Reflected signal pover, vatts Peak transmitter pover, vatts Pulse Repetition Frequency Range bin distance from A/C, m Range to target, ukters Synthetic Aperture Radar Signal-to-Clutter ratio Signal-to-noise ratio System Noise Temperature, deg. Kelvin Antenna angle measured from A/C glide-slope Aircraft airspeed, m/s Cell volume of rain target, m3 Vertical component of inertial wind, m/s Horizontal component of inertial wind, m/s Reflectivity factor, mm6/m3 TransGMer pulse duration. sec. Antenna 3 dB beamwidth, radians Wavelength, meters I. Introduction Thls paper Is declared a work of the U. S. Government and Is not subject to copyright protection in the United States 213 Low altitude microburst vindshear is recognized as a major hazard during takeoff and landing of aircraft. Microbursts are relatively small, intense dovndrafts vhich spread out in all direc- tions upon striking the ground. shear is encountered at low altitudes during land- ing or takeoff, the pilot has little time to react correctly to maintain safe flight (Fig. 1). In the United States during the period 1964 to 1985. there vere 26 major civil transport aircraft accidents and four incidents involving 626 fatalities and over 200 injuries for vhich vindshear vas a direct cause or a contributing factor. As part of its integrated vindshear program, the Federal Aviation Administration (FAA) jointly with NASA, is sponsor- ing a research effort to develop airborne sensor technology for detection of low altitude windshear during A/C takeoff or landing. A primary require- ment for an airborne forvard-looking sensor or sys- tem of sensors is to be capable of detecting both heavy ("vet") and light ("dry") precipitation mf-robursts. One sensor being considered for this application is microwave Doppler radar operating at X-band or higher frequency. Since absolutely clear air produces no radar return at microvave frequen- cies except very slight scattering from gradients in the index of refraction on the scale of the r.f. wavelength, the emphasis in the present research is on those microburst containing at least some liquid water. When such wind- https://ntrs.nasa.gov/search.jsp?R=19910002376 2018-06-03T19:36:57+00:00Z
Transcript of c AIRBORNE DOPPLER RADAR DETECTION OF LOW … · AIRBORNE DOPPLER RADAR DETECTION OF LOW ALTITUDE...

c c
AIRBORNE DOPPLER RADAR DETECTION OF LOW ALTITUDE WINDSHEAR
1
E.M. BRACALENTE, C.L. BRITT', W.R. JONES NASA LANGLEY RESEARCH CENTER, HAMPTON, VA.
r" 3- - - . . Y e 23665
N9 1 - I1 689 Abstract 4
As part of an integrated vindshear program, the Federal Aviation Administration, jointly with NASA, is sponsoring a research effort to develop airborne sensor technology for the detection of low altitude vindshear during aircraft take-off and landing. One sensor being considered is microvave Doppler radar operating at X-band or above. Using a Microburst/ Clutter/Radar simulation program, a preliminary feasibility study was conducted to assess the per- formance of Doppler radars for this application. Preliminary results from this study are presented. Analysis show, that using bin-to-bin ACC, clutter filtering, limited detection range, and suitable antenna tilt management, vindshear from a "vet" microburst can be accurately detected 10 to 65 sec- onds ( . 7 5 to 5 Km) in front of the aircraft. Although a performance improvement can be obtained at higher frequency, the baseline X-band system simulated detected the presence of a vindshear hazard for the "dry" microburst. Although this study indicates the feasibility of using an air- borne Doppler radar to detect low altitude micro- burst windshear. further detailed studies --includ- ing future flight experiments - - will be required to completely characterize the capabilities and limitations.
Key Words
Aviation safety, vindshear detection and avoid- ance, vindshear hazard index. airborne remote sen- sor technology, microvave Doppler radar.
Nomenclature
A/D
A/C AGC
C CSD CSR D dB dBv dBz F
8 G I&Q k b
FR
Analog to Digital Automatic Gain Control Aircraft Speed of light, m/s Clutter Spectral Density Clutter-to-Signal ratio Rain drop diameter, mm Decibels Decibels relative rn 1 vatt Reflectivity factor in Decibels Hazard factor Radial component of hazard factor Acceleration of gravity, m/s2 Peak antenna gain In-phase and Quadrature Boltzmann's constant, Joules/Kelvin Refractive index factor for rain
*Affiliation: Research Triangle Inst., Hampton. VA
1
n NRCS Pn PS pt PRF
Rg RT SAR SCR SNR TS Tilt V
"C wh WX ze
9 A
I
One-vay rain attenuation loss Receiver bandvidth lots factor Natural log (to the base e) Total raln reflectivity per unit volume Normalized Radar Cross Section System noise power. vatts Reflected signal pover, vatts Peak transmitter pover, vatts Pulse Repetition Frequency Range bin distance from A/C, m Range to target, ukters Synthetic Aperture Radar Signal-to-Clutter ratio Signal-to-noise ratio System Noise Temperature, deg. Kelvin Antenna angle measured from A/C glide-slope Aircraft airspeed, m/s Cell volume of rain target, m3 Vertical component of inertial wind, m/s Horizontal component of inertial wind, m/s Reflectivity factor, mm6/m3 TransGMer pulse duration. sec. Antenna 3 dB beamwidth, radians Wavelength, meters
I. Introduction
Thls paper Is declared a work of the U. S. Government and Is not subject to copyright protection in the United States 213
Low altitude microburst vindshear is recognized as a major hazard during takeoff and landing of aircraft. Microbursts are relatively small, intense dovndrafts vhich spread out in all direc- tions upon striking the ground. shear is encountered at low altitudes during land- ing or takeoff, the pilot has little time to react correctly to maintain safe flight (Fig. 1). In the United States during the period 1964 to 1985. there vere 26 major civil transport aircraft accidents and four incidents involving 626 fatalities and over 200 injuries for vhich vindshear vas a direct cause or a contributing factor. As part of its integrated vindshear program, the Federal Aviation Administration (FAA) jointly with NASA, is sponsor- ing a research effort to develop airborne sensor technology for detection of low altitude windshear during A/C takeoff or landing. A primary require- ment for an airborne forvard-looking sensor or sys- tem of sensors is to be capable of detecting both heavy ("vet") and light ("dry") precipitation mf-robursts. One sensor being considered for this application is microwave Doppler radar operating at X-band or higher frequency. Since absolutely clear air produces no radar return at microvave frequen- cies except very slight scattering from gradients in the index of refraction on the scale of the r.f. wavelength, the emphasis in the present research is on those microburst containing at least some liquid water.
When such wind-
https://ntrs.nasa.gov/search.jsp?R=19910002376 2018-06-03T19:36:57+00:00Z
Previous experiments1 and studies have demon- strated, in a limited way, the capability of air- borne Doppler radars to detect the presence of windshear. However. for A/C landing and take-off applications, the problems of severe ground clut- ter, rain attenuation, and low reflectivity levels must be solved. To consider these problems, a Microburst/Clutter/Radar simulation program has been developed to aid in ?he evaluation and develi opment of Doppler radar concepts. program incorporates windfield and reflectivity databases derived from a high resolution numerical windshear model2, clutter maps derived from air- borne Synthetic Aperture Radar ( S A R ) backscatter data, and various airborne Doppler radar configura- tions and signal processing concepts. The program simulates the operation of a Doppler radar located in an A/C approaching a runway, sensing signal returns from a windshear microburst and an airport clutter environment. burst/Clutter/Radar sirnulation program is presented along with examples of simulation outputs.
Using this program, a preliminary tradeoff and assessment study was conducted to evaluate the per- formance of Doppler radars to detect windshear dur- ing A/C landing. Case study results for a straw- man design are presented, illustrating airborne Doppler radar capabilities. Results for both a "wet" and "dry" microburst are included. This pre- liminary study shows the feasibility of using air- borne Doppler radars to detect windshear; however, further detailed studies w i l l be required, fnclud- ing future flight experiments, to completely char- acterize their capabilities and limitations.
The simulation
A description of the Micro-
$1. DODDIer Ra dar Desinn Reau- and Performance Trade-
A preliminary set of perfoknce requirements3 Preliminarv Desinn Reauirement
has been established for design of forward-looking windshear detection sensors. The sensors' primary requirement is to detect severe microburst wind- shear during final approach to landing (Fig. 1) or during takeoff, and to provide as a minimum, 15 to 40 seconds (approximately 1 to 3 km) warning to the pilot. tions 50 to 100 seconds (4 to 8 km) in front of the A/C is also desired. The sensor or sensor system must be able to detect windshyr caused by both heavy and light precipitation microbursts. The sensor must measure mean horizontal wind speeds every 150 to 300 meters out to a range of 6 to 8 km along the flight path and a small sector (approx. 20 deg.) on either side of the A/C, with approxi- mately 1 m/e accuracy. These primary requirements have been established as minimum guidelines for developing sensor design requirements and evaluat- ing potential concepts. The requirements to pro- vide other information and capabilities, such as vertioal wind speeds, rain reflectivity, wind tur- bulence, microburst signature recognition, and var- ious display capabilities have not been estab- lished. Guidelines for these requirements are being developed.
Advisory information on vindshear condi-
A major area of radar design that requires extensive development is the radar signal process- ing technique, which will suppress clutter inter- ference and provide maximum windshear detection accuracy. and evaluated, radar parameters must be choseit a , evaluated. The radar parameters chosen by the radar designer are those which go in the radar equation to compute Signal-to-Noise Ratio (SNR) performance. distant rain cell target is approximated by the following equations :4
Before these techniques can be developed
The SNR for a signal reflected from a
P,
Pn 21n(2)(4f13 k Ts RT4
pt ~2 12 1, A* n vCr SNR -- - where :
Pn - k T s / r
n - (7r5/A4) lk,,I2 2,
T
As seen from these equations a large number of parameters affect the performance of the radar. The designer, hovever, has control over only a few of them, mainly transmitter power. antenna gain, frequency of operation, pulse duration, and to a minor degree, target range. There is. for airborne operation, a number of factors which limits the choice of values for these parameters. The use of higher operating frequencies rovides greater sen- sitivity to rain reflectivityy3) and higher resolu- ti~n(~), but is subject to greater attenuation by rain. operate at frequencies of S-band (1-3 CHz). C-band ( 3 - 8 C H z ) , and X-band (8-12 GHz.). Although neglf- gible attenuation occurs at S-band, the increase in sensitivity and smaller cell resolution at X-band outweighs the small increase in attenuation (2-5dB) experienced for "wet" mfcrobursts. rnicrobursts, frequencies in the Ku-band (12-18 Chz) region could be considered since attenuation would remain low. both "wet" and "dry" microbursts could utilize dual frequency operation. but practical considerations make it desirable to find one frequency that can provide acceptable performance for a l l microbursts.
Most operational Doppler weather radars
For "dry"
Windshear detection capability for
L
2 14

Airborne veather radars, operate in an allocated frequency band around 9.3 GHz and utilize solid state transmitters of about 100 vatts. They are presently in use to display rain reflectivity and vind turbulence advisory information to the pilot. Therefore, it is of interest to assess airborne Doppler radar concepts for vindshear detection operating in this frequency band utilizing rela- tively low povers. Space limitation in the nose radome of passenger A/C limit the maximum antenna size to about 30-36 inches (.76-.91 m) in larger A/C and about 18-20 inch in smaller A/C. makes it more important, from a resolution and sen- sitivity standpoint, to operate at the higher frequencies. It is desirable to keep transmitter pover requirements lov SO that solid state trans- mitters can be considered. such as pulse repetition frequency (PRF). and pulse bidth are chosen to minimize velocity and range foldover problems and to provide acceptable range resolution. ameter values being considered in the feasibility study, and vhich represent state-of-the-art air- borne Doppler radar hardvare implementation capa- bility. Also listed is a baseline set of values used in the initial radar simulation case studies.
This
Other radar parameters c
Table 1 lists the range of radar par-
Table 1 Wind shear Doppler radar parameter values
Parameter
Pulse repitition freq. (PRF') Pulse width (TAU) u-sac.---- Max. det. range, km - - - - - - - - Range gate resolution, m - - - Range sampling window, km - - Max. unambiguous YO, m/sec.- Wind speed accuracy, m/sec. Operating frequency, GHz - - - Antenna diameter, m - - - - - - - - Antenna gain, dB - - - - - - - - - - - Antenna beamwidth, deg.----- Sidelobe level, dB - - - - - - - Antenna polarization - - - - - - - Ant. tilt angle range, deg. Azimuth angle range, dag. - - Minimum det. signal, dBZ - - - Transmitter peak pover, Irv - System noise figure, dB - - - - Return sig. dynam. range ,dB Receiver dynamic range, dB - Xmit/rec. phase jitter,d.rms Number of A/D conv. bits---- Clutter filter type - - - - - - - - Processing technique - - - - - - -
- - -_ - - - - -_____- -_ - - -________
.
1.0 10 150 1 - 9 2 4 1.0 9.3 .76
35.5 3
< -25 LINEAR n 0 to 2
+OR- 2 1 0 2 4 70 50 .5
' 12 2 pole
PP
1.0 - 3 . 0 5 TO 10 150 TO 4 5 0 1-10
24 TO 4 5 .5 TO 2
9 . 3 - 15 .46-.91
31 TO 40 . a TO 5
- 2 0 TO -35 DUAL POL 0 to 2 0 +OR- 4 5 -15 TO 10
. 2 to 10 3 TO 6
45 TO 55 .1 TO 2 10 TO 14 TBD
FFT, PP
60 - a0
SNR Performance Using selected values of parameters found in
table I, a set of SNR performance curves vere com- puted using (1). Sample plots of these SNR curves are shown in figures 2 61 3. The SNR is computed in a bandvidth equal to 1/T. A SNR in this bandvidth of greater than unity (0 dB) is generally required to obtain adequate Doppler processing performance. These curves show that S N R performance exceeding 0 dB can be obtained for relatively lov reflectivity levels (0 to 10 dBz) for ranges out to 10 km. Reflectivity values range from 60 dBz in the core of "wet" microbursts. to 10 to 40 dBz in the out- flov region. The performance curves for both the 9.3 CHz (fig. 2) and 15 CHz (fig. 3) show more than sufficient SNR performance for these ranges of reflectivities. For "dry" microbursts the core reflectivity can be in the range of 20 to 30 dBz range, falling to - 2 0 to +5 dBz in the outflow region. The 9.3 and 15 CHz performance for a -10 dBz reflectivity falls below 0 dB SNR at about 3 km and 6 km respectively, which are still acceptable ranges for this application. An increase in trans- mitter pover vould be required to operate down to the - 2 0 dBz level.
Clutter Performance The X and Ku-band SNR performance vas shown in
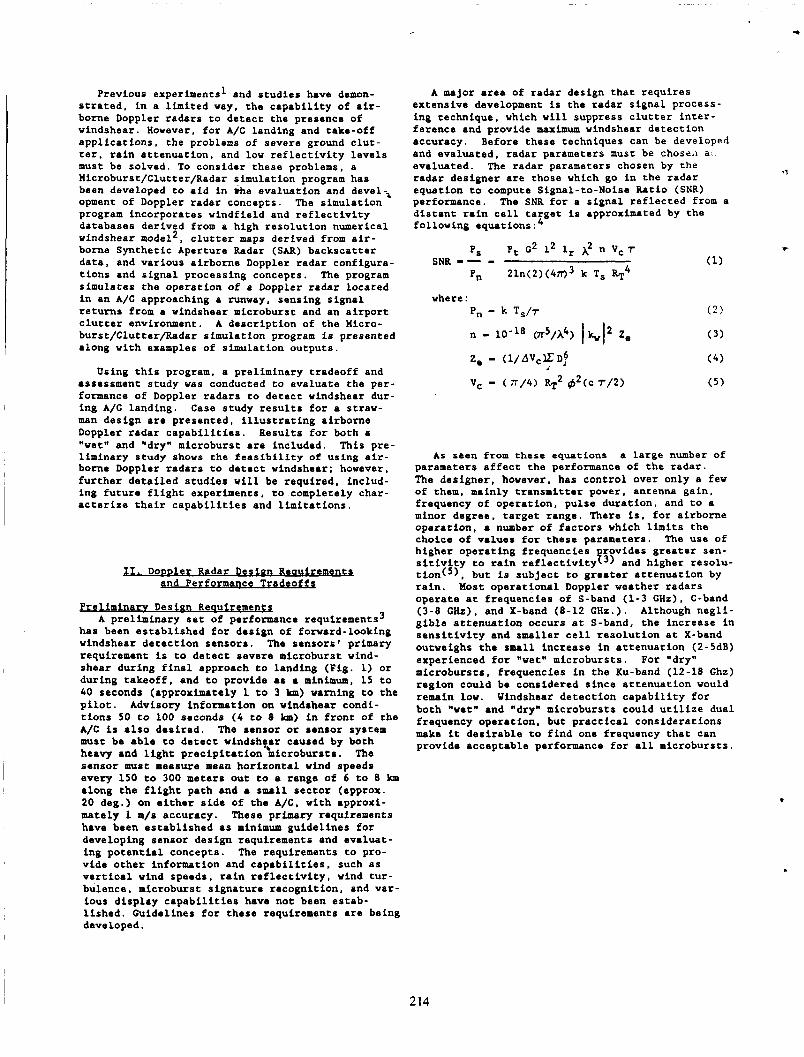
the previous section to be more than sufficient to allow adequate Doppler processing. Hovever, one of the major problems associated with the sensing of microburst using an airborne Doppler radar is the presence' of ground clutter. To assess the magni- tude of this problem, an analysis of clutter spec- tra and clutter-to-signal (CSR) ratios vas con- ducted, using ground clutter maps derived from well-calibrated SAR Normalized Radar Cross Section (NRCS) data as described in section 111. A set of clutter maps has been produced for a number of dif- ferent airports from existing sets of SAR data. Figures 4 h 5 show sample clutter-to-signal (CSR) ratio results, assuming a 10 dBz rain reflectivity signal level, for a few sample radar configurations approaching Willow Run airport. Plots are shown for a 5 km A/C range from touchdown, antenna tilt angles of Oo and 2O (antenna angle measured up from the A/C glide-slope of - 3 O ) . and antenna azimuth angles of Oo and loo. parameters used in these analyses. Figure 6 shows a histogram plot of the range of NRCS levels which exist in the clutter map used. The NRCS levels larger than -10 dB come primarily from urban areas and high level discrete targets.
Table 2 lists the radar
Table 2 Radar parameters used in clutter analysis
A/C range from runvay - - A/C ground velocity - - - - A/C glide slope - - - - - - - - Antenna Dia. - - - - - - - - - - - Antenna edge illum. - - - - Rain Reflectivity - - - - - - pRf _ _ _ _ _ _ _ _ _ _ _ _ _ - _ _ _ _ _ _ Ant. tilt angle - - - - - - - - Ant. azimuth angle - - - - -
Frequency - _ - - _ _ - - - _ _ _ _ _
Pulse Width - - - - - - - - - - - -
5 6 7 k m 77 m/s 3 0 9.3 CHz .76 m (30 in.)
10 dBz 1 u-sac. 5000 0 61 2 deg. 0 h 10 deg.
-10 dB
215

The results of this preliminary clutter analysis show that the highest clutter levels (CSR of 30-60 dB) occur where the pulse in the main beam inter- sects the ground, from the urban areas, and for antenna tilt angle of oo. are shown by these analyses, which can be utilized to greatly reduce the effects of clutter. First, lower CSR values occur at short ranges in front of the A/C, at range gates where the pulse in the main beam has not touched the ground. At these ranges the clutter is coming primarily from aidelobes, which if sufficiently low will suppress the clutter signals. For a 3 O beamvidth antenna pointed down at a Oo tilt angle and a 5 km A/C range, the -3 dB point of the main beam first touches the ground at about 3.5 km. and the first sidelobe null point at about 2.7 km (a point about 35 seconds ahead of the aircraft). For a 2O tilt these points are about 6 and 4.3 km respectively. Note in figure 4 the increase in CSR at a range of 2.5 km. This point corresponds to NRCS levels of -5 to 0 dB from a residential area about 2.5 to 3 km from the runway. The clutter level would have been much higher had the main beam been viewing this area rather than the beam sidelobes.
TWO significant results
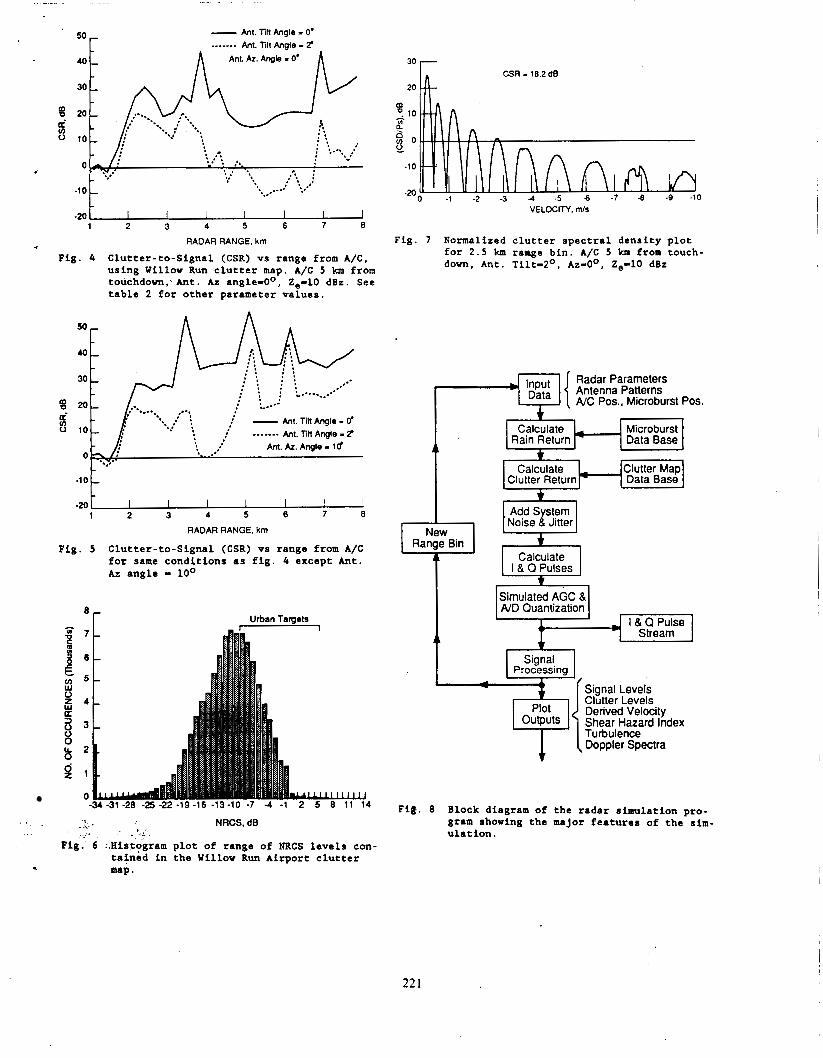
A second fact that is very evident in the data is the significant reduction in clutter that occurs when the antenna is tilted up from Oo to 2O. Thus, by limiting the range of data processing and employing proper antenna tilt control, CSR levels can be kept below 40 dB (well within the dynamic range capabilities of present day Doppler radar receiver design technology). Clutter suppression techniques can then be employed to reduce clutter to acceptable levels. Figure 7 shows a sample clutter spectral density plot for the 2.5 km range gates of figure 4 (ant. T i l t = 2 O , A r i d o , A/C at 5 km). The density levels are plotted against velo- city relative to the A/C*s ground velocity. the most significant clutter spectrum energy levels contained between zero and about 4 m/s, a high pass filter with maximum attenuation at zero velocity can be employed to significantly reduce the clutter levels. The CSR shown in figure 7 will be reduced by over 25 dB if the energy below 3 m/s is filtered out. Since the most severe wind velocities of interest exist at much higher speed6 (5-30 rn/s), this filter will have little effect on the wind speed velocity estimation. Studies are underway to evaluate filter processing techniques which can provide optimum results. Section IV presents sample case study results of windshear detection perfor- mance, using the radar simulation program.
With
X-N
General Description
calculation of the expected output of an sirborne coherent pulsed Doppler radar system viewing a low- level microburst along or near the approach path of the aircraft. Figure 8 i s a block diagram shoving the major features of the simulation ITrputz the program include the radar system paradeters ai.' large data files that contain the characteristics of the ground clutter and the microburst. The ground clutter data file consists of high-resolu- tion (20m) calibrated Synthetic Aperture Radar (SAR) data of selected airport areas. The micro- burst data files provide reflectivity factors, x,y,z wind velocity components, and other meteoro- logical parameters with a resolution of 40 meters. This database is genekated by a numerical convec- tive cloud model2 driven by experimentally-deter- mined initial conditions, and represents selected time periods of the microburst development.
The radar simulation program is a comprehensive
For each range bin, the simulation calculates the received signal amplitude level by integrating the product of the antenna gain pattern and scat- tering source amplitude and phase over a spherical- shell volume segment defined by the pulse width. radar range and ground plane intersection. The amplitude of the return from each incremental scat- terer in the volume segment is proportional to either the square root of the normalized cross-sec- tion of th.e ground clutter (from the clutter map) or the square root of the reflectivity factor of the water droplets in the microburst (from the microburst data base). The phase of each incremen- tal scatterm-4s the sum of a uniformly distributed (0 - 2719 random phase term, a phase term due to relative aircraft-scatterer radial velocity, and normally-distributed random phase terms represent- ing transmitter/receiver phase jitter and ground clutter random motion. The random phase terms s i m - ulating phase jitter and ground clutter motion are updated for each transmizted pulse, while the uni- formly-distributed phase terms are updated for each sequence of pulses in a range bin. The phase terms representing aircraft-scatterer relative motion are linear functions of time.
Path attenuation for each incremental scatterer is determined by integrating the path losses over the transmission path. \isad to determine the incremental path losses from the liquid water content of the microburst. Air- craft ground velocity is assumed to be known accu- rately so that derived Doppler frequencies can be referenced to a value of zero corresponding to that velocity.
Empirical formulas4 are
Antenna patterns simulated include a generic parabolic antenna with size and aperture illumina- tton taper specified by input data, and a flat- plate array antenna with a pattern similar to that found in the current generation of X-band airborne veather radars.
216
.
.

In the simulation. a sequence of N pulses of in- phase (I) and quadrature (Q) signal amplitudes are calculated for each range bin as discussed above and subjected to ACC amplification and A/D quanti- zation. A simulated fast-acting ACC is used to adjust the gain of the system on a bin-by-bin basis to achieve a wide dynamic range and to prevent sig- nal saturation (due to clutter) prior to and during A/D conversion. The I and Q pulse stream is then digitally filtered to suppress ground clutter near zero Doppler frequencies and processed using both conventional pulse-pair and spectral averaging algorithms to derive the average velocity and spec- tral width of the scatterers in the range bin. Further processing of the velocity data provides information on windshear and aircraft hazard fac- tor.
I
.- Provision is made in the simulation to generate
returns from a specified number of range bins over a specified azimuth scan so that simulated color displays of reflectivity, velocity, windshear, spectral width, etc.. can be examined. Other out- puts of the simulation include plots of pover lev- els, velocity, spectral width, windshear hazard factor, and ACC levels vs. radar range. Doppler spectra of ground clutter and moisture as derived from the I and Q signals from each simulated range bin are also plotted.
Ucroburst Model As mentioned above. the microburat model is a
detailed numerical convective cloud and storm model that calculates the time history of the development of a microburst. The model uses a nonhydrostatic. compressible and unsteady set of governing equa- tions which are solved on a three-dimensional stag- gered grid. The computation can be initiatcd from observed data and generates realistic wind fields that compare favorably with observed data such as that obtained in the JAWS study5. simulations to date, a 4x4 km lattice of 40x40 meter grid spacing increments (tvo-dimensional axi- symmetric version) has been generated at selected time periods. Output parameters include the radar reflectivity factor (dBz), vind velocity compo- nents, temperature, equivalent potential ternpera- ture. pressure and moisture content (water vapor, ice, cloud droplets, rain, snow and hail/graupel). The model developed under NASA sponsorship is described in detail in references 2 and 5.
For the radar
For the radar simulation cases discussed in this paper, a typical "wet" microburst and a typical "dry" microburst were selected and used to investi- gate radar performance at a particular instant of time. velocity field of the axisymmetric "wet" microburst used in the radar simulation. The "dry" microburst is similar in form but with smaller dimensions, lower wind speeds, and much lower reflectivity lev-
, els. The "wet" microburst data are taken at 11 minutes after initiation of the microburst calcula- tion and the "dry" microburst data are 23 minutes after initiation. The "wet" microburst resembles sn axisymmetric version of the 2 August, 1985, Dal- las-Ft. Worth storm6 and the "dry" microburst is based on soundings taken on 14 July, 1982, within the JAWS network near Denver.
Figure 9 shows the reflectivity factors and
c- The ground clutter model used for the present
simulation cases is a high-resolution X-band SAR map of the Willow Run, Uichigan, airport area pro- vided by the Environmental Research Institute of Michigan (ERII).
The SAR image files produced by ERIN provide calibrated NRCS data with a resolution of 20m. Figure 10 shows a high resolution (3m) SAR image of Willow Run airport from which this data was derived and the runway (9R) used in the simulation runs. In the simulations, the aircraft is positioned at a selected distance from the runway touchdown point on a three-degree glide slope.
A problem with the use of existing SAR data is associated with the vhiation of cross section with depression angle. These data were taken at depres- sion angles ranging from approximately 18 to 50 degrees, whereas for the operational qirborne radar simulated the depression angles of interest are approximately 1 to 20 degrees, account for this difference, ERIU supplied an empirical depression-angle correction function that corrects the NRCS to the angle seen by the airborne radar. Since clutter sources from urban areas have cross sections that do not decrease significantly with depression angles in the ranges of interest. urban areas of the clutter map are excluded from this depression angle correction and the originally measured cross-section values are used in the simu- lation. A l s o , areas of the map with NRCS values equal to or greater than 5 dB are not corrected.
To partially
The corrections for depression angle are not entirely satisfactory,, and cause an uncertainty in the clutter calculations of the preliminary cases discussed in this paper. Flight experiments using the ERIM SAR instrument will be flown in the summer. and fall of 1988 to collect more representative airport clutter data with depression angles corre- sponding to those that would be seen by an airborne radar on the approach path. vide better information of depression angle raria- tion of NRCS for urban environments as well as other surfaces.
These data will pro-
217

IV. SIMlTUTED RADAR PERPORHANC&
"Wet" Microburst To examine the expected radar performance in
specific situations, several cases have been simu- lated, as illustrated in figure I, using the base- line system parameters given in table 1 and the ground clutter map from the Willow Run airport area. Figure 11 plots the SNR and SCR vs. radar range for a "wet" microburst that would be seen by the radar at a distance of 7 km from the runway touchdown point vith the antenna tilted up 2 deg from the projected aircraft path. axis is located on the projected path 2 km from the touchdovn point. The calculated reflectivity fac- tor of the vater droplets along a line correspond- ing to the projected aircraft path is also plotted in figure 11 for comparison to the simulated radar measurements. For this case, the SNR and SCR are high over the entire region of the microburst, vith a minimum value of SCR (lOdB) occurring at approxi- mately 3 km from touchdown. This minimum value is due to high clutter power from an urban area at this location. The S N R exceeds 20 dB over the range, with approximately 18 dB difference between the near side and far side of the microburst due to path attenuation and geometrical factors (in this plqt, the pover levels are not corrected for the
Figure 12 shows the calculation of the radial component of vind velocity derived from both pulse- pair and spectral averaging algorithms operating on 128 simulated I and Q pulses from the radar. This figure also plots, for comparison, the "trua" wind speed, defined as the velocity component along the center line of the antenna beam. It should be noted that the true velocity, as defined, will always differ somewhat from the radar-measured velocity because the true velocity is measured along a line (the antenna center line), whereas the radar system measures a weighted (by reflectivity and antenna pattern) average of the velocity over a finite volume of the microburst.
The microburst
RT loss).
A two-pole high-pass Buttervorth filter vas used to filter the I and Q pulses to suppress ground clutter. The 6 dB frequency response cutoff point is located at a Doppler frequency --relative to the A/C ground valocity-- corresponding to a radial component of wind velocity of 3 m/s, and the filter has two zeros at zero Doppler frequency. The effect of the clutter filter can be seen in figure 13. which is a plot of the Doppler spectrum in a range bin 4 km from the radar calculated vith and without the clutter filter. For simulated velocity measurements, a processing threshold of 4 dB is used (i.e., the pulse-pair and spectral averaged velocities are set to zero if the radar received power is less than 4 dB greater than the noise threshold).
The simulated velocity measurements are within 2 m/s of the "true" velocity for velocities greater than 5 m/s and indicate clearly the potentially hazardous windshear associated with the microburst. To more closely indicate the windshear hazard t n the aircraft, a measure called the F-factor or hazard index has been defined by B o ~ l e s . ~ index.is defined by the equation:
This
g V
where Wx is the rate of change of the component of wind velocity alopg the aircraft path, g is the acceleration of gravity, Wh is the vertical compo- nent of wind velocity and V is the aircraft velo- city. Values of F greater than 0 . 1 to 0.15 are considered hazardous to jet transport aircraft, considering aircraft type, configuration, and range of gross weight^.^
Although a forvard-looking radar sensor cannot directly measure the vertical wind component, the radial velocity component is measured directly. The first term in the equation for the F-factor can be derived from radar measurements of radial velo- city as follows:
where : dWx - change in radial velocity between adjacent 6Rg - distance between range bins FR - the radial component of the hazard index
This radial term is calculated in the simulation
range bins
from the velocity measurements as shown in figure 12 by averaging velocity differences over 5 range bins, and results in outputs as shown in figure 14. The radial term of the hazard factor reaches a max- imum value of 0.1 for this microburst. and both pulse-pair and spectral averaging algorithms give good measurements of the factor.
218

"Drv" Microburst
vere also made vith the "dry" microburst discussed previously. Figure 15.shovs the hazard index derived by these runs using the baseline system parameters operating at 9.3 CHz. The figure indi- cates that although the vindshear vas detected, the velocity measurement vith the baseline set of sys- tem parameters vas somevhat noisy.
Simulation runs similar to those discussed above
To improve the performance on the "dry" micro- burst, several system parameters can be changed. These trade-off studies have just been initiated. For example, to illustrate the radar performance at Ku-band, the dry microburst case discussed above vas simulated using the same set of baseline par- ameters, except the operating frequency vas changed to 15 CHz and the PRF vas changed to 4878 pulses per second. Results for the Ku-band system vith the dry microburst are shpwn in figures 16, 17, and 18. As may be seen, even though the SNR and SCR values are much lover than those vith the vet microburst. the vind velocity vas successfully measured over the hazardous part of the microburst. factor calculation clearly indicates the vindshear hazard associated vith this microburst.
Simulated Disulavs The radar simulation program provides for an
azimuth scan mode and the generation of simulated displays of several variables of interest. Figure 19 shows a black and vhite copy of a simulated (color) display of radial vind velocity for the %etn microburst vith the baseline set of radar parameters. Figure 20 is a aimulated plot of the radial term of the F-factor and clearly indicates that a potential vindshear hazard lies on the air- craft path. These displays should not be inter- preted as recommended displays for the aircrev. since the specific method of alerting the crew to a hazard requires extensive study, vhich is presently under way, and will most likely consist of a warn- ing light or alarm which may be supplemented by displays of additional information to aid the air- crew's decision-making process.
Future Simulation Develoumenc The simulation program will be improved in the
near future by incorporating more sophisticated signal processing techniques, models to represent moving ground clutter, and techniques for estimat- ing true, nuisance. and m i s s e d hazard alarms. Con- siderable effort is planned to incorporate and investigate a full range of microburst/clutter environments, provide improved displays of simula- tion output data for evaluating performance, and to conduct extensive tradeoff and optimization studies
The hazard
V. Concludinn Remarks
A preliminary tradeoff and assessment study vas conducted to evaluate the performance of airborne Doppler radar sensors to detect hazardous micro- burst vindshear during A/C landing. Using a preli- minary set of performance requirements for the design of foward-looking sensors, a baseline set of radar parameters vas developed for use in assessing vindshear detection performance using a radar simulation program. of the simulation program, vhich includes excellent models of microburst vind fields, realistic clutter maps of airports, and accurate models of Doppler radar operation and signal processing.
A description vas given
For the baseline Doppler radar sensor configura- tions modeled, prelialnary analyses of the computer simulation case studies shov that vindshear can be accurately detected 10 to 65 seconds in front of the aircraft approaching a hazardous microburst positioned in the flight path of landing aircraft . This vas accomplished using a bin-to-bin ACC. clut- ter filtering, limited detection range, and suit- able tilt management. The sensor is highly effec- tive for the "vet" microburst vhere very high SNR and SCR are obtainable due to large reflectivity levels. For the "dry" microburst. vith low reflec- tivity levels, vindshear vas detected, hovever. more tradeoff analyses and signal processing studies are needed before the performance for the "dry" microburst case can be fully assessed.
Initial simulations vere conducted vith a spe- cific airport, selected microburst time instants. and the base-line radar parameters. These simula- tions clearly-;hov that in realistic situations, downward-looking airborne radar sensors have the potential to detect vindshear and provide informa- tion to the aircrev that will permit escape or avoidance of hazardous shear situations. Plans are underway to investigate a full range of micro- burst/clutter environments, conduct extensive tra- deoff and optimization studies, and investigate various signal processing and clutter filtering concepts vhich can provide reliable windshear detect ion capability .
The initial simulation studies vere confined to the landing approach, since it presents the.most severe signal-to-clutter situation. Studies of the takeoff case are planned. Since the antenna can be tilted up, therefore providing high signal-to- clutter ratios, acceptable detection performance is anticipated for this case.
4
219

Although hazardous windshear can be detected by Doppler radar, the pilot must be alerted in a timely manner to avoid the hazard. A hazard index has been developed) vhich establishes when a threat to the performance of the A/C exists. The simula- tion studies shoved that a Doppler radar sensor can detect the horizontal component of this index with sufficient accuracy to indicate in a timely manner that a threat exists. Further studies using this index vi11 be conducted for various microburst types and locations relative to the A/C to assess the missed and nuisance alarm rate. Displays of additional advisory information for the aircrev will probably be required, and are under study. Output display examples from the simulation studies represent scne of the information that could be provided.
The present and future simulation studies vi11 provide a good foundation to determine the capabil- ities and limitations of Doppler radar concepts for the detection of microburst vindshear. experiments are needed to evaluate the simulation modeling and performance estimates. experiment program is planned for the 1990-91 time period. The first phase of flights vi11 involve measuring the clutter environment from selected airports during landing approaches. These data vi11 be used to evaluate the clutter map models derived from the SAR data. A second phase of flights will collect data from severe convective storms at alti- tudes above 2000 feet. These data will be combined with the clutter data to be used to evaluate the performance of various signal processing concepts. Flight tests for candidate concept evaluation and demonstration would follow.
Flight
A flight
VI. References
1. Staton, L. D.: "Airborne Doppler Radar For Wind Shear Detection." In workshop proceedings, "Windshear/Turbulence Inputs to Plight Simula- tion 6 Systems Certification." NASA CP 2474, July 1987.
2. Proctor, F. W.: "The Terminal Are6 Simulation System Vol. I: Theoretical Formulation." NASA CR 4046: DOT/FM/Pn-86/50, I. April 1987
3 . Bovles, R. L.; and Targ, R.: "Windshear Detec- tion and Avoidance: Airborne Systems Perspec- tive." Presented at 16th Congress of the ICAS Aug 28-Sept 2 , 1988, Jerusa~em. Israel.
4. Doviak, R . J.; and Zrnic, D. S.: "Doppler Radar and Weather Observations." Acadamic Press Inc. 1984.
5. Proctor, F. H.: "The Terminal Area SFmulation System Vol. 11: Verification Cares." NASA CR 4047: DOT/FM/PM-86/50, 11. April 1987
6. Bovles, R. L.; "Windshear Modeling: DFW Case Study", presented at conference "Windshear Detection Forvard-Looking Sensor Technology", NASA CP 10004: DOT/PM/PS-87/2. Oct. 1987
E S C " 7
Fig. 1 Sketch illushating the microburst vind- shear hazard for an approaching A/C, being probed by a radar beam. Potential impact path is shovn if escape or avoidance maneuver is not activated.
- 10dBz
20
-1 0
-20 IIIIIIIIIIIII 1 2 3 4 5 6 7 8 9 1 0 1 1 1 2
RADAR RANGE, km
Fig. 2 Signal-to-Noise performance for different reflectivity levels, A / C 10 km from touch- down, 9.3 CHz, P y 2 kv,r-l U S , Ant. Dia.930 in., Tilt-OO
40 r
30
20
% a' 10 2 UJ
0
t -1 0
-20 1 2 3 4 5 6 7 8 9 1 0 1 1 1 2
RADAR RANGE, km
Fig. 3 Signal-to-Noise performance for for 15 CHz. All other conditions the same as in Fig. 2 .
220
- Ant. Tilt Angle - 0' ..... .. Ant. Tilt Angle - 1
40 50 E
, '. .
~~
1 2 3 4 5 6 7 8
RADAR RANGE, km
Fig. 4 Clutter-to-Signal (CSR) vs range from A/C, using Willow Run clutter map. A/C 5 km from touchdovn;Ant. Az angle-OO, Ze-10 dBz. See table 2 for other parameter values.
.20 -lo* 1 2 3 4 5 6 7 8
RADAR RANGE, km
Fig. 5 Clutter-to-Signal (CSR) vs range from A/C for same conditions as fig. 4 except Ant. Az angle - l o o
" r Urban Tamots
f 7
w !: P 4 2
B 2 $ 1
g 3
0 -34.31 -28 -25 -22 -19 -16 -13-10 -7 -4 -1 2 5 8 11 14
. \.' NRCS. d0
Fig. 6 :.Histogram plot of range of NRCS levels con- tained in the Willov Run Airport clutter map.
20 30 k- CSA - 18.2 dB
m 9 10 a B !lo
.10
-200 -1 -2 3 4 -5 d -7 8 -9 -10 VELOCIPI. m/s
Fig. 7 Normalized clutter spectral density plot for 2.5 km ralrge bin. A/C 5 km from touch- d o n , Ant. Tilt-Z', Az-0'. Ze-10 dBz
Radar Parameters Antenna Patterns A/C Pos., Microburst Pos.
L
Add System Noise & Jitter
Calculate Range Bin
L
Simulated AGC 8
Processing
Signal Levels Clutter Levels Derived Velocity Shear Hazard Index Turbulence Doppler Spectra
FIB. 0 Block diagram of the radar simulation pro- gram shoving the major features of the sim- ulat ion.
22 1

Fig. 9 Reflectivity co:itours and velocity field for the axfs:,m:Jetric "vet" microburst model used for initial radar performance simula- tions studies.
Fig. 10 High resolution SAR image of the W i l l o w Run, MI airpoLt area. NRCS map, produced from this image data base, is used to cal- culate the ground clutter return in the radar sfnulation program.
6o r . .L\, I
40-
N
B B : $ 0 ' d
L 20 -
-20 .-- . . . . .. , 5CR. rlt . SNR, dtj
----. Refledivty, d8r
0 2 4 1 1 - -
.E. -4 2 -60 "
a A W E To TOUCI-IDOWN. km
Pig. 11 Plot of caiculated SNR, SCR and reflecti- vity factor vs range to touchdown for the "vet" microburst. Aircraft located - 7 h from touchdsvn on 3 O glide slope, radar antenna t i l t = ZO, microburst centered on projected flight path - 2 h from the touch- down point, freq - 9.3 C H z .
- PULSE-PAIR .._._ -. SPECTRAL AVR. ---. TRUE m301 20
. E. 10
u S O >
-1 0
.l n 7 4 -20 -0 -4 -c " -
RANGE TO TOUCHDOWN.^^ Fig. 12 Radar wind velocity measurement vs range to
touchdown; same conditions as in figure 11. In this plot, positive velocities represent headwinds.
.90 I
. T
-140 ' -20 -15 -10 -5 0 5 10 15 20
VELOCIM. d 9
Fig. 13 Plot of Doppler spectrum from radar range bin 4km from touchdown, prior to wind velo- city estimation, showing effect of 2-pole filter used to suppress ground clutter.
.3 '4 F - PulssPair ..__.... Spectral Avr. -.-- TNO
.2 k 3 I -.l F
-.2 -.3 t br -.4
-6 -4 -2 0 2 4
RANGE TO TOUCHDOWN. km Fig. 14 Hazard index vs. range to touchdown derived
from the velocities shown in figure 12. Index is calculated from average velocity differences over 5 range cells (750m).
c
222

- Pulse-Pair ---._._. Spectral Avr. ---- True
.1
0 r O z
f -.1
-.2
-3 1 I -.4
-6 -4 -2 0 2 4 RANGE TO TOUCHDOWN, km
Fig. 15 Hazard index vs. range to touchdovn derived from the "dry" microburst velocities using the baseline parameters, and conditions listed in fig. 11, freq. - 9.3 C H z .
T 40
-6 .4 -2 RANGE TO TOUCH1
2 4 IWN. km
' Fig. 16 Plot of calculated SNR, SCR and reflecti- vity factor vs range to touchdown for the "dry" rnicrobyrst, and conditions listed in fig. 11, except freq. - 15 CHz.
- PULSE-PAIR ....... SPECTRAL AVA.
30 r ---. TRUE
-I0 t -70 ' --
-6 -4 -2 0 2 4 RANGE TO TOUCHDOWN, krn
Fig. 17 Radar wind velocity measurement vs range to touchdown under same conditions as those of figure 16. The noise spikes are due to low SCR from urban clutter ( - 3 k m ) , and other clutter sources (+3km) where reflectivity levels are low.
- Pulse-Pair _.._.... Spectral Avr. T N ~ -.-.
-3 -'2 L -.4 -
-6 -4 -2 0 2 4 RANGE TO TOUCHDOWN, km
Fig. 18 Hazard index vs. range to touchdovn derived from the "dry" microburst velocittes shown in figure 17.
223

2 lo 0
-2 1
1 k - .---+v /
\
\ \ -*- / a
Range (km)
X "
l i s 9 Wind Speed
0 (m/d
-1 2 -1 5 = -18
.03 0.0 -.03 -.OS -.08 - i n . ." -.13 -.15 -.18
12
Fig. 19 Range-azimuth display of wind velocity con- tours for the "wet" mfcroburst, baseline radar parameters, and conditions listed in fig. 11. and wind direction change is clearly shown.
The large head to tail velocity
0 -2 1 21
F-f act or
?
Pig. 20 Range-azimuth display of hazard index (P-factor) contours for the "wet" micro- burst, same conditions as fig. 19. The potential shear hazard area is clearly shown.
224