C 8 Graphs and Graphing Linear Equations -...
32
www.ck12.org C HAPTER 8 Graphs and Graphing Linear Equations Chapter Outline 8.1 THE COORDINATE PLANE 8.2 WHAT MAKES A GOOD GRAPH 8.3 GRAPH A LINEAR EQUATION 8.4 GRAPHING USING I NTERCEPTS The ability to graph linear equations is important in mathematics. In fact, graphing equations and solving equations are two of the most important concepts in mathematics. If you master these, all mathematical subjects will be much easier, even Calculus! This chapter focuses on the visual representations of data. You will learn how graphs are created using the Coordinate Plane and how to create and interpret graphs using sets of data. Finally, you will learn what defines a good graph and what mistakes to avoid when creating a graph. 132
Transcript of C 8 Graphs and Graphing Linear Equations -...

www.ck12.org
CHAPTER 8 Graphs and GraphingLinear Equations
Chapter Outline8.1 THE COORDINATE PLANE
8.2 WHAT MAKES A GOOD GRAPH
8.3 GRAPH A LINEAR EQUATION
8.4 GRAPHING USING INTERCEPTS
The ability to graph linear equations is important in mathematics. In fact, graphing equations and solving equationsare two of the most important concepts in mathematics. If you master these, all mathematical subjects will be mucheasier, even Calculus!
This chapter focuses on the visual representations of data. You will learn how graphs are created using the CoordinatePlane and how to create and interpret graphs using sets of data. Finally, you will learn what defines a good graphand what mistakes to avoid when creating a graph.
132

www.ck12.org Chapter 8. Graphs and Graphing Linear Equations
8.1 The Coordinate Plane
Introduction
Lydia lives 2 blocks north and one block east of school; Travis lives three blocks south and two blocks west ofschool. What’s the shortest line connecting their houses?
The Coordinate Plane
We’ve seen how to represent numbers using number lines; now we’ll see how to represent sets of numbers usinga coordinate plane. The coordinate plane can be thought of as two number lines that meet at right angles. Thehorizontal line is called the x−axis and the vertical line is the y−axis. Together the lines are called the axes, and thepoint at which they cross is called the origin. The axes split the coordinate plane into four quadrants, which arenumbered sequentially (I, II, III, IV) moving counter-clockwise from the upper right.
Identify Coordinates of Points
When given a point on a coordinate plane, it’s easy to determine its coordinates. The coordinates of a point are twonumbers - written together they are called an ordered pair. The numbers describe how far along the x−axis andy−axis the point is. The ordered pair is written in parentheses, with the x−coordinate (also called the abscissa) firstand the y−coordinate (or the ordinate) second.
133

8.1. The Coordinate Plane www.ck12.org
(1,7) An ordered pair with an x−value of one and a y−value of seven
(0,5) An ordered pair with an x−value of zero and a y−value of five
(−2.5,4) An ordered pair with an x−value of -2.5 and a y−value of four
(−107.2,−0.005) An ordered pair with an x−value of -107.2 and a y−value of −0.005
Identifying coordinates is just like reading points on a number line, except that now the points do not actually lie onthe number line! Look at the following example.
Example 1
Find the coordinates of the point labeled P in the diagram above
Solution
Imagine you are standing at the origin (the point where the x−axis meets the y−axis). In order to move to a positionwhere P was directly above you, you would move 3 units to the right (we say this is in the positive x−direction).
The x−coordinate of P is +3.
Now if you were standing at the 3 marker on the x−axis, point P would be 7 units above you (above the axis meansit is in the positive y direction).
The y−coordinate of P is +7.
The coordinates of point P are (3, 7).
Example 2
134

www.ck12.org Chapter 8. Graphs and Graphing Linear Equations
Find the coordinates of the points labeled Q and R in the diagram to the right.
Solution
In order to get to Q we move three units to the right, in the positive x−direction, then two units down. This time weare moving in the negative y−direction. The x−coordinate of Q is +3, the y−coordinate of Q is −2.
The coordinates of R are found in a similar way. The x−coordinate is +5 (five units in the positive x−direction) andthe y−coordinate is again −2.
The coordinates of Q are (3, −2). The coordinates of R are (5, −2).
Example 3
Triangle ABC is shown in the diagram to the right. Find the coordinates of the vertices A,B and C.
135

8.1. The Coordinate Plane www.ck12.org
Point A:
x− coordinate =−2
y− coordinate =+5
Point B:
x− coordinate =+3
y− coordinate =−3
Point C:
x− coordinate =−4
y− coordinate =−1
Solution
A(−2,5)
B(3,−3)
C(−4,−1)
Plot Points in a Coordinate Plane
Plotting points is simple, once you understand how to read coordinates and read the scale on a graph. As a note onscale, in the next two examples pay close attention to the labels on the axes.
Example 4
Plot the following points on the coordinate plane.
A(2,7) B(−4,6) D(−3,−3) E(0,2) F(7,−5)
136

www.ck12.org Chapter 8. Graphs and Graphing Linear Equations
Point A(2,7) is 2 units right, 7 units up. It is in Quadrant I.
Point B(−4,6) is 4 units left, 6 units up. It is in Quadrant II.
Point D(−3,−3) is 3 units left, 3 units down. It is in Quadrant III.
Point E(0,2) is 2 units up from the origin. It is right on the y−axis, between Quadrants I and II.
Point F(7,−5) is 7 units right, 5 units down. It is in Quadrant IV.
Example 5
Plot the following points on the coordinate plane.
A(2.5,0.5) B(π,1.2) C(2,1.75) D(0.1,1.2) E(0,0)
Here we see the importance of choosing the right scale and range for the graph. In Example 4, our points werescattered throughout the four quadrants. In this case, all the coordinates are positive, so we don’t need to show thenegative values of x or y. Also, there are no x−values bigger than about 3.14, and 1.75 is the largest value of y. Wecan therefore show just the part of the coordinate plane where 0≤ x≤ 3.5 and 0≤ y≤ 2.
Here are some other important things to notice about this graph:
137

8.1. The Coordinate Plane www.ck12.org
• The tick marks on the axes don’t correspond to unit increments (i.e. the numbers do not go up by one eachtime). This is so that we can plot the points more precisely.
• The scale on the x−axis is different than the scale on the y−axis, so distances that look the same on both axesare actually greater in the x−direction. Stretching or shrinking the scale in one direction can be useful whenthe points we want to plot are farther apart in one direction than the other.
• The tick marks are equally spaced on each axis. The axes are like number lines - it is important that each tickmark represents the same increment.
For more practice locating and naming points on the coordinate plane, try playing the Coordinate Plane Game athttp://tinyurl.com/72myodv.
Practice Set
Sample explanations for some of the practice exercises below are available by viewing the following video. Notethat there is not always a match between the number of the practice exercise in the video and the number of thepractice exercise listed in the following exercise set. However, the practice exercise is the same in both. CK-12 Basic Algebra:TheCoordinate Plane (6:50)
MEDIAClick image to the left for more content.
In questions 1-6, identify the coordinate of the given letter.
1. D2. A3. F4. E5. B6. C
138

www.ck12.org Chapter 8. Graphs and Graphing Linear Equations
Graph the following ordered pairs on one Cartesian plane. Identify the quadrant where each ordered pair is located.
7. (4, 2)8. (-3, 5.5)9. (4, -4)
10. (-2, -3)11.
(12 ,−
34
)12. (-0.75, 1)13.
(−2 1
2 ,−6)
14. (1.60, 4.25)
Using the directions given in each problem, find and graph the coordinates on a Cartesian plane.
15. Six left, four down16. One-half right, one-half up17. Three right, five down18. Nine left, seven up19. Four and one-half left, three up20. Eight right, two up21. One left, one down22. One right, three-quarter down23. Plot the vertices of triangle ABC : (0,0),(4,−3),(6,2)24. The following three points are three vertices of square ABCD. Plot them on a coordinate plane then determine
what the coordinates of the fourth point, D, would be. Plot that point and label it. A(−4,−4) B(3,−4)C(3,3)25. Does the ordered pair (2, 0) lie in a quadrant? Explain your thinking.26. Why do you think (0, 0) is called the origin?27. Ian has the following collection of data. Graph the ordered pairs and make a conclusion from the graph.
TABLE 8.1:
Year % of Men Employed in the United States1973 75.51980 72.01986 71.0
139

8.1. The Coordinate Plane www.ck12.org
TABLE 8.1: (continued)
Year % of Men Employed in the United States1992 69.81997 71.32002 69.72005 69.62007 69.82009 64.5
Words of Wisdom from the Graphing Plane
Not all axes will be labeled for you. There will be many times you are required to label your own axes. Someproblems may require you to graph only the first quadrant. Others need two or all four quadrants. The tic marks donot always count by ones. They can be marked in increments of 2, 5, or even 1
2 . The axes do not even need to havethe same increments! The Cartesian plane below shows an example of this.
The increments by which you count your axes should MAXIMIZE the clarity of the graph.
140

www.ck12.org Chapter 8. Graphs and Graphing Linear Equations
8.2 What makes a good graph
When creating a graph, there are guidelines to follow to ensure that it is easy to read and easy to interpret.
1. The horizontal axis should be properly labeled with the name and units of the input variable.2. The vertical axisshould be properly labeled with the name and units of the output variable.3. Use an appropriate scale.
• Start at or just below the lowest replacement value.• End at or just above the highest replacement value.• Scale the graph so the adjacent tick marks are equal distance apart.• Use numbers that make sense for the given data set.• The axes meet at (0,0) Use a “//” between the origin and the first tick mark if the scale does not begin at 0.
Example 1
The graph shown in Example 3 is a very good example of how a graph should be created. It has all the elements ofa good graph as noted above.
1. Both the horizontal axis and vertical axis are labeled with the name of the variable and the unit. The horizontalaxis has the variable name Weight and the unit Pounds (lbs) The vertical axis is labeled with the variable nameLength and the unit Inches. If the units were not included, there would be no way to know what unit of weightor length was being used
2. The horizontal and vertical scales both start with 0 and are consistent. Note that they are not the same scale.Weight changes by a scale of 1 and Length changes by a scale of 5.
3. The numbers for both scales make sense for the data and make good use of the space available.4. The data points are labeled with the x and y value
Example 2
141

8.2. What makes a good graph www.ck12.org
The last example that we are going to look at in this lesson is an example of a "bad" graph. It has examples ofeverything you should "not" do when creating a graph.
FIGURE 8.1
1. The Horizontal Axis does not have the units. It is impossible to tell if Time is being measured in Minutes,Seconds or something else.
2. The Vertical Axis does not have the Variable Name. What is being measured in Feet?3. The horizontal scale is not consistent and the vertical scale does not start at 04. The graph makes very poor use of the available space
Remember as you create your graphs that labeling is critical. It is important that the graph be both readable andaccurate. Follow the guidelines above at all times to ensure good practice.
Analyzing Graphs
We often use graphs to represent relationships between two linked quantities. It’s useful to be able to interpret theinformation that graphs convey. For example, the chart below shows a fluctuating stock price over ten weeks. Youcan read that the index closed the first week at about $68, and at the end of the third week it was at about $62. Youmay also see that in the first five weeks it lost about 20% of its value, and that it made about 20% gain betweenweeks seven and ten. Notice that this relationship is discrete, although the dots are connected to make the grapheasier to interpret.
Analyzing graphs is a part of life - whether you are trying to decide to buy stock, figure out if your blog readershipis increasing, or predict the temperature from a weather report. Many graphs are very complicated, so for nowwe’ll start off with some simple linear conversion graphs. Algebra starts with basic relationships and builds to morecomplicated tasks, like reading the graph above.
142

www.ck12.org Chapter 8. Graphs and Graphing Linear Equations
Example 3
Below is a graph for converting marked prices in a downtown store into prices that include sales tax. Use the graphto determine the cost including sales tax for a $6.00 pen in the store.
To find the relevant price with tax, first find the correct pre-tax price on the x−axis. This is the point x = 6.
Draw the line x = 6 up until it meets the function, then draw a horizontal line to the y−axis. This line hits at y≈ 6.75(about three fourths of the way from y = 6 to y = 7).
The approximate cost including tax is $6.75.
Example 4
The chart for converting temperature from Fahrenheit to Celsius is shown to the right. Use the graph to convert thefollowing:
a) 70◦ Fahrenheit to Celsius
b) 0◦ Fahrenheit to Celsius
143

8.2. What makes a good graph www.ck12.org
c) 30◦ Celsius to Fahrenheit
d) 0◦ Celsius to Fahrenheit
Solution
a) To find 70◦ Fahrenheit, we look along the Fahrenheit-axis (in other words the x−axis) and draw the line x = 70up to the function. Then we draw a horizontal line to the Celsius-axis (y−axis). The horizontal line hits the axis at alittle over 20 (21 or 22).
70◦ Fahrenheit is approximately equivalent to 21◦ Celsius.
b) To find 0◦ Fahrenheit, we just look at the y−axis. (Don’t forget that this axis is simply the line x = 0.) The linehits the y−axis just below the half way point between −15 and −20.
0◦ Fahrenheit is approximately equivalent to −18◦ Celsius.
c) To find 30◦ Celsius, we look up the Celsius-axis and draw the line y = 30 along to the function. When thishorizontal line hits the function, we draw a line straight down to the Fahrenheit-axis. The line hits the axis atapproximately 85.
30◦ Celsius is approximately equivalent to 85◦ Fahrenheit.
d) To find 0◦ Celsius, we look at the Fahrenheit-axis (the line y = 0). The function hits the x−axis just right of 30.
0◦ Celsius is equivalent to 32◦ Fahrenheit.
Example 5
Here is an example of a graph you might see reported in the news. Most mainstream scientists believe that increasedemissions of greenhouse cases, particularly carbon dioxide, are contributing to the warming of the planet. The graphbelow illustrates how carbon dioxide levels have increased as the world has industrialized.
From this graph, we can find the concentration of carbon dioxide found in the atmosphere in different years.
1900 - 285 parts per million
1930 - 300 parts per million
1950 - 310 parts per million
1990 - 350 parts per million
144

www.ck12.org Chapter 8. Graphs and Graphing Linear Equations
Practice Set
1. The students at a local high school took The Youth Risk Behavior Survey. The graph below shows the percentageof high school students who reported that they were current smokers. A person qualifies as a current smoker ifhe/she has smoked one or more cigarettes in the past 30 days. What percentage of high-school students were currentsmokers in the following years?
1. 19912. 19963. 20044. 2005
2. The graph below shows the average life-span of people based on the year in which they were born. Thisinformation comes from the National Vital Statistics Report from the Center for Disease Control. What is theaverage life-span of a person born in the following years?
1. 19402. 19553. 19804. 1995
145

8.2. What makes a good graph www.ck12.org
3. The graph below shows the median income of an individual based on his/her number of years of education. Thetop curve shows the median income for males and the bottom curve shows the median income for females. (Source:US Census, 2003.) What is the median income of a male who has the following years of education?
1. 10 years of education2. 17 years of education3. What is the median income of a female who has the same years of education?4. 10 years of education5. 17 years of education
4. The graph below shows a conversion chart for converting between weight in kilograms and weight in pounds.Use it to convert the following measurements.
146

www.ck12.org Chapter 8. Graphs and Graphing Linear Equations
1. (a) 4 kilograms into weight in pounds(b) 9 kilograms into weight in pounds(c) 12 pounds into weight in kilograms(d) 17 pounds into weight in kilograms
5. Use the graph from problem 4 to answer the following questions.
a. An employee at a sporting goods store is packing 3-pound weights into a box that can hold 8 kilograms. Howmany weights can she place in the box?b. After packing those weights, there is some extra space in the box thatshe wants to fill with one-pound weights. How many of those can she add?c. After packing those, she realizes shemisread the label and the box can actually hold 9 kilograms. How many more one-pound weights can she add?
147

8.3. Graph a Linear Equation www.ck12.org
8.3 Graph a Linear Equation
In mathematics, we tend to use the words formula and equation to describe the rules we get when we expressrelationships algebraically. Interpreting and graphing these equations is an important skill that youll use frequentlyin math.
Example 1
A taxi costs more the further you travel. Taxis usually charge a fee on top of the per-mile charge to cover hire of thevehicle. In this case, the taxi charges $3 as a set fee and $0.80 per mile traveled. Here is the equation linking thecost in dollars (y) to hire a taxi and the distance traveled in miles (x).
y = 0.8x+3
Graph the equation and use your graph to estimate the cost of a seven-mile taxi ride.
Solution
Well start by making a table of values. We will take a few values for x (0, 1, 2, 3, and 4), find the correspondingy−values, and then plot them. Since the question asks us to find the cost for a seven-mile journey, we need to choosea scale that can accommodate this.
First, heres our table of values:
TABLE 8.2:
x y0 31 3.82 4.63 5.44 6.2
And heres our graph:
148

www.ck12.org Chapter 8. Graphs and Graphing Linear Equations
To find the cost of a seven-mile journey, first we find x = 7 on the horizontal axis and draw a line up to our graph.Next, we draw a horizontal line across to the y−axis and read where it hits. It appears to hit around half way betweeny = 8 and y = 9. Let’s call it 8.5.
A seven mile taxi ride would cost approximately $8.50 ($8.60 exactly).
Here are some things you should notice about this graph and the formula that generated it:
• The graph is a straight line (this means that the equation is linear).• The graph crosses the y−axis at y = 3 (notice that theres a+3 in the equationthats not a coincidence!). This
is the base cost of the taxi.• Every time we move over by one square we move up by 0.8 squares (notice that thats also the coefficient of x
in the equation). This is the rate of charge of the taxi (cost per mile).• If we move over by three squares, we move up by 3×0.8 squares.
Example 2
A small business has a debt of $500,000 incurred from start-up costs. It predicts that it can pay off the debt at arate of $85,000 per year according to the following equation governing years in business (x) and debt measured inthousands of dollars (y).
y =−85x+500
Graph the above equation and use your graph to predict when the debt will be fully paid.
Solution
First, we start with our table of values:
TABLE 8.3:
x y0 5001 415
149

8.3. Graph a Linear Equation www.ck12.org
TABLE 8.3: (continued)
x y2 3303 2454 160
Then we plot our points and draw the line that goes through them:
Notice the scale weve chosen here. Theres no need to include any points above y = 500, but its still wise to allow alittle extra.
Next we need to determine how many years it takes the debt to reach zero, or in other words, what x−value willmake the y−value equal 0. We know its greater than four (since at x = 4 the y−value is still positive), so we needan x−scale that goes well past x = 4. Here weve chosen to show the x−values from 0 to 12, though there are manyother places we could have chosen to stop.
To read the time that the debt is paid off, we simply read the point where the line hits y = 0 (the x−axis). It looks asif the line hits pretty close to x = 6. So the debt will definitely be paid off in six years.
To see more simple examples of graphing linear equations by hand, see the Khan Academy video on graphing linesat http://tinyurl.com/7m2o2ya. The narrator shows how to graph several linear equations, using a table of valuesto plot points and then connecting the points with a line.
Graphs and Equations of Horizontal and Vertical Lines
Example 3
Mad-cabs have an unusual offer going on. They are charging $7.50 for a taxi ride of any length within the city limits.Graph the function that relates the cost of hiring the taxi (y) to the length of the journey in miles (x).
To proceed, the first thing we need is an equation. You can see from the problem that the cost of a journey doesntdepend on the length of the journey. It should come as no surprise that the equation then, does not have x in it. Sinceany value of x results in the same value of y(7.5), the value you choose for x doesnt matter, so it isnt included in theequation. Here is the equation:
150

www.ck12.org Chapter 8. Graphs and Graphing Linear Equations
y = 7.5
The graph of this function is shown below. You can see that its simply a horizontal line.
Any time you see an equation of the form y = constant, the graph is a horizontal line that intercepts the y−axis atthe value of the constant.
Similarly, when you see an equation of the form x = constant, then the graph is a vertical line that intercepts thex−axis at the value of the constant. (Notice that that kind of equation is a relation, and not a function, because eachx−value (theres only one in this case) corresponds to many (actually an infinite number) y−values.)
Example 4
Plot the following graphs.
(a) y = 4
(b) y =−4
(c) x = 4
(d) x =−4
151

8.3. Graph a Linear Equation www.ck12.org
(a) y = 4 is a horizontal line that crosses the y−axis at 4.
(b) y =−4 is a horizontal line that crosses the y−axis at 4.
(c) x = 4 is a vertical line that crosses the x−axis at 4.
(d) x =−4 is a vertical line that crosses the x−axis at 4.
Example 5
Find an equation for the x−axis and the y−axis.
Look at the axes on any of the graphs from previous examples. We have already said that they intersect at the origin(the point where x = 0 and y = 0). The following definition could easily work for each axis.
x−axis: A horizontal line crossing the y−axis at zero.
y−axis: A vertical line crossing the x−axis at zero.
So using example 3 as our guide, we could define the x−axis as the line y = 0 and the y−axis as the line x = 0.
Lesson Summary
• Equations with the variables y and x can be graphed by making a chart of values that fit the equation and thenplotting the values on a coordinate plane. This graph is simply another representation of the equation and canbe analyzed to solve problems.
• Horizontal lines are defined by the equation y = constant and vertical lines are defined by the equation x =constant.
• Be aware that although we graph the function as a line to make it easier to interpret, the function may actuallybe discrete.
Practice Set
1. Make a table of values for the following equations and then graph them.
(a) y = 2x+7(b) y = 0.7x−4(c) y = 6−1.25x
2. Think of a number. Multiply it by 20, divide the answer by 9, and then subtract seven from the result.
152

www.ck12.org Chapter 8. Graphs and Graphing Linear Equations
(a) Make a table of values and plot the function that represents this sentence.(b) If you picked 0 as your starting number, what number would you end up with?(c) To end up with 12, what number would you have to start out with?
3. Write the equations for the five lines (A through E) plotted in the graph below.
4. In the graph above, at what points do the following lines intersect?
(a) A and E(b) A and D(c) C and D(d) B and the y−axis(e) E and the x−axis(f) C and the line y = x(g) E and the line y = 1
2 x(h) A and the line y = x+3
5. At the airport, you can change your money from dollars into euros. The service costs $5, and for everyadditional dollar you get 0.7 euros.
(a) Make a table for this and plot the function on a graph.(b) Use your graph to determine how many euros you would get if you give the office $50.(c) To get 35 euros, how many dollars would you have to pay?(d) The exchange rate drops so that you can only get 0.5 euros per additional dollar. Now how many dollars
do you have to pay for 35 euros?
153

8.4. Graphing Using Intercepts www.ck12.org
8.4 Graphing Using Intercepts
Introduction
Sanjits office is 25 miles from home, and in traffic he expects the trip home to take him an hour if he starts at 5 PM.Today he hopes to stop at the post office along the way. If the post office is 6 miles from his office, when will Sanjitget there?
If you know just one of the points on a line, youll find that isnt enough information to plot the line on a graph. Asyou can see in the graph above, there are many linesin fact, infinitely many linesthat pass through a single point. Butwhat if you know two points that are both on the line? Then theres only one way to graph that line; all you need todo is plot the two points and use a ruler to draw the line that passes through both of them.
There are a lot of options for choosing which two points on the line you use to plot it. In this lesson, well focus on twopoints that are rather convenient for graphing: the points where our line crosses the x−and y−axes, or intercepts.Well see how to find intercepts algebraically and use them to quickly plot graphs.
154

www.ck12.org Chapter 8. Graphs and Graphing Linear Equations
Look at the graph above. The y−intercept occurs at the point where the graph crosses the y−axis. The y−value atthis point is 8, and the x−value is 0.
Similarly, the x−intercept occurs at the point where the graph crosses the x−axis. The x−value at this point is 6,and the y−value is 0.
So we know the coordinates of two points on the graph: (0, 8) and (6, 0). If wed just been given those two coordinatesout of the blue, we could quickly plot those points and join them with a line to recreate the above graph.
Note: Not all lines will have both an x−and a y−intercept, but most do. However, horizontal lines never cross thex−axis and vertical lines never cross the y−axis.
For examples of these special cases, see the graph below.
Finding Intercepts
Example 1
155

8.4. Graphing Using Intercepts www.ck12.org
Find the intercepts of the line y = 13− x and use them to graph the function.
Solution
The first intercept is easy to find. The y−intercept occurs when x = 0. Substituting gives us y = 13−0 = 13, so they−intercept is (0, 13).
Similarly, the x−intercept occurs when y = 0. Plugging in 0 for y gives us 0 = 13− x, solving this equation for xgives us x = 13. So (13, 0) is the x−intercept.
To draw the graph, simply plot these points and join them with a line.
Example 2
Graph the following equations by finding intercepts.
a) y = 2x+3
b) y = 7−2x
c) 4x−2y = 8
d) 2x+3y =−6
Solution
a) Find the y−intercept by plugging in x = 0 :
y = 2 ·0+3 = 3 − the y− intercept is (0,3)
Find the x−intercept by plugging in y = 0 :
0 = 2x+3 − subtract 3 f rom both sides :
−3 = 2x −divide by 2 :
−32= x − the x− intercept is (−1.5,0)
156
www.ck12.org Chapter 8. Graphs and Graphing Linear Equations
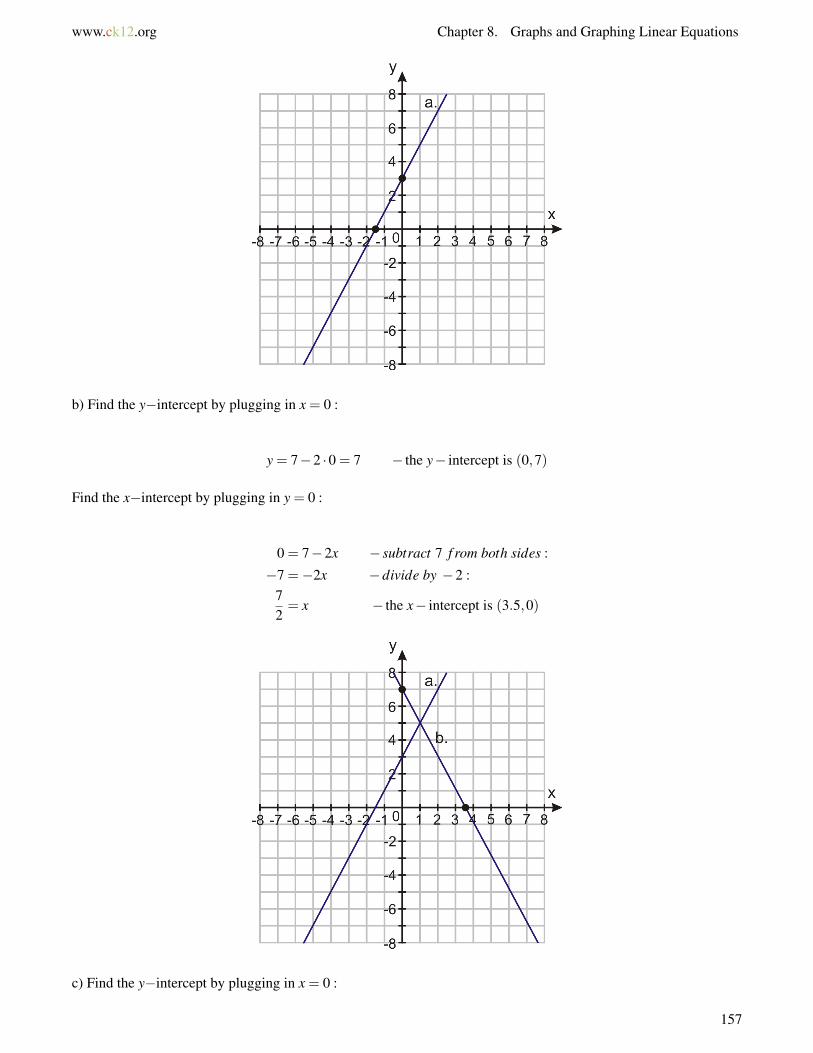
b) Find the y−intercept by plugging in x = 0 :
y = 7−2 ·0 = 7 − the y− intercept is (0,7)
Find the x−intercept by plugging in y = 0 :
0 = 7−2x − subtract 7 f rom both sides :
−7 =−2x −divide by −2 :72= x − the x− intercept is (3.5,0)
c) Find the y−intercept by plugging in x = 0 :
157

8.4. Graphing Using Intercepts www.ck12.org
4 ·0−2y = 8
−2y = 8 −divide by −2
y =−4 − the y− intercept is (0,−4)
Find the x−intercept by plugging in y = 0 :
4x−2 ·0 = 8
4x = 8 −divide by 4 :
x = 2 − the x− intercept is (2,0)
d) Find the y−intercept by plugging in x = 0 :
2 ·0+3y =−6
3y =−6 −divide by 3 :
y =−2 − the y− intercept is (0,−2)
Find the x−intercept by plugging in y = 0 :
2x+3 ·0 =−6
2x =−6 −divide by 2 :
x =−3 − the x− intercept is (−3,0)
158

www.ck12.org Chapter 8. Graphs and Graphing Linear Equations
Finding Intercepts for General (Standard) Form Equations Using the Cover-Up Method
Look at the last two equations in the previous example. These equations are written in general form. General formequations are always written coefficient times x plus (or minus) coefficient times y equals value. In other words,they look like this:
ax+by = c
There is a neat method for finding intercepts in standard form, often referred to as the cover-up method.
Example 3
Find the intercepts of the following equations:
a) 7x−3y = 21
b) 12x−10y =−15
c) x+3y = 6
Solution
To solve for each intercept, we realize that at the intercepts the value of either xor y is zero, and so any terms thatcontain that variable effectively drop out of the equation. To make a term disappear, simply cover it (a finger is anexcellent way to cover up terms) and solve the resulting equation.
a) To solve for the y−intercept we set x = 0 and cover up the x−term:
−3y = 21y =−7 (0,−7) is the y− intercept.
Now we solve for the x−intercept:
159

8.4. Graphing Using Intercepts www.ck12.org
7x = 21x = 3 (3,0) is the x− intercept.
b) To solve for the y−intercept (x = 0), cover up the x−term:
−10y =−15y = 1.5 (0,1.5) is the y− intercept.
Now solve for the x−intercept (y = 0):
12x =−15x =−5
4 (−1.25,0) is the x− intercept.
c) To solve for the y−intercept (x = 0), cover up the x−term:
3y = 6y = 2 (0,2) is the y− intercept.
Solve for the y−intercept:
x = 6 (6,0) is the x− intercept.
The graph of these functions and the intercepts is below:
160

www.ck12.org Chapter 8. Graphs and Graphing Linear Equations
To learn more about equations in standard form, try the Java applet at http://www.analyzemath.com/line/line.htm(scroll down and click the click here to start button.) You can use the sliders to change the values of a,b, and c andsee how that affects the graph.
Solving Real-World Problems Using Intercepts of a Graph
Example 4
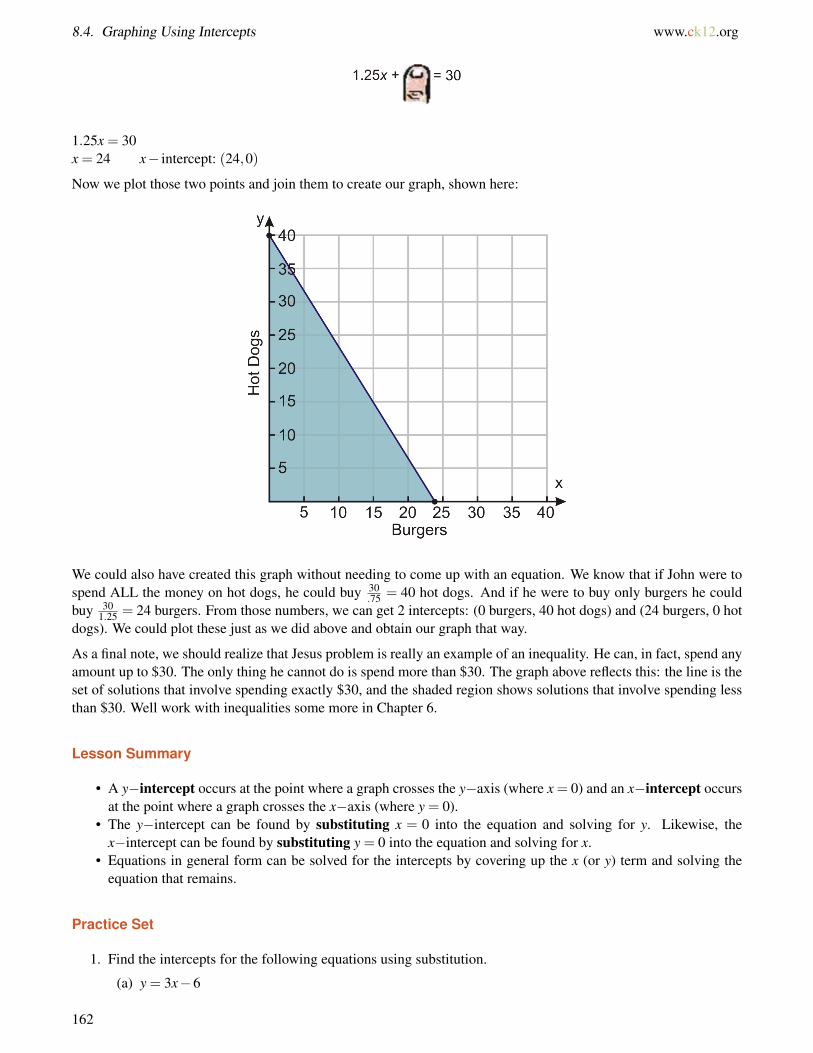
Jessie has $30 to spend on food for a class barbecue. Hot dogs cost $0.75 each (including the bun) and burgers cost$1.25 (including the bun). Plot a graph that shows all the combinations of hot dogs and burgers he could buy forthe barbecue, without spending more than $30.
This time we will find an equation first, and then we can think logically about finding the intercepts.
If the number of burgers that Jessie buys is x, then the money he spends on burgers is 1.25x
If the number of hot dogs he buys is y, then the money he spends on hot dogs is 0.75y
So the total cost of the food is 1.25x+0.75y.
The total amount of money he has to spend is $30, so if he is to spend it ALL, we can use the following equation:
1.25x+0.75y = 30
We can solve for the intercepts using the cover-up method. First the y−intercept
0.75y = 30y = 40 y− intercept: (0,40)
Then the x−intercept (y = 0):
161
8.4. Graphing Using Intercepts www.ck12.org
1.25x = 30x = 24 x− intercept: (24,0)
Now we plot those two points and join them to create our graph, shown here:
We could also have created this graph without needing to come up with an equation. We know that if John were tospend ALL the money on hot dogs, he could buy 30
.75 = 40 hot dogs. And if he were to buy only burgers he couldbuy 30
1.25 = 24 burgers. From those numbers, we can get 2 intercepts: (0 burgers, 40 hot dogs) and (24 burgers, 0 hotdogs). We could plot these just as we did above and obtain our graph that way.
As a final note, we should realize that Jesus problem is really an example of an inequality. He can, in fact, spend anyamount up to $30. The only thing he cannot do is spend more than $30. The graph above reflects this: the line is theset of solutions that involve spending exactly $30, and the shaded region shows solutions that involve spending lessthan $30. Well work with inequalities some more in Chapter 6.
Lesson Summary
• A y−intercept occurs at the point where a graph crosses the y−axis (where x = 0) and an x−intercept occursat the point where a graph crosses the x−axis (where y = 0).
• The y−intercept can be found by substituting x = 0 into the equation and solving for y. Likewise, thex−intercept can be found by substituting y = 0 into the equation and solving for x.
• Equations in general form can be solved for the intercepts by covering up the x (or y) term and solving theequation that remains.
Practice Set
1. Find the intercepts for the following equations using substitution.
(a) y = 3x−6
162

www.ck12.org Chapter 8. Graphs and Graphing Linear Equations
(b) y =−2x+4(c) y = 14x−21(d) y = 7−3x(e) y = 2.5x−4(f) y = 1.1x+2.2(g) y = 3
8 x+7(h) y = 5
9 −27 x
2. Find the intercepts of the following equations using the cover-up method.
(a) 5x−6y = 15(b) 3x−4y =−5(c) 2x+7y =−11(d) 5x+10y = 25(e) 5x−1.3y = 12(f) 1.4x−3.5y = 7(g) 3
5 x+2y = 25
(h) 34 x− 2
3 y = 15
3. Use any method to find the intercepts and then graph the following equations.
(a) y = 2x+3(b) 6(x−1) = 2(y+3)(c) x− y = 5(d) x+ y = 8
4. At the local grocery store strawberries cost $3.00 per pound and bananas cost $1.00 per pound.
(a) If I have $10 to spend on strawberries and bananas, draw a graph to show what combinations of each Ican buy and spend exactly $10.
(b) Plot the point representing 3 pounds of strawberries and 2 pounds of bananas. Will that cost more or lessthan $10?
(c) Do the same for the point representing 1 pound of strawberries and 5 pounds of bananas.
5. A movie theater charges $7.50 for adult tickets and $4.50 for children. If the theater takes in $900 in ticketsales for a particular screening, draw a graph which depicts the possibilities for the number of adult ticketsand the number of child tickets sold.
6. Why can’t we use the intercept method to graph the following equation? 3(x+2) = 2(y+3)7. Name two more equations that we cant use the intercept method to graph.
163


![Shortest-pathg rocerys hoppingjustinppearson.com/pages/shortest-path-grocery-shopping/shortest-path-grocery-shopping.pdfGraphPlot[meshGraph, ImageSize→ Full] Getthegraphvertices.](https://static.fdocuments.net/doc/165x107/5ec9717fc18133726b4d56ff/shortest-pathg-rocerys-h-graphplotmeshgraph-imagesizea-full-getthegraphvertices.jpg)