C 675 ACTAjultika.oulu.fi/files/isbn9789526220390.pdf · 2018-09-25 · Tervasmäki, Petri,...
104
UNIVERSITATIS OULUENSIS ACTA C TECHNICA OULU 2018 C 675 Petri Tervasmäki REACTION AND MASS TRANSFER KINETICS IN MULTIPHASE BIOREACTORS EXPERIMENTAL AND MODELLING STUDIES UNIVERSITY OF OULU GRADUATE SCHOOL; UNIVERSITY OF OULU, FACULTY OF TECHNOLOGY C 675 ACTA Petri Tervasmäki
Transcript of C 675 ACTAjultika.oulu.fi/files/isbn9789526220390.pdf · 2018-09-25 · Tervasmäki, Petri,...
UNIVERSITY OF OULU P .O. Box 8000 F I -90014 UNIVERSITY OF OULU FINLAND
A C T A U N I V E R S I T A T I S O U L U E N S I S
University Lecturer Tuomo Glumoff
University Lecturer Santeri Palviainen
Postdoctoral research fellow Sanna Taskila
Professor Olli Vuolteenaho
University Lecturer Veli-Matti Ulvinen
Planning Director Pertti Tikkanen
Professor Jari Juga
University Lecturer Anu Soikkeli
Professor Olli Vuolteenaho
Publications Editor Kirsti Nurkkala
ISBN 978-952-62-2038-3 (Paperback)ISBN 978-952-62-2039-0 (PDF)ISSN 0355-3213 (Print)ISSN 1796-2226 (Online)
U N I V E R S I TAT I S O U L U E N S I SACTAC
TECHNICA
U N I V E R S I TAT I S O U L U E N S I SACTAC
TECHNICA
OULU 2018
C 675
Petri Tervasmäki
REACTION AND MASS TRANSFER KINETICS IN MULTIPHASE BIOREACTORSEXPERIMENTAL AND MODELLING STUDIES
UNIVERSITY OF OULU GRADUATE SCHOOL;UNIVERSITY OF OULU,FACULTY OF TECHNOLOGY
C 675
AC
TAP
etri Tervasmäki
C675etukansi.fm Page 1 Wednesday, August 29, 2018 12:14 PM

ACTA UNIVERS ITAT I S OULUENS I SC Te c h n i c a 6 7 5
PETRI TERVASMÄKI
REACTION AND MASS TRANSFER KINETICS IN MULTIPHASE BIOREACTORSExperimental and modelling studies
Academic dissertation to be presented, with the assent ofthe Doctoral Training Committee of Technology andNatural Sciences of the University of Oulu, for publicdefence in the Oulun Puhelin auditorium (L5), Linnanmaa,on 5 October 2018, at 12 noon
UNIVERSITY OF OULU, OULU 2018
Copyright © 2018Acta Univ. Oul. C 675, 2018
Supervised byProfessor Juha TanskanenDoctor Sanna TaskilaProfessor Heikki Ojamo
Reviewed byProfessor Gunnar LidénDoctor Juha-Pekka Pitkänen
ISBN 978-952-62-2038-3 (Paperback)ISBN 978-952-62-2039-0 (PDF)
ISSN 0355-3213 (Printed)ISSN 1796-2226 (Online)
Cover DesignRaimo Ahonen
JUVENES PRINTTAMPERE 2018
OpponentProfessor Ville Alopaeus

Tervasmäki, Petri, Reaction and mass transfer kinetics in multiphase bioreactors.Experimental and modelling studiesUniversity of Oulu Graduate School; University of Oulu, Faculty of TechnologyActa Univ. Oul. C 675, 2018University of Oulu, P.O. Box 8000, FI-90014 University of Oulu, Finland
Abstract
In the sugar platform of biorefining, the complex polymeric structure of lignocellulose biomass isdegraded into sugars, which are utilized by microbial cells in the further processing steps. Thereaction steps in both biomass degradation and microbial fermentation processes involvemultiphase reactions in which mass transfer and reaction kinetics often play a key role. The aimof this thesis is to characterize the effect of these conditions on enzymatic hydrolysis of celluloseand utilization of sugars by aerobic microbes. These types of liquid-solid (cellulose hydrolysis)and liquid-gas (microbial cultivation) systems are typically very demanding on the reactors thatare used in the process.
By the fed-batch process utilized in this work, sufficient mixing in enzymatic hydrolysis ofcellulose is achieved even with high final substrate concentration. One of the main outcomes ofthis work is the kinetic model that concentrates on the kinetics of fed-batch process by discretizingthe substrate into subpopulations. By using this approach, the model parameters were identified inan adequate manner, and the poorly identified parameters could be sorted out. Parameteridentifiability has been an issue in previous models for enzymatic hydrolysis of cellulose. Basedon the experiments and modelling studies, it can be concluded that the enzymes remain intact fortime scales relevant for the hydrolysis process. Thus, the decrease in the hydrolysis rate found inmany literature studies is probably mostly due to substrate-enzyme interactions rather thandenaturation of the enzyme.
In aerobic cell cultivations, the mixing and mass transfer conditions are often more critical forthe process performance. In this work, we studied the performance and suitability of alternativereactor types to be used in aerobic cell cultivations and obtained some promising results. Inaddition, the thesis presents a modelling approach to study the effect of process conditions onmetabolism and growth rate of Pichia pastoris yeast. The model combines a kinetic model foryeast growth and a model for the mixing and mass transfer conditions in stirred tank reactor.
Keywords: bioreactor, cellulose, enzymatic hydrolysis, kinetic model, mass transfer,yeast

Tervasmäki, Petri, Reaktio- ja aineensiirtokinetiikka usean faasin bioreaktoreissa.Kokeellinen tutkimus ja mallinnusOulun yliopiston tutkijakoulu; Oulun yliopisto, Teknillinen tiedekuntaActa Univ. Oul. C 675, 2018Oulun yliopisto, PL 8000, 90014 Oulun yliopisto
Tiivistelmä
Biojalostuksen sokerialustassa lignoselluloosapohjaisen biomassan monimutkaista polymeerira-kennetta muokataan ja sieltä vapautetaan monomeerisia sokereita, joita voidaan edelleen hyö-dyntää jatkojalostuksessa. Monet jatkojalostusprosessit käyttävät mikrobeja, joiden aineenvaih-dunnassa sokereita voidaan jalostaa arvokkaammiksi tuotteiksi ns. fermentointiprosesseissa.Tämän väitöstyön tarkoitus on tutkia reaktio- ja aineensiirtokinetiikan vaikutusta selluloosanentsymaattiseen hydrolyysiin ja aerobisiin mikrobifermentointeihin. Näistä ensimmäinen on nes-te-kiintoainesysteemi ja jälkimmäinen neste-kaasusysteemi, ja tällaiset prosessit asettavat tyypil-lisesti merkittäviä vaatimuksia niissä käytettäville reaktoreille.
Tässä työssä hyödynnettiin kiinteän raaka-aineen vähittäistä syöttöä (ns. fed-batch prosessi)selluloosan hydrolyysissä, jolloin sekoitus voidaan pitää riittävänä suurillakin kiintoainemääril-lä. Työn merkittävin tuotos on kineettinen malli, jossa hyödynnetään fed-batch prosessia ja koe-dataa osittamalla mallinnusyhtälöt raaka-aineen syöttöajan perusteella. Tällä tavalla mallin para-metrit saatiin identifioitua kohtuullisella tarkkuudella sekä eriteltyä huonosti identifioituneetparametrit. Mallin parametrien identifiointi on ollut ongelmallista monissa vastaavan tyyppisis-sä malleissa aiemmin. Kokeiden ja mallinnustulosten perusteella voidaan sanoa, että hydrolyy-sissä käytettävät entsyymit pysyvät aktiivisina prosessin aikana, ja usein todettu hydrolyysinhidastuminen johtuu ennemmin kiinteän kuidun ja entsyymien vuorovaikutuksen muutoksistakuin entsyymin denaturoitumisesta.
Aerobisiin mikrobikasvatuksiin liittyen tässä työssä tutkittiin vaihtoehtoisten reaktorityyppi-en hyödyntämistä, joista saatiin myös lupaavia tuloksia. Lisäksi työssä kehitettiin mallinnustyö-kaluja, joilla voidaan tutkia prosessiolosuhteiden vaikutusta Pichia pastoris –hiivan metaboli-aan ja kasvunopeuteen. Mallissa yhdistetään hiivan kasvun kineettinen malli sekä reaktoriolo-suhteiden mallinnus.
Asiasanat: aineensiirto, bioreaktori, entsymaattinen hydrolyysi, hiiva, kineettinen malli,selluloosa


7
Acknowledgements
This study was conducted in the University of Oulu during 2012 – 2018. I started
the work at the Bioprocess Engineering Laboratory under the supervision of Dr.
Sanna Taskila and Prof. Heikki Ojamo. I would like to thank Sanna and Heikki for
encouraging me to academic career and their support and guidance especially in
the early phase. Shortly after I started, our Bioprocess group was merged with
Chemical Process Engineering (CPE) research group, and Heikki continued the co-
operation as a professor in Aalto University. I’m grateful for Prof. Juha Tanskanen
for the opportunity to continue my research in the CPE group, and for the guidance
during the latter phase of the thesis work. Prof. Gunnar Lidén and Dr. Juha-Pekka
Pitkänen are greatly acknowledged for the pre-examination process. Your
comments and suggestions made a vast improvement on this thesis.
I’m grateful for Fortum Foundation and Business Finland (BF, formerly Tekes)
for providing a large part of the funding. The latter part of the research was carried
out under the BF project Fermatra. I would like to thank all the project partners
and specifically Outotec and Mr. Marko Latva-Kokko and Dr. Jari Tiihonen for
their input as co-authors and providing an industrial point of view for the work.
Also the grants from Walter Ahlström foundation, University of Oulu Graduate
School and Tauno Tönning foundation are acknowledged.
At CPE, I have had the opportunity to work with great colleagues. Mr. Ville
Sotaniemi has had a huge contribution especially in the experimental work and as
a co-author. Similarly, Dr. Jani Kangas has greatly contributed in the model
development and as a co-author. I would like to thank all the co-workers at CPE
and at the University of Oulu who have helped me during this time. I have also had
the opportunity to guide younger researchers as they have carried out practical
training period in the laboratory as a part of their B.Sc or M.Sc studies. Thank you
Stella, Essi, Angèle and Florian for the experience and the valuable data.
During this time, I’m lucky that I’ve been surrounded by great bunch of friends
that remind me the about other things in life. Related to the other things, I thank
Tornion Panimo for the possibility to utilize my knowledge in a brewery setting to
create tastier biochemicals. I’m grateful for my family for the support during and
especially before my academic career for making it possible. Thank you Tuula and
Markku and my sisters Milka and Anna. Finally, I would like to thank Aino. I’m
lucky that there is room for love and engineering sciences to coexist.
Oulu, August 2018 Petri Tervasmäki

8

9
List of symbols and abbreviations
Latin symbols
a Volumetric mass transfer area (m2 m-3)
c Concentration (g l-1 or mol l-1)
D Dilution rate (h-1)
db Bubble size (m)
DL Diffusion coefficient in liquid (m2 s-1)
EFg Exchange flow in gassed conditions (m3 s-1)
EA Adsorbed enzyme concentration (gp l-1)
Ef Free enzyme concentration (gp l-1)
Etot Total amount of enzyme (gp l-1)
Emax Enzyme adsorption capacity in Langmuir model (gp gcel-1)
Emax0 Enzyme adsorption capacity of unconverted substrate (gp gcel-1)
F Feed flow rate (g h-1 or l h-1)
G Glucose concentration in the hydrolysis slurry (gglu l-1)
Gliq Glucose concentration in hydrolysate liquid phase (gglu l-1)
H Height of liquid in reactor (m)
IF Induced flow (m3 s-1)
i Index of the substrate population in fed-batch mode
kAds Cellulase adsorption rate constant (l gp-1 h-1)
kmax Cellulase reaction rate constant (gcel gp-1 h-1)
kEmax Adjustable parameter
KL Equilibrium constant in cellulase adsorption (gp l-1)
KI,G Inhibition constant for glucose in hydrolysis model (gglu l-1)
kH Henry’s constant for oxygen (m3 Pa mol-1)
kL Liquid side mass transfer coefficient (m s-1 or m h-1)
Ke Saturation coefficient for ethanol uptake (ge l-1)
Kg Saturation coefficient for glucose uptake (gg l-1)
Ki Inhibition constant for glucose inhibition of ethanol uptake (gg l-1)
Ko Saturation coefficient for oxygen uptake (go l-1)
M Molecular weight (g mol-1)
nEmax Adjustable parameter in hydrolysis model (-)
nexp Number of experiments used in parameter estimation
nm Number of measurements in a single experimental run

10
n0 Adjustable parameter in hydrolysis model (-)
NP Impeller power number (-)
P Total pressure (Pa)
PA Power for agitation (W)
p Partial pressure (Pa)
qi Specific rate of component i (gi gx-1 h-1)
q Adjustable parameter in hydrolysis model (l gcel-1)
Qg Gas flow rate (m3 h-1)
r Reaction rate of cellulose (gcel l-1 h-1)
Sc Concentration of cellulose (gcel l-1)
Sc,0 Initial cellulose concentration (gcel l-1)
Sc,Acc Total mass of added cellulose (gcel)
Ss Concentration of total solids (gsol l-1)
t Time (h)
T Reactor (tank) diameter (m)
V Volume (l or m3)
vs Superficial gas velocity (m s-1)
w Weighing factor in parameter estimation x Vector containing the control variables
X Substrate conversion in hydrolysis model
Xcrit Critical conversion in hydrolysis model
y Mole fraction (-)
Yij Yield coefficient for components i and j (gi gj-1)
z Axial coordinate of reactor (m)
Greek symbols
α Adjustable parameter in correlation (-)
αc,0 Initial cellulose fraction of the solids
αc Cellulose fraction of the solids during hydrolysis
ε Gas volume fraction (-)
η Viscosity (Pa s)
θ Vector containing the model parameters
μ Specific growth rate (h-1)
ρ Density (kg m-3)
ρS Bulk density of the substrate (g l-1)
σl Liquid phase electrical conductivity (mS cm-1)
11
σm Measured dispersion conductivity (mS cm-1)
τg Gas phase residence time (s or h)
τpr Oxygen probe response time (s)
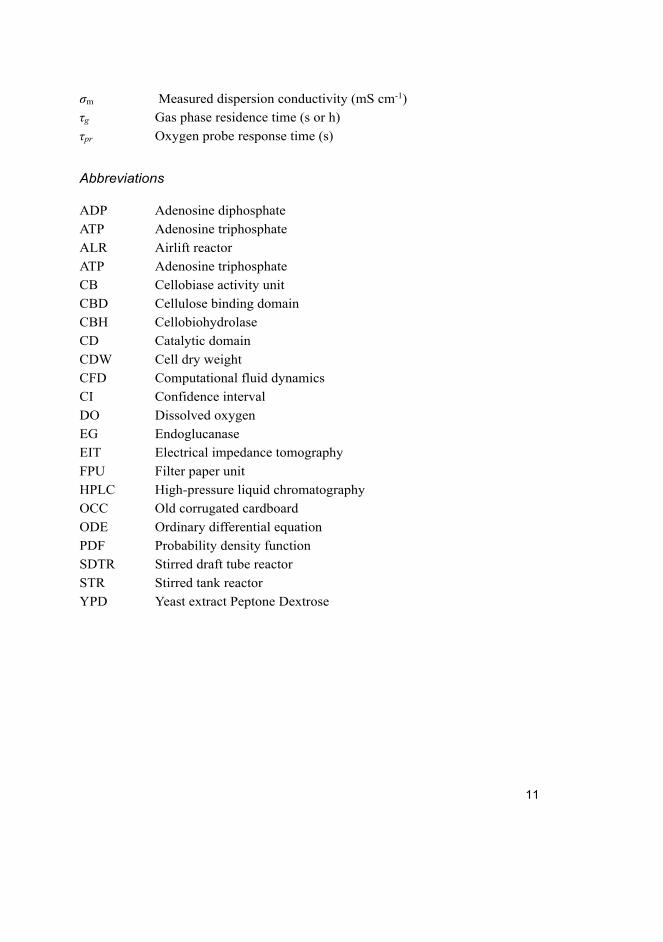
Abbreviations
ADP Adenosine diphosphate
ATP Adenosine triphosphate
ALR Airlift reactor
ATP Adenosine triphosphate
CB Cellobiase activity unit
CBD Cellulose binding domain
CBH Cellobiohydrolase
CD Catalytic domain
CDW Cell dry weight
CFD Computational fluid dynamics
CI Confidence interval
DO Dissolved oxygen
EG Endoglucanase
EIT Electrical impedance tomography
FPU Filter paper unit
HPLC High-pressure liquid chromatography
OCC Old corrugated cardboard
ODE Ordinary differential equation
PDF Probability density function
SDTR Stirred draft tube reactor
STR Stirred tank reactor
YPD Yeast extract Peptone Dextrose

12
13
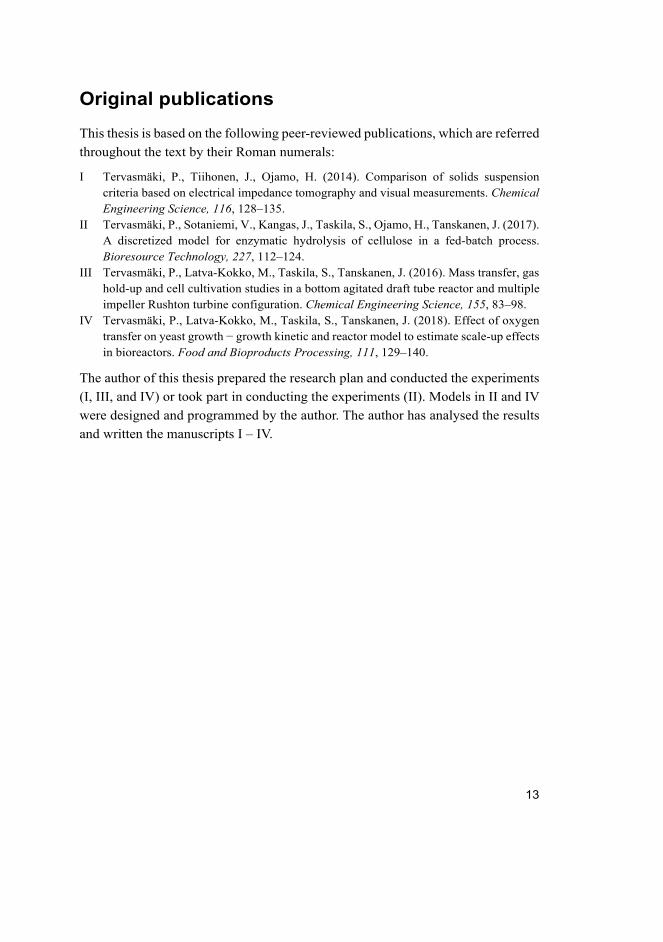
Original publications
This thesis is based on the following peer-reviewed publications, which are referred
throughout the text by their Roman numerals:
I Tervasmäki, P., Tiihonen, J., Ojamo, H. (2014). Comparison of solids suspension criteria based on electrical impedance tomography and visual measurements. Chemical Engineering Science, 116, 128–135.
II Tervasmäki, P., Sotaniemi, V., Kangas, J., Taskila, S., Ojamo, H., Tanskanen, J. (2017). A discretized model for enzymatic hydrolysis of cellulose in a fed-batch process. Bioresource Technology, 227, 112–124.
III Tervasmäki, P., Latva-Kokko, M., Taskila, S., Tanskanen, J. (2016). Mass transfer, gas hold-up and cell cultivation studies in a bottom agitated draft tube reactor and multiple impeller Rushton turbine configuration. Chemical Engineering Science, 155, 83–98.
IV Tervasmäki, P., Latva-Kokko, M., Taskila, S., Tanskanen, J. (2018). Effect of oxygen transfer on yeast growth − growth kinetic and reactor model to estimate scale-up effects in bioreactors. Food and Bioproducts Processing, 111, 129–140.
The author of this thesis prepared the research plan and conducted the experiments
(I, III, and IV) or took part in conducting the experiments (II). Models in II and IV
were designed and programmed by the author. The author has analysed the results
and written the manuscripts I – IV.

14

15
Contents
Abstract
Tiivistelmä
Acknowledgements 7 List of symbols and abbreviations 9 Original publications 13 Contents 15 1 Introduction 17
1.1 Background ............................................................................................. 17 1.2 Objectives and scope of the thesis .......................................................... 19
2 Literature review 21 2.1 Enzymatic hydrolysis of lignocellulose .................................................. 21
2.1.1 Rate decreasing effects and substrate-enzyme interactions .......... 24 2.1.2 Advantages and issues in high consistency processes .................. 25 2.1.3 Kinetic models .............................................................................. 27
2.2 Aerobic cell cultivations ......................................................................... 29 2.2.1 Effect of dissolved oxygen and sugar concentration on
yeast metabolism .......................................................................... 29 2.2.2 Gas-liquid mass transfer ............................................................... 31 2.2.3 Reactor design and scale-up ......................................................... 33 2.2.4 Modelling of microbial cultivation processes ............................... 39
3 Materials and methods 41 3.1 Mixing and mass transfer studies (I, III) ................................................. 41
3.1.1 Reactor geometries ....................................................................... 41 3.1.2 EIT in solid suspension and gas hold-up measurement (I,
III) ................................................................................................ 43 3.1.3 kLa measurement (III) ................................................................... 46 3.1.4 Power measurement (III) .............................................................. 47
3.2 Enzymatic hydrolysis (II) ........................................................................ 47 3.2.1 Enzymes, buffers and substrate .................................................... 47 3.2.2 Experimental arrangement ............................................................ 48
3.3 Yeast cultivations (III, IV) ...................................................................... 48 3.3.1 Yeast strain, cultivation medium .................................................. 48 3.3.2 Cultivation conditions, reactors, experimental
arrangements ................................................................................ 49 3.3.3 Analytical methods ....................................................................... 49
16
3.4 Model development ................................................................................. 50 3.4.1 Enzymatic hydrolysis of cellulose (II) .......................................... 50 3.4.2 Growth model for Pichia pastoris (IV) ......................................... 54 3.4.3 Reactor model for aerobic microbial cultivation (IV) .................. 57
4 Results and discussion 61 4.1 Liquid-solid reactors (I) .......................................................................... 61 4.2 Kinetic model for enzymatic hydrolysis of cellulose (II) ........................ 63
4.2.1 Model parameter estimation and model validation ....................... 63 4.2.2 Fed-batch operation of enzymatic hydrolysis ............................... 68
4.3 Reactors in aerobic microbial cultivations (III)....................................... 71 4.3.1 Power consumption of agitation ................................................... 71 4.3.2 Gas hold-up .................................................................................. 72 4.3.3 Volumetric mass transfer coefficient kLa ...................................... 76
4.4 Reactor scale model for aerobic microbial cultivations (IV) .................. 78 4.4.1 Growth model for Pichia pastoris in laboratory scale ................... 78 4.4.2 Simulations for large scale reactors .............................................. 83
5 Conclusions 87 References 89 Original publications 99

17
1 Introduction
1.1 Background
Industrial biotechnology utilizes biocatalysts for the production of a wide range of
chemicals, enzymes, proteins and other pharmaceutical compounds as well as
biofuels. The production processes use enzymes or microbial cells and often require
special equipment and engineering solutions, thus differing from chemical
processes. The global product sales made by biotechnological processes were 48
billion Euros in 2007 (G. Festel, 2010), and had increased to 92 billion Euros in
2010 (Gunter Festel, Detzel, & Maas, 2012). In addition, the fraction of
biotechnologically produced products from the total chemical sales has increased
from 3.5% to 6.2% during this time. The market shares of biotechnical products are
higher in specialty and consumer chemicals (5-6%) and especially high in
pharmaceutical ingredients (20%). However, in base chemicals the market shares
of biotechnological products are lower (3-4%). In fact, base chemicals accounted
for 25% of industrial biotechnology sales whereas similar number for all chemical
sales was 59% in 2007. There are some technological reasons that may in part
account for the lower market share in basic chemicals, which will be addressed in
this thesis. The figures presented above do not include biofuels, for which global
markets are estimated to be around 154 billion Euros in 2014 with an increasing
trend (Zion Market Research, 2017). It should be noted that this includes all bio-
based energy production such as fuel pellets and gasification of biomass, which
should be differentiated from biotechnological production processes. However,
many of the production processes for bio-based liquid fuels also utilize industrial
biotechnology such as bioethanol production. In addition to current chemical and
fuel production processes, the rapid development in biotechnology will most likely
pave the way for new products and processes for which there are no markets yet.
Glucose is the key ingredient in many biotechnological processes. Glucose is
the most common monomeric sugar, and it is found in its monomeric form or as a
polymer in numerous places in nature. Starch is a glucose polymer that is used as a
storage compound in plants and it is easily degraded to glucose by enzymatic
hydrolysis. In bulk chemical production, the preferable source of glucose would be
something else as starchy plants are used in food production and the aim is to avoid
competition with food production. Another glucose polymer, cellulose, is found in
plants as a structural component giving plants their rigid structure. Therefore,

18
cellulose is more difficult to hydrolyse into glucose compared to starch. The
hydrolysis process is characterised by water-cellulose mixture, which forms a thick
slurry that causes challenges in the mixing process and reactor design. Furthermore,
all the interactions between the soluble enzyme and insoluble substrate that affect
the reaction kinetics are not fully known. Thus, developing the understanding of
the process is crucial in order to improve the process economics and to provide
affordable and sustainable ingredients to be utilized in the biotechnological industry.
Utilization of glucose by microbial cultivation processes poses various
challenges for the process technologies. In aerobic microbial processes, the main
challenges in mixing and reactor design are related to gas dispersion and gas-liquid
mass transfer, which are required to provide oxygen for the microbes from air. Mass
transfer kinetics is often limiting the process performance. In fully aerobic
metabolism, micro-organisms utilize oxygen as the terminal electron acceptor in
oxidative phosphorylation to yield energy in terms of adenosine triphosphate (ATP).
Under oxygen limited conditions, however, facultative anaerobes are able to
produce energy via fermentative metabolism but the net ATP yield is significantly
lower and side products are produced. Thus, the availability of oxygen may affect
significantly on the production rate and yield, which are crucial parameters for the
process economy. Therefore, the mass transfer and microbial kinetics should be
studied simultaneously. There is a vast literature on gas-liquid mass transfer in
stirred reactors, especially in laboratory and pilot scale. However, rigorous
assessments of the interactions between reactor design, operational conditions and
microbial kinetics are still scarce.
As suggested in a recent report (Crater, Galleher, & Livense, 2017), there is a
need for developing integrated process and reactor models for microbial cultivation
processes in order to assess the combined effects of different parameters that have
an impact on capital and operating costs of a given microbial process. Furthermore,
the cost of providing oxygen has in part limited the use of aerobic processes to
lower production volume (i.e. 10 – 200 m3 reactors) and higher margin products
such as pharmaceuticals, enzymes and specialty chemicals. However, different
microbial routes have been developed for integrated biorefineries to produce fuel-
range hydrocarbons or other lower margin base chemicals. For these types of
products, large production volume (i.e. > 500 m3 bioreactors) could be of interest
(Humbird, Davis, & McMillan, 2017). In addition to technical and economic
difficulties in large scale reactors, the initial process development is usually carried
out in laboratory (from microliter to ~ 100 l scale) and pilot scale (~1m3). The
conditions may be very different from the large scale reactors because the important

19
process parameters related to fluid flow and reaction rate scale in a different way.
This makes the scale-up often a difficult task. Therefore, a scale-down approach
can be utilized in order to reproduce the environmental conditions of a large-scale
reactor in the laboratory scale and to utilize this knowledge in process development
in the early phase (F. Delvigne, Lejeune, Destain, & Thonart, 2006; Frank Delvigne,
Takors, Mudde, van Gulik, & Noorman, 2017; Noorman & Heijnen, 2017). The
scale-down approach also requires reliable models in order to construct the proper
experimental conditions.
This thesis concentrates on biochemical processes that require reactors
enabling processing of ingredients in two or three phases in which gas and/or solids
need to be dispersed in liquid phase. Mixing and mass transfer conditions are often
limiting factors for reaction rates, and the power consumption of the reactor
operation may be a significant cost factor. Thus, increasing the knowledge of
reaction and mass transfer kinetics, as well as optimization of bioreactor mixing
conditions is of high interest. The main focus is in enzymatic hydrolysis of cellulose
and aerobic microbial cultivations. A particular emphasis is on modelling tools to
describe the relevant phenomena in the hydrolysis and cell cultivation processes.
In the case of aerobic microbial cultivations, the modelling work comprises of
integrated approach of microbial kinetics and reactor model that could assist in the
economic evaluation of the process. Furthermore, novel reactor geometries are
tested in the laboratory scale.
1.2 Objectives and scope of the thesis
The aim of this thesis is to characterize hydrodynamic conditions in two and three
phase reactors and their effect on mass transfer and reaction kinetics in some key
processes involved in the majority of biorefinery concepts utilizing biochemical
conversion processes. The specific cases are enzymatic hydrolysis of cellulose to
produce simple sugars (solid-liquid) and aerobic microbial cultivation on sugars
(gas-liquid). A general framework of the thesis is illustrated in Fig. 1, which also
shows how the original publications are related to the overall framework. The main
scope is studying the hydrodynamics and mixing phenomena of two-phase reactors
as well as the kinetics of mass transfer and biochemical reactions. Furthermore,
modelling work is carried out to develop mathematical descriptions of the observed
phenomena both in the micro (i.e. reaction and mass transfer kinetics) and macro
(i.e. reactor) level. The results of these studies can then be applied to the design and

20
evaluation of equipment (reactors) and the overall process. More specifically, the
objectives and research questions of this thesis are as follows:
1. To establish tools and to use these to study mixing in solid-liquid stirred tank
reactors. This will contribute knowledge on how important solid-liquid mixing
and mass transfer phenomena are in enzymatic hydrolysis of cellulose or in
cell cultivations in the production scale.
2. To establish tools and to use these to study mixing in gas-liquid stirred tank
reactors. This will contribute knowledge on how important gas-liquid mixing
and mass transfer phenomena are in microbial cultivations, and how they can
be enhanced by reactor design.
3. To formulate a kinetic model for the enzymatic hydrolysis of cellulose
applicable at very high substrate concentrations and study the reliability of the
model. This will drive forward the study of enzymatic hydrolysis process.
4. To set-up a reactor-scale model for aerobic cell cultivation process, including
kinetics of mass transfer and cell growth, and non-ideal mixing in the reactor.
This type of model would be a valuable tool for process design purposes and
economic assessment.
Fig. 1. The main themes in the thesis and how the original publications I-IV are related
to these themes. The relative weight of the publication is implied by the thickness of the
line.
APPLICATIONS
(EQUIPMENT)
STUDIES OF
UNDERLYING
PHENOMENA
Solid-liquid
reactors
Gas-liquid
reactors
Enzymatic
hydrolysis of
cellulose
Aerobic
microbial
cultivation
APPLICATIONS
(PROCESS)
Hydrodynamics
Mixing
Mass transfer kinetics
Reaction kinetics
I III
II IV

21
2 Literature review
2.1 Enzymatic hydrolysis of lignocellulose
Plant biomass that is not used directly for food or feed production is a possible
alternative to fossil resources in the production of fuels and chemicals. In practice,
this means lignocellulosic biomass, which is the structural element in plants. In
addition to fresh raw materials, many industrial side streams from agriculture and
wood processing industry contain potential lignocellulosic feedstocks that could be
utilized more efficiently. It has been estimated that in the European Union, 85
million tonnes of agricultural residue and 9.2 million tonnes of forestry residue are
sustainably available (Searle & Malins, 2016). In Finland, the estimation is 1.2
million tonnes for agricultural and 3.9 million tonnes for forest residues. The
current trend is towards biorefineries in which the plant biomass is utilized to
materials, chemicals and fuels rather than directly for heat production.
Lignocellulose consists mainly of three macromolecules, cellulose,
hemicellulose and lignin. Cellulose is a polysaccharide of β-1,4-glucose molecules
with a typical degree of polymerization of 10,000 or higher. The repeating unit is
cellobiose, and the polymer structure is linear but complex fibrils are formed by
hydrogen bonds. Cellulose is, therefore, insoluble in water and recalcitrant against
microbial degradation. In addition to cellulose, lignocellulose contains
hemicellulose and lignin, which make the fibre structure more rigid and recalcitrant
to degradation. Hemicellulose has a more complex chemical structure as it consists
of different sugar monomers such as glucose, galactose, mannose, xylose and
arabinose, as well as glucuronic acid. The third major component, lignin, is a
complex polymer consisting mainly of p-coumaryl alcohol, coniferyl alcohol and
sinapyl alcohol. (Jørgensen, Kristensen, & Felby, 2007)
The relative amounts of cellulose, hemicellulose and lignin vary greatly with
the source of biomass. Some suggestive values are given in Table 1 for hardwood
(e.g. birch and willow), softwood (e.g. spruce and pine) and grasses (e.g. wheat
straw and corn stover). It should be noted that the variation is high also within each
subgroup. Furthermore, the monomer composition of hemicellulose and lignin
varies greatly between species as does the fibre structure.

22
Table 1. Suggestive composition of lignocellulose from different sources. The mass
balance may not close to 100%, and the remainder consists of proteins and extractives.
The data is compiled from Jørgensen et al. (2007) and Pauly and Keegstra (2008).
Material Cellulose Hemicellulose Lignin Ash
Hardwood 35-45% 30-35% 25% <1%
Softwood 40-45% 20-30% 30% <1%
Grasses 35-40% 20-30% 10-20% 1-15%
Production of glucose from the cellulose polymer is a crucial step in many
biorefinery concepts. Due to robust structure of lignocellulose, a pretreatment step
is usually required before the enzymatic hydrolysis process. As the lignocellulose
material is a complex matrix of cellulose, hemicellulose and lignin, the cellulose
part of untreated material may not be accessible for the enzymes. Thus,
pretreatment process is required, and many of the pretreatment methods result also
in some fractioning of the biomass by solubilizing either a part of hemicellulose or
lignin, or both. Different treatment methods rely on either acidic or alkaline
conditions, heat or pressure or, more commonly, combinations of these. Steam
explosion relies on high pressure and high temperature (about 200 °C) steam
treatment after which the pressure is rapidly released causing the steam to expand
and further modify the structure of the lignocellulose matrix. Acid catalyst may be
used to enhance the process. Another process that utilizes heat and acid catalyst is
called dilute acid pretreatment in which the temperature (120 – 200 °C) and dry
matter content is lower compared to steam explosion. Acid catalysed methods in
general remove hemicelluloses and, to less extent, also lignin. Under alkaline
conditions, however, lignin can be more efficiently removed and both cellulose and
hemicellulose remain in the solid material. Examples of alkaline pretreatments
include lime process similar to Kraft cooking, aqueous ammonia process and
ammonfia fibre explosion (AFEX). (Jørgensen et al., 2007; Kallioinen, 2014) The
work on enzymatic hydrolysis in this work concentrates on the mathematical
modelling and the effect of pretreatment is not studied.
The enzymatic degradation of cellulose requires multiple enzymes, and the
discussion here is concentrated on fungal cellulases, primarily those produced by
Trichoderma and Aspergillus species. The understanding of the enzymes involved
in the hydrolysis, their structure and reaction mechanisms has been developed over
several decades starting from mid 20th century. The research on the fundamental
mechanistic level is active, and a recent review on the subject is written by Payne
et al. (2015). The traditional classification is into three classes: exo-1,4-β-D-

23
glucanases (or cellobiohydrolases, CBH, EC 3.2.1.91), endo-1,4-β-D-glucanases
(EG, EC 3.2.1.4), and 1,4-β-D-glucosidases (EC 3.2.1.21). Cellobiohydrolases
move progressively along the cellulose chain and cleave off cellobiose either from
the reducing or non-reducing end of the cellulose chain, depending on the type of
CBH. Endoglucanases hydrolyse internal bonds in random fashion, and β-
glucosidases hydrolyse cellobiose to glucose and cleave glucose from soluble
cellooligosaccharides. The current understanding is that the enzymes working on
the insoluble substrates (CBH and EG) have a separate cellulose binding domain
(CBD) that binds the enzyme on the surface of the substrate, and catalytic domain
(CD) which is involved in the hydrolysis reaction. The enzymes are working
synergistically as the different enzymes produce substrate for the others. Thus, the
fibre structure and the amounts of accessible sites for the enzymes are constantly
changing as the hydrolysis proceeds.
However, the specificity of the different types of cellulases is not as strict as
suggested by the CBH/EG classification. There are a number of subgroups in each
enzyme class, and CBHs have been shown also to act in endo fashion to cleave
inner bonds of the cellulose chains thus producing new chain ends (Ståhlberg,
Johansson, & Pettersson, 1993). Thus, Payne et al. (2015) suggested that, due to
complexity of the enzyme classification, it may be more helpful to think in terms
of modes of action rather than types of cellulases. In addition to hydrolytic
cellulases, also oxidative enzymes have recently been found and they are called
lytic polysaccharide monooxygenases (LPMO). These enzymes have been shown
to act on crystalline cellulose, further increasing the synergy between different
enzymes and modes of action. The presence of lignin and hemicellulose further
complicate the situation as the cellulose accessibility may be hindered due to the
complex matrix of the three main components. Thus, degradation of these
compounds may be of importance to increase the cellulose conversion. Since the
monomer structure of lignin and hemicelluose is more complex than cellulose, a
wide range of enzymes are often needed. Hemicellulose can be broken down by
hydrolytic enzymes, mainly xylanases, arabinofuranosidases, mannanases and
other accessory enzymes. Lignin can be degraded mainly by oxidative enzymes
from white-rot fungi such as manganese peroxidases, lignin peroxidases and
laccases. It should be noted that as the monomer structure of both lignin and
hemicellulose varies greatly within different plant species, also the optimal enzyme
composition for their degradation is raw material specific. (Álvarez, Reyes�Sosa,
& Díez, 2016)

24
As there are multiple enzymes required to yield glucose from cellulose, it is not
always practical to analyse and report the activity of each individual enzyme. A
standardized method to estimate the overall cellulase activity is the filter paper
assay in which 2.0 mg of reducing sugar as glucose is produced from 50 mg of filter
paper (4% conversion) in 60 minutes. The method is based on diluting the enzyme
sample and finding the dilution to yield the required 2.0 mg of glucose. The filter
paper units (FPU) of an enzyme solution (e.g. FPU/ml) can be calculated based on
the dilution required to achieve the predetermined glucose release. (Ghose, 1987)
As discussed in the next section, the effect of enzyme dosage and reaction time on
the conversion is not linear. Thus, FPU is only one indication of the ability to
degrade cellulose, and it is measured at rather low conversion. Furthermore, it is
measured using filter paper as a model substrate, and it is often useful to optimise
the relative amounts of different enzyme activities used for hydrolysis based on the
substrate, hydrolysis time and other process parameters (Niu, Shah, & Kontoravdi,
2016). As mentioned previously, the addition of hemicellulases and lignin
degrading enzymes or surfactants may also improve the hydrolysis of
lignocellulosic substrate.
2.1.1 Rate decreasing effects and substrate-enzyme interactions
As described in the previous section, there are multiple enzymes and reaction routes
involved in the enzymatic hydrolysis of cellulose. As the substrate is mainly
insoluble and therefore substrate is rarely in excess, the traditional Michaelis-
Menten kinetics cannot be assumed to apply (Lynd, Weimer, van Zyl, & Pretorius,
2002). However, Michaelis-Menten based models have successfully been applied
to fit experimental data (Zhang & Lynd, 2004). The initial degradation rate is
usually relatively high but the reaction rate decreases rapidly already at low degrees
of conversion below 30% (Bommarius et al., 2008). Even some obvious effects
such as enzyme inhibition due to accumulation of glucose and cellobiose do not
fully explain the observed phenomena. Several other explanations have been
proposed for this observation. These explanations are related to decrease in enzyme
activity (inactivation), modifications in the substrate structure, and changes in
enzyme-substrate interactions during the hydrolysis process.
Decrease in enzyme adsorption per remaining substrate has been measured in
many studies (Bansal et al., 2012; Nidetzky & Steiner, 1993; Ooshima, Sakata, &
Harano, 1983). As only adsorbed enzyme can be active, the decrease in the amount
of adsorbed enzyme would result in decreased reaction rate. However, enzyme
25
adsorbed on the substrate surface may also be inactive, thus also blocking the active
adsorption of fresh enzyme. Inactivation of the adsorbed enzyme – either reversible
or irreversible – has been attributed to be the leading cause for the observed
decrease of the hydrolysis rate in many studies (Converse, Matsuno, Tanaka, &
Taniguchi, 1988; Drissen et al., 2007; Kurakake, Shirasawa, Ooshima, Converse,
& Kato, 1995; Ooshima, Kurakake, Kato, & Harano, 1991). Some mechanistic
explanations have been provided for the inactivity of the adsorbed enzymes. In the
non-productive adsorption, CBHs are bound only by their CBD so that the catalytic
domain is not active. Crowding effect in which the non-productive binding causes
“traffic jams” on the cellulose surface and thus decreases the efficiency has been
shown by (Igarashi et al., 2011).
One of the reasons for the changes in enzyme-substrate interactions are related
to the inevitable changes in the microscopic structure of the substrate. As different
cellulose and lignocellulose materials are highly heterogeneous in structure, the
degradation of cellulose, hemicellulose and lignin inevitably affects the substrate
properties. Therefore, the substrate has a large effect on the changes during
hydrolysis. (Liu, Wang, Hou, Chen, & Wu, 2016; Luterbacher, Moran-Mirabal,
Burkholder, & Walker, 2015; Mansfield, Mooney, & Saddler, 1999; Mooney,
Mansfield, Beatson, & Saddler, 1999; Olsen, Donohoe, Borch, Westh, & Resch,
2016; Pihlajaniemi, Sipponen, Kallioinen, Nyyssölä, & Laakso, 2016) As a
conclusion, it can be said that the rate decreasing effects are mainly related to the
non-productive binding of enzymes (CBH) and steric hindrances to enzyme
adsorption (EG, CBH) due to substrate erosion and non-productively bound
enzymes (Payne et al., 2015; P. Väljamäe, Sild, Pettersson, & Johansson, 1998).
2.1.2 Advantages and issues in high consistency processes
For the further utilization of the hydrolysate, it would be desirable that the glucose
concentration in the hydrolysate is as high as possible. With increasing glucose
concentration, the volume of process equipment can be reduced, thus reducing the
related capital costs. Furthermore, also the downstream processing costs are related
to the substrate and product concentrations. For example, in bioethanol production,
it is estimated that the ethanol concentration should be above 4% (w/w) to maintain
the distillation costs in a feasible range (Galbe, Sassner, Wingren, & Zacchi, 2007;
Zacchi & Axelsson, 1989). To achieve this, the substrate concentration for
hydrolysis should be in the range of 20% (w/w) depending on the glucan content
of the substrate and overall yield in hydrolysis.
26
It seems, however, that the decrease in reaction rate with increasing conversion is
more profound if the initial substrate concentration is high. As concluded by
Kristensen, Felby, and Jørgensen (2009) based on their experiments and analysis
of literature data, the decrease in yield in batch experiments has been almost linear
with respect to initial solids concentration. In these experiments, the amount of
enzyme has been calculated based on the substrate concentration, and the ratio (e.g.
FPU per gram substrate) has been kept constant. In simple, ideal enzymatic
processes, this should not affect the yield. Near 100% conversion can typically be
achieved for low substrate concentration and typical enzyme dosages (up to 2%
w/w substrate and 5 – 20 FPU/g enzyme) but increasing the substrate concentration
to 20% (w/w) may decrease the conversion below 50%. (Kristensen et al., 2009) In
addition to effects on yield, increasing the amount of solids in the reactor changes
the rheology of the suspension and increases the apparent viscosity and the power
required for mixing. Fibre suspensions with high solid content are non-Newtonian
and exhibit shear thinning behaviour and often also a yield stress. The rheological
characteristics are highly dependent on the fibre structure, which also varies during
the hydrolysis as the fibres are degraded. Therefore, the flow conditions may also
vary during the hydrolysis process.
Some of the mechanisms that have been accounted for the decrease in the rate
of the hydrolysis were described in the previous section. However, there is still no
clear understanding of why this phenomenon seems to be more profound with
higher substrate concentrations. (Bommarius et al., 2008) found that jamming of
adjacent enzymes adsorbed on microcrystalline cellulose became significant only
at high enzyme concentrations. In their experiments, the effect of substrate
concentration was not studied, but the experiments were made at relevant substrate
concentrations (10% w/v) and enzyme concentrations from 1 to 150 mg/ml.
Increasing the substrate concentration and maintaining constant enzyme/substrate
ratio would also increase the enzyme concentration in the system, which was
accounted for the jamming effect in the study.
There have been many studies on the possible effect of insufficient mixing on
hydrolysis. In theory, poor mixing could cause local gradients in glucose
concentrations and increase the effect of end product inhibition, as well as hinder
the accessibility of the cellulose for the enzymes. The results are ambiguous and
may depend on the substrate properties. However, sufficient mixing is required for
the hydrolysis process and optimal mixing conditions have been established in
many studies (Hodge, Karim, Schell, & McMillan, 2008; Kinnarinen et al., 2012;
Palmqvist, Kadić, Hägglund, Petersson, & Lidén, 2016; Palmqvist & Liden, 2012;

27
Samaniuk, Scott, Root, & Klingenberg, 2011; Wojtusik, Zurita, Villar, Ladero, &
Garcia-Ochoa, 2016).
Of particular interest is the study by Palmqvist et al. (2016) conducted in
laboratory (2 litre) and demonstration scale (4 m3) reactors with varying specific
power inputs, which were 0.23, 0.45 and 2.25 kW/m3 (laboratory scale) and 0.18
0.23 and 0.45 kW/m3 (demonstration scale). The hydrolysis yields increased with
power input in the laboratory scale. However, similar yields were achieved in the
demonstration scale with lower power input, and the yields were in fact more
correlated to the average Reynolds number in the reactor. This suggests that
sufficient bulk flow conditions are important to avoid mass transfer limitation, and
these are achieved with lower impeller power input in the large scale.
As mentioned previously, increasing the substrate concentration has a large
effect on the rheological properties of solid-liquid suspension. Biomass
suspensions in relevant concentrations are highly viscous and shear-thinning fluids.
The measurement of viscosity by common rotational rheometers is difficult due to
solid fibre particles that may settle during the measurement and cause other issues.
Stirred tank reactors used for enzymatic hydrolysis are often operated in the laminar
or transitional region. In this flow regime, the power required for agitation at
constant stirrer speed is highly dependent on the viscosity of the slurry, and
increasing viscosity increases the power requirement as well. In addition to the
solids concentration, also the fibre structure has a large effect on the rheology of
the slurry. Several studies have shown that the apparent viscosity of the slurry and
power required for agitation decreases rapidly during the first hour of hydrolysis.
During this time, the conversion is still rather low and the decrease in solid content
is not very significant. (Palmqvist & Liden, 2012; Rosgaard, Andric, Dam-
Johansen, Pedersen, & Meyer, 2007; Sotaniemi, Taskila, Ojamo, & Tanskanen,
2016). This rapid degradation of the fibre structure and decrease of the slurry
viscosity has been utilized in fed-batch processes. By using the fed-batch approach,
high solids content (based on the total added solids) can be achieved still
maintaining the apparent viscosity and power required for agitation at reasonable
levels while providing sufficient mixing conditions for the hydrolysis (Cardona et
al., 2015; Hodge, Karim, Schell, & McMillan, 2009; Sotaniemi et al., 2016).
2.1.3 Kinetic models
Many of the factors influencing enzymatic hydrolysis cannot be quantified
separately since they are interrelated and this adds challenges also to the description
28
of the reaction kinetics. Despite this, several kinetic models for cellulose hydrolysis
have been developed. Some models take into account the substrate morphology in
a mechanistic sense (Zhang & Lynd, 2004) or by fractal kinetics (Kostylev &
Wilson, 2013; Priit Väljamäe, Sild, Nutt, Pettersson, & Johansson, 1999; Wang &
Feng, 2010), degree of cellulose polymerization through population balance
equations (Griggs, Stickel, & Lischeske, 2012; Hosseini & Shah, 2011; Lebaz,
Cockx, Spérandio, & Morchain, 2015) or some other phenomena that may affect
the reaction rate. These include decrease in reaction rate with respect to conversion
(Drissen et al., 2007; Kadam, Rydholm, & McMillan, 2004; Liao, Liu, Wen, Frear,
& Chen, 2008) or decrease in reaction rate due to first order inactivation of enzyme
during hydrolysis (Ye & Berson, 2011) or due to competing reaction (Tsai, Morales-
Rodriguez, Sin, & Meyer, 2014).
It is a well-known issue in the development of hydrolysis models that the
identifiability of the parameters has remained poor or studies regarding the
reliability and sensitivity of the parameters have been omitted. Some previous
studies, however, include a rigorous assessment of the parameter uncertainty and
model validity (Niu et al., 2016; Scott et al., 2015; Sin, Meyer, & Gernaey, 2010).
Depending on the system that has been used for the model development and the
quality of the model, using the models for extrapolation should be done with
caution. The main approaches to improve the model are modification of the model
structure and/or performing experiments that obtain more information of the
process.
A large proportion of the modelling efforts has been done for batch processes,
instead of fed-batch processes investigated in this work. Regarding the observed
rate decreasing factors, it is difficult to identify the effect of different phenomena
based on the data from batch experiments with constant control variables. (Flores-
Sánchez, Flores-Tlacuahuac, & Pedraza-Segura, 2013) used a model-based
nonlinear experimental design to improve the parameter identifiability. Their
approach was to determine an optimal control profile for the temperature in a batch
hydrolysis, which improved the quality of parameter estimates, especially for
reaction rate constants and activation energies. A more general review of model-
based design of experiments using dynamic models is written by (Franceschini &
Macchietto, 2008). In sections 3.2, 3.4.1 and 4.2 of this work, we have used fed-
batch methods for experimentation and kinetic modelling in order to increase the
information content of the experiments and thus improve the understanding of the
hydrolysis process and the model identifiability.
29
2.2 Aerobic cell cultivations
A majority of industrial production processes utilizing microbial cells are
submerged fermentation processes. That is, the continuous phase is liquid in which
the cells are submerged. Furthermore, a large part of the processes are aerobic in
which the cells require oxygen for respiration. Oxygen is provided from gas phase
containing molecular oxygen, usually air. This adds a third phase, making the
reactors contactors for three phases – liquid, solids (cells) and gas. In contrast to
the fibre suspensions in cellulose hydrolysis, the solid phase in yeast and bacterial
cultivations does not typically have such a large effect on the rheological properties
of the broth. In addition, the density of cells is near to that of water, and the solid
suspension task of the reactor is usually not critical compared to fluid mixing and
mass transfer. Therefore, the reactors for microbial cultivations in this thesis are
assumed to be two-phase (liquid-gas) systems. In some cases such as cultivation of
filamentous fungi or formation of extracellular polysaccharides, however,
cultivation broths with non-Newtonian shear thinning rheology with high apparent
viscosity are encountered. In aerobic cultivation, the dissolution of oxygen from
the gas phase to the liquid phase is also a very important task for the reactor.
2.2.1 Effect of dissolved oxygen and sugar concentration on yeast
metabolism
Many industrially important yeast species are able to utilize simple sugars such as
glucose by both aerobic and anaerobic metabolism. The preferred metabolic route
depends on the species, as well as the culture conditions such as the concentration
of dissolved oxygen or sugar(s) in the cultivation medium. Yeasts can be divided
into obligate aerobes and facultative anaerobes based on their metabolism. Obligate
aerobes such as Rhodotorula spp. can only grow by respirative metabolism and
thus require oxygen for growth. A majority of yeasts, however, are facultative
anaerobes that can metabolize glucose and other sugars in an oxido-reductive
manner. (Rosenfeld & Beauvoit, 2003) Both metabolic routes – aerobic respiration
and anaerobic fermentation – may be active simultaneously in the facultative
anaerobes. The relative rate of the metabolic route depends mainly on the type and
concentration of the sugar and availability of oxygen, and there are several
mechanisms that affect the distribution of respiration/fermentation in different
yeasts. It should be noted, however, that respiration is much more efficient

30
compared to fermentation in producing energy for the cells in the form of ATP. The
mechanisms to regulate the sugar metabolism vary between different yeast species.
One important phenomenon, in addition to oxygen availability, is repression of
respiration by glucose leading to fermentative metabolism even in aerobic
conditions. This is typical of Saccharomyces spp., in particular. Although this
phenomenon is sometimes referred to as Crabtree effect, and accordingly, yeasts
are often divided into Crabtree-positive and -negative species, the original meaning
of the term relates to the depletion of mitochondrial adenosine diphosphate (ADP)
in tumour cells. This is different from the mechanism of the observed fermentative
metabolism in yeasts. Actually, the mechanism in yeasts is more related to
repression of genes encoding respiratory enzymes, and thus glucose repression is a
preferred term for this effect in yeasts. (Barnett & Entian, 2005)
In practice, this means that the concentration of glucose in the growth medium
has to be controlled at a very low level in order to avoid the fermentative
metabolism in the cultivation of for instance the common Baker’s yeast,
Saccharomyces cerevisiae. The production processes are often operated as glucose
limited fed-batch or continuous (chemostat) cultivations in which glucose and other
nutrients are fed into the reactor. Thus, control of the feed rates as well as good
mixing of the reactor are important in order to maintain the glucose concentration
below the repression levels namely below 0.1 g/l. This is, however, often
impossible due to mixing limitations in large scale reactors. Therefore, the local
concentrations of substrates near the feeding points may exceed the critical values
for glucose repression and result in fermentative metabolism. In many other yeasts,
such as most Pichia, Candida and Kluyveromyces species, the glucose repression
is not encountered, and the onset of fermentative metabolism is mainly determined
by the availability of oxygen.
There are also other observed effects of oxygen availability and the type of
sugar used on the rate of oxidative vs. fermentative metabolism, namely Kluyver,
Custers and Pasteur effects. Kluyver effect is related to utilization of disaccharides
such as maltose, lactose and sucrose. Yeasts exhibiting Kluyver effect on a certain
disaccharide can utilize this sugar under aerobic conditions but are unable to
ferment the sugar. (Sims & Barnett, 1978) Custers effect is characteristic of the
genera Brettanomyces and Dekkera, which ferment glucose to ethanol and CO2
faster in aerobic than anaerobic conditions. The Pasteur effect is the inhibition of
glycolysis by oxidative phosphorylation or stimulation of glycolysis by anaerobic
conditions meaning that the glucose uptake rate is higher in anaerobic compared to
aerobic conditions. (Rosenfeld & Beauvoit, 2003). Since the present work concerns

31
cultivation of Pichia pastoris on glucose, Kluyver and Custers effects were not
considered in the experimental part. Pasteur effect, however, is important in all
facultatively fermentative yeasts that do not exhibit glucose repression.
From the industrial biotechnology point of view, P. pastoris is a very interesting
organism for recombinant protein production. As discussed in the review by
Cereghino and Cregg (2000), the industrial interest stems back to 1970’s as the
ability of P. pastoris to reach high cell densities when grown on methanol made it
a potential organism for single cell protein (SCP) production. The price
development of alternative protein sources such as soy bean made the SCP process
uneconomical. However, further research on the methanol metabolism showed that
the enzyme alcohol oxidase (AOX) involved in the methanol utilization is encoded
by two genes. Especially the pAOX1 promoter was particularly suitable to be used
for foreign gene expression as an inducible promoter as it is highly regulated by
methanol. In addition, glyceraldehyde 3-phosphate dehydrogenase (GAP)
promoter provides a strong constitutive expression on glucose.
The growth on methanol is an aerobic process, and oxygen limitation results in
the limitation of methanol utilization and growth (Baumann et al., 2008). This
applies also to the growth using ethanol as a carbon and energy source. However,
oxygen limitation on glucose does not necessarily limit the substrate consumption
rate but affects the metabolic pathways. The effect of oxygen availability on the
production of ethanol (fermentative metabolism) and glucose uptake rate has been
observed in many chemostat experiments (Baumann et al., 2010, 2008, Carnicer et
al., 2009, 2012; Solà, Maaheimo, Ylönen, Ferrer, & Szyperski, 2004). Oxygen
limitation was achieved by altering the inlet gas oxygen concentrations during
chemostat or fed-batch cultivations. The results clearly show increased glucose
uptake rate but lower growth rate in oxygen limited conditions. Ethanol is the major
by-product from fermentative metabolism in the oxygen limited conditions. As a
conclusion, the availability of oxygen has a large effect on the metabolism of P.
pastoris. As its respirative-fermentative metabolism is not affected by glucose
concentration, it is a suitable organism to be used for studying the oxygen transfer
effects also in batch cultivations.
2.2.2 Gas-liquid mass transfer
In submerged cultivations of aerobic microbes, it is essential that the oxygen
supplied in gas phase will be transferred into the liquid phase to be available for
the microbe. The solubility of oxygen in aqueous solution is well described by

32
Henry’s law, i.e. it is dependent on the partial pressure of oxygen in the gas phase
and Henry’s constant, which in turn is a function of temperature and composition
of the aqueous phase. In the common temperature and pressure ranges used in
bioreactors, the solubility of oxygen is in the range of 6 – 8 mg/l (0.19 – 0.25 mmol/l)
if air is used as the gas phase (Doran, 2012). The oxygen uptake rate of different
microbes is usually such that a growing microbial population can deplete the
dissolved oxygen in few seconds unless oxygen is continuously transferred into the
liquid phase. Furthermore, as discussed in the previous section, it is advantageous
to maintain the dissolved oxygen concentration above a critical value in order to
ensure the optimal growth rate of the microbe and to suppress any unwanted
metabolic routes such as fermentative metabolism.
Thus, the oxygen transfer rate is an important parameter for process design.
There are several interphases (gas/liquid, liquid/cell and intracellular compartments)
for the transfer of oxygen molecule from gas phase inside the cell, all of which may
have an effect on the overall rate. The subject has been studied extensively, and
current understanding is that the rate limiting step is the transfer rate from the gas-
liquid interface into the bulk of the liquid as reviewed by Garcia-Ochoa and Gomez
(2009). The dissolved oxygen concentration in the liquid is dependent on the
oxygen transfer rate (OTR, g l-1 h-1) from gas to liquid phase and the oxygen uptake
rate (OUR, g l-1 h-1) of the microbes. The equations used to describe the kinetics of
oxygen transfer – rate of change in dissolved oxygen (1), oxygen transfer rate (2),
Henry’s law for oxygen saturation concentration (3) and empirical equation to
estimate the value of overall mass transfer coefficient (4) – are listed below.
33
o = OTR − OUR, (1)
OTR = L ( osat − o), (2)
osat = o,gasH , (3)
L = A s , (4)
= , (5)
where co is the dissolved oxygen concentration, kLa is the volumetric mass transfer
coefficient, cosat is the saturation concentration of oxygen in liquid, yo,gas is the
fraction of oxygen in gas, kH is Henry’s constant for oxygen in water, P is pressure,
PA is agitation power, V is volume, vs is superficial gas velocity, Qg is the volumetric
flow rate of gas, T is the tank diameter, A, α and β are empirical parameters. All the
parameters may be subject to change during a cultivation process. The volumetric
mass transfer coefficient can be divided into mass transfer coefficient kL and
interfacial area a, which are both affected by the hydrodynamic conditions inside
reactor, as well as the chemical composition of the cultivation medium. Saturation
concentration can be estimated by the Henry’s law as described previously, and is
dependent on the oxygen mole fraction of the gas phase and pressure, among other
things. Although the correlation to predict the value of kLa, is presented in scale-
independent volumetric form, the empirical constants are scale-dependent and the
applicability range of the equations is limited. (Nauha, Visuri, Vermasvuori, &
Alopaeus, 2015) Furthermore, significant spatial variation of kLa, oxygen
concentration in gas and liquid phases and pressure are expected in industrial scale
reactors.
2.2.3 Reactor design and scale-up
Laboratory scale stirred tank reactors (STR) can often be regarded as ideally mixed.
With increasing scale, the mixing time inevitably increases as does the effect of gas

34
phase dynamics on gas-liquid mass transfer. Bioreactors above 1 m3 scale have
typically high aspect ratio in which ratio of liquid height to tank diameter (H/T) is
in the range of 2 – 4. A large part of fundamental theory regarding mixing in stirred
tanks has been developed for so-called standard geometry with H/T = 1 and with a
single impeller for agitation. Since the aspect ratio of production scale bioreactors
is higher, several impellers are usually required in order to ensure sufficient mixing.
This adds complexity to the situation, and the correlations established at standard
geometry cannot be used as such. A short review on the bulk dispersion mixing and
gas dispersion relevant to stirred bioreactors is presented in the following.
Impeller types and liquid circulation
The common impeller types used in bioreactor applications are often divided into
axial and radial impellers depending on the flow direction. Radial impellers pump
the liquid towards the vessel wall, whereas the direction using axial impellers is
upwards or downwards. Traditionally, radial impellers have been used in
bioreactors for their good gas dispersion capacity. The Rushton turbine (or flat
blade turbine) has been in use for several decades, and there are modifications to
improve the gas handling capacity by concave disc turbine design. Recently, axial
impellers have gained more interest due to their good liquid blending and
suspension efficiency. Improvements in the design of axial impellers – especially
hydrofoil impellers – have improved also the gas handling capacity, which has been
the major bottleneck for using axial impellers in bioprocesses with high gas input.
However, issues regarding flow instabilities still remain. (Nienow, 1998)
When multiple impellers are used along the same axis, the flow pattern and the
mixing efficiency depend on the number, type and positioning of the impellers and,
obviously, on the agitation intensity. Depending on the mixing system, there is
usually some compartmentalization in the bulk flow. This is mainly due to
recirculation loops that form around the impellers, and the compartmentalization is
more significant in the case of radial impellers. Efficient exchange flow between
the impellers is essential in order to keep the overall mixing time as short as
possible (Gogate, Beenackers, & Pandit, 2000; Moucha, Linek, & Prokopová, 2003;
Vrábel, van der Lans, Luyben, Boon, & Nienow, 2000).
35
Gas flow
Gas is usually sparged below the lowest impeller of a stirred tank reactor, and the
gas forms cavities behind the low pressure areas of the rotating impeller blades.
Depending on the impeller geometry and rotation rate as well as the gas flow rate,
gas is dispersed by the impeller with varying efficiency. Flow regimes at the
impeller can be roughly categorized, with increasing dispersion efficiency, into
flooding, loading and complete recirculation. The cavity structure also affects the
power required for agitation, and the gassed power consumption may be
significantly lower than ungassed power consumption. (Paul et al., 2004) In
addition, even with sufficient gas dispersion by the impeller, high gas flow rates
may cause a transition from homogeneous to heterogeneous flow regime. In the
homogeneous regime in STR, the flow is considered to be controlled by the
impeller pumping, whereas in the latter, the flow is controlled by gas flow. As a
consequence, there is formation of large bubbles and bimodal bubble distribution
in the heterogeneous regime. The transition depends mainly on the superficial gas
velocity (vs) and occurs approximately at vs = 0.03 m/s. (Gezork, Bujalski, Cooke,
& Nienow, 2000)
The superficial gas velocity is also present in many empirical correlations, and
it is often used to estimate the gas flow rate in different scales. If the gas flow is
scaled by constant vs, volumetric gas flow related to liquid volume, expressed as
volume gas per volume liquid per minute (VVM), decreases as it scales by V-1/3.
From the stoichiometric point of view, it would be preferred to have a constant ratio
of gas flow to liquid volume. The following equations describe the volume fraction
of gas in the dispersion (6), and gas phase residence time (7). = = , (6)
= , (7)
where ε is the gas hold-up, V is volume, τg is the gas residence time and Qg is
volumetric gas flow, respectively. For gas hold-up, a similar correlation is often
used as for the volumetric mass transfer coefficient. The equation (8) was proposed
by (Peter Vrábel et al., 2000). They also noted, however, that the model parameters
are scale-dependent, and the exponent on (P/V) may be much larger in laboratory
scale reactors (>0.3) compared to the value of 0.16 used here. By using the
36
correlation for gas hold-up (8) and geometry of the vessel, however, an indicative
equation for gas phase residence time as a function of scale can be derived (9). = 0.37( A/ ) . s . , (8)
= 0.37 s . ( A/ ) . / ( / ) / . (9)
The gas residence time increases with V1/3, similar to decrease in VVM-value. Also,
increasing the aspect ratio would increase the gas residence time, and typically
industrial reactors have higher aspect ratios compared to laboratory and pilot scale.
As oxygen is constantly transferred from gas to liquid, depletion of oxygen from
the gas becomes increasingly significant in these cases. This, in its turn, decreases
the driving force for mass transfer, which may lead to mass transfer limited
conditions. The exponent for vs is 0.55-1 = -0.45, so increasing the gas flow rate
would decrease the gas residence time and also affect positively gas hold-up and
mass transfer coefficient as long as the gas flow stays below the flooding limit.
The effect of hydrostatic pressure is also notable in large vessels with high
aspect ratios. For a reactor with H/T = 3, the hydrostatic pressure at the bottom
would be about 1 bar for a 100 m3 reactor and 2.2 bar for a 1000 m3 reactor.
Increased hydrostatic pressure directly increases the partial pressure of oxygen and,
thus increases the driving force for mass transfer. In addition, at higher pressure
and increased gas density, the conditions controlling homogeneous/heterogeneous
transition conditions are different. Therefore, it is possible that flow in the bottom
part is homogeneous and transition to heterogeneous flow regime occurs in the
higher parts of the reactor with lower hydrostatic pressure. The effect may be
similar for the flooding/loading transition of the impellers. (Nauha et al., 2015) The
flooding regime of the impellers, however, needs to be distinguished from the
homogeneous and heterogeneous flow regimes, and it is affected by gas flow rate
and the diameter, revolution rate and geometry of the impeller. The effects of gas
on bulk mixing of the dispersion are complex, and the mixing efficiency may be
enhanced or decreased depending on the flow regime (Gogate et al., 2000).
Alternative stirred reactor concepts
One option to enhance liquid circulation, which may be one of the key bottlenecks
in stirred bioreactors in large scale, is to add a draft tube to control the bulk

37
dispersion flow. Several designs have been tested and published in the previous
literature. Depending on the basis of reactor development, these reactors are
sometimes called stirred airlift or stirred draft tube reactors. Strictly speaking, airlift
reactor (ALR) refers to a reactor type with no mechanical agitation, and the mixing
is caused only by the gas flow. Thus, stirred draft tube reactor (SDTR) is the
preferred term, and it is used in this thesis. Previous designs differ mainly in the
number, type and positioning of impeller(s), as well as whether the flow direction
inside the draft tube is upwards or downwards. The summary of the reactor and
experimental design is presented in Table 2.
Cell cultivations were carried out in the studies of (Ahamed & Vermette, 2010;
Moo-Young, Chisti, & Vlach, 1993; Pollard, Ison, Shamlou, & Lilly, 1997). SDTR
was found to be the most efficient compared to the STR and/or ALR counterparts.
This was mainly accounted for by the enhanced liquid circulation, and (Pollard et
al., 1997) mentioned that dissolved oxygen concentration gradients were reduced,
and oxygen uptake rate of the yeast cells was increased. In studies concentrated to
mixing and mass transfer, (Chisti & Jauregui-Haza, 2002) concluded that SDTR
increases mixing performance and oxygen transfer although the oxygen transfer
efficiency in terms of power consumption decreased compared to regular ALR.
(Lueske, Kar, Piras, & Pressler, 2015) compared SDTR with regular down-
pumping STR and measured higher kLa but lower gas hold-up for the draft tube
reactor at the same power input. (Rostami, Fu, & Moo-Young, 2005) compared
SDTR with ALR and measured lower hold-up and kLa values for the agitated draft
tube geometry. They also proposed different designs to be tested in agitated draft
tubes for air distribution, as well as for agitation, such as utilizing radial flow
impellers instead of axial flow impellers that were used in their study.

38
Ta
ble
2. D
raft
tu
be
re
acto
rs i
n b
iore
acto
r a
pp
lic
ati
on
s,
mo
dif
ied
fro
m p
ub
lic
ati
on
(II
I).
Flow
dire
ctio
n
in D
T
Tota
l num
ber,
type
and
pos
ition
ing
of th
e
impe
ller(
s)
Mea
sure
d re
spon
ses
Var
iabl
es
Ref
eren
ce
Up
1; a
xial
(pro
pelle
r) in
side
DT
Mic
robi
al g
row
th a
nd p
rodu
ct fo
rmat
ion
Agi
tatio
n (o
n/of
f) (A
ham
ed &
Ver
met
te, 2
010)
Dow
n 2;
axi
al (h
ydro
foil)
impe
llers
insi
de D
T G
as h
old-
up, k
La, l
iqui
d ci
rcul
atio
n A
gita
tion,
gas
flow
, liq
uid
visc
osity
(Chi
sti &
Jau
regu
i-Haz
a,
2002
)
Dow
n 2;
axi
al (h
ydro
foil)
impe
llers
insi
de D
T M
icro
bial
gro
wth
D
raft
tube
(with
/with
out)
Moo
-You
ng e
t al.,
199
3
Dow
n 1;
axi
al (p
rope
ller)
at t
he lo
wer
par
t of D
T M
icro
bial
gro
wth
, OU
R, D
O-
hete
roge
neity
, gas
hol
d-up
, kLa
, liq
uid
circ
ulat
ion
Agi
tatio
n, g
as fl
ow, H
/T
(Pol
lard
et a
l., 1
997)
Dow
n 2;
axi
al (h
ydro
foil)
impe
llers
insi
de D
T G
as h
old-
up, k
La
Agi
tatio
n, g
as fl
ow, l
iqui
d
visc
osity
(Ros
tam
i et a
l., 2
005)
Up
1; a
xial
(pro
pelle
r) o
r rad
ial b
elow
DT
Gas
hol
d-up
, kLa
A
gita
tion,
gas
flow
, liq
uid
visc
osity
, im
pelle
r typ
e
(Jes
us, N
eto,
San
tana
, &
Filh
o, 2
015)
Dow
n 3;
2 a
xial
(hyd
rofo
il) im
pelle
rs in
side
DT
and
a R
usht
on tu
rbin
e be
low
DT
Gas
hol
d-up
, kLa
, gas
sed
pow
er
Agi
tatio
n, g
as fl
ow
(Lue
ske
et a
l., 2
015)
Up
1; a
xial
(pro
pelle
r) a
t the
low
er p
art o
f DT
Gas
hol
d-up
, kLa
, liq
uid
circ
ulat
ion
Agi
tatio
n, g
as fl
ow, l
iqui
d
visc
osity
, sol
id c
onte
nt
(Ban
g, N
ikov
, Del
mas
, &
Bas
coul
, 199
8)
Dow
n 2;
1 a
xial
abo
ve D
T an
d 1
radi
al b
elow
DT
k La
Agi
tatio
n, g
as fl
ow, d
rag-
redu
cing
age
nt
(Kur
a, N
ishi
umi,
& K
awas
e,
1993
)
39
2.2.4 Modelling of microbial cultivation processes
Growth models
Cell metabolism and growth relate to a very complex network of enzyme catalysed
reactions. Even more complexity to the system comes from the genetic regulation
of enzyme production which reflects the causality of metabolic routes and
environmental factors. There are many approaches for simplification of the cell
metabolism in order to model the cell growth, including the uptake of the
substrate(s) and the formation of cell mass and products of metabolism. The
principle should be to keep the model as simple as possible while including the
phenomena that are essential to explain the observed phenomena. (Villadsen, 2011)
In addition, one should consider the model parameter estimation and validation
based on the experimental data.
Basic unstructured kinetic models are the simplest, and they relate the
consumption and production of all compounds with respect to the consumption rate
of one key reactant. Often, a specific glucose (or other substrate) consumption rate
is the key reaction rate equation, and biomass growth rate, oxygen consumption
rate, etc. are described by using stoichiometric relations between substrate and
other compounds. The stoichiometry can be estimated from measured yield
coefficients, for example. The yield coefficients in this type of models are assumed
to be constant. The rate equation may be the Monod model for the limiting substrate
or more complex type, including also substrate and/or product inhibition or the
effect of oxygen availability. A common factor in basic unstructured models is the
assumption that the flux distribution through all different cellular pathways is
constant, and only the substrate consumption rate affects the magnitude of the flux.
Thus, this type of model fails to capture the effect of sugar or oxygen availability
on the distribution of respirative/fermentative metabolism, which is an important
phenomenon in facultatively anaerobic yeasts.
Building on the principle of unstructured models, multiple substrates and
reactions can also be included in the model. Both respirative and fermentative
metabolism can be captured in this type of model by writing a net reaction for each
metabolic route. In these reactions, the yield coefficients for cell mass and other
compounds depend on the metabolism, and the rate equations usually include
multiple substrates. Truly structured models include intracellular compartments
such as amino acids, ATP, storage carbohydrates and intermediates related to
product formation, for example (Tang et al., 2017). Structured models are

40
particularly suitable to describe the production of secondary metabolites that are
not directly associated with cell growth. In the framework of this thesis, an
unstructured model with multiple substrates and reactions is the simplest type of
model that can be used to describe the effect of oxygen on yeast metabolism and
growth. This type of model can be used to evaluate the effects of operational
conditions and reactor scale on the growth, thus allowing evaluation of reactor
efficiency.
Reactor models
Similar to the modelling of cell metabolism, the mathematical description of gas-
liquid reactors can be done by different approaches with increasing complexity. In
the description of cell cultivation process, one should be able to use the growth
model along with the reactor scale model. The simplest models describe an ideally
mixed reactor in which there are no concentration gradients in gas or liquid phase,
and the transfer coefficients such as kLa are uniform in the whole reactor volume.
The next step with increasing complexity would be to divide the reactor into
compartments with different properties related to mixing and mass transfer. The
mass transfer coefficients for the compartments can be estimated from empirical
correlations (Oosterhuis & Kossen, 1984) or using results from computational fluid
dynamic (CFD) simulations in order to calculate the mass transfer coefficient from
mechanistic mass transfer models such as the two film theory or penetration theory
(Bashiri, Bertrand, & Chaouki, 2016). Similarly, bulk liquid flow between the
compartments can be estimated using semi-empirical equations (Vrábel, Van der
Lans, Cui, & Luyben, 1999; Vrábel et al., 2000) or CFD-simulations.
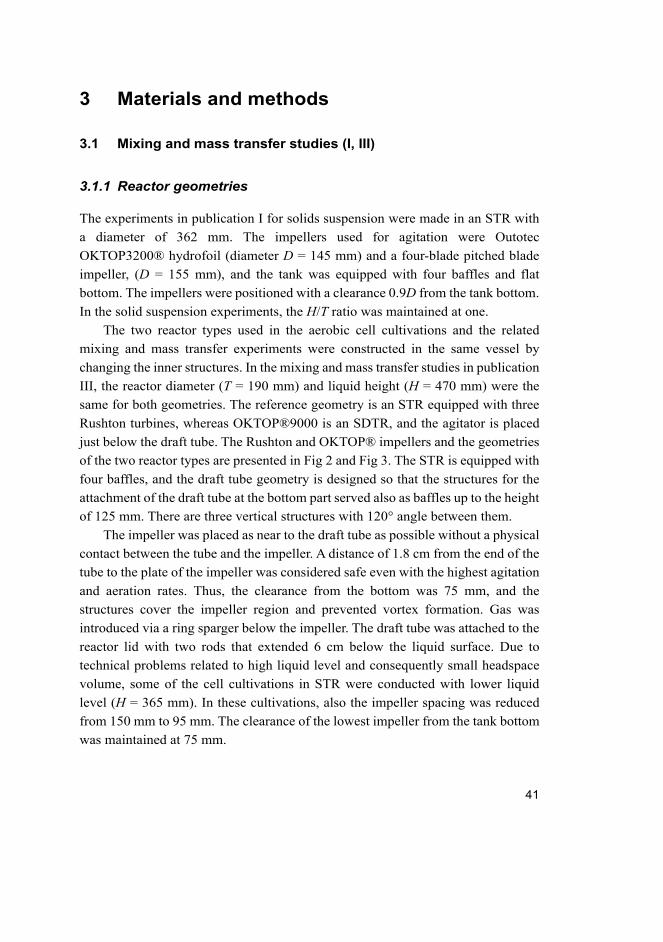
41
3 Materials and methods
3.1 Mixing and mass transfer studies (I, III)
3.1.1 Reactor geometries
The experiments in publication I for solids suspension were made in an STR with
a diameter of 362 mm. The impellers used for agitation were Outotec
OKTOP3200® hydrofoil (diameter D = 145 mm) and a four-blade pitched blade
impeller, (D = 155 mm), and the tank was equipped with four baffles and flat
bottom. The impellers were positioned with a clearance 0.9D from the tank bottom.
In the solid suspension experiments, the H/T ratio was maintained at one.
The two reactor types used in the aerobic cell cultivations and the related
mixing and mass transfer experiments were constructed in the same vessel by
changing the inner structures. In the mixing and mass transfer studies in publication
III, the reactor diameter (T = 190 mm) and liquid height (H = 470 mm) were the
same for both geometries. The reference geometry is an STR equipped with three
Rushton turbines, whereas OKTOP®9000 is an SDTR, and the agitator is placed
just below the draft tube. The Rushton and OKTOP® impellers and the geometries
of the two reactor types are presented in Fig 2 and Fig 3. The STR is equipped with
four baffles, and the draft tube geometry is designed so that the structures for the
attachment of the draft tube at the bottom part served also as baffles up to the height
of 125 mm. There are three vertical structures with 120° angle between them.
The impeller was placed as near to the draft tube as possible without a physical
contact between the tube and the impeller. A distance of 1.8 cm from the end of the
tube to the plate of the impeller was considered safe even with the highest agitation
and aeration rates. Thus, the clearance from the bottom was 75 mm, and the
structures cover the impeller region and prevented vortex formation. Gas was
introduced via a ring sparger below the impeller. The draft tube was attached to the
reactor lid with two rods that extended 6 cm below the liquid surface. Due to
technical problems related to high liquid level and consequently small headspace
volume, some of the cell cultivations in STR were conducted with lower liquid
level (H = 365 mm). In these cultivations, also the impeller spacing was reduced
from 150 mm to 95 mm. The clearance of the lowest impeller from the tank bottom
was maintained at 75 mm.
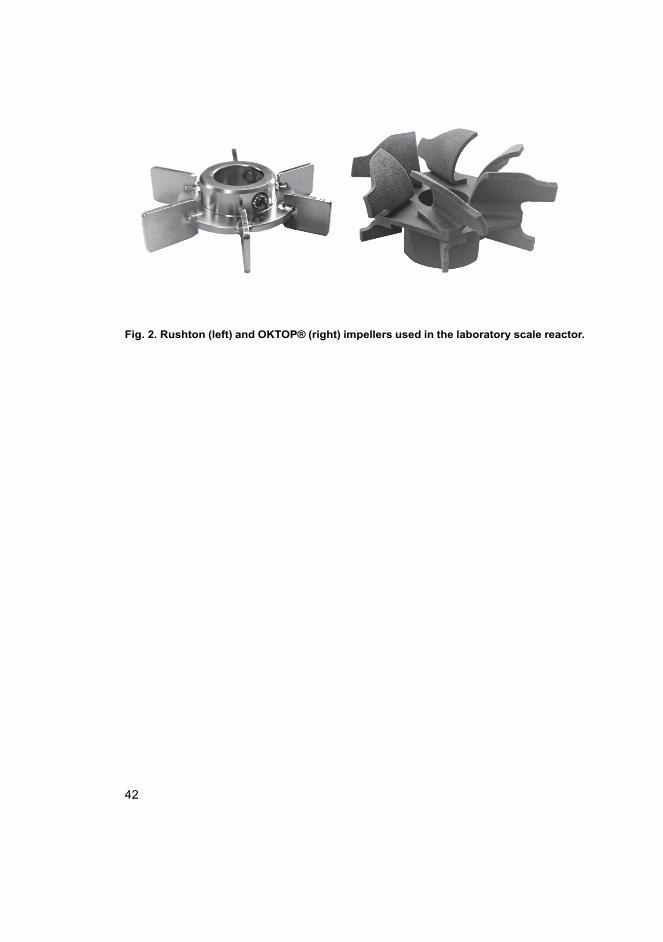
42
Fig. 2. Rushton (left) and OKTOP® (right) impellers used in the laboratory scale reactor.

43
Fig. 3. Reactor geometries and dimensions used in publications (III and IV). Stirred tank
with a diameter T = 190 mm, agitated with three Rushton turbines (left) and
OKTOP®9000 draft tube reactor (right). Reprinted with permission from Elsevier
(Publication III).
3.1.2 EIT in solid suspension and gas hold-up measurement (I, III)
Electrical impedance tomography (EIT) is a tomographic measurement technique
that is based on the electrical properties of an object. In the framework of this thesis,
the object is the reactor (STR or SDTR) or, more speficically, the two-phase

44
dispersion inside the reactor. The continuous phase is aqueous solution and the
dispersed phase can be distinguished from the continuous phase if there is a
conductivity difference between the two phases. In typical applications of two
phase reactors, the dispersed phase volume fraction is high, and the optical
properties are such that the multiphase dispersion is opaque. Therefore, many
common optical methods such as particle image velocimetry (PIV) and direct
image analysis are not suitable in all cases. On the contrary, EIT is not hindered by
optical properties and thus the applicability range is broader.
Fig. 4. Schematic representation on the EIT-system, including computer software,
tomography device and the measurement target with electrodes on the boundary of the
object.
The objective in EIT is to estimate the conductivity distribution of the measurement
domain. In the case of stirred tanks, the inner surface of the reactor is covered with
electrodes that are used for current injection and voltage measurement (Fig. 4). The
method is based on injecting an alternating current into the domain (around the
stirred tank reactor) through the opposite pair of electrodes and measuring the
voltage differences between the remaining adjacent electrodes. The conductivity
distribution within the domain affects the distribution of the electrical potential, and
the potential is measured around the domain between the electrodes. The current
injection and voltage measurement is repeated many times, usually so that all
combinations of opposite current injections have been explored. This results in an
inverse problem in which the conductivity distribution is estimated from the
measured voltages. Even though a vast amount of measurement data can be
collected, the measurements are only from the outside of the reactor and there are
45
multiple solutions for the conductivity distribution. Furthermore, small errors in the
measured data can lead to large errors in the estimated conductivity distribution.
Thus, the estimation procedure is a nonlinear ill-posed inverse problem, and more
details of the measurement and estimation methods can be found elsewhere
(Heikkinen et al., 2006; Heikkinen, 2005; Kourunen, Heikkinen, et al., 2011;
Kourunen, Niitti, & Heikkinen, 2011).
As discussed above, conductivity distribution within the domain is
reconstructed from the measured voltages. Previous knowledge of the system such
as reference voltages in a homogeneous solution (i.e. reactor filled with inner
structures and continuous phase only) and system geometry are required for the
estimation procedure. An EIT-system typically consists of computer software, a
device for current injection, voltage measurement and signal processing, and the
electrodes in the boundary of the process, as shown in Fig. 4. The experiments in
publication I for solids suspension were made in an STR with a diameter of 362
mm equipped with 64 electrodes. The experiments in publication III were made in
a reactor with a diameter of 190 mm equipped with 32 electrodes. The frequency
of alternating current was 10 kHz, and the amplitude was tuned based on the liquid
phase conductivity in order to keep the measured voltages within an appropriate
range.
For dispersed phase with very low conductivity, such as quartz sand and air
bubbles, the local volume fraction of the dispersed phase can be estimated from the
conductivity of the pure liquid (σl) and the measured conductivity distribution (σm).
By assuming a zero conductivity of the dispersed phase, the following equation can
be derived from Maxwell equations for the dispersed phase volume fraction, ε. = . ( ). (10)
In the measurement of solids distribution in publication I, the solid phase was
quartz sand with a density of 2,650 kg/m3 and it was sieved into three particle size
fractions (50 – 75, 75 – 100 and 125 – 180 μm). Experiments were performed at
two volume fractions of the solid phase (7.5 and 15%). In addition to the EIT-
measurement, the suspension was inspected visually by determining the cloud
height for each agitation rate and the so-called just suspended agitation rate in
which no particles remain stationary at the bottom for more than two seconds.
The local gas hold-up was measured in publication III for similar reactors as
described in the previous section with varying agitation and air flow rates.
Additional to the EIT-measurement, an overall value for gas hold-up was measured

46
visually as the difference between the dispersion height and ungassed liquid height.
A slide calliper was used to measure the dispersion level at the wall of the
transparent vessel during the EIT-measurements.
3.1.3 kLa measurement (III)
Overall gas-liquid mass transfer coefficient (kLa) was measured by gassing in /
gassing out experiments. Prior to each experiment, the liquid was sparged with
nitrogen to displace all oxygen. Agitation and gas flow were stopped for a brief
moment to let entrained gas bubbles escape from the liquid. The measurement was
started by switching on the air flow and agitation, and monitoring the dissolved
oxygen concentration with a side-entry dissolved oxygen probe (Oxyferm FDA 120,
Hamilton, Switzerland) at 10 cm level from the vessel bottom. The liquid phase
used in the experiments was 0.03 M MgSO4 solution to simulate the coalescence
behaviour of the medium used in cell cultivation studies which was non-coalescent
as discussed in publication III .
The value of mass transfer coefficient was estimated from the saturation phase
data using a perfectly mixed model for liquid phase and a plug flow model for the
gas phase (Pinelli, Liu, & Magelli, 2010). The response time of oxygen probe had
been measured to be 15 s, and it was taken into account in the estimation. The
following equations were used in the estimation procedure, describing the gas
phase oxygen concentration, measurement signal of the oxygen probe, actual liquid
phase oxygen concentration, and the saturation concentration.
, = , − L , − , (11)
, = , , (12)
= L ( − ), (13)
= , , (14)
where co,gas is the gas phase oxygen concentration, vs is the superficial gas velocity,
z is discretization parameter, kLa is the overall mass transfer coefficient, ε is the gas

47
volume fraction, kH is Henry’s constant, co is liquid phase oxygen concentration,
co,p is the oxygen concentration reading from the oxygen probe, τpr is the probe
response time and cosat is the saturation concentration of dissolved oxygen,
respectively. The gas hold-up was estimated from the EIT-experiments in similar
conditions (agitation, gas flow). A central difference scheme was used to transfer
the partial differential equation for co,gas into a series of ordinary differential
equations (ODEs). The ODE-system was solved in Matlab (ode15s), and the
value for kLa was estimated by minimizing the sum of squared residuals
(lsqnonlin) between the measured values and model-predicted co,p during the
saturation phase for each measurement point.
3.1.4 Power measurement (III)
The power consumption of agitation in the smaller tank with a diameter of 190 mm
was estimated from the power consumption of the agitator motor (6SM57S-3000,
Kollmorgen, US). Current and voltage data of the DC-servomotor was collected
from the servomotor amplifier (Servostar 600-series, Kollmorgen, US), and torque
was estimated based on the manufacturers torque constant from the current. The
power consumption (PA) was estimated from the measured torque (M) and impeller
revolution rate (N).
A = 2 . (15)
3.2 Enzymatic hydrolysis (II)
3.2.1 Enzymes, buffers and substrate
Hydrolysis experiments were carried out in a 50 mM sodium citrate – citric acid
buffer with a measured pH of 4.8. Qualitative filter paper 600 (VWR International
Europe BVBA, Belgium) was used as the substrate, and FlashzymePlus 2G (Roal
Oy, Finland) was used as the enzyme mixture. The cellulose content of the filter
paper is 79% as measured by the method described in (Sluiter et al., 2012). The
filter paper activity of the enzyme mixture is 111 FPU/ml, the cellobiase activity is
450 CB/ml (Sotaniemi et al., 2016), and the protein was measured to be 208 g/l by
A280 assay of Nanodrop spectrophotometer (Thermo Scientific, US).

48
3.2.2 Experimental arrangement
The small-scale hydrolysis experiments were conducted in 2 ml centrifuge tubes
with a total suspension volume of 1.6 ml. Substrate and buffer solution were added
to each tube and finally the tubes were placed to a heater-shaker (Thermomixer
Comfort, Eppendorf, Germany) to reach the reaction temperature (50 °C). After at
least ten minutes of incubation, enzyme was added to each tube to start the reaction.
No intermediate samples were drawn from the tubes due to the small volume but
tubes with identical initial volumes and compositions were prepared to allow
forming a series of measurements with different reaction times. After reaching the
end of the reaction time, the corresponding tubes were placed to boiling water for
ten minutes to inactivate the enzymes, then cooled down with ice and centrifuged
for five minutes at 16,000 rcf. Supernatant was removed for analysis.
Fed-batch experiments were carried out in a three litre stirred tank reactor
(Applikon Biotechnology B.V., Netherlands) equipped with a heating jacket to
allow maintaining a constant temperature of 50 °C. The reactor diameter was 13
cm and a down pumping pitched blade impeller with a diameter of 5.9 cm was used
for mixing at impeller revolution rates of 300, 400 or 500 rpm. Prior to starting the
experiment, the reactor was filled with 800 ml of the buffer solution and 30 g of the
substrate. The experiment was started by adding enzyme solution corresponding to
5, 10 or 15 FPU gsol-1 calculated based on the total added solids during the fed-batch
experiment. Sample handling was similar to the small scale experiments but the
samples were not boiled but instead maintained on ice after sampling and stored
frozen. More details of the fed-batch experimental setup can be found in Sotaniemi
et al. (2016, 2015). Glucose was analysed with YSI2700 biochemistry analyser
(Yellow Springs Instruments, US), and samples were diluted with the reaction
buffer if necessary.
3.3 Yeast cultivations (III, IV)
3.3.1 Yeast strain, cultivation medium
Cultivation experiments were carried out with the yeast strain Pichia pastoris X33
in batch mode. The yeast was maintained on yeast extract, peptone, dextrose (YPD)
agar plates, and seed culture for inoculum was cultivated in a liquid YPD-medium.
The bioreactor cultivations were carried out in basal salt medium (BSM) supplied
with PTM1 trace salt solution (4.3 ml PTM1 per 1 litre BSM). The BSM-medium

49
was sterilized in-situ (121 °C, 15 min) in the reactor, and the trace salts were sterile-
filtered and added aseptically prior to inoculation.
Table 3. Medium composition for bioreactor cultivations (Publications III and IV)
Basal Salt Medium PTM1 Trace Salts
Phosphoric acid (85 %) 24.0 ml/l Copper sulfate (pentahydrate) 6 g/l
Calcium sulfate 0.93 g/l Sodium iodide 0.08 g/l
Potassium sulfate 18.2 g/l Manganese sulfate (monohydrate) 3 g/l
Magnesium sulfate (heptahydrate) 14.9 g/l Sodium molybdate (dihydrate) 0.2 g/l
Potassium hydroxide 4.13 g/l Boric acid 0.02 g/l
Glucose 40-80 g/l Cobalt chloride 0.5 g/l
Zinc chloride 20 g/l
Ferrous sulfate (heptahydrate) 65 g/l
Biotin 0.2 g/l
Sulfuric acid 5 ml/l
3.3.2 Cultivation conditions, reactors, experimental arrangements
The reactor geometries were similar to those described in section 3.1 but the total
volume varied from 10 to 12.5 litres. Ammonium hydroxide was used to maintain
pH between 5 – 5.5, and antifoam agent (Antifoam 204, Sigma-Aldrich) was added
to control the foam if necessary. Dissolved oxygen was measured from 10 cm level
from the bottom (Oxyferm FDA 120, Hamilton, Switzerland) and in some
cultivations with an additional probe (Visiferm, Hamilton, Switzerland),
approximately 10 cm below the liquid surface. The lower probe was used to control
the dissolved oxygen concentration by altering the impeller revolution rate or gas
flow in those cultivations that employed a set point for dissolved oxygen.
Concentrations of oxygen, carbon dioxide and hydrocarbons in the exit gas were
monitored with Innova 1313 gas analyser (LumaSense, Denmark). Temperature
was controlled at 30 °C automatically by a heating/cooling jacket. Manual samples
were collected from steam-sterilisable sampling valve for manual analysis.
3.3.3 Analytical methods
Cell dry weight (CDW) was measured by transferring 2 ml of sample suspension
into pre-weighed centrifuge tubes, centrifuged for 5 min at 16,000 rcf. The
remaining cell pellet was suspended in 0.9% NaCl, centrifuged again and the
remaining cell pellet was dried for 24 hours at 60 °C before weighing. The analysis

50
was performed in triplicates, and the standard deviations of the cell dry weight
measurements were in general well below 5% of the measured value, except for the
initial measurements with very low cell concentrations. Glucose, ethanol, acetate
and glycerol were measured by HPLC (Agilent 1200 series) equipped with ICSep
ICE-Coregel 87H-column. 5 mM H2SO4 was used as a mobile phase with a flow
rate of 0.6 ml/min and column temperature was controlled at 60 °C. The
compounds were detected with a refractive index detector (RID).
The gas analyser reacts to ethanol in off-gas, and a correlation was established
between the raw data from the gas analyser and the measured ethanol concentration
of the samples. Thus, the data from the gas analyser could be used as an online
measurement for ethanol. The estimation of liquid phase ethanol concentration
from the off-gas depends on evaporation of ethanol from liquid to the gas phase.
The agitation and aeration were maintained constant in most of the experiments, so
similar conditions for reaching the vapour-liquid equilibrium during the cultivation
could be assumed, and a good correlation (R2 = 0.99) was established between the
ethanol concentration measured from liquid samples (HPLC) and off-gas signal.
There was still some deviation, and an error margin of about 10% can be considered
for the ethanol estimation from off-gas. At very low ethanol concentrations below
1 g/l, the error may be even more than 50% but accurate on-line monitoring of very
low ethanol concentrations is not critical for the experiments in this thesis.
3.4 Model development
3.4.1 Enzymatic hydrolysis of cellulose (II)
The hydrolysis model and solving strategy are fully described in the original
publication II. A brief summary of the model structure is presented here. The
following assumptions were made in the hydrolysis model. The substrate
composition is structurally uniform, and there is no distinction in the susceptibility
for hydrolysis between the amorphous or crystalline fraction of cellulose, which is
in line with the current understanding of the cellulose hydrolysis with a complex
cellulase system (Mansfield et al., 1999). Also the binary classification to
amorphous/crystalline cellulose has been challenged (Fox et al., 2013). In addition,
the non-cellulosic part of the substrate is assumed to be inert. The β-glucosidase
activity of the enzyme mixture used in this study is high, and negligible cellobiose
concentrations were encountered during the experiments. Therefore, it is assumed
51
that the rate of cellobiose conversion to glucose is not a limiting factor and therefore
is not included explicitly in the model. Enzyme adsorption is assumed to follow the
Langmuir-type adsorption behaviour, and the reaction rate is first order with respect
to the concentration of enzyme-substrate complexes. The model was built in Matlab
(Mathworks, US) using Optimization Toolbox and Global Optimization Toolbox in
the parameter estimation.
The model development was divided into two phases – description of the initial
kinetics of batch hydrolysis and description of the extended hydrolysis in fed-batch
process including discretization of the substrate and rate-decreasing effects. The
enzyme adsorption is described by equations (16)-(17), and for the initial kinetic
model, the reaction rate for cellulose degradation is described by equation (18).
A, = f c, max,L + f , (16)
f = tot − A, , (17)
= max A, (18)
where EA, Ef and Ef are the enzyme concentrations for adsorbed, free and total
amounts of enzyme (gp l-1) and kmax is specific reaction rate constant (gcel gp h-1) and
r is the cellulose consumption rate (gcel l-1 h-1), respectively. The equations are
written separately for each substrate population i in fed-batch simulations. With
extended hydrolysis times and conversions, a decrease in the hydrolysis rate is
detected, especially for high substrate concentrations. For the full model, the
following phenomena were included to capture these effects:
– decrease in the enzyme adsorption capacity with increasing conversion (19)-
(20) ;
– competitive inhibition due to accumulation of glucose (21);
– decrease in the activity of the adsorbed enzyme with increasing conversion (22).
To account for the decrease in the adsorption capacity with increasing conversion,
the value of Emax was assumed to decrease as a function of conversion for each
substrate population. The decrease in enzyme adsorption capacity with increasing
conversion has been observed in previous studies (Bansal et al., 2012; Converse et
al., 1988; Ooshima et al., 1983). On the other hand, the decrease in the enzyme

52
adsorption and reaction rate is negligible in the initial phase for hydrolysis at low
conversions below 10%, and some minimum adsorption capacity is maintained
even with extended hydrolysis times and conversions. Based on the previous
literature results and our experimental results, the following criteria were set for
the mathematical representation of this phenomenon. First, the amount of adsorbed
enzyme per substrate does not approach zero with increasing conversion, but there
is a minimum asymptotical value. Second, the decrease is not necessarily
immediate at low conversion but there may be a range of conversions at which the
enzyme adsorption capacity is equal to the adsorption capacity of fresh substrate.
Finally, changes in Emax should be continuous and differentiable. Thus, the
following sigmoidal function for Emax was formulated (19)-(20). Reaction rate
including also the glucose inhibition is calculated with the “updated” value of EA
in equation (21). Finally, the effect of increasing conversion on the activity of the
adsorbed enzyme is calculated with equation (22), which is modified from the one
proposed by Ooshima et al. (1991).
max, = max + max,min − max01 + exp − Emax( − crit) , (19)
max,min = max tot∑ c, ,AccEmax, (20)
, = max A,1 + I,G , (21)
, = ∑ A,∑ c, ,Acc maxexp ∑ c, ,Acc . (22)
In equations (19)-(22), Sc,i,Acc is the mass of ith addition of the substrate (g), V is the
total volume of the slurry (l), X is the substrate conversion and nEmax, kEmax and Xcrit
are adjustable parameters, respectively. Equation (19) is a sigmoid function with
Emax at the halfway of Emax0 and Emax,min at X = Xcrit, and the steepness of the
decrease in Emax depends on the parameter kEmax. The value for Emax depends on Etot,
total accumulated substrate concentration and conversion of the substrate
population. It is also notable that Emax,i = Emax0 if Xi = 0 and Emax,i approaches Emax,min
with increasing Xi. KI,G is the glucose inhibition constant in equation (21).

53
Equation (22) is otherwise similar to that proposed by Ooshima et al. (1991)
but the base of the relation was modified from (EA/Etot) to include the effect of
substrate concentration. Based on our previous knowledge, the original formulation
led to significant over-prediction of glucose production in fed batch process with
high solids concentration and low enzyme dosing. The modification means that the
decrease in the activity of the enzymes is related, rather than to the concentration
of enzyme in the solution, to the initial maximum amount of adsorbed enzyme to
the unconverted substrate. As such, this is understandable as the equation describes
unproductive binding of the enzymes, and it occurs on the surface of the substrate,
not in the solution. The mass balances for cellulose and glucose concentrations and
total volume of the slurry are described by equations (23)-(27). = S,bulk 1, (23)
c, = − + c, , − c, , (24)
c, ,A = , (25)
= ∑0.9 + ( in − ), (26)
= S,bulk, (27)
where Sc is the cellulose concentration in the slurry, and Sc,Acc is the total amount of
added cellulose during the fed-batch process. The ODE-system consisting of
equations (23)-(27) was solved by ode15s solver function. The parameters for the
full model were estimated by minimizing the weighed residual function. The search
for the global minimum of the objective function was carried out in two stages. A
genetic algorithm (ga in Global Optimization Toolbox) was used in the initial
phase, which was followed by a derivative based method (fmincon in
Optimization Toolbox). An additional assessment for the parameters was carried
out by Monte Carlo simulations (MC) in which the parameters were estimated for
data sets generated from the actual experimental data. A random number from a
normal distribution with mean and variance estimated from the experimental data

54
was used in the MC parameter estimation for each experimental point. In total,
1000 or 270 new sets of parameters were estimated for the initial kinetic model and
full model, respectively. A comparison of different models with a reduced amount
of parameters was made by F-ratio test. The parameter estimation procedure and
F-ratio test are described in detail in publication II.
3.4.2 Growth model for Pichia pastoris (IV)
The model is modified from the one presented by Sonnleitner & Käppeli (1986) for
Saccharomyces cerevisiae. As discussed in the chapter 2.2.1, the metabolism of P.
pastoris is not affected by the glucose concentration (glucose repression of
respiration), and the only factor affecting the respirative/fermentative metabolism
is the availability of oxygen. Thus, some modifications were made to the model.
The overall stoichiometric equations for the three metabolic routes are respirative
or fermentative utilization of glucose and respirative utilization of ethanol: C6H12O6+ O2+ NH3 → CH . O . N . + CO2+ H2O C6H12O6+ NH3 → CH . O . N . +ℎCO2+ H2O+ C H O+ O2 + NH3 → CH . O . N . + CO2+ H2O
The coefficients in reaction stoichiometry related to cell mass (b, g and l) can be
derived directly from experimental yield coefficients ( xgox, xgfermand xeox) and molar
masses of the cell mass (Carnicer et al., 2009) and substrates. This leaves three
unknown coefficients and three elemental balances (C, H and O) for the net reaction
of each metabolic route, from which the unknowns can be solved.
The kinetic equations are presented below. In brief, the model consists of
equations for the specific uptake rate of glucose by respirative (28) or fermentative
(29) metabolism and uptake of ethanol by respirative metabolism (30). The uptake
rate equations are Monod-type and include the effect of dissolved oxygen
concentration for oxidative metabolism and glucose inhibition of ethanol
consumption. The corresponding specific growth rates (31)-(33), and oxygen
consumption from oxidation of glucose (34) and ethanol (35) are calculated using
the yield coefficients. Mass balance equations for glucose, ethanol, cell mass and
dissolved oxygen concentrations are presented in equations (36)-(38), and
saturation concentration is calculated from Henry’s law in equation (3). The
parameters used in equations (28)-(35) are presented in Table 4. Most of the
parameters were from literature sources, and the remaining ones were estimated
using data presented in the literature for chemostat cultivations with varying

55
dilution rate, inlet glucose and oxygen concentrations, and mixing conditions. It
should be noted, however, that the parameters from Sonnleitner & Käppeli (1986)
are for S. cerevisiae. However, it is expected that the yield parameters do not vary
much for P. pastoris, and model sensitivity to parameters is analysed in section
4.4.1.
56
gox = max
ox
xgox
g
g + g
o
o + o, (28)
gferm = max
ferm
xgferm
g
g + g1 − o
o + o, (29)
eox = max
e
xeox
e
e + e
i
g + i, (30)
gox = g
oxxgox, (31)
gferm = g
fermxgferm, (32)
eox = e
oxxeox, (33)
og = g
oxogox, (34)
oe = e
oxoeox, (35)
= in ,in − out − ox + fermx, (36)
x = inx,in − out
x − gox + g
ferm + eox
x, (37)
o = L ( osat − o) − ( og + o
e) x, (38)
where qi and ci are the specific rate (gi gx-1 h-1) and concentration of component i
(g/l) and x, g, e and o denote cells, glucose, ethanol and oxygen, respectively.
Parameters µmax, Y and K are listed in Table 4, F is flow rate (l/h) and V is liquid
volume (l). For continuous cultivations Fin = Fout = F, and dilution rate D = F/V.
57
Table 4. Parameters for growth model.
Parameter Dimension Value Reference
maxox h-1 0.18 (Solà et al., 2004) maxferm h-1 0.058 This work, adjusted maxe h-1 0.15 This work, adjusted xgox gcells gglu-1 0.49 (Sonnleitner & Käppeli, 1986) xgferm gcells gglu-1 0.05 (Sonnleitner & Käppeli, 1986) xeox gcells getoh
-1 0.57 (Sonnleitner & Käppeli, 1986) g gglu l-1 0.1 (Sonnleitner & Käppeli, 1986) o mgO2 l-1 0.109 This work, adjusted e getoh l-1 0.1 (Sonnleitner & Käppeli, 1986)
gglu l-1 0.1 (Sonnleitner & Käppeli, 1986)
3.4.3 Reactor model for aerobic microbial cultivation (IV)
The growth model presented in the previous section assumed perfect mixing of gas
and liquid phases and no depletion of the oxygen in gas phase. A reactor scale
model was developed to take into account phenomena that are significant in large
scale reactors related to gas and liquid mixing as well as the uneven distribution of
mass transfer coefficient and hydrostatic pressure. In the reactor scale model, the
reactor is divided into six zones – three mixer zones and three bubble zones
between the impellers (Fig. 5). For mixer zones (j = 1, 3, 5), mass transfer and gas
hold-up values are calculated based on volumetric power input and superficial gas
velocity (39)-(42), whereas for bubble zones (j = 2, 4, 6), the values are calculated
based on superficial gas velocity only (43)-(44). The mixer zone values are
estimated as follows: liquid side mass transfer coefficient kL, mass-transfer area a
and bubble diameter db in the homogeneous regime are estimated from equations
presented in Nauha et al. (2015), and hold-up ε from Vrábel et al. (2000). For the
area between mixers—the so-called bubble region—hold-up is estimated from
Nauha et al. (2015) and kLa from Oosterhuis & Kossen (1984).
58
L, = 0.301 A . , (39)
= 6b, , (40)
b, = 0.7 .( A/ ) . l . liqgas. , (41)
= 0.37( A/ ) . s . , = 1, 3, 5 , (42)
= sT , = 1, 3, 5 , (43)
L = 0.3 s0.7, (44)
where DL is the diffusion coefficient for oxygen in water (1.97e-9 m2 s-1) and η is
viscosity (Pa s). UT is the terminal velocity of the bubbles, which is assumed to be
constant (0.2 m s-1, (Nauha et al., 2015). However, if the hold-up or kLa estimated
from the mixer zone equations is lower compared to the bubble zone, the bubble
zone values are also used for the (particular) mixer zone.
The effect of liquid mixing was estimated by the compartment modelling
approach. The model presented here is simplified from the one presented in Vrábel
et al. (2000) and it is one dimensional accounting for the axial dimension. The
model consists of exchange flow in gassed conditions (EFG) and induced flow (IF)
between the compartments, as shown in Fig. 5. For the Rushton turbine geometry: EF = 0.34 / (1 − ) A,g/ A0.25 (1 − ) , (45)
IF = 0.07 1 − ( / ) . A,gA,
(46)
where α = 0.07 m/s and β = 0.3 are model parameters, PA,g is the agitation power
in gassed state, Agap is the area of the gap between vessel wall and impeller sweep
area, and Hi is the height of the impeller region, respectively. The mass balance
equations (36)-(38) were modified to include the flow between the compartments

59
(EFG + IF). In addition, mass balance equations for gas phase (47)-(48) were added,
and the gas phase oxygen content and hydrostatic pressure (49) were accounted for
in the calculation of co,jsat.
o,gas, = o,gas,j − o,gas,, − L o,sat − o , (47)
, = , (48)
o,sat = o,gas, h + ( − )H , (49)
where τg,j is the gas residence time in compartment j, Ph is headspace pressure, H
is unaerated liquid height and zj is the distance from tank bottom, respectively.

60
Fig. 5. Schematic presentation of reactor scale model. The reactor is divided into three
mixer and three bubble compartments. Mass transfer coefficient, gas hold-up, and the
flow between compartments (EFG + IF) are estimated separately for each compartment.
Reprinted with permission from Elsevier (Publication IV).
1 (mixer1)
3 (mixer2)
5 (mixer3)
2 (bubble1)
4 (bubble2)
6 (bubble3)
T
H
zm1 = 0 – 0.2 H
zm2 = 0.4H ±0.1H
zm3 = 0.7H ±0.1H
EFG,3+IF
EFG,3+IF
EFG,2+IF
EFG,2+IF
EFG,1+IF

61
4 Results and discussion
The objective of the thesis was to improve the understanding of the effect of mixing,
mass transfer and reaction kinetics on cellulose hydrolysis and aerobic cell
cultivations. Furthermore, the main contributions of the work are the modelling
tools for the processes. Liquid-solid reactors and enzymatic hydrolysis of cellulose
are covered in sections 4.1 and 4.2, and liquid-gas reactors and aerobic cell
cultivations in sections 4.3 and 4.4, respectively. Particular emphasis in the study
of cellulose hydrolysis is on the understanding of the phenomena affecting the
enzyme-substrate interactions and rigorous analysis of the model. The sections on
liquid-gas reactors consist of experimental studies on the effect of reactor type and
operational conditions on mixing and mass transfer, as well as modelling studies
on scale-up of yeast cultivation.
4.1 Liquid-solid reactors (I)
The distribution of non-conducting solids was measured successfully by EIT, and
different states of suspension could be distinguished from the measurement data.
The just-suspended criterion was found to be problematic, especially for high solids
contents and small particle sizes. In the investigated conditions, the suspension of
last few particles depended highly on the specific flow pattern at the vessel bottom,
and the just-suspended criterion seemed to be separate from the other states of
suspension, partial and homogenous suspension. Based on the partial and
homogeneous suspension criteria and results presented in publication I, the
hydrofoil impeller (OKTOP®3200) reaches both states of suspension with lower
agitation power compared to the pitched blade impeller as shown in Fig. 6. Also,
the difference in agitation power to reach partial and homogeneous suspension is
substantial as homogeneous suspension requires almost ten times the agitation
power. However, using the EIT-measurement for fibre-suspension of water and old
corrugated cardboard (OCC) proved to be more problematic due to wetting
properties of the fibres and, thus, smaller effects on the conductivity.
In the fed-batch hydrolysis of OCC, pH needs to be adjusted during the feeding
phase in order to maintain the optimal pH for hydrolysis, usually around 4.8. This
is due to inorganic components in OCC that neutralise acids in the reaction buffer
and, thus increase the pH. (Sotaniemi et al., 2015) The distribution of sulphuric
acid used in the hydrolysis experiments for pH control could be measured by EIT
since it increases the suspension conductivity. As shown in our studies (Tervasmäki,
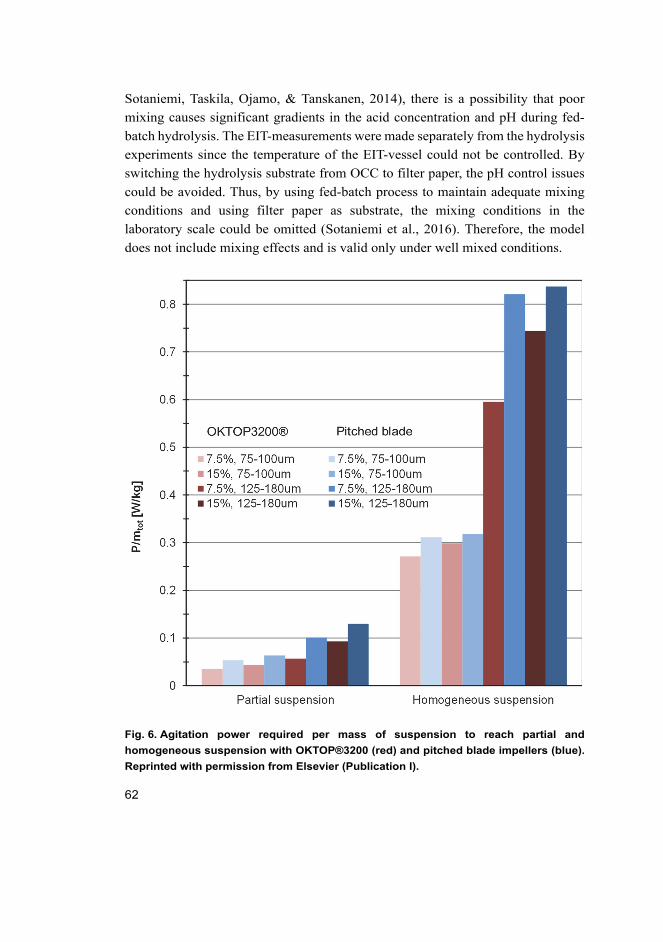
62
Sotaniemi, Taskila, Ojamo, & Tanskanen, 2014), there is a possibility that poor
mixing causes significant gradients in the acid concentration and pH during fed-
batch hydrolysis. The EIT-measurements were made separately from the hydrolysis
experiments since the temperature of the EIT-vessel could not be controlled. By
switching the hydrolysis substrate from OCC to filter paper, the pH control issues
could be avoided. Thus, by using fed-batch process to maintain adequate mixing
conditions and using filter paper as substrate, the mixing conditions in the
laboratory scale could be omitted (Sotaniemi et al., 2016). Therefore, the model
does not include mixing effects and is valid only under well mixed conditions.
Fig. 6. Agitation power required per mass of suspension to reach partial and
homogeneous suspension with OKTOP®3200 (red) and pitched blade impellers (blue).
Reprinted with permission from Elsevier (Publication I).
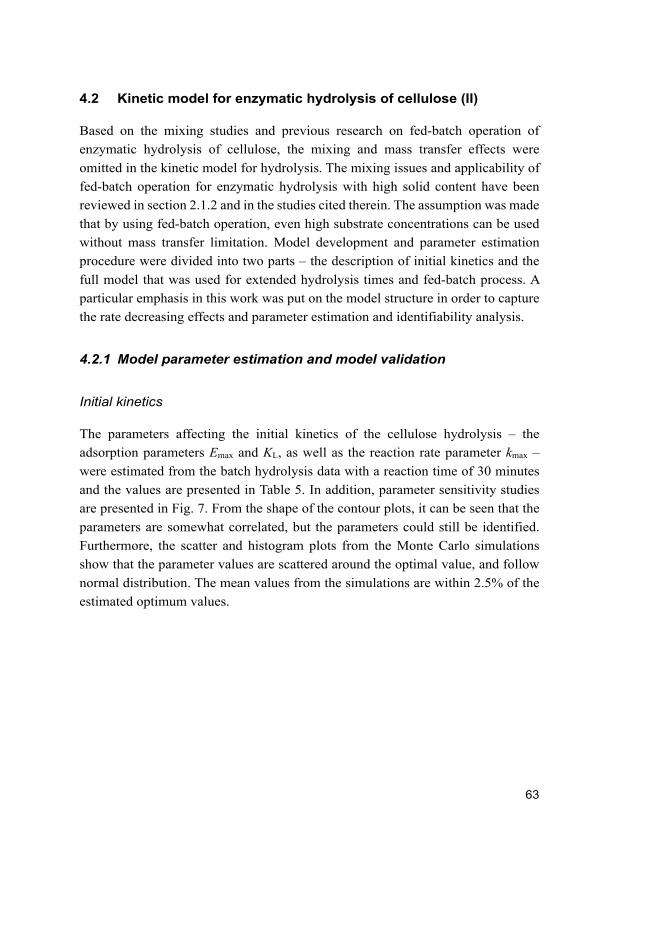
63
4.2 Kinetic model for enzymatic hydrolysis of cellulose (II)
Based on the mixing studies and previous research on fed-batch operation of
enzymatic hydrolysis of cellulose, the mixing and mass transfer effects were
omitted in the kinetic model for hydrolysis. The mixing issues and applicability of
fed-batch operation for enzymatic hydrolysis with high solid content have been
reviewed in section 2.1.2 and in the studies cited therein. The assumption was made
that by using fed-batch operation, even high substrate concentrations can be used
without mass transfer limitation. Model development and parameter estimation
procedure were divided into two parts – the description of initial kinetics and the
full model that was used for extended hydrolysis times and fed-batch process. A
particular emphasis in this work was put on the model structure in order to capture
the rate decreasing effects and parameter estimation and identifiability analysis.
4.2.1 Model parameter estimation and model validation
Initial kinetics
The parameters affecting the initial kinetics of the cellulose hydrolysis – the
adsorption parameters Emax and KL, as well as the reaction rate parameter kmax –
were estimated from the batch hydrolysis data with a reaction time of 30 minutes
and the values are presented in Table 5. In addition, parameter sensitivity studies
are presented in Fig. 7. From the shape of the contour plots, it can be seen that the
parameters are somewhat correlated, but the parameters could still be identified.
Furthermore, the scatter and histogram plots from the Monte Carlo simulations
show that the parameter values are scattered around the optimal value, and follow
normal distribution. The mean values from the simulations are within 2.5% of the
estimated optimum values.
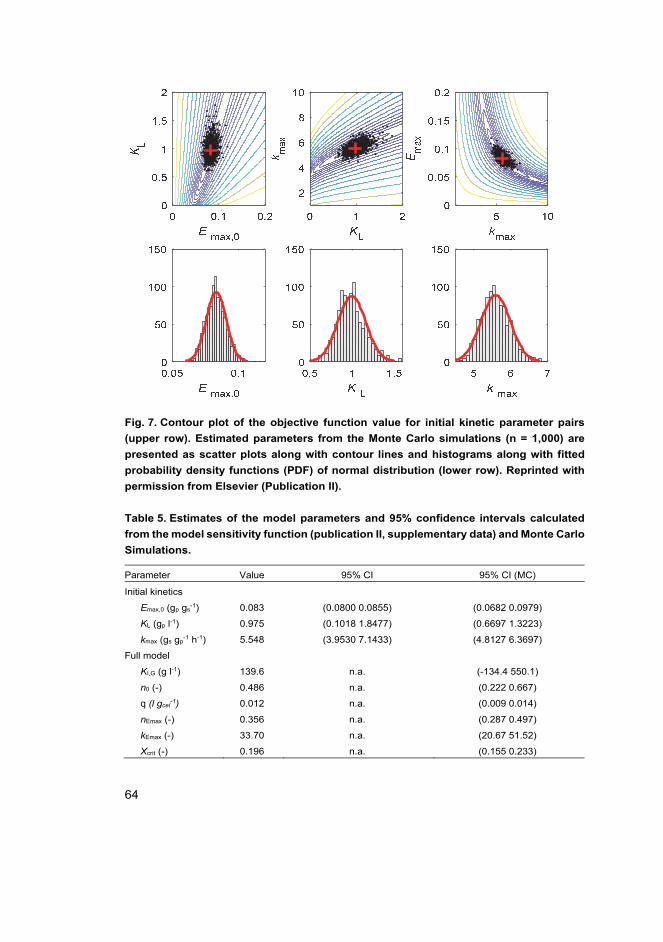
64
Fig. 7. Contour plot of the objective function value for initial kinetic parameter pairs
(upper row). Estimated parameters from the Monte Carlo simulations (n = 1,000) are
presented as scatter plots along with contour lines and histograms along with fitted
probability density functions (PDF) of normal distribution (lower row). Reprinted with
permission from Elsevier (Publication II).
Table 5. Estimates of the model parameters and 95% confidence intervals calculated
from the model sensitivity function (publication II, supplementary data) and Monte Carlo
Simulations.
Parameter Value 95% CI 95% CI (MC)
Initial kinetics
Emax,0 (gp gs-1) 0.083 (0.0800 0.0855) (0.0682 0.0979)
KL (gp l-1) 0.975 (0.1018 1.8477) (0.6697 1.3223)
kmax (gs gp-1 h-1) 5.548 (3.9530 7.1433) (4.8127 6.3697)
Full model
KI,G (g l-1) 139.6 n.a. (-134.4 550.1)
n0 (-) 0.486 n.a. (0.222 0.667)
q (l gcel-1) 0.012 n.a. (0.009 0.014)
nEmax (-) 0.356 n.a. (0.287 0.497)
kEmax (-) 33.70 n.a. (20.67 51.52)
Xcrit (-) 0.196 n.a. (0.155 0.233)

65
Fig. 8. Contour plot of the objective function value for parameter pairs and the
estimated parameter values from Monte Carlo simulations (n = 270), scatter plot in
upper diagonal and histogram with fitted PDF of normal distribution in the diagonal.
Reprinted with permission from Elsevier (Publication II).
Full model for fed-batch hydrolysis
As suggested in the previous literature, hydrolysis models often suffer from
parameter identifiability issues (Sin et al., 2010). Therefore, although the model
may give satisfactory fit to experimental data, the extrapolation of the model
outside the experimental domain may not be feasible. This may be the case with
0.1 0.2 0.3Xcrit
0 25 50kEmax
0.2 0.4 0.6nEmax
0 0.01 0.02q
.5 1n0
0.2
0 500 1000KI,G
0.1
0.2
0.3
Xcr
it
0
20
40
k Em
ax
0.2
0.4
0.6
n Em
ax
0
0.01
0.02
q
0
0.5
1
n 0
0
500
1000
KI,G

66
mechanistic explanations as well. Approaches to overcome the identifiability issues
are basically to modify the model structure and/or to improve the experimental
design to obtain more information from the experiments. (Scott et al., 2015; Sin et
al., 2010) However, the experimental data used along with modelling efforts has
mainly been limited to batch data with varying initial substrate and enzyme
concentrations. In addition, adding glucose or some other compound in the
beginning of the experiment to simulate end product inhibition has been studied
(Kadam et al., 2004). Due to several phenomena affecting the decrease in reaction
rate, it is difficult to estimate the importance of these rate-decreasing phenomena
based solely on batch data.
The approach in this study is to utilize data from fed-batch experiments with a
high amount of total added substrate. By discretizing the rate equations based on
the substrate feed times, the interactions between enzymatic activity and changes
in the substrate reactivity should be captured in a more detailed manner compared
to a batch process. The results of the parameter estimation procedure are presented
in Table 5 and Fig. 8 for the parameter values and objective function values in a
similar manner as for the initial kinetic parameters. From the contour plots and MC
simulations, it can be seen that there are some parameters that are not identified
well. Especially the end product inhibition parameter (KI,G) is poorly identified as
suggested by the shape of the contour plot and large, non-normally distributed
scattering of the MC-simulated values.
The importance of the three rate decreasing phenomena included in the full
model was studied by simplified models in which one of the phenomena was
omitted. The simplified models S1, S2 and S3 omitted the decrease in the catalytic
activity of the adsorbed enzyme, decrease in enzyme adsorption and inhibition of
the catalytic activity by the end product (glucose), respectively. As a result, the
simplified models S1-S3 had less adjustable parameters (3-5) compared to the full
model with six parameters. Quantitative comparison between the simplified and
full models is calculated based on the F-statistic to test if there is significant
improvement when using the full model with more parameters. The results are
presented in Table 6, and it can be seen that the value of F-statistic is higher than
the critical value. Thus, the null hypothesis – stating that a more complex model
does not provide a significant improvement – is rejected and it can be stated that
the full model provides a better fit to the experimental data. However, the F-statistic
value for the model S3, which omits the end product inhibition, is significantly
lower compared to the other simplified models and quite near to the critical value.
Therefore, based on this investigation, glucose inhibition seems to have the least

67
significance on the model prediction. As such, this is in line with the parametric
studies in which the parameter related to glucose inhibition (KI,G) was found to have
low sensitivity and wide confidence intervals.
Table 6. Comparison of full model with simplified models S1, S2 and S3. Critical F-
statistic was calculated with false detection probability 0.05 and 6 – (4, 3 or 5) = 2, 3 or
1 and 104 – 6 = 98 degrees of freedom.
Full model S1 S2 S3
No. of parameters 6 4 3 5
J(θ) 215 756 1117 262
F-statistic - 61.8 134 4.33
Critical F - 2.46 2.70 2.31
Validation with literature data
In order to assess the model performance outside our own experimental system, the
model was used to predict hydrolysis data from the literature with similar raw
materials and enzyme. The data used in this comparison was from Boussaid and
Saddler (1999) and Kristensen et al. (2009) who both used a mixture of commercial
cellulase and β-glucosidase preparations and softwood kraft pulp or filter paper as
the substrate. The results are shown in Fig. 9. The model is capable of predicting
the conversion vs. time data in all cases. The largest deviation between the model
and experimental data are with 2% solids loading and 60 FPU/g enzyme dosage
where the conversions are under-predicted by the model, especially at reaction
times from 10 to 20 hours. However, the final conversion at 48 hours predicted by
the model is already close to the experimental value. Otherwise, the model
predictions are quite good with an overall R2 value of 0.87 even with hydrolysis
times extended to 96 hours and very large enzyme dosage of 300 FPU per gram dry
matter. Such high enzyme dosages or reaction times were not included in our
experiments.

68
Fig. 9. Comparison of model predictions with literature data, (a) Kristensen et al. (2009),
(b) Boussaid and Saddler (1999). Reprinted with permission from Elsevier (Publication
II)
4.2.2 Fed-batch operation of enzymatic hydrolysis
The performance of the model can be qualitatively assessed from Fig. 10 in which
the measured glucose concentrations during experiments are plotted along with the
model estimates. A particular interest is in the experiments with late addition of
substrate – the substrate addition being after 24 hours of hydrolysis. In these
experiments, it can be seen that the reaction rate of the original substrate has
decreased substantially, although there still is cellulose remaining in the suspension.
Addition of fresh substrate increases the glucose production rate, which indicates
that enzymatic activity is not lost during the process. That is, thermal inactivation
or irreversible unproductive adsorption of the enzyme is not significant. Similar
conv
ersi
on (-
)
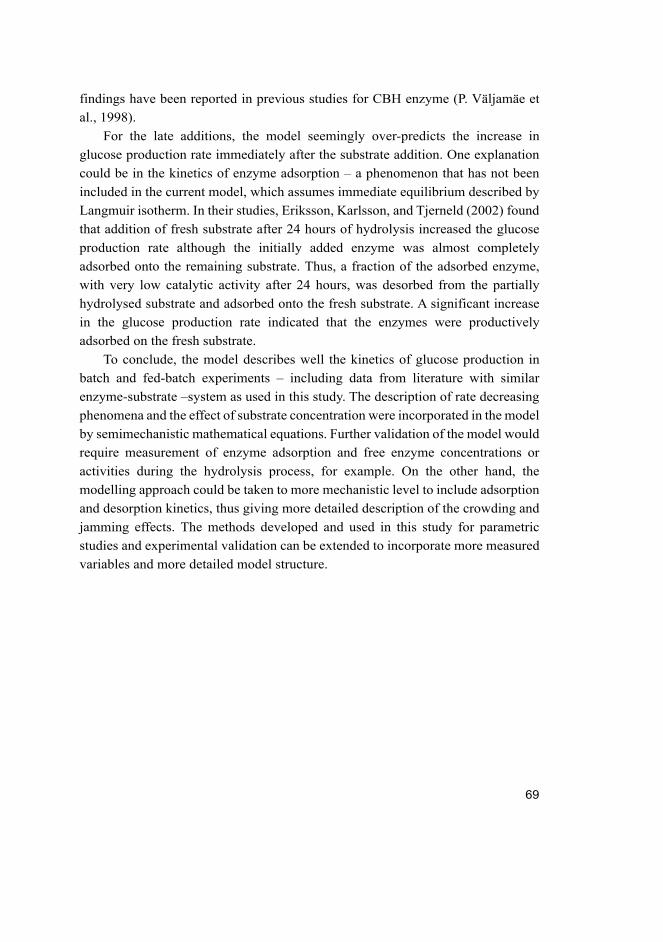
69
findings have been reported in previous studies for CBH enzyme (P. Väljamäe et
al., 1998).
For the late additions, the model seemingly over-predicts the increase in
glucose production rate immediately after the substrate addition. One explanation
could be in the kinetics of enzyme adsorption – a phenomenon that has not been
included in the current model, which assumes immediate equilibrium described by
Langmuir isotherm. In their studies, Eriksson, Karlsson, and Tjerneld (2002) found
that addition of fresh substrate after 24 hours of hydrolysis increased the glucose
production rate although the initially added enzyme was almost completely
adsorbed onto the remaining substrate. Thus, a fraction of the adsorbed enzyme,
with very low catalytic activity after 24 hours, was desorbed from the partially
hydrolysed substrate and adsorbed onto the fresh substrate. A significant increase
in the glucose production rate indicated that the enzymes were productively
adsorbed on the fresh substrate.
To conclude, the model describes well the kinetics of glucose production in
batch and fed-batch experiments – including data from literature with similar
enzyme-substrate –system as used in this study. The description of rate decreasing
phenomena and the effect of substrate concentration were incorporated in the model
by semimechanistic mathematical equations. Further validation of the model would
require measurement of enzyme adsorption and free enzyme concentrations or
activities during the hydrolysis process, for example. On the other hand, the
modelling approach could be taken to more mechanistic level to include adsorption
and desorption kinetics, thus giving more detailed description of the crowding and
jamming effects. The methods developed and used in this study for parametric
studies and experimental validation can be extended to incorporate more measured
variables and more detailed model structure.
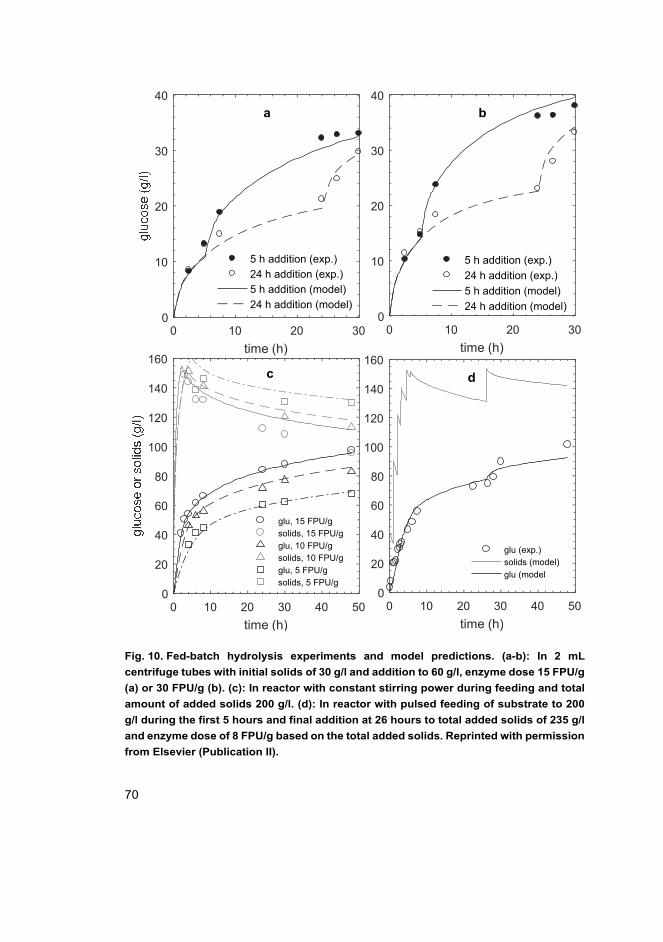
70
Fig. 10. Fed-batch hydrolysis experiments and model predictions. (a-b): In 2 mL
centrifuge tubes with initial solids of 30 g/l and addition to 60 g/l, enzyme dose 15 FPU/g
(a) or 30 FPU/g (b). (c): In reactor with constant stirring power during feeding and total
amount of added solids 200 g/l. (d): In reactor with pulsed feeding of substrate to 200
g/l during the first 5 hours and final addition at 26 hours to total added solids of 235 g/l
and enzyme dose of 8 FPU/g based on the total added solids. Reprinted with permission
from Elsevier (Publication II).
0 10 20 30time (h)
0
10
20
30
40
5 h addition (exp.)24 h addition (exp.)5 h addition (model)24 h addition (model)
0 10 20 30time (h)
0
10
20
30
40
5 h addition (exp.)24 h addition (exp.)5 h addition (model)24 h addition (model)
0 10 20 30 40 50time (h)
0
20
40
60
80
100
120
140
160
glu, 15 FPU/gsolids, 15 FPU/gglu, 10 FPU/gsolids, 10 FPU/gglu, 5 FPU/gsolids, 5 FPU/g
0 10 20 30 40 50time (h)
0
20
40
60
80
100
120
140
160
glu (exp.)solids (model)glu (model
a b
dc

71
4.3 Reactors in aerobic microbial cultivations (III)
The results and the contribution on microbial cultivations are presented in this
section. First, the experimental studies of gas dispersion characteristics and gas-
liquid mass transfer performance for the OKTOP9000® (SDTR) and regular STR
are presented. The discussion is then continued to kinetic modelling of yeast growth
with a particular emphasis on the effect of oxygen concentration on the yeast
metabolism. This model is then used with the reactor scale model to identify some
important phenomena in industrial scale microbial cultivations.
4.3.1 Power consumption of agitation
Measurements for power consumption were carried out during the gas hold-up
experiments. Impeller power numbers and the effect of gas on the power
consumption were estimated from this data for both reactor geometries, and
equation (50) was used to correlate the measured power consumption with the
operational conditions
A = ( P − ) , (50)
where ρ is the liquid density (kg/m3), Di is the impeller diameter (m), N is the
impeller revolution rate (s-1), vs is the superficial gas velocity (m/s) and Np and k
are adjustable parameters, respectively. This is similar to the common equation for
power consumption but with an additional term kvs which decreases the power
number with aeration. The more traditional approach of using gas flow number, a
function of both agitation rate and gas flow rate, was tested to correlate the power
but the fit to the experimental data was not as good as for the equation (50). The
conditions in all measurements were such that turbulent regime was achieved, and
constant power number could be assumed. Values for estimated parameters with
95% confidence intervals are listed in Table 7.
Np represents the ungassed power, and the value for three Rushton turbine
system is in accordance with literature values. Much higher values for k are found
for the Rushton geometry even if the value is compared to the value of Np.
Therefore, the gas-handling capacity of the OKTOP® impeller can be considered
to be better of the two. However, the relation of gassed and ungassed power
consumption is rather complex and cannot be fully described by the one-parameter
model presented here. It can still be considered applicable at the scale and

72
operational ranges used in this study, and the power consumption values presented
in the later sections are estimated by using this approach.
Table 7. Coefficients for power consumption with 95% confidence intervals and
correlation coefficient R2.
Parameter (95% CI) OKTOP® 3xRushton
Np 2.09 (1.97, 2.22) 10.6 (10.0, 11.1)
k 33.8 (19.7, 47.8) 508 (421, 595)
R2 0.99 0.98
4.3.2 Gas hold-up
The volume fraction of gas in the liquid-gas dispersion has a large effect on the
mass transfer characteristics. The obvious effect is that the volume fraction affects
directly the area for mass transfer (a) as described in equation (40). Furthermore,
the same phenomena that affect the bubble breakage and gas dispersion and
increase the gas hold up, also increase the kL term in the overall mass transfer
coefficient. Therefore, gas hold-up and overall mass transfer coefficient are highly
correlated.
The local values for gas hold-up were estimated by equation (10) from the
conductivity distribution measured by EIT. Measurement data was averaged over
20 seconds, and the results are presented in Fig. 11 and Fig. 12 in which the three
dimensional data is averaged over angular direction and presented as a contour plot
in z-r-plane. For the OKTOP® geometry, it can be seen that increasing the impeller
revolution rate at a constant gas flow rate shifts the gas hold-up more towards the
lower part of the vessel. Furthermore, especially at low agitation rate and high gas
flow rate (450 rpm and 25 l/min), the impeller does not disperse the gas as desired,
and most of the gas flows upwards in the inner part of the annulus just outside the
draft tube. With higher impeller revolution rates, the gas is also recirculated to
lower parts of the vessel below the impeller. A similar trend can be seen for the
Rushton turbine – the poorest gas dispersion is at highest Qg and lowest N (25 l/min
and 310 rpm, (Fig. 11) when the lowest impeller was flooded. This can be seen as
low hold-up values below the lowest impeller and near the reactor wall.
The two geometries differ quite significantly in the axial distribution of the
dispersed gas. For the OKTOP®9000 reactor, the highest hold-up values are in the
lower parts of the vessel near the impeller which pushes the dispersion downwards
in the draft tube towards the vessel bottom. For the STR, however, the highest

73
values are detected at the top part of the vessel. The only exception is for the lowest
gas flow rate at 830 rpm and 10 l/min (Fig. 12). Only at this situation can a
completely dispersed regime be assumed. It is not uncommon for an industrial scale
STR stirred with multiple impellers that the gas dispersion at the lowest impeller is
not sufficient (Nauha, Kálal, Ali, & Alopaeus, 2018).

74
Fig. 11. Local gas hold-up contour plots with Qg = 25 l/min OKTOP®9000 (upper figures)
and Rushton (lower figures). Reprinted with permission from Elsevier (Publication III).
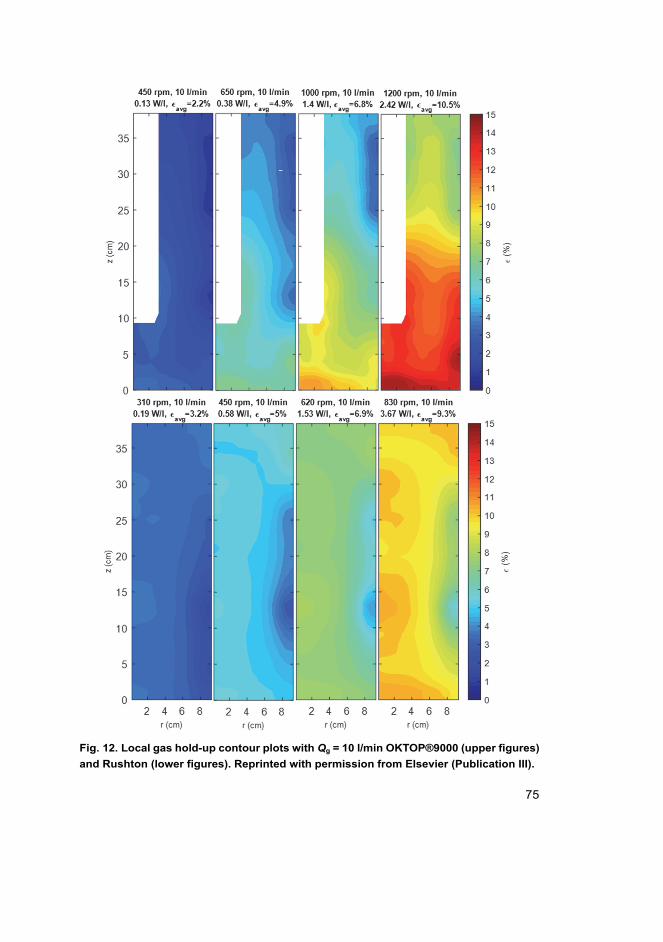
75
Fig. 12. Local gas hold-up contour plots with Qg = 10 l/min OKTOP®9000 (upper figures)
and Rushton (lower figures). Reprinted with permission from Elsevier (Publication III).

76
4.3.3 Volumetric mass transfer coefficient kLa
The mass transfer coefficient as a function of agitation power per liquid volume for
both geometries and three gas flow rates are plotted in Fig. 13. When the agitation
power is low (<500 W/m3), the measurements at a constant gas flow rate are at the
same range regardless of the geometry. With increasing agitation power, however,
the kLa values measured by OKTOP®9000 geometry are higher at similar power
consumption. It also seems that the difference arises at lower power consumption
when the air flow rate is low (6.5 l/min). However, when the agitation rate is
increased excessively (> 4,000 W/m3) with vs = 0.006 m/s, the increase in kLa is
small for both geometries. Unfortunately, higher gas flow rates could not be used
at the highest agitation rates due to excessive increase in the gas hold-up.
The estimated values for kLa were fitted to an empirical correlation in order to
study the effect of operating conditions on mass transfer. There are also different
types of correlations for ALR and STDR that consider superficial gas velocity
based on the cross sectional area of the riser part, for example (Lueske et al., 2015).
However, in order to use the same correlation for OKTOP®9000 and STR, the
traditional approach described by the equation (4) was chosen.
The parameters A, α and β are presented in Table 8 for different scenarios. First,
the parameters were fitted separately for both geometries. The largest variation was
on the parameter A which should be strongly dependent on the liquid phase
properties rather than the geometry of the system (Doran, 2012). Therefore, the
parameters were also fitted for both geometries simultaneously and this value was
used to estimate α and β for both geometries separately with A fixed at value of
0.452. The experimental data can be fitted satisfactorily with the traditional
correlation but the identification of the parameters remains poor. This is especially
true for A for which the lower 95% confidence interval is negative when the
parameters are estimated from the measurements with OKTOP®9000-geometry.
Also qualitative inspection of Fig. 13 shows that the estimated values are over-
predicted, especially at high power input. Furthermore, in order to reliably capture
the effect of scale-independent values for operating conditions (vs and PA/V and
their exponents), measurements should be done in more than one scale.

77
Fig. 13. kLa as a function of power consumption for three gas flow rates. Dashed
(OKTOP®9000) and dotted (Rushton) lines are fitted using the parameter values in Table
8 with a fixed value for A = 0.457 and separately estimated values for α and β. Reprinted
with permission from Elsevier (Publication III).
Table 8. kLa-correlation parameters fitted separately for each geometry, together for
both geometries and separately for both geometries with a fixed value for parameter A.
Data used in fitting A (95% CI) α (95% CI) β (95% CI) R2
Rushton 0.416 (0.0618 0.770) 0.297 (0.209 0.385) 0.733 (0.549 0.917) 0.856
OKTOP® 0.343 (-0.124 0.811) 0.373 (0.252 0.494) 0.778 (0.530 1.030) 0.846
Rushton&OKTOP® 0.457 (0.111 0.804) 0.314 (0.242 0.386) 0.766 (0.612 0.920) 0.824
Rushton 0.457 (fixed) 0.295 (0.213 0.378) 0.749 (0.626 0.872) 0.856
OKTOP® 0.457 (fixed) 0.364 (0.259 0.470) 0.823 (0.672 0.975) 0.845
k La
(s-1
)
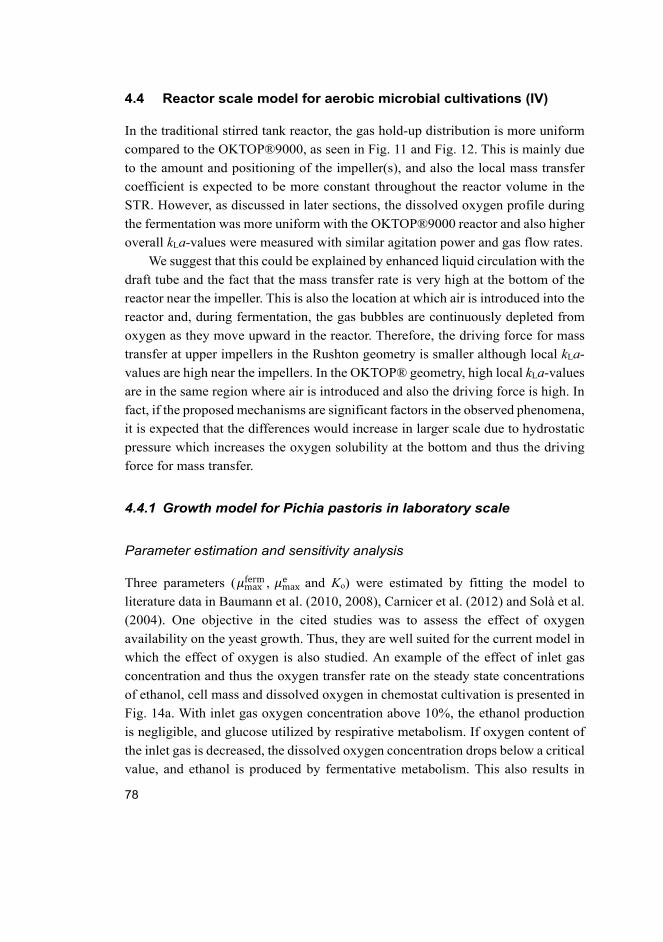
78
4.4 Reactor scale model for aerobic microbial cultivations (IV)
In the traditional stirred tank reactor, the gas hold-up distribution is more uniform
compared to the OKTOP®9000, as seen in Fig. 11 and Fig. 12. This is mainly due
to the amount and positioning of the impeller(s), and also the local mass transfer
coefficient is expected to be more constant throughout the reactor volume in the
STR. However, as discussed in later sections, the dissolved oxygen profile during
the fermentation was more uniform with the OKTOP®9000 reactor and also higher
overall kLa-values were measured with similar agitation power and gas flow rates.
We suggest that this could be explained by enhanced liquid circulation with the
draft tube and the fact that the mass transfer rate is very high at the bottom of the
reactor near the impeller. This is also the location at which air is introduced into the
reactor and, during fermentation, the gas bubbles are continuously depleted from
oxygen as they move upward in the reactor. Therefore, the driving force for mass
transfer at upper impellers in the Rushton geometry is smaller although local kLa-
values are high near the impellers. In the OKTOP® geometry, high local kLa-values
are in the same region where air is introduced and also the driving force is high. In
fact, if the proposed mechanisms are significant factors in the observed phenomena,
it is expected that the differences would increase in larger scale due to hydrostatic
pressure which increases the oxygen solubility at the bottom and thus the driving
force for mass transfer.
4.4.1 Growth model for Pichia pastoris in laboratory scale
Parameter estimation and sensitivity analysis
Three parameters ( maxferm , maxe and Ko) were estimated by fitting the model to
literature data in Baumann et al. (2010, 2008), Carnicer et al. (2012) and Solà et al.
(2004). One objective in the cited studies was to assess the effect of oxygen
availability on the yeast growth. Thus, they are well suited for the current model in
which the effect of oxygen is also studied. An example of the effect of inlet gas
concentration and thus the oxygen transfer rate on the steady state concentrations
of ethanol, cell mass and dissolved oxygen in chemostat cultivation is presented in
Fig. 14a. With inlet gas oxygen concentration above 10%, the ethanol production
is negligible, and glucose utilized by respirative metabolism. If oxygen content of
the inlet gas is decreased, the dissolved oxygen concentration drops below a critical
value, and ethanol is produced by fermentative metabolism. This also results in
79
decreased cell concentration in steady state since the cell yield from glucose is
lower for the fermentative metabolism. The effect of oxygen transfer on the
concentrations is qualitatively captured by the model although there is some
deviation in the absolute values. Parity plot for all experimental points of steady
state cell mass and ethanol concentration is presented in Fig. 14b and
correspondence between the model and experimental data is quite good.
Fig. 14. a) Steady-state concentration of cell mass and ethanol (experimental and
simulated) and dissolved oxygen (simulated) vs. the oxygen content of inlet gas for cg,in
= 50 g/l and D = 0.1 h-1 (Baumann et al., 2010, 2008). b) Parity plot of cell mass and
ethanol in all chemostat cultivation conditions in the literature, dotted lines show +/- 20%
margin. Reprinted with permission from Elsevier (Publication IV).

80
The local sensitivity of the model with respect to parameters was assessed by
calculating the relative change in glucose, ethanol, cell, and dissolved oxygen
concentrations when each parameter was increased by 10% from the values
presented in Table 4. The results are plotted as heat maps (Fig. 15) calculated with
cglu,in = 40 g/l, D = 0.1 h-1 (a, b) or D = 0.15 h-1 (c, d), and kLa = 250 h-1 (a, c) or kLa
= 500 h-1 (b, d).
The model shows less sensitivity for the lower dilution rate. The cell washout
occurs at dilution rates between 0.15 – 0.17 h-1, and the parameter sensitivity is
increased in that range (c, d). It should be noted, however, that some of the
seemingly high sensitivity values are due to very low concentrations calculated
with the optimal parameters. For example, the ethanol concentrations with higher
kLa -value (500 h-1) are below 0.06 g/l, thus even minor changes in the absolute
concentration affect the relative values. The same applies for glucose although the
concentrations are slightly higher between 0.1 – 0.5 g/l.
Fig. 15. Parameter sensitivity of model-predicted glucose, ethanol, cell and dissolved
oxygen concentrations in steady-state of chemostat operation with cglu,in = 40 g/l.
Relative change of concentrations when each parameter was increased by 10%. a) D =
0.1 h-1 and kLa = 250 h-1 b) D = 0.1 h-1 and kLa = 500 h-1 c) D = 0.15 h-1 and kLa = 250 h-1 d)
D = 0.15 h-1 and kLa = 500 h-1. Reprinted with permission from Elsevier (Publication IV).
81
Model validation and batch cultivations
The model was used to simulate batch cultivations in STR as described in section
3.3, and with an initial glucose concentration of 80 g/l. The impeller revolution rate
in the STR was constant at 450 rpm, and gas flow rate was maintained at 18 l/min
(vs = 0.011 m/s). The value for kLa was estimated to be 250 h-1 in the experimental
conditions based on the mass transfer experiments described in section 4.3.3. A lag
time of one hour was manually adjusted for the model prediction so that the time
of glucose exhaustion was roughly the same as in the experiments. The results are
presented in Fig. 16 for glucose, ethanol, and cell mass concentrations (a), as well
as for dissolved oxygen (b). The model corresponds quite well with the cultivation
conditions. Only the cell concentrations are over-predicted, and the final cell
concentration is over-estimated by almost 30%. However, the model qualitatively
captures the decrease in growth rate after switching the carbon source from glucose
to ethanol.
In addition, the dissolved oxygen concentration during the cultivation follows
the same trend as the measured values. The model fails to capture the short peak at
21 h indicating the switch in metabolism from glucose to ethanol utilization. This
is expected, as detailed metabolic routes were not included in the model. The short
increase in the measured dissolved oxygen concentration between 28 and 31 h was
due to a temporary increase in the agitation rate, while the model results were
calculated with a constant kLa value. It is evident that the dissolved oxygen
concentration is not homogeneous even at the laboratory scale reactor as the
dissolved oxygen concentration at the upper part of the reactor is about 10%,
whereas values at lower part are less than 2%.
As the yeast cultivations were carried out at relatively low power input for both
reactors (250 W/m3), dissolved oxygen concentration dropped to low values. Thus,
significant amounts of ethanol were produced by fermentative metabolism during
the glucose consumption phase, which lasted about 21 hours with both reactors.
Dissolved oxygen and ethanol concentration and off gas CO2 content during the
glucose consumption phase for both reactors are plotted in Fig 17. The peak ethanol
concentrations before ethanol consumption phase were 14.6 and 12.5 g/l for
Rushton and OKTOP®-geometries, respectively. The lower ethanol concentration
in the OKTOP® reactor is likely due to a higher dissolved oxygen concentration.
Although DO drops to about 2% at the lower probe in both reactors, it reaches such
a low value already at 15 h in the STR, whereas the limit of 2% is reached only
after 20 h in the OKTOP® reactor. Also, DO at the probe positioned in the upper
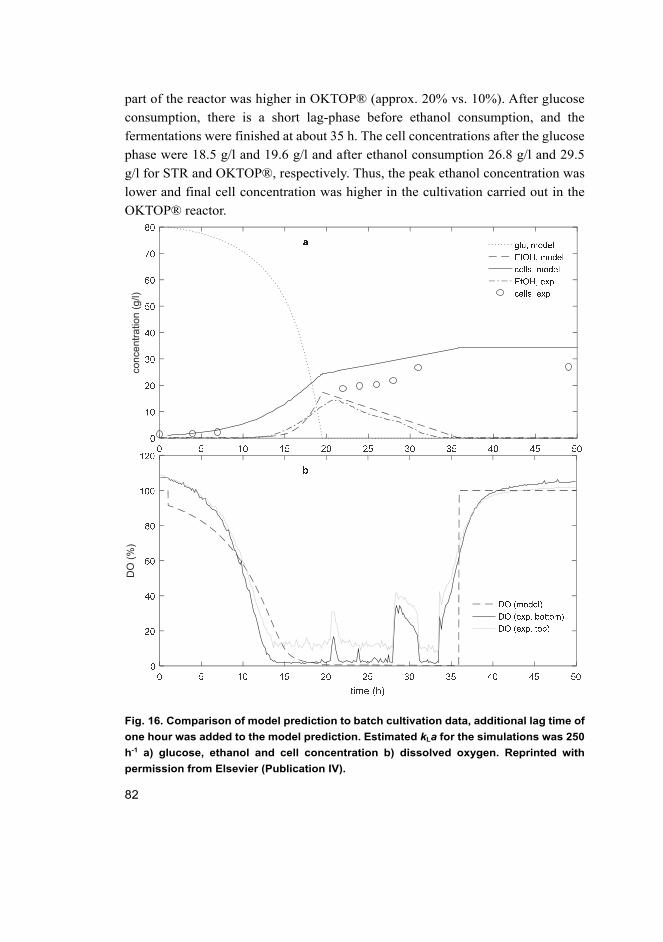
82
part of the reactor was higher in OKTOP® (approx. 20% vs. 10%). After glucose
consumption, there is a short lag-phase before ethanol consumption, and the
fermentations were finished at about 35 h. The cell concentrations after the glucose
phase were 18.5 g/l and 19.6 g/l and after ethanol consumption 26.8 g/l and 29.5
g/l for STR and OKTOP®, respectively. Thus, the peak ethanol concentration was
lower and final cell concentration was higher in the cultivation carried out in the
OKTOP® reactor.
Fig. 16. Comparison of model prediction to batch cultivation data, additional lag time of
one hour was added to the model prediction. Estimated kLa for the simulations was 250
h-1 a) glucose, ethanol and cell concentration b) dissolved oxygen. Reprinted with
permission from Elsevier (Publication IV).
conc
entra
tion
(g/l)
DO
(%)

83
Fig. 17. Measurement data from lab-scale cultivations a) STR b) OKTOP® reactor.
Reprinted with permission from Elsevier (Publication IV).
4.4.2 Simulations for large scale reactors
In the simulations with the reactor scale model, gas flow rate was scaled at constant
vs (0.02 and 0.03 m s-1) which is a prerequisite for equations (39)-(44). Volumetric
power consumption was between 250, 500 or 1000 W m-3, and the aspect ratio was
fixed so that H/T = 3 to simulate typical reactor dimensions and operational
conditions. The simulations were made for continuous cultivation with D = 0.1 h-1
and cg,in = 40 g l-1, and the comparisons between reactor scales and operational
conditions were made for the steady-state concentrations of cell mass, dissolved
oxygen and ethanol. Overall kLa-values are 130, 206 and 340 h-1 for increasing
DO
(%)
CO
2,ga
s (%) o
r EtO
H (g
/l)0 5 10 15 20 25
time (h)
0
20
40
60
80
100
120
DO
(%)
0
2.5
5
7.5
10
12.5
15
CO
2,ga
s (%) o
r EtO
H (g
/l)
DO (bottom)DO (top)ethanolgas CO2
b (OKTOP)
z=0.8H
z=0.2H

84
power input and vs = 0.02 m/s, and 164, 260 and 427 h-1 for vs = 0.03 m/s. Reactor
scales from 10 m3 to 1000 m3 were simulated although this probably exceeds the
volume of current stirred bioreactors. In their economic evaluation, Humbird et al.
(2017), estimated the price for oxygen delivery for bubble columns and stirred tank
bioreactors of different sizes. The maximum reactor volume in their study was 1000
m3, which represented a hypothetically large STR and a ceiling for what may still
be a viable design. They concluded that cost savings could still be achieved when
increasing the scale from 500 to 1000 m3. The results of the simulations from this
study are plotted as dimensionless axial dissolved oxygen concentration and
saturation concentration profiles (Fig. 18) and dimensionless cell yield as a function
of reactor volume (Fig. 19). The dimensionless cell yield is scaled with the
maximum value for fully aerobic metabolism Ysgox = 0.49 g g-1. The reactor size
and operational conditions plotted in Fig. 18a-h are marked as circles in Fig. 19.
In the simulations of the smaller reactor (10 m3, Fig. 18 a, b, e, f), the dissolved
oxygen concentration is quite uniform. Increasing the agitation from 250 to 1,000
W/m3 (f, b) would be sufficient to increase the dissolved oxygen level and prevent
fermentative metabolism due to oxygen limitation, as can be seen from Fig. 19. The
profile showing the saturation concentration of oxygen is also quite uniform as
neither the depletion of oxygen from gas phase nor the hydrostatic pressure is very
significant. In larger reactor (1,000 m3, c, d, g, h), however, the dissolved oxygen
and saturation concentration curves are far from unifrom, and values are very low
at the upper part of the reactor. This is due to oxygen depletion of gas phase and
hydrostatic pressure effects, which both affect the driving force for mass transfer.
Another factor is insufficient mixing, which causes significant axial gradient for
the dissolved oxygen concentration in the simulated conditions. In addition, radial
effects might be important but are not considered in the current model. The effect
of scale is more profound when the superficial gas velocity is lower, and increasing
the agitation power in the large scale is not sufficient to overcome these effects.
The effect of scale on cell yield can be seen in Fig. 19 as the yield decreases with
scale, particularly with volume above 100 m3. It is notable that the effect of scale
is more profound for the lower vs, and that the effect of agitation power input is
quite small in the larger scale reactors. As suggested by other authors, there is a
need to operate industrial scale reactors at higher superficial gas velocities above
the limit for homogeneous regime (vs = 0.03 m/s) and with improved gas handling
of the impeller(s) (Gezork et al., 2000; Gezork, Bujalski, Cooke, & Nienow, 2001;
Nauha et al., 2015; Nauha et al., 2018).
85
Insufficient mixing of the bulk dispersion also causes detrimental effects in the
large-scale simulations as low dissolved oxygen concentrations, leading to
fermentative metabolism, are found in the upper part of the reactor. Time scales for
oxygen transfer are in the range of 10 – 20 seconds based on the overall kLa-values,
whereas mixing times are in the range of 100 – 200 seconds in the simulations made
in 100 – 1,000 m3 scale. Based on these simulations, improving the gas handling
capacity and the liquid mixing, especially in the axial direction, would be preferred
improvements in large scale reactors. It is expected that mixing and circulation
times of a draft tube reactor are shorter and more predictable compared to a regular
stirred tank with a high aspect ratio as the draft tube provides good overall
circulation with no compartmentalization between the impellers. The current model
for liquid mixing in axial direction is based on literature work validated with STR
up to 30 m3 so the simulation results up to 1,000 m3 are indicative. Furthermore, it
cannot be applied directly for SDTR but it would require new parameter values or,
more probably, reformulation of the compartmental model to simulate this type of
reactor.

86
Fig. 18. Dimensionless axial profile of dissolved oxygen (blue line, co) and saturation
concentration (red line, cosat) calculated based on hydrostatic pressure and gas phase
oxygen fraction in STR. Reprinted with permission from Elsevier (Publication IV).
Fig. 19. The effect of reactor scale (STR), gas flow and agitation power on cell yield,
simulations were run with, D = 0.1 h-1, H/T = 3, cg,in = 40 g/l. Reprinted with permission
from Elsevier (Publication IV).
0 1 20
0.2
0.4
0.6
0.8
1
0 1 2
0 1 2
co and cosat (-)
0
0.2
0.4
0.6
0.8
1
0 1 2
co and cosat (-)
0.03 m/s1000 W/m3
10 m 3
ba
0.02 m/s1000 W/m3
10 m 3
f
0.02 m/s250 W/m3
10 m3
0.03 m/s250 W/m3
10 m 3
e
0 1 2 0 1 2
0 1 2
co and cosat (-)
0 1 2
co and cosat (-)
0.02 m/s250 W/m3
1000 m 3
g0.02 m/s
1000 W/m3
1000 m 3
h
d0.03 m/s
250 W/m3
1000 m 3
c0.03 m/s
1000 W/m3
1000 m 3
cell
yiel
d fro
m m
axim
um (-
)
87
5 Conclusions
Two biochemical processes were studied that are closely related to biorefinery
concept – enzymatic hydrolysis of cellulose and aerobic cell cultivation. The
emphasis was in mass transfer and reaction kinetics. Experimental and
computational methods were used to gain understanding of the underlying
phenomena and to develop tools for the improvement of the processes.
The mixing phenomena in solid-liquid systems and the performance of stirred
tank reactors were studied by using EIT to measure the distribution of the solid
phase or tracer compound. In the application of STR for cellulose hydrolysis, it was
found that the mixing conditions in our fed-batch system were not critical for the
hydrolysis kinetics. Therefore, the kinetic model in publication II was developed
assuming ideal mixing. The model, however, was developed to accommodate the
fed-batch process, and the substrate populations were discretized based on the
feeding schedule. This was also a feasible approach to increase the information
content of the experiments. Thus, the applicability and potential weaknesses of the
model were revealed by the extensive parametric studies. The parameter on glucose
inhibition was poorly identified, and parameter correlation issues were detected
with parameters related to other rate decreasing factors. The model still performed
well in the validation experiments and, in addition to our experiments, the model
was able to predict time course data in literature experiments with similar substrate
and enzymes.
The comparison of bioreactor concepts in terms of mass transfer efficiency and
suitability for microbial cultivation was carried out by lab-scale experiments and
modelling of yeast growth and mass transfer in large scale reactor. Time scales for
gas-liquid mass transfer, liquid mixing and oxygen uptake by microbes are in the
same range in industrial bioreactors. Furthermore, issues related to gas handling
capacity of the reactor and oxygen balance become more important in the large
scale. Therefore, the mixing conditions are very important for the process kinetics
and performance. The effect of operational conditions such as gas flow rate and
agitation power, as well as reactor geometry on gas dispersion and mass transfer
characteristics were studied by EIT and kLa-experiments in the laboratory scale.
These experiments showed the applicability of Outotec OKTOP®9000 SDTR
compared to the traditional STR. The main findings from laboratory scale
experiments that support this are the higher kLa values with similar power input,
better gas handling capacity and more uniform dissolved oxygen concentration
during yeast cultivation.
88
The model developed in this work for yeast growth can capture the relevant
phenomena in the oxygen limited cultivation of Pichia pastoris. The effect of
oxygen availability on the biomass and ethanol concentrations was predicted with
a reasonable accuracy when compared to experimental data for batch cultivation.
To study the effect of reactor scale on the yeast growth, a one-dimensional reactor
model was developed to take into account the mixing and mass transfer phenomena
in large scale reactors as well as oxygen mass balance. Using metabolic models
along with reactor models in simulation studies is an essential tool to find
bottlenecks in current reactor designs. Even accurate estimates for mixing and mass
transfer parameters, such as mass transfer coefficient, gas hold-up and flow rates,
do not tell enough about the performance and suitability of a reactor for a specific
cultivation process. The microbial metabolism needs to be accounted for as well as
mass balances of substrate(s), oxygen and other critical compounds. Thus, only by
iterating the reactor design, operational conditions and microbial metabolism, can
the cultivations conditions and process performance be optimized.
Based on the laboratory scale experiments and large scale simulations, draft
tube reactor seems to be an interesting reactor concept for industrial fermentations.
This is due to efficient liquid circulation and the effects of hydrostatic pressure on
mass transfer rate and flow regime. The assessment of different reactor types,
however, would require more rigorous assessment of the flow conditions by CFD,
for example, as well as validation experiments. In the study of cellulose hydrolysis,
using non-constant control variables and formulating the model to capture these
effects can be taken even further in order to improve our understanding of the
hydrolysis process. There are several, more complex models for enzymatic
hydrolysis available in the literature than the one used in this study. Many of them
include the different enzyme activities (CBH, EG, β-glucosidase) separately and/or
describe the substrate properties in a more mechanistic manner. Using model-based
experimental design, more information can be gained from the experiments
compared to pure batch experiments that are still utilized in most cases. The
approach of fed-batch experiments and other nonlinear experimental methods are
a promising tool to further validate other models that have been proposed in the
literature. In addition, the approach for parameter estimation and analysis can be
applied in a wide range of models. Although the issues related to mixing and reactor
design for cellulose hydrolysis were omitted in this study, the optimization of
reactor operation is still a relevant topic in both of the processes studied in this work
– cellulose hydrolysis and aerobic microbial cultivations.
89
References
Ahamed, A., & Vermette, P. (2010). Effect of mechanical agitation on the production of cellulases by Trichoderma reesei RUT-C30 in a draft-tube airlift bioreactor. Biochemical Engineering Journal, 49(3), 379–387.
Álvarez, C., Reyes�Sosa, F. M., & Díez, B. (2016). Enzymatic hydrolysis of biomass from wood. Microbial Biotechnology, 9(2), 149–156. https://doi.org/10.1111/1751-7915.12346
Bang, W., Nikov, I., Delmas, H., & Bascoul, A. (1998). Gas–liquid mass transfer in a new three-phase stirred airlift reactor. Journal of Chemical Technology & Biotechnology, 72(2), 137–142. https://doi.org/10.1002/(SICI)1097-4660(199806)72:2<137::AID-JCTB887>3.0.CO;2-E
Bansal, P., Vowell, B. J., Hall, M., Realff, M. J., Lee, J. H., & Bommarius, A. S. (2012). Elucidation of cellulose accessibility, hydrolysability and reactivity as the major limitations in the enzymatic hydrolysis of cellulose. Bioresource Technology, 107, 243–250.
Barnett, J. A., & Entian, K.-D. (2005). A history of research on yeasts 9: regulation of sugar metabolism1. Yeast, 22(11), 835–894. https://doi.org/10.1002/yea.1249
Bashiri, H., Bertrand, F., & Chaouki, J. (2016). Development of a multiscale model for the design and scale-up of gas/liquid stirred tank reactors. Chemical Engineering Journal, 297, 277–294. https://doi.org/10.1016/j.cej.2016.03.102
Baumann, K., Carnicer, M., Dragosits, M., Graf, A. B., Stadlmann, J., Jouhten, P., … Ferrer, P. (2010). A multi-level study of recombinant Pichia pastoris in different oxygen conditions. BMC Systems Biology, 4, 141. https://doi.org/10.1186/1752-0509-4-141
Baumann, K., Maurer, M., Dragosits, M., Cos, O., Ferrer, P., & Mattanovich, D. (2008). Hypoxic fed-batch cultivation of Pichia pastoris increases specific and volumetric productivity of recombinant proteins. Biotechnology and Bioengineering, 100(1), 177–183. https://doi.org/10.1002/bit.21763
Bommarius, A. S., Katona, A., Cheben, S. E., Patel, A. S., Ragauskas, A. J., Knudson, K., & Pu, Y. (2008). Cellulase kinetics as a function of cellulose pretreatment. Metabolic Engineering, 10(6), 370–381. https://doi.org/10.1016/j.ymben.2008.06.008
Boussaid, A., & Saddler, J. N. (1999). Adsorption and activity profiles of cellulases during the hydrolysis of two Douglas fir pulps. Enzyme and Microbial Technology, 24(3–4), 138–143. https://doi.org/10.1016/S0141-0229(98)00096-9
Cardona, M. J., Tozzi, E. J., Karuna, N., Jeoh, T., Powell, R. L., & McCarthy, M. J. (2015). A process for energy-efficient high-solids fed-batch enzymatic liquefaction of cellulosic biomass. Bioresource Technology, 198, 488–496. https://doi.org/10.1016/j.biortech.2015.09.042
Carnicer, M., Baumann, K., Töplitz, I., Sánchez-Ferrando, F., Mattanovich, D., Ferrer, P., & Albiol, J. (2009). Macromolecular and elemental composition analysis and extracellular metabolite balances of Pichia pastoris growing at different oxygen levels. Microbial Cell Factories, 8, 65. https://doi.org/10.1186/1475-2859-8-65
90
Carnicer, M., ten Pierick, A., van Dam, J., Heijnen, J. J., Albiol, J., van Gulik, W., & Ferrer, P. (2012). Quantitative metabolomics analysis of amino acid metabolism in recombinant Pichia pastoris under different oxygen availability conditions. Microbial Cell Factories, 11, 83. https://doi.org/10.1186/1475-2859-11-83
Cereghino, J. L., & Cregg, J. M. (2000). Heterologous protein expression in the methylotrophic yeast Pichia pastoris. FEMS Microbiology Reviews, 24(1), 45–66.
Chisti, Y., & Jauregui-Haza, U. J. (2002). Oxygen transfer and mixing in mechanically agitated airlift bioreactors. Biochemical Engineering Journal, 10(2), 143–153.
Converse, A. O., Matsuno, R., Tanaka, M., & Taniguchi, M. (1988). Model of enzyme adsorption and hydrolysis of microcrystalline cellulose with slow deactivation of the adsorbed enzyme. Biotechnology and Bioengineering, 32(1), 38–45.
Crater, J., Galleher, C., & Livense, J. (2017). Consultancy on Large-Scale Submerged Aerobic Cultivation Process Design - Final Technical Report: February 1, 2016 -- June 30, 2016. Retrieved from https://www.nrel.gov/docs/fy17osti/67963.pdf
Delvigne, F., Lejeune, A., Destain, J., & Thonart, P. (2006). Modelling of the substrate heterogeneities experienced by a limited microbial population in scale-down and in large-scale bioreactors. Chemical Engineering Journal, 120(3), 157–167. https://doi.org/10.1016/j.cej.2006.03.034
Delvigne, F., Takors, R., Mudde, R., van Gulik, W., & Noorman, H. (2017). Bioprocess scale-up/down as integrative enabling technology: from fluid mechanics to systems biology and beyond. Microbial Biotechnology, 10(5), 1267–1274. https://doi.org/10.1111/1751-7915.12803
Doran, P. M. (2012). Bioprocess engineering principles. Amsterdam�: Elsevier. Retrieved from https://oula.linneanet.fi/vwebv/holdingsInfo?bibId=1182950
Drissen, R. E. T., Maas, R. H. W., Maarel, M. J. E. C. van der, Kabel, M. A., Schols, H. A., Tramper, J., & Beeftink, H. H. (2007). A generic model for glucose production from various cellulose sources by a commercial cellulase complex. Biocatalysis and Biotransformation, 25(6), 419–429.
Eriksson, T., Karlsson, J., & Tjerneld, F. (2002). A model explaining declining rate in hydrolysis of lignocellulose substrates with cellobiohydrolase I (Cel7A) and endoglucanase I (Cel7B) of Trichoderma reesei. Applied Biochemistry and Biotechnology, 101(1), 41–60. https://doi.org/http://dx.doi.org/10.1385/ABAB:101:1:41
Festel, G. (2010). Industrial biotechnology: Market size, company types, business models, and growth strategies. Industrial Biotechnology, 6(2), 88–94. https://doi.org/10.1089/ind.2010.0006
Festel, G., Detzel, C., & Maas, R. (2012). Industrial biotechnology -- Markets and industry structure. Journal of Commercial Biotechnology, 18(1), 11–21. https://doi.org/10.5912/jcb.478
Flores-Sánchez, A., Flores-Tlacuahuac, A., & Pedraza-Segura, L. L. (2013). Model-based experimental design to estimate kinetic parameters of the enzymatic hydrolysis of lignocellulose. Industrial and Engineering Chemistry Research, 52(13), 4834–4850.
91
Fox, J. M., Jess, P., Jambusaria, R. B., Moo, G. M., Liphardt, J., Clark, D. S., & Blanch, H. W. (2013). A single-molecule analysis reveals morphological targets for cellulase synergy. Nature Chemical Biology, 9(6), 356–361. https://doi.org/10.1038/nchembio.1227
Franceschini, G., & Macchietto, S. (2008). Model-based design of experiments for parameter precision: State of the art. Chemical Engineering Science, 63(19), 4846–4872.
Galbe, M., Sassner, P., Wingren, A., & Zacchi, G. (2007). Process engineering economics of bioethanol production. Advances in Biochemical Engineering/Biotechnology, 108, 303–327. https://doi.org/10.1007/10_2007_063
Garcia-Ochoa, F., & Gomez, E. (2009). Bioreactor scale-up and oxygen transfer rate in microbial processes: An overview. Biotechnology Advances, 27(2), 153–176.
Gezork, K. M., Bujalski, W., Cooke, M., & Nienow, A. W. (2000). The transition from homogeneous to heterogeneous flow in a gassed, stirred vessel. Chemical Engineering Research and Design, 78(3), 363–370. https://doi.org/10.1205/026387600527482
Gezork, K. M., Bujalski, W., Cooke, M., & Nienow, A. W. (2001). Mass Transfer and Hold-up Characteristics in a Gassed, Stirred Vessel at Intensified Operating Conditions. 4th International Symposium on Mixing in Industrial Processes, 79(8), 965–972. https://doi.org/10.1205/02638760152721514
Ghose, T. K. (1987). Measurement of cellulase activities. Pure and Applied Chemistry, 59(2), 257–268. https://doi.org/10.1351/pac198759020257
Gogate, P. R., Beenackers, A. A. C. ., & Pandit, A. B. (2000). Multiple-impeller systems with a special emphasis on bioreactors: a critical review. Biochemical Engineering Journal, 6(2), 109–144. https://doi.org/10.1016/S1369-703X(00)00081-4
Griggs, A. J., Stickel, J. J., & Lischeske, J. J. (2012). A mechanistic model for enzymatic saccharification of cellulose using continuous distribution kinetics I: Depolymerization by EG I and CBH I. Biotechnology and Bioengineering, 109(3), 665–675.
Heikkinen, L. M. (2005). Statistical estimation methods for electrical process tomography. University of Kuopio, Kuopio.
Heikkinen, L. M., Kourunen, J., Savolainen, T., Vauhkonen, P. J., Kaipio, J. P., & Vauhkonen, M. (2006). Real time three-dimensional electrical impedance tomography applied in multiphase flow imaging. Measurement Science and Technology, 17(8), 2083–2087.
Hodge, D. B., Karim, M. N., Schell, D. J., & McMillan, J. D. (2008). Soluble and insoluble solids contributions to high-solids enzymatic hydrolysis of lignocellulose. Bioresource Technology, 99(18), 8940–8948.
Hodge, D. B., Karim, M. N., Schell, D. J., & McMillan, J. D. (2009). Model-based fed-batch for high-solids enzymatic cellulose hydrolysis. Applied Biochemistry and Biotechnology, 152(1), 88–107.
Hosseini, S. A., & Shah, N. (2011). Enzymatic hydrolysis of cellulose part II: Population balance modelling of hydrolysis by exoglucanase and universal kinetic model. Biomass and Bioenergy, 35(9), 3830–3840. https://doi.org/10.1016/j.biombioe.2011.04.029
92
Humbird, D., Davis, R., & McMillan, J. D. (2017). Aeration costs in stirred-tank and bubble column bioreactors. Biochemical Engineering Journal, 127, 161–166. https://doi.org/10.1016/j.bej.2017.08.006
Igarashi, K., Uchihashi, T., Koivula, A., Wada, M., Kimura, S., Okamoto, T., … Samejima, M. (2011). Traffic Jams Reduce Hydrolytic Efficiency of Cellulase on Cellulose Surface. Science, 333(6047), 1279–1282. https://doi.org/10.1126/science.1208386
Jesus, S. S. de, Neto, J. M., Santana, A., & Filho, R. M. (2015). Influence of impeller type on hydrodynamics and gas-liquid mass-transfer in stirred airlift bioreactor. AIChE Journal, 61(10), 3159–3171.
Jørgensen, H., Kristensen, J. B., & Felby, C. (2007). Enzymatic conversion of lignocellulose into fermentable sugars: challenges and opportunities. Biofuels, Bioproducts and Biorefining, 1(2), 119–134. https://doi.org/10.1002/bbb.4
Kadam, K. L., Rydholm, E. C., & McMillan, J. D. (2004). Development and validation of a kinetic model for enzymatic saccharification of lignocellulosic biomass. Biotechnology Progress, 20(3), 698–705. https://doi.org/10.1021/bp034316x
Kallioinen, A. (2014). Development of pretreatment technology and enzymatic hydrolysis for biorefineries. VTT Technical Research Centre of Finland. Retrieved from https://aaltodoc.aalto.fi:443/handle/123456789/13090
Kinnarinen, T., Shakhanova, M., Hietanen, E., Salmimies, R., Häkkinen, A., & Louhi-Kultanen, M. (2012). Effect of mixing on enzymatic hydrolysis of cardboard waste: Saccharification yield and subsequent separation of the solid residue using a pressure filter. Bioresource Technology, 110(0), 405–411.
Kostylev, M., & Wilson, D. (2013). Two-parameter kinetic model based on a time-dependent activity coefficient accurately describes enzymatic cellulose digestion. Biochemistry, 52(33), 5656–5664. https://doi.org/10.1021/bi400358v
Kourunen, J., Heikkinen, L. M., Paananen, P., Peltonen, K., Käyhkö, J., & Vauhkonen, M. (2011). Electrical resistance tomography for evaluating a medium consistency mixer. Nordic Pulp and Paper Research Journal, 26(2), 179–185.
Kourunen, J., Niitti, T., & Heikkinen, L. M. (2011). Application of three-dimensional electrical resistance tomography to characterize gas holdup distribution in laboratory flotation cell. Minerals Engineering, 24(15), 1677–1686.
Kristensen, J. B., Felby, C., & Jørgensen, H. (2009). Yield-determining factors in high-solids enzymatic hydrolysis of lignocellulose. Biotechnology for Biofuels, 2, 11. https://doi.org/10.1186/1754-6834-2-11
Kura, S., Nishiumi, H., & Kawase, Y. (1993). Oxygen transfer in a stirred loop fermentor with dilute polymer solutions. Bioprocess Engineering, 8(5–6), 223–228. https://doi.org/10.1007/BF00369833
Kurakake, M., Shirasawa, T., Ooshima, H., Converse, A. O., & Kato, J. (1995). An extension of the Harano-Ooshima rate expression for enzymatic hydrolysis of cellulose to account for changes in the amount of adsorbed cellulase. Applied Biochemistry and Biotechnology, 50(3), 231–241. https://doi.org/10.1007/BF02788094

93
Lebaz, N., Cockx, A., Spérandio, M., & Morchain, J. (2015). Population balance approach for the modelling of enzymatic hydrolysis of cellulose. Canadian Journal of Chemical Engineering, 93(2), 276–284. https://doi.org/10.1002/cjce.22088
Liao, W., Liu, Y., Wen, Z., Frear, C., & Chen, S. (2008). Kinetic modeling of enzymatic hydrolysis of cellulose in differently pretreated fibers from dairy manure. Biotechnology and Bioengineering, 101(3), 441–451. https://doi.org/10.1002/bit.21921
Liu, W., Wang, B., Hou, Q., Chen, W., & Wu, M. (2016). Effects of fibrillation on the wood fibers’ enzymatic hydrolysis enhanced by mechanical refining. Bioresource Technology, 206, 99–103. https://doi.org/10.1016/j.biortech.2016.01.074
Lueske, J., Kar, K., Piras, L., & Pressler, J. (2015). Power Draw and Gas-Liquid Mass Transfer Characteristics of a Stirred-Tank Reactor with Draft Tube Configuration. Chemical Engineering and Technology, 38(11), 1993–2001. https://doi.org/10.1002/ceat.201500071
Luterbacher, J. S., Moran-Mirabal, J. M., Burkholder, E. W., & Walker, L. P. (2015). Modeling enzymatic hydrolysis of lignocellulosic substrates using confocal fluorescence microscopy I: Filter paper cellulose. Biotechnology and Bioengineering, 112(1), 21–31. https://doi.org/10.1002/bit.25329
Lynd, L. R., Weimer, P. J., van Zyl, W. H., & Pretorius, I. S. (2002). Microbial cellulose utilization: fundamentals and biotechnology. Microbiology and Molecular Biology Reviews: MMBR, 66(3), 506–577.
Mansfield, S. D., Mooney, C., & Saddler, J. N. (1999). Substrate and Enzyme Characteristics that Limit Cellulose Hydrolysis. Biotechnology Progress, 15(5), 804–816. https://doi.org/10.1021/bp9900864
Mooney, C. A., Mansfield, S. D., Beatson, R. P., & Saddler, J. N. (1999). The effect of fiber characteristics on hydrolysis and cellulase accessibility to softwood substrates. Enzyme and Microbial Technology, 25(8–9), 644–650.
Moo-Young, M., Chisti, Y., & Vlach, D. (1993). Fermentation of cellulosic materials to mycoprotein foods. Biotechnology Advances, 11(3), 469–479.
Moucha, T., Linek, V., & Prokopová, E. (2003). Gas hold-up, mixing time and gas-liquid volumetric mass transfer coefficient of various multiple-impeller configurations: Rushton turbine, pitched blade and techmix impeller and their combinations. Chemical Engineering Science, 58(9), 1839–1846. https://doi.org/10.1016/S0009-2509(02)00682-6
Nauha, E. K., Kálal, Z., Ali, J. M., & Alopaeus, V. (2018). Compartmental modeling of large stirred tank bioreactors with high gas volume fractions. Chemical Engineering Journal, 334, 2319–2334. https://doi.org/10.1016/j.cej.2017.11.182
Nauha, E. K., Visuri, O., Vermasvuori, R., & Alopaeus, V. (2015). A new simple approach for the scale-up of aerated stirred tanks. Chemical Engineering Research and Design, 95, 150–161. https://doi.org/10.1016/j.cherd.2014.10.015
Nidetzky, B., & Steiner, W. (1993). A new approach for modeling cellulase-cellulose adsorption and the kinetics of the enzymatic hydrolysis of microcrystalline cellulose. Biotechnology and Bioengineering, 42(4), 469–479.
94
Nienow, A. W. (1998). Hydrodynamics of Stirred Bioreactors. Applied Mechanics Reviews, 51(1), 3. https://doi.org/10.1115/1.3098990
Niu, H., Shah, N., & Kontoravdi, C. (2016). Modelling of amorphous cellulose depolymerisation by cellulases, parametric studies and optimisation. Biochemical Engineering Journal, 105, Part B, 455–472. https://doi.org/10.1016/j.bej.2015.10.017
Noorman, H. J., & Heijnen, J. J. (2017). Biochemical engineering’s grand adventure. Chemical Engineering Science, 170(Supplement C), 677–693. https://doi.org/10.1016/j.ces.2016.12.065
Olsen, J. P., Donohoe, B. S., Borch, K., Westh, P., & Resch, M. G. (2016). Interrelationships between cellulase activity and cellulose particle morphology. Cellulose, 23(4), 2349–2361. https://doi.org/10.1007/s10570-016-0979-x
Ooshima, H., Kurakake, M., Kato, J., & Harano, Y. (1991). Enzymatic activity of cellulase adsorbed on cellulose and its change during hydrolysis. Applied Biochemistry and Biotechnology, 31(3), 253–266. https://doi.org/10.1007/BF02921752
Ooshima, H., Sakata, M., & Harano, Y. (1983). Adsorption of cellulase from Trichoderma viride on cellulose. Biotechnology and Bioengineering, 25(12), 3103–3114.
Oosterhuis, N. M. G., & Kossen, N. W. F. (1984). Dissolved oxygen concentration profiles in a production-scale bioreactor. Biotechnology and Bioengineering, 26(5), 546–550. https://doi.org/10.1002/bit.260260522
Palmqvist, B., Kadić, A., Hägglund, K., Petersson, A., & Lidén, G. (2016). Scale-up of high-solid enzymatic hydrolysis of steam-pretreated softwood: the effects of reactor flow conditions. Biomass Conversion and Biorefinery, 6(2), 173–180. https://doi.org/10.1007/s13399-015-0177-3
Palmqvist, B., & Liden, G. (2012). Torque measurements reveal large process differences between materials during high solid enzymatic hydrolysis of pretreated lignocellulose. Biotechnology for Biofuels, 5(1), 57.
Pauly, M., & Keegstra, K. (2008). Cell-wall carbohydrates and their modification as a resource for biofuels. The Plant Journal, 54(4), 559–568. https://doi.org/10.1111/j.1365-313X.2008.03463.x
Payne, C. M., Knott, B. C., Mayes, H. B., Hansson, H., Himmel, M. E., Sandgren, M., … Beckham, G. T. (2015). Fungal Cellulases. Chemical Reviews, 115(3), 1308–1448. https://doi.org/10.1021/cr500351c
Pihlajaniemi, V., Sipponen, M. H., Kallioinen, A., Nyyssölä, A., & Laakso, S. (2016). Rate-constraining changes in surface properties, porosity and hydrolysis kinetics of lignocellulose in the course of enzymatic saccharification. Biotechnology for Biofuels, 9, 18. https://doi.org/10.1186/s13068-016-0431-3
Pinelli, D., Liu, Z., & Magelli, F. (2010). Analysis of KLa measurement methods in stirred vessels: The role of experimental techniques and fluid dynamic models. International Journal of Chemical Reactor Engineering, 8. https://doi.org/10.2202/1542-6580.1915
Pollard, D. J., Ison, A. P., Shamlou, P. A., & Lilly, M. D. (1997). Influence of a propeller on Saccharomyces cerevisiae fermentations in a pilot scale airlift bioreactor. Bioprocess Engineering, 16(5), 273–281.

95
Rosenfeld, E., & Beauvoit, B. (2003). Role of the non-respiratory pathways in the utilization of molecular oxygen by Saccharomyces cerevisiae. Yeast, 20(13), 1115–1144. https://doi.org/10.1002/yea.1026
Rosgaard, L., Andric, P., Dam-Johansen, K., Pedersen, S., & Meyer, A. S. (2007). Effects of substrate loading on enzymatic hydrolysis and viscosity of pretreated barley straw. Applied Biochemistry and Biotechnology, 143(1), 27–40.
Rostami, K., Fu, W., & Moo-Young, M. (2005). Mass transfer studies in stirred airlift reactor. Chemical Engineering Communications, 192(1–3), 108–124.
Samaniuk, J. R., Scott, C. T., Root, T. W., & Klingenberg, D. J. (2011). The effect of high intensity mixing on the enzymatic hydrolysis of concentrated cellulose fiber suspensions. Bioresource Technology, 102(6), 4489–4494. https://doi.org/10.1016/j.biortech.2010.11.117
Scott, F., Li, M., Williams, D. L., Conejeros, R., Hodge, D. B., & Aroca, G. (2015). Corn stover semi-mechanistic enzymatic hydrolysis model with tight parameter confidence intervals for model-based process design and optimization. Bioresource Technology, 177, 255–265. https://doi.org/10.1016/j.biortech.2014.11.062
Searle, S. Y., & Malins, C. J. (2016). Waste and residue availability for advanced biofuel production in EU Member States. Biomass and Bioenergy, 89, 2–10. https://doi.org/10.1016/j.biombioe.2016.01.008
Sims, A. P., & Barnett, J. A. (1978). The Requirement of Oxygen for the Utilization of Maltose, Cellobiose and D-Galactose by Certain Anaerobically Fermenting Yeasts (Kluyver Effect). Microbiology, 106(2), 277–288. https://doi.org/10.1099/00221287-106-2-277
Sin, G., Meyer, A. S., & Gernaey, K. V. (2010). Assessing reliability of cellulose hydrolysis models to support biofuel process design-Identifiability and uncertainty analysis. Computers and Chemical Engineering, 34(9), 1385–1392. https://doi.org/10.1016/j.compchemeng.2010.02.012
Sluiter, A., Hames, B., Ruiz, R., Scarlata, C., Sluiter, J., & Templeton, D. (2012, August 8). Determination of Structural Carbohydrates and Lignin in Biomass. National Renewable Energy Laboratory, Golden (CO).
Solà, A., Maaheimo, H., Ylönen, K., Ferrer, P., & Szyperski, T. (2004). Amino acid biosynthesis and metabolic flux profiling of Pichia pastoris. European Journal of Biochemistry, 271(12), 2462–2470. https://doi.org/10.1111/j.1432-1033.2004.04176.x
Sonnleitner, B., & Käppeli, O. (1986). Growth of Saccharomyces cerevisiae is controlled by its limited respiratory capacity: Formulation and verification of a hypothesis. Biotechnology and Bioengineering, 28(6), 927–937. https://doi.org/10.1002/bit.260280620
Sotaniemi, V.-H., Taskila, S., Ojamo, H., & Tanskanen, J. (2016). Controlled feeding of lignocellulosic substrate enhances the performance of fed-batch enzymatic hydrolysis in a stirred tank reactor. Biomass and Bioenergy, 91, 271–277. https://doi.org/10.1016/j.biombioe.2016.05.037

96
Sotaniemi, V.-H., Tikkanen, T., Pasanen, A., Taskila, S., & Ojamo, H. (2015). Effect of enzyme and substrate dosing strategies on mixing and hydrolysis of old corrugated cardboard. Biomass Conversion and Biorefinery, 5(2), 141–148. https://doi.org/10.1007/s13399-014-0136-4
Ståhlberg, J., Johansson, G., & Pettersson, G. (1993). Trichoderma reesei has no true exo-cellulase: all intact and truncated cellulases produce new reducing end groups on cellulose. Biochimica et Biophysica Acta (BBA) - General Subjects, 1157(1), 107–113. https://doi.org/10.1016/0304-4165(93)90085-M
Tang, W., Deshmukh, A. T., Haringa, C., Wang, G., van Gulik, W., van Winden, W., … Noorman, H. J. (2017). A 9-pool metabolic structured kinetic model describing days to seconds dynamics of growth and product formation by Penicillium chrysogenum. Biotechnology and Bioengineering, 114(8), 1733–1743. https://doi.org/10.1002/bit.26294
Tervasmäki, P., Sotaniemi, V., Taskila, S., Ojamo, H., & Tanskanen, J. (2014). Intensification of high consistency hydrolysis via examination and optimization of hydrodynamics. In The 5th Nordic Wood Biorefinery conference; NWBC 2014 (pp. 289–290). Stockholm, Sweden: Innventia.
Tsai, C.-T., Morales-Rodriguez, R., Sin, G., & Meyer, A. S. (2014). A dynamic model for cellulosic biomass hydrolysis: A comprehensive analysis and validation of hydrolysis and product inhibition mechanisms. Applied Biochemistry and Biotechnology, 172(6), 2815–2837. https://doi.org/10.1007/s12010-013-0717-x
Väljamäe, P., Sild, V., Nutt, A., Pettersson, G., & Johansson, G. (1999). Acid hydrolysis of bacterial cellulose reveals different modes of synergistic action between cellobiohydrolase I and endoglucanase I. European Journal of Biochemistry, 266(2), 327–334. https://doi.org/10.1046/j.1432-1327.1999.00853.x
Väljamäe, P., Sild, V., Pettersson, G., & Johansson, G. (1998). The initial kinetics of hydrolysis by cellobiohydrolases I and II is consistent with a cellulose surface-erosion model. European Journal of Biochemistry, 253(2), 469–475.
Villadsen, J. (2011). Bioreaction engineering principles (3. ed). Springer. Vrábel, P., Van der Lans, R. G. J. M., Cui, Y. Q., & Luyben, K. C. A. M. (1999).
Compartment Model Approach. Chemical Engineering Research and Design, 77(4), 291–302. https://doi.org/10.1205/026387699526223
Vrábel, P., van der Lans, R. G. J. M., Luyben, K. C. A. M., Boon, L., & Nienow, A. W. (2000). Mixing in large-scale vessels stirred with multiple radial or radial and axial up-pumping impellers: modelling and measurements. Chemical Engineering Science, 55(23), 5881–5896. https://doi.org/10.1016/S0009-2509(00)00175-5
Wang, Z., & Feng, H. (2010). Fractal kinetic analysis of the enzymatic saccharification of cellulose under different conditions. Bioresource Technology, 101(20), 7995–8000.
Wojtusik, M., Zurita, M., Villar, J. C., Ladero, M., & Garcia-Ochoa, F. (2016). Influence of fluid dynamic conditions on enzymatic hydrolysis of lignocellulosic biomass: Effect of mass transfer rate. Bioresource Technology, 216, 28–35. https://doi.org/10.1016/j.biortech.2016.05.042

97
Ye, Z., & Berson, R. E. (2011). Kinetic modeling of cellulose hydrolysis with first order inactivation of adsorbed cellulase. Bioresource Technology, 102(24), 11194–11199.
Zacchi, G., & Axelsson, A. (1989). Economic evaluation of preconcentration in production of ethanol from dilute sugar solutions. Biotechnology and Bioengineering, 34(2), 223–233. https://doi.org/10.1002/bit.260340211
Zhang, Y.-H. P., & Lynd, L. R. (2004). Toward an aggregated understanding of enzymatic hydrolysis of cellulose: Noncomplexed cellulase systems. Biotechnology and Bioengineering, 88(7), 797–824.
Zion Market Research. (2017). Biofuels Market by Type (Bioethanol and Biodiesel), and by Form - Solid (Biocoal, Biochar), Fuel Pellets Liquid (Biodiesel and Bioethanol), and Gaseous (Biogas, Biopropane, and Syngas) - Global Industry Perspective, Comprehensive Analysis, and Forecast, 2016 – 2022. Zion Market Research.

98

99
Original publications
I Tervasmäki, P., Tiihonen, J., Ojamo, H. (2014). Comparison of solids suspension criteria based on electrical impedance tomography and visual measurements. Chemical Engineering Science, 116, 128–135. https://doi.org/10.1016/j.ces.2014.05.003
II Tervasmäki, P., Sotaniemi, V., Kangas, J., Taskila, S., Ojamo, H., Tanskanen, J. (2017). A discretized model for enzymatic hydrolysis of cellulose in a fed-batch process. Bioresource Technology, 227, 112–124. https://doi.org/10.1016/j.biortech.2016.12.054
III Tervasmäki, P., Latva-Kokko, M., Taskila, S., Tanskanen, J. (2016). Mass transfer, gas hold-up and cell cultivation studies in a bottom agitated draft tube reactor and multiple impeller Rushton turbine configuration. Chemical Engineering Science, 155, 83–98. https://doi.org/10.1016/j.ces.2016.07.048
IV Tervasmäki, P., Latva-Kokko, M., Taskila, S., Tanskanen, J. (2018). Effect of oxygen transfer on yeast growth − growth kinetic and reactor model to estimate scale-up effects in bioreactors. Food and Bioproducts Processing, 111, 129–140. https://doi.org/10.1016/j.fbp.2018.08.004
Reprinted with permission from Elsevier.
Original publications are not included in the electronic version of the dissertation.

100
A C T A U N I V E R S I T A T I S O U L U E N S I S
Book orders:Granum: Virtual book storehttp://granum.uta.fi/granum/
S E R I E S C T E C H N I C A
658. Boulkenafet, Zinelabidine (2018) Face presentation attack detection using textureanalysis
659. Kaikkonen, Harri (2018) Supporting rapid product development with agiledevelopment methodologies
660. Tervo, Oskari (2018) Transceiver optimization for energy-efficient multiantennacellular networks
661. Menberu, Meseret Walle (2018) Hydrology of peat-dominated headwatercatchments : theories and empirical analysis of the impacts of anthropogenicdisturbance
662. Hietava, Anne (2018) Electrical behaviour of submerged arc furnace’s chargematerials
663. Lappalainen, K. Matti (2018) Itämeren rehevöitymisen uudistettu diagnoosi japaradigma
664. Ahmad, Ijaz (2018) Improving software defined cognitive and secure networking
665. Laiyemo, Ayotunde Oluwaseun (2018) High speed moving networks in futurewireless systems
666. Kaleva, Jarkko (2018) Decentralized multiantenna transceiver optimization forheterogeneous networks
667. Hänninen, Tuomo (2018) Detection algorithms and FPGA implementations forSC-FDMA uplink receivers
668. Huotari, Joni (2018) Vanadium oxide nanostructures and thin films for gas sensorapplications
669. Anttila, Severi (2018) Influence of minor elements on some weldability issues ofintermediate purity stabilized ferritic stainless steels
670. Hartmann, Robert (2018) Flotation using cellulose-based chemicals
671. Porambage, Pawani (2018) Lightweight Authentication and Key management ofWireless Sensor Networks for Internet of Things
672. Bibikova, Olga (2018) Plasmon-resonant gold nanoparticles for bioimaging andsensing applications
673. Venkatraman, Ganesh (2018) Traffic aware resource allocation for multi-antennaOFDM systems
C675etukansi.fm Page 2 Wednesday, August 29, 2018 12:14 PM

UNIVERSITY OF OULU P .O. Box 8000 F I -90014 UNIVERSITY OF OULU FINLAND
A C T A U N I V E R S I T A T I S O U L U E N S I S
University Lecturer Tuomo Glumoff
University Lecturer Santeri Palviainen
Postdoctoral research fellow Sanna Taskila
Professor Olli Vuolteenaho
University Lecturer Veli-Matti Ulvinen
Planning Director Pertti Tikkanen
Professor Jari Juga
University Lecturer Anu Soikkeli
Professor Olli Vuolteenaho
Publications Editor Kirsti Nurkkala
ISBN 978-952-62-2038-3 (Paperback)ISBN 978-952-62-2039-0 (PDF)ISSN 0355-3213 (Print)ISSN 1796-2226 (Online)
U N I V E R S I TAT I S O U L U E N S I SACTAC
TECHNICA
U N I V E R S I TAT I S O U L U E N S I SACTAC
TECHNICA
OULU 2018
C 675
Petri Tervasmäki
REACTION AND MASS TRANSFER KINETICS IN MULTIPHASE BIOREACTORSEXPERIMENTAL AND MODELLING STUDIES
UNIVERSITY OF OULU GRADUATE SCHOOL;UNIVERSITY OF OULU,FACULTY OF TECHNOLOGY
C 675
AC
TAP
etri Tervasmäki
C675etukansi.fm Page 1 Wednesday, August 29, 2018 12:14 PM