Bycatch associated with a horseshoe crab ( Limulus … · · 2018-02-07Bycatch associated with a...
108
Bycatch associated with a horseshoe crab (Limulus polyphemus) trawl survey: identifying species composition and distribution Larissa J. Graham Thesis submitted to the Faculty of Virginia Polytechnic Institute and State University in partial fulfillment of the requirements for the degree of Master of Science in Fisheries and Wildlife Sciences Brian R. Murphy, Chair Jim Berkson David Hata August 2, 2007 Blacksburg, Virginia Tech Keywords: horseshoe crab, bycatch, trawl survey, fisheries management, Middle Atlantic Bight, species composition, Multidimensional Scaling, width-weight relationship Copyright 2007, Larissa J. Graham
-
Upload
hoangnguyet -
Category
Documents
-
view
222 -
download
0
Transcript of Bycatch associated with a horseshoe crab ( Limulus … · · 2018-02-07Bycatch associated with a...

Bycatch associated with a horseshoe crab (Limulus polyphemus) trawl survey: identifying species composition and distribution
Larissa J. Graham
Thesis submitted to the Faculty of Virginia Polytechnic Institute and State University in partial fulfillment of the requirements for the degree of
Master of Science in
Fisheries and Wildlife Sciences
Brian R. Murphy, Chair Jim Berkson David Hata
August 2, 2007
Blacksburg, Virginia Tech
Keywords: horseshoe crab, bycatch, trawl survey, fisheries management, Middle Atlantic Bight, species composition, Multidimensional Scaling, width-weight relationship
Copyright 2007, Larissa J. Graham
Bycatch associated with a horseshoe crab (Limulus polyphemus) trawl survey:
identifying species composition and distribution
Larissa J. Graham
Abstract
Horseshoe crabs (Limulus polyphemus) have been harvested along the east coast
of the United States since the 1800s, however a Fishery Management Plan (FMP) was
only recently created for this species. To date, there have not been any studies that have
attempted to identify or quantify bycatch in the horseshoe crab trawl fishery. A
horseshoe crab trawl survey was started in 2001 to collect data on the relative abundance,
distribution, and population demographics of horseshoe crabs along the Atlantic coast of
the United States. In the present study, species composition data were collected at sites
sampled by the horseshoe crab trawl survey in 2005 and 2006. Seventy-six different taxa
were identified as potential bycatch in the horseshoe crab trawl fishery. Non-metric
multidimensional scaling (NMS) was used to cluster sites and identify the spatial
distribution of taxa. Sites strongly clustered into distinct groups, suggesting that species
composition changes spatially and seasonally. Species composition shifted between
northern and southern sites. Location and bottom water temperature explain most of the
variation in species composition. These results provide a list of species that are
susceptible to this specific trawl gear and describe their distribution during fall months
throughout the study area. Identifying these species and describing their distribution is a
first step to understanding the ecosystem-level effects of the horseshoe crab trawl fishery.

iii
Acknowledgements
I wish to extend my sincere appreciation to Dr. Brian Murphy for “adopting” me
as a graduate student and providing direction over the past three years. I also wish to
thank the members of my committee, Dr. Dave Hata, for providing numerous hours of
assistance in the field and guidance with data analysis, and Dr. Jim Berkson, for
providing the opportunity to begin my assistantship at Virginia Tech. A special thanks to
thank Scott Klopfer for spending endless hours assisting with GIS analyses, Than Hitt for
his help with community analyses, and Amy Villamagna, Bray Ray, Mike Duncan, and
Michelle Davis for their assistance with data analyses, manuscript reviews, and
discussion of research ideas. Matt Arsenault (US Geological Survey), Mark Botton
(Fordham University), Stewart Michels (Delaware Division of Fish and Wildlife), and
Lewis Gillingham (Virginia Marine Resources Commission) provided data sets for
analyses and the captains and crew members of our chartered fishing vessels assisted
with data collection. I extend my sincere appreciation to NOAA Fisheries for providing
the funding to support my research project (Grant # NA05NMF4751135). On a personal
note, I am gracious for the many friends I have made over the past three years, especially
Amy Villamagna, Joanne Davis, Catherine Tredick, and Julia Bartens. I’d also like to
extend a sincere thank you to three friends that have grown dear to my heart throughout
my time at Virginia Tech- Brad Ray for his unselfish, caring nature; Eliza Heery for the
inspiring conversations and giggle fits; and lastly, Robert Leaf for his uplifting words and
continuous support throughout the past year. Most importantly, I’d like to extend my
love and gratitude to my parents for their unconditional love, support, and inspiration.

iv
Table of Contents Abstract……………………………………………...…………………………… ii
Acknowledgements……………………………………………………………… iii List of Tables…………………………………………………………………….. vi List of Figures……………………………………………………………………. vii
Chapter 1. Identifying bycatch in the horseshoe crab (Limulus polyphemus) trawl fishery: a step toward ecosystem-level management. Introduction……………………………………………………………………… 1
Ecosystem management…………………………………………………………. 2
Bycatch……………………………………………………………………. 6
Bycatch monitoring programs…………………………………………….. 9
The horseshoe crab trawl survey………………………………………………… 13
The horseshoe crab fishery………………………………………………... 13
The Middle Atlantic Bight ………………………………………………... 16
Potential bycatch species………………………………………………….. 17
Project objectives………………………………………………………………… 20
Conclusion……………………………………………………………………….. 21
Chapter 2. Identifying species composition and distribution of bycatch associated with a horseshoe crab (Limulus polyphemus) trawl survey along the Middle Atlantic Bight USA. Abstract………………………………………………………………………….. 23
Introduction……………………………………………………………………… 24
Methods………………………………………………………………………..… 27
Data collection……………………………………………………………. 27
Data analysis……………………………………………………................ 29
Descriptive analysis…………………………………………………... 29
Community analysis…………………………………………………... 29
Community analysis: influence of abiotic factors…………….………. 30
Community analysis: species composition.........................…………… 32
Results…………………………………………………………………………… 32
Descriptive analysis…………………………………………………... 32
Community analysis…………………………………………………... 32
Community analysis: influence of abiotic factors…………….………. 33
Community analysis: species composition.........................…………… 34
Discussion……………………………………………………………………….. 35
Descriptive analysis…………………………………………………... 35
Community analysis…………………………………………………... 35

v
Community analysis: influence of abiotic factors…………….………. 36
Community analysis: species composition.........................…………… 38
Species assemblages………………...………………………………… 42
Management Implications……………………………………………………...... 43
Conclusion……………………………………………………………………….. 47 Chapter 3: Examining current and alternative approaches to estimating biomass of horseshoe crab (Limulus polyphemus) landings along the Middle Atlantic Bight. Abstract………………………………………………………………………….. 71
Introduction……………………………………………………………………… 72
Methods…………………………………………………………………………. 74
Calculating the width-weight equations………………………………….. 74
Choosing the conversion factors………………………………………….. 75
Obtaining the independent data sets……………………………………… 76
Estimating total biomass………………………………………………….. 76
Results…………………………………………………………………………… 77
Calculated width-weight equations: estimates of biomass……………….. 77
Conversion factors: estimates of biomass………………………………… 77
Discussion……………………………………………………………………….. 78
Calculated width-weight equations: estimates of biomass……………….. 78
Conversion factors: estimates of biomass………………………………… 79
Management implications………………………………………………… 80
Conclusion………………………………………………………………………. 82 Literature cited……………………………………...…………………………. 90
Vita………………………………………………………………………………. 100

vi
List of Tables Table 2.1. Catch per unit effort (CPUE) for all species caught during the 2005 and 2006 horseshoe crab trawl survey. Sites between Montauk, New York and Atlantic City, New Jersey were defined as northern sites and sites between Atlantic City, New Jersey and the southern tip of the Delmarva Peninsula were defined as southern sites.………………...48 Table 2.2. Percent occurrence of most commonly caught taxa during the 2005 and 2006 horseshoe crab trawl surveys. Only taxa that were present in at least 10% of tows for at least one survey are listed………………………………………………………………..51 Table 2.3. Multiple response permutation procedure (MRPP) tests among changes in species composition at sites due to location, time of tow, and distance from shore. Tests were preformed using rank transformed Bray-Curtis distance measures. A chance-corrected within-group agreement value (A) greater that 0.30 indicates ecological significance………………………………………………………………………………52 Table 2.4. Non-metric multidimensional scaling (NMS) environmental loadings on axes 1 and 2. NMS analyses were conducted for horseshoe crab trawl survey data collected in 2005, 2006, and both years combined…………………………………………………...53 Table 2.5. List of species caught as bycatch during the horseshoe crab trawl survey. A measure of resilience and the status of the fishery, management, and conservation are listed for each species……………………………………………………………………54 Table 3.1. Prosomal width and horseshoe crab weight characteristics for female, male, and combined sexes of horseshoe crabs………………………………………………….84 Table 3.2. Parameters of the relationship ( )(log)(log)(log abPWWT eee +⋅= ) between
prosomal width and weight for female, male, and combined sexes of horseshoe crabs…85 Table 3.3. Two methods of estimating biomass were tested (width-weight equations calculated from measurements taken during a horseshoe crab trawl survey and conversion factors currently used by various state agencies) using independent data sets that contained width and weight measurements from individual horseshoe crabs. The percentage that each method over- or under-estimated biomass of female, male, and all horseshoe crabs is listed in the table below….…………………...……………………...86

vii
List of Figures Figure 1.1. The horseshoe crab trawl survey sites along the Middle Atlantic Bight (MAB). The MAB extends from Georges Bank (offshore of Cape Cod, Massachusetts) to Cape Hatteras, North Carolina. The New York Bight is included within the MAB, extending from Montauck, New York to Cape May, New Jersey..……………………..22 Figure 2.1. Sites sampled during the horseshoe crab trawl survey during the fall season of 2005 (a) and 2006 (b). Northern sites were defined as sites north of Atlantic City, New Jersey and southern sites as sites south of Atlantic City, New Jersey……………..60 Figure 2.2 Percentage of total biomass and count data for major taxa caught during the 2005 and 2006 horseshoe crab trawl surveys. Skates and horseshoe crabs comprised the majority of catch....…………………….………………………………………………...61 Figure 2.3 Distribution and catch per unit effort (CPUE, kg/km) for species commonly caught during the horseshoe crab trawl survey. Summer flounder (b), windowpane flounder (c), and spider crab (d) were often caught in the same areas as horseshoe crabs (a)…………………………………………….…………………………………………..62 Figure 2.4. Catch per unit effort (CPUE, kg/km) for horseshoe crabs during the 2005 (a) and fall 2006 (b) horseshoe crab trawl surveys. Horseshoe crabs were caught in higher abundance at southern sites during both years…………………………………………...63 Figure 2.5. Cluster ordination using non-metric multidimensional scaling (NMS) with a Bray-Curtis distance measure for species composition data collected during the 2005 horseshoe crab trawl survey. Sites formed two distinct groups: one group of all southern sites and one group of mostly northern sites. Temperature and salinity explained most of the variation in species composition among sites………………………………………..64 Figure 2.6. Cluster ordination using non-metric multidimensional scaling (NMS) with a Bray-Curtis distance measure for species composition data collected during the 2006 horseshoe crab trawl survey. Sites formed two distinct groups: one group of all southern sites and one group comprised of northern and southern sites. Temperature and depth explained most of the variation in species composition among sites.…………………...65 Figure 2.7. Cluster ordination using non-metric multidimensional scaling (NMS) with a Bray-Curtis distance measure for species composition collected at sites during the 2005 and 2006 horseshoe crab trawl survey. Sites formed two distinct groups: one group of all southern sites and one group comprised of mostly northern sites. The group comprised on mostly northern sites contained three sub-groups: one subgroup comprised of northern and southern sites (“Intermediate”), one sub-group of all northern sites (“Northern”), and the last sub-group comprised of northern, deep-water sites (“Deep”). Temperature explained most of the variation in species composition among sites.…………………...66

viii
Figure 2.8. Distribution and catch per unit effort (CPUE, kg/km) of species commonly caught at southern sites during the 2005 and 2006 horseshoe crab trawl survey. Maps are shown for knobbed whelk (a), channeled whelk (b), southern stingray (c), bullnose and southern eagle ray (d)…………………………………………………………………….67 Figure 2.9. Distribution and catch per unit effort (CPUE, kg/km) of species commonly caught at northern sites during the 2005 and 2006 horseshoe crab trawl survey. Maps are shown for little and winter skate (a), spiny dogfish (b), striped searobin (c), winter flounder (d)…………………………………..…………………………………………………….68 Figure 2.10. Percent sand (a), mud (b), clay (c), and gravel (d) throughout the study area. Bottom composition throughout most of the study area consisted of more than 80% sandy substrate…………………………………………………………………………...69 Figure 2.11. Distribution and catch per unit effort (CPUE, kg/km) of Atlantic sturgeon caught during the horseshoe crab trawl survey…………………………………………..70 Figure 3.1. Sampling location and number of horseshoe crabs measured throughout the study area. Prosomal width and horseshoe crab weight were collected for 925 horseshoe crabs along the Atlantic coast of the United States………………………………………87 Figure 3.2. The prosomal-width-to-frequency distribution of female (solid bars) and male (open bars) horseshoe crabs collected along the Atlantic Coast…………………………88 Figure 3.3. Observed and estimated horseshoe crab prosomal widths and weights. Observed measurements were collected from spawning surveys on the Delaware Bay, New Jersey (a); Raritan Bay, New Jersey (b); and Delaware Bay, Delaware (c); and from commercial harvest (hand and dredge) off the coast of Virginia (d). The observed measurements of male horseshoe crabs are represented by open squares and female horseshoe crabs are represented by open triangles. Two width-weight equations were derived using measurements collected from horseshoe crabs along the Atlantic coast. Weight was estimated based on sex and prosomal width of each individual crab, and is represented by the solid line………………………….……………………………….…89

1
Chapter 1.
Identifying bycatch in the horseshoe crab trawl fishery:
a step toward ecosystem-level management.
Introduction
Marine fisheries have traditionally been managed using a single-species approach,
but in the past this type of management has often failed to create sustainable fisheries
(NMFS 1999). Managers are now moving toward ecosystem-based fisheries
management, not only focusing on sustaining fisheries, but also healthy ecosystems to
support those fisheries (Pikitch et al. 2004). This holistic approach examines abiotic and
biotic interactions between fisheries and the ecosystem and incorporates these
interactions into management plans. To encourage managers to move toward an
ecosystem-level approach of management, NOAA Fisheries suggested Fisheries
Ecosystem Plans (FEPs) be developed for all major ecosystems in an effort to create
sustainable fisheries for a greater number of species (Botsford et al. 1997; NMFS 1999).
One objective of FEPs is to estimate the amount of non-target individuals that are
incidentally caught by fishing gears within each fishery (NMFS 1999). The removal of
these organisms (through harvest, death after release, or unobserved mortality due to gear
encounter) can have negative impacts on populations, communities, and the ecosystem
(Crowder and Murawski 1998).
Horseshoe crabs (Limulus polyphemus) have been harvested in many states along
the Atlantic coast since the mid-1800s (ASMFC 1998). However, it was not until 1997
that a fishery management plan (FMP) was created for this species. Over the past 10

2
years, researchers have been collecting data to allow for more effective management of
horseshoe crab populations. In 2001, a benthic trawl survey was developed to collect
data on the abundance, distribution, and demographics of horseshoe crabs (Hata and
Berkson 2004). Since the trawl survey uses the same gear as the commercial fishery, I
was able to collect data to identify the non-target species that are susceptible to trawl gear
used in the horseshoe crab commercial trawl fishery. Currently, the ecosystem-level
impacts of this fishery are unknown. This study has identified the species that are
commonly caught by horseshoe crab trawl gear, allowing managers to begin to
understand the ecosystem-level effects of the horseshoe crab trawl fishery.
Ecosystem Management
Traditionally, marine fisheries have been managed from a single-species
approach, with the goal of maximizing the catch of a single target species (Pikitch et al.
2004). However, this type of management is not always appropriate because it ignores
the direct and indirect effects that harvesting a target species may have at the ecosystem
level (Botsford et al. 1997; Pikitch et al. 2004), and the possible effects of distant
ecosystem components on the target species itself. Oftentimes the harvest of one species
can affect habitat characteristics, predator and prey relationships, and other ecosystem
components (Pikitch et al. 2004). Today, managers are adapting a more holistic approach
to management. Ecosystem management reverses the order of management priorities,
starting with the ecosystem instead of the target species (Pikitch et al. 2004).

3
Although ecosystem management has been defined in many ways, all definitions
have common themes including: developing system-wide perspectives; emphasizing the
complex composition and processes of ecological systems; managing for ecological
integrity and maintaining diversity; integrating across spatial and temporal scales and
human ecological, economic and cultural concerns; using management techniques that
remain flexible and can adapt to uncertainty; and including many participants in decision
making (Grumbine 1994; Meffe et al. 2002). “Ecosystem management integrates
scientific knowledge of ecological relationships within a complex sociopolitical and
values framework toward the general goal of protecting native ecosystem integrity over
the long term” (Grumbine 1994).
The overall objective of ecosystem-based fisheries management is to not only
sustain fisheries, but also to sustain healthy ecosystems to support fisheries (Pikitch et al.
2004). To do this, researchers, managers, and politicians must work to understand the
abiotic and biotic interactions between fisheries and the ecosystem and incorporate these
interactions into management plans. Some of the most important aspects are managing
ecosystems to avoid the degradation, minimizing the risk of irreversible changes to
natural species assemblages and processes of the ecosystem, obtaining and maintaining
long-term socioeconomic benefits, and generating knowledge of ecosystem processes to
better understand the consequences of anthropogenic effects (Pikitch et al. 2004).
However, developing a management plan that incorporates all interactions among
physical, biological, and human components of the ecosystem is nearly impossible and
would require a complete understanding of ecosystem dynamics and community structure
(Botsford et al. 1997; NMFS 1999). Ecosystems are complex and adaptive systems that
4
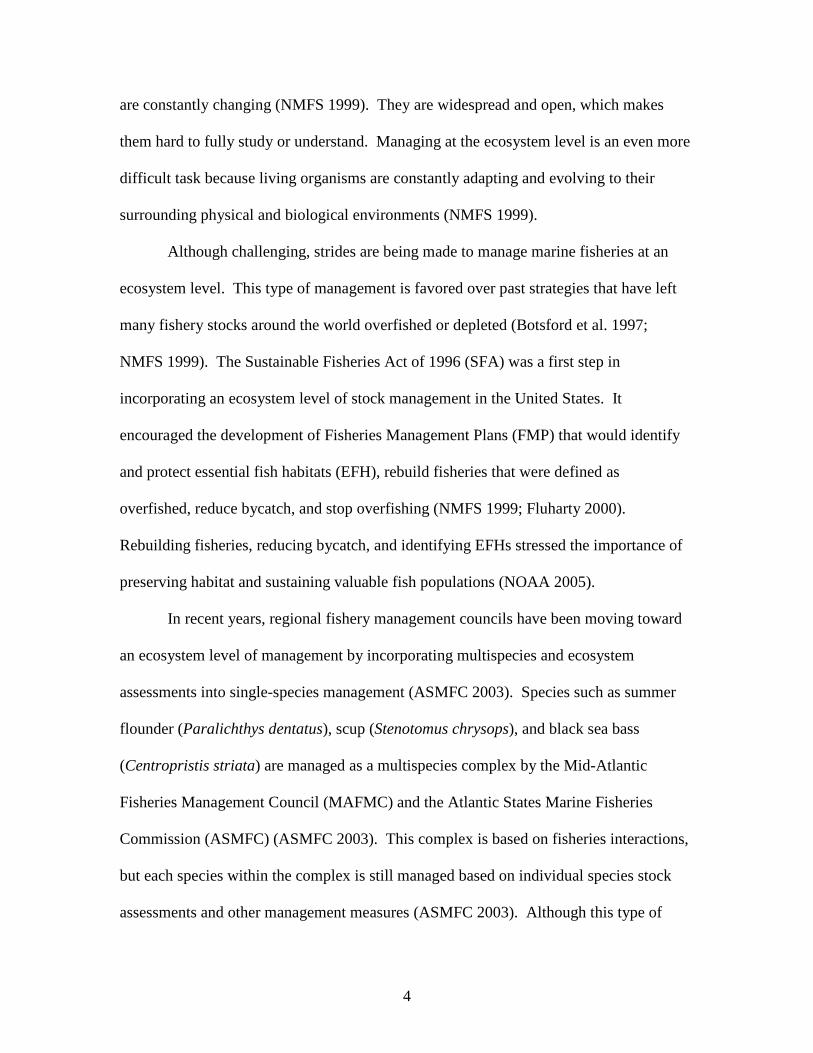
are constantly changing (NMFS 1999). They are widespread and open, which makes
them hard to fully study or understand. Managing at the ecosystem level is an even more
difficult task because living organisms are constantly adapting and evolving to their
surrounding physical and biological environments (NMFS 1999).
Although challenging, strides are being made to manage marine fisheries at an
ecosystem level. This type of management is favored over past strategies that have left
many fishery stocks around the world overfished or depleted (Botsford et al. 1997;
NMFS 1999). The Sustainable Fisheries Act of 1996 (SFA) was a first step in
incorporating an ecosystem level of stock management in the United States. It
encouraged the development of Fisheries Management Plans (FMP) that would identify
and protect essential fish habitats (EFH), rebuild fisheries that were defined as
overfished, reduce bycatch, and stop overfishing (NMFS 1999; Fluharty 2000).
Rebuilding fisheries, reducing bycatch, and identifying EFHs stressed the importance of
preserving habitat and sustaining valuable fish populations (NOAA 2005).
In recent years, regional fishery management councils have been moving toward
an ecosystem level of management by incorporating multispecies and ecosystem
assessments into single-species management (ASMFC 2003). Species such as summer
flounder (Paralichthys dentatus), scup (Stenotomus chrysops), and black sea bass
(Centropristis striata) are managed as a multispecies complex by the Mid-Atlantic
Fisheries Management Council (MAFMC) and the Atlantic States Marine Fisheries
Commission (ASMFC) (ASMFC 2003). This complex is based on fisheries interactions,
but each species within the complex is still managed based on individual species stock
assessments and other management measures (ASMFC 2003). Although this type of

5
management begins to incorporate some direct effects of harvest on non-target species,
there are still many ecosystem-level effects that are not incorporated in multispecies
management plans.
To continue working toward an ecosystem level of management, the National
Marine Fisheries Service (NOAA Fisheries) suggested that a Fisheries Ecosystem Plan
(FEP) be developed by each regional fishery management council for all major
ecosystems within their region (NMFS 1999). FEPs will provide background on the
components and functions of the ecosystem, and guide the development of management
strategies that take into account ecosystem-level effects. NOAA Fisheries suggested
eight steps for the development of FEPs:
1. Delineate the geographic extent, characterize the biological, physical, and chemical dynamics, and define zones for alternative uses of the ecosystem(s) within each Council’s authority;
2. Develop a model of the food web; 3. Describe the habitat needs for all stages of all animals and plants that are part of
the food web and how they are involved in conservation and management; 4. Calculate total removals and relate these removals to standing biomass,
production, optimal yields, natural mortality, and trophic structure; 5. Assess uncertainty and what kind of buffers can be used in conservation and
management actions; 6. Develop targets for ecosystem health; 7. Describe available long-term monitoring data and how it will be used; and 8. Assess the ecological, human, and institutional elements of the ecosystem that
most significantly affect fisheries.
Although difficult to create, FEPs will provide valuable information about ecosystems,
which is crucial to fisheries management (NMFS 1999). While FMPs are still the basic
tool used to manage fisheries, sustainability may be more easily achieved in fisheries by
incorporating FEPs into management planning and acknowledging ecosystem-level
effects.

6
One important aspect of ecosystem-based fisheries management is to calculate
total removals within a fishery, including the total removal of target and non-target
individuals that are landed, caught and released, eliminated by predation, or lost through
incidental capture (NMFS 1999). Many individuals that are incidentally caught and
thrown back into the water often die as a result of stress or trauma. These losses may
affect the total size, age structure, and sex ratios of target and non-target populations, as
well as the overall food web and habitat (Crowder and Murawski 1998; NMFS 1999;
Horsten and Kirkegaard 2002). Therefore, it is critical to identify and estimate bycatch
within each fishery. To do this adequately, NOAA Fisheries suggests that FEPs should
list species that are caught as bycatch within each fishery and show how the distribution
of these species changes spatially and temporally (NMFS 1999).
Bycatch
Before bycatch can be properly identified in each fishery, the term bycatch must
be specifically defined. The Magnuson-Stevens Fishery and Conservation Act (MSFCA)
describes bycatch as “…fish which are harvested in a fishery, but which are not sold or
kept for personal use, and includes economic discards and regulatory discards…”
(MSFCA 1996). However, some captured non-targeted species are harvested because
they are profitable. Therefore, Crowder and Murawski (1998) divide bycatch into three
main categories: kept bycatch, discarded bycatch, and unobserved mortalities. Kept
bycatch includes non-target species that are harvested, sometimes providing an important
source of income for the fisher (Crowder and Murawski 1998). Discarded bycatch
includes individuals that are captured and then released (dead or alive) because they are

7
not the species, size, sex, or condition that was targeted (Davis 2002). Individuals may
also be discarded if there is a lack of space on board the vessel, or quotas have already
been reached. Unobserved mortality, the last category of bycatch, includes individuals
that encounter but are not retained by the gear (Crowder and Murawski 1998).
Biologically, bycatch that is discarded and suffers mortality is equivalent to
harvested catch because, in both cases, individuals are eliminated as a living part of the
system. Discarded bycatch can have positive effects on other ecosystem components by
providing food for organisms, such as birds and benthic scavengers (Ramsay et al. 1997;
Votier et al. 2004). However, the removal of individuals as bycatch can also impact the
ecosystem in negative ways. Effects may be simple, resulting in the direct mortality of
juvenile fishes, or more complex, causing changes at the population, community, and
ecosystem levels (Alverson et al. 1994; Kennelly 1995). The mortality of smaller-sized
individuals that have not reached reproductive age may result in lower recruitment to the
spawning stock (Crowder and Murawski 1998). The removal of fish below the optimal
or legal size limit may result in a reduction in overall efficiency within the fishery,
because of a potential decrease in the yield-per-recruit of the stock (Crowder and
Murawski 1998). Intense removal, through harvest or discard, can impact communities
and the ecosystem by altering species abundance, predator/prey relationships, and
competitive interactions (Alverson et al. 1994; Kennelly 1995; Crowder and Murawski
1998). Size distribution and prey abundance may shift as larger predators and grazers are
removed from the ecosystem, leading to changes in the food web and trophic
displacement (Ward and Myers 2005). Overall, scientists expect that if the rate of

8
bycatch in a fishery is high, target and non-target species will be affected at some level
(Alverson et al. 1994; Horsten and Kirkegaard 2002).
It is important to understand how fisheries are affecting non-target species.
Identifying and quantifying bycatch species, allows managers to understand which non-
target species are affected by each fishery and to incorporate total removals of non-target
species into management plans. This is important for managed, unmanaged, and
federally-listed species, all which may be susceptible to the gears used in fisheries. Many
managed species are harvested by commercial fishers and recreational fisheries. The
stock status of managed species is monitored, but this is not the case for all unmanaged
species. Although not managed, these individuals may play important roles in the
ecosystem. Without proper monitoring, populations of unmanaged species may
plummet, undetected. Many federally-listed species are also susceptible to the gears used
in some fisheries. These populations are already at low population sizes and removing
even a few individuals can have detrimental effects on these species.
Monitoring programs provide data to identify bycatch occurring within each
fishery, leading to a better understanding of some of the effects that these fisheries are
having at the ecosystem level. However, in most fisheries, reliable methods to monitor
bycatch have not yet been developed. Developing methods to calculate an unbiased and
precise estimate of bycatch that can be used in all fisheries is a technical, logistic, and
financial challenge (Crowder and Murawski 1998). Gear type varies among fisheries,
ranging from fish traps to trawl nets to longlines, each of which fishes differently.
Besides developing methods that can be used to estimate bycatch across all gear types,
estimating the mortality of discarded bycatch is another challenge (Davis 2002).

9
Variable environmental conditions, such as capture and gear effects, light conditions,
water temperature, air exposure, dissolved oxygen levels, and sea conditions all may
affect the mortality rate of the individual (Davis 2002). Further, each species has a
different vulnerability to stress. Some species may be able to endure longer time out of
the water or tolerate more handling than other species.
Bycatch monitoring programs
Programs have been implemented to monitor bycatch, but many are inconsistent
because they differ in methods, effort, and objectives (Crowder and Murawski 1998).
Data are mainly collected using fishery-independent and fishery-dependent surveys
(NOAA 2003). Fishery-independent surveys randomly sample sites using research or
chartered fishing vessels (NOAA 2003). The objectives of fishery-independent surveys
are to provide data for stock assessment (e.g., variation of abundance, spatial and
temporal distribution patterns, age and size composition, and fecundity measures; NOAA
2003). These data are thought to accurately reflect the distribution and abundance of
species because sites are selected based on a random sampling method (Fox and Starr
1996). However, these surveys do not always sample the same area or with the same
fishing technique (e.g., gear, tow length) as do commercial fishers. Fishery-dependent
surveys are more commonly used in bycatch-monitoring programs because these surveys
collect data by directly observing the commercial fishery. This type of sampling may be
more accurate in quantifying bycatch occurring in a fishery because it samples the same
areas that are actively fished by commercial vessels. Some programs collect fishery-
dependent data by requiring fishers to record bycatch in logbooks (NOAA 2003).

10
However, these data can be skewed due to varying economic conditions, changes in
statutes, policies, and fishing methods, and the willingness of fishers to provide accurate
data (NEAMAP 2003). It is preferred that scientific observers sort, identify, count,
measure, and/or weigh bycatch aboard commercial vessels during fishing activities.
These observers are usually trained by management agencies and provide a less-biased
way to collect data aboard vessels. Still, there may be a lack of consistency because
bycatch is quantified in different ways among various programs (Horsten and Kirkegaard
2002).
There are many fishery-independent and fishery-dependent surveys that monitor
marine species along the Atlantic coast. The Northeast Fisheries Science Center
(NEFSC), a part of NOAA Fisheries, conducts fall and spring bottom trawl surveys to
monitor the abundance and seasonal distribution of adult and juvenile fish (Reid et al.
1999). The data from this survey show patterns of distribution along the northern and
middle Atlantic coast of the United States, independent of state lines or other boundaries.
Currently, NEFSC is the only organization that has conducted a repeated, consistent
survey over both a long time-scale and broad geographical area. Surveys have been
conducted since the early 1960s, extending throughout the Middle Atlantic Bight,
southern New England Nantucket Shoals, Georges Bank, Gulf of Maine, and Scotian
Shelf (Reid et al. 1999).
The Marine Resources Monitoring, Assessment and Prediction (MARMAP)
program has been collecting fishery-independent data on groundfish, reef fishes,
ichthyoplankton, and coastal pelagic fishes along the Southeast Atlantic Bight (SAB),
from Cape Lookout, North Carolina to Cape Canaveral, Florida, for the past thirty years

11
(SEDAR 2003). MARMAP has conducted trawl and ichthyoplankton surveys, sampling
and mapping of reefs, and life history, population, and tagging studies to provide data on
the distribution, relative abundance, and critical habitat of fishes that are economically
and ecologically important (SEDAR 2003).
Other fishery-independent surveys include the Southeast Area Monitoring and
Assessment Program (SEAMAP) and the Northeast Area Monitoring and Assessment
Program (NEAMAP). Since 1986, NOAA Fisheries has also sponsored SEAMAP,
which surveys the Southern Atlantic Bight between Cape Canaveral, Florida and Cape
Hatteras, North Carolina (Reid et al. 1999, SEAMAP 2000). In October 1997, a
resolution was passed to develop NEAMAP in an effort to collect data north of Cape
Hatteras, North Carolina (NEAMAP 2003). Pilot studies have been completed and this
project is planned to be implemented in 2007 (NEAMAP 2003).
The Atlantic Coastal Cooperative Statistics Program (ACCSP) was started in
1995 to collect fishery-dependent data from commercial, recreational, and for-hire fishers
along the Atlantic coast (ACCSP 2005). Although many programs are still in
development, data will be collected for finfish, crustaceans, shellfish, live rock, coral,
marine mammals, and federally-listed, discarded, protected, aquaculture, and
internationally managed species (ACCSP 2005).
The collection of fishery-dependent and fishery-independent data is important for
monitoring bycatch within a fishery. Hall (1996, 2000) suggests that these data can be
used to identify the spatial and temporal patterns of species and provide a ratio of bycatch
to catch based on area and season. When the ratio of bycatch to catch is high in a specific
area or during a specific season, restrictions can be implemented to reduce the amount of

12
non-targeted species that are caught. Fishers also can modify fishing location and gear
type to target areas based on the spatial and temporal patterns of a target species. This
technique can allow fishers to optimize catch, minimize effort, and reduce bycatch.
Data collected during fishery-dependent and fishery-independent surveys also can
provide a better understanding of the ecology of an area. Changes in the species
composition and distribution allow managers to gain a better understanding of
community structure, relationships among species, and the effects of bycatch on an
ecosystem (Greenstreet et al. 1999; Gomes et al. 2001; Beentjies et al. 2002). Abundance
and distribution data can be used to identify species assemblages, or a group of species
that commonly co-occur, and gain a better understanding of the direct and indirect effects
that a fishery could have on non-target species. Examining co-occurrences allow
researchers to gain a better understanding of predator-prey interactions, competition, and
community structure (Greenstreet 1999; Gomes 2001). Identifying species assemblages
also allows managers to predict which species may be caught as bycatch in a fishery. For
example, past studies suggest that summer flounder along the Atlantic coast commonly
associate with scup, black sea bass, northern searobin (Prionotus carolinus), and spiny
dogfish (Squalus acanthias) (Colvocoresses and Musick 1984; Mahon 1998; Gabriel
1992). These species may all be caught as bycatch in the summer flounder trawl fishery
because studies suggest they inhabit the same areas. By understanding the species that
interact and associate with one another, gear modification, restrictions, and regulations
can be placed on the fishery to reduce bycatch of non-target species.
The data provided by fishery-dependent and fishery-independent surveys are
crucial to understanding ecosystem dynamics and community structure. Researchers can

13
use these data to identify bycatch, species assemblages, and species distribution. The
results from these studies allow managers to gain a better understanding of the complex
interactions among all living organisms and begin to manage at an ecosystem level as
they incorporate these biological interactions into management plans. Bycatch
monitoring programs have begun to identify and quantify bycatch in many of the
fisheries around the world; however, monitoring programs have not been established for
all fisheries.
The horseshoe crab trawl survey
In 2001, the Horseshoe Crab Research Center (HCRC) benthic trawl survey was
initiated to monitor horseshoe crab populations along the Atlantic coast (Hata and
Berkson 2003). This trawl survey uses the same gear as in the commercial fishery and
can provide information as to which species could be caught as bycatch in the horseshoe
crab trawl fishery. Species composition data collected during the HCRC trawl survey can
be used to identify species that are susceptible to the commercial trawl gear used in this
fishery. These data also can identify species composition and distribution along the
Atlantic coast. Identifying bycatch species and their distribution provides managers with
information to begin to understand the possible ecosystem-level effects of the horseshoe
crab trawl fishery.
The horseshoe crab fishery
Horseshoe crabs have supported a fishery along the Atlantic coast since the mid-
1800s; however it was only recently that an FMP was developed for this fishery (Walls et

14
al. 2002). To date, there have not been any studies that have attempted to identify or
quantify bycatch in the horseshoe crab trawl fishery. Identifying the species caught as
bycatch allows a better understanding of which non-target species may be affected by the
horseshoe crab trawl fishery.
Horseshoe crabs are considered a multiple-use resource. They are valued by
many stakeholders, including commercial fishers, environmental interest groups, and
biomedical companies (Berkson and Shuster 1999). Horseshoe crabs are commercially
harvested by hand and by fishing gears such as trawl, dredge, and gillnet (HCTC 1998).
Harvested horseshoe crabs are sold as bait for American eel (Anguilla rostrata) and
whelk (Busycotypus spp.) fisheries (ASMFC 1998). Based on estimates from 1999, the
eel and whelk fisheries that rely on horseshoe crabs as bait contribute about $15 million
to local economies and create over 400 jobs (Manion et al. 2000). Besides supporting a
commercial fishery, horseshoe crabs are important to biomedical companies. The
copper-based blood of horseshoe crabs contains a unique clotting agent, called Limulus
Amoebocyte Lysate (LAL). This compound is used to detect pathogenic endotoxins in
injectable drugs or on medical devices (Novitsky 1984; Mikkelsen 1988). Currently, the
biomedical industry is dominated by three U.S. firms that provide a combined total of
$73 to $96 million dollars to their local economies (Manion et al. 2000). Horseshoe
crabs are ecologically important because their eggs serve as a food source to migrating
shorebirds. During spawning season, each female horseshoe crab lays about 4,000 eggs
on intertidal sandy beaches during each nesting trip, resulting in about 88,000 eggs per
female per year (Shuster and Botton 1985; Mikkelsen 1988). Species of birds [e.g., Red
Knots (Calidris canutus), Ruddy Turnstones (Arenaria interpres), Sanderlings (Calidris

15
alba), and Semipalmated Sandpipers (Calidris pusilla)] rely on these eggs to provide
vital energy during the 3,000 – 4,000 mile migration route to breeding grounds (Clark et
al. 1993). Many people gather to witness the masses of horseshoe crabs and shorebirds
on many beaches, creating an ecotourism industry that provides $3 to $4 million a year to
local communities (Manion et al. 2000).
Despite their importance to many users, prior to 1997 the horseshoe crab was not
a managed species. In the fall of 1997, the Atlantic States Marine Fisheries Commission
(ASMFC) developed an FMP to manage horseshoe crabs within state (0-3 nautical miles)
and federal waters (3 or more nautical miles) (ASMFC 1998). Prior to this management
plan, little was known about the status of horseshoe crab populations. This species was
thought to be sensitive to overfishing because it is slow to sexually mature and is easily
harvested with minimum financial investment (ASMFC 1998). However, due to
insufficient information, it was unclear whether overfishing was occurring. New efforts
have been made to provide information for effective management, but many data are still
lacking. The gear used in this fishery is unselective; catching target and non-target
individuals. Therefore, it is important to identify bycatch species to better understand the
effects that the horseshoe crab trawl fishery has on non-target species.
The HCRC at Virginia Tech designed an annual benthic trawl survey to provide
data of horseshoe crab abundance and distribution for future stock assessments (Walls et
al. 2002; Hata and Berkson 2003; Hata and Berkson 2004). This survey could also
identify species that are susceptible to horseshoe crab trawl gear along the Atlantic coast.
Although many fishery-independent trawl surveys have sampled this area, there have not
been any studies that have identified species that commonly associate with horseshoe

16
crabs. Most previous surveys that sample the Atlantic coast use benthic trawl nets that
are equipped with rollers to prevent damage to the sea floor. These data could not be
used to assess horseshoe crab populations because the gear has potential to roll over, and
undersample, buried crabs. Commercial fishers have developed a method for targeting
buried horseshoe crabs; they do not use rollers, instead their nets are modified with heavy
chains along the footrope to dig into the sediment (Hata and Berkson 2003). The
horseshoe crab trawl survey uses the same gear as in the commercial trawl fishery,
thereby providing an efficient and representative method of capture (Hata and Berkson
2003; Hata and Berkson 2004).
The Middle Atlantic Bight
The Middle Atlantic Bight (MAB) includes all shelf and coastal waters in the
North Atlantic Ocean from Nantucket Shoals, USA (east of Cape Cod, Massachusetts) to
Cape Hatteras, North Carolina, USA (Muir et al. 1989; Figure 1.1). The Gulf Stream is
the major current in offshore MAB waters, flowing in a northward-offshore direction.
Storm winds and weather events can move shelf waters over the entire MAB, sometimes
causing currents to shift from an along-shore direction to a toward-shore direction (Chant
et al. 2004). This shift has also been documented to cause upwelling events in some
areas (Song et al. 2001; Chant et al. 2004; Glenn et al. 2004). The U.S. Geological
Survey (USGS) put together a data set of surficial sediment type for the entire Atlantic
Coast (usSEABED, version 1.0; Reid et al. 2005). Based on these data, bottom sediment
composition within the study area is composed mostly of sand.

17
Within the MAB, the waters between Cape May, New Jersey and Montauk, New
York compose the New York Bight (Muir et al. 1989; Figure 1.1). Water movements in
the New York Bight are dominated by local winds and river discharge (Bowman and
Wunderlich 1976). Density structure is dominated by salinity effects in the fall and
winter and by local heating in the spring and summer (Bowman and Wunderlich 1976).
The horseshoe crab trawl survey samples sites within the MAB, specifically
between New York and Virginia. Although horseshoe crabs are found in areas outside of
the MAB (i.e., along the shores of Maine to the Gulf of Mexico: Shuster 1982), the MAB
is the target of the HCRC trawl survey because the largest populations, and therefore the
majority of horseshoe crab harvests, occur in this area (Shuster 1982; ASMFC 1998).
Potential bycatch species
Bycatch is monitored in other trawl fisheries along the MAB [e.g., summer
flounder, black sea bass, scup, squid (Loligo pealei), and butterfish (Peprilus
triacanthus); NOAA 2003], but to date a bycatch monitoring program does not exist for
the horseshoe crab trawl fishery. We would expect the bycatch in the horseshoe crab
trawl fishery to be similar to that caught in other trawl fisheries because the nets fish in
similar ways. However, since the trawl gear used in the commercial horseshoe crab trawl
fishery is designed to efficiently capture horseshoe crabs that are on or within bottom
sediment, it is possible that this gear would also be effective at capturing other benthic
species. Bycatch monitoring programs have been developed for other benthic trawl
fisheries, but many of these fisheries use gears that are equipped with rollers and may not
catch all benthic species.

18
Benthic trawl gear has the potential to capture benthic species such as summer
flounder, winter flounder (Pseudopleuronectes americanus), blue crab (Callinectes
sapidus), and American lobster (Homarus americanus) and demersal species such as
Atlantic croaker (Micropogonias undulatus), black sea bass, scup, spot (Leiostomus
xanthurus), and striped bass (Morone saxatilis). All of these species support commercial
and recreational fisheries along the Atlantic coast. The total removals as bycatch of these
species should be quantified and included in stock assessments for proper management of
these fisheries.
Clearnose skate (Raja eglanteria) and little skate (Leucoraja erinacea) are two
species that are incidentally caught in many commercial and recreational fisheries
(Packer et al. 2003a, 2003b) and have potential to be captured by horseshoe crab trawl
gear. In the past, some skate species have drastically declined because populations were
not monitored or managed [e.g., barndoor skate (Raja laevis): Casey and Myers 1981].
Starting in the 1960s, barndoor skate populations began to decline due to heavy harvest
as bycatch in the groundfish fishery off the coast of New England (Casey and Myers
1981). Populations continued to plummet through the early 1980s, then increased
slightly in the 1990s, but were still only 5% of the peak abundance that occurred in 1963
(Sosebee 2000). This example shows the importance of long-term monitoring for all
species over a large spatial scale (Casey and Myers 1981). It was not until 2003 that the
New England Fishery Management Council developed a management plan for skate
(Sosebee 2006). Prior to this plan, most landings reported were not species-specific,
categorizing about 99% as “unclassified skates” (Packer et al. 2003a, 2003b). Currently,
clearnose and little skate are not considered overfished (Sosebee 2006). The abundance

19
of these species should be carefully watched to ensure that excessive harvest as bycatch is
not affecting population sizes.
There are four sea turtles that are commonly found in the northern and middle
Atlantic off the coast of the United States [i.e., the green sea turtle (Chelonia mydas),
loggerhead sea turtle (Caretta caretta), leatherback sea turtle (Dermochelys coriacea),
and Kemp’s ridley sea turtle (Lepidochelys kempii)], all of which are federally listed
(Alverson et al. 1994). Past studies have shown that fisheries, especially southern shrimp
trawl fisheries, have been a source of mortality for these species of sea turtles (Crowder
and Murawski 1998). The nets used in shrimp trawl fisheries are now equipped with
turtle excluder devices (TEDs), which have been shown to reduce bycatch mortality by
allowing turtles to escape with minimum damage (Crowder and Murawski 1998). In
2001, NOAA Fisheries required all shrimp trawlers in the United States that fished
Atlantic and Gulf of Mexico waters to use TEDs to reduce the bycatch of sea turtles
(NMFS 2001). This ruling does not, however, require TEDs on the trawl nets of vessels
that use a larger mesh size in these waters. Horseshoe crab trawl vessels are currently
allowed to fish waters that are inhabited by sea turtles without using TEDs. If bycatch of
turtle species is occurring in the horseshoe crab trawl fishery, it may be necessary to
require TEDs on these vessels as well.
Sturgeon populations along the Atlantic coast of the United States are also
susceptible to many fishing gears. Atlantic sturgeon (Acipenser oxyrhynchus) are very
sensitive to overfishing because they mature at age 20 and spawn only once every few
years (Bain 1997). This species was harvested for its flesh and caviar until 1998 when a
coastwide moratorium was initiated due to low population sizes (ASMFC 2005a).

20
Despite the moratorium, Atlantic sturgeon are still caught as bycatch in many fisheries
along the Atlantic coast (Stein et al. 2004). Of the coastal states, Virginia, Maryland, and
North Carolina have the highest bycatch rates associated with landings from otter trawl
and gill net fisheries (Stein et al. 2004). Shortnose sturgeon (Acipenser brevirostrum) is
another species that could be caught as bycatch in trawl fisheries along the Atlantic coast.
This species is federally listed as endangered and is greatly affected by excessive harvest
due to late maturation and infrequent spawning (Bain 1997). Although the harvest of
Atlantic and shortnose sturgeon are prohibited, removal as bycatch in trawl fisheries,
combined with the life history characteristics and low population sizes of sturgeon
species, can contribute to the decline of these species.
There are many species found along the MAB that could be susceptible to
horseshoe crab trawl gear. Collecting species composition data at sites sampled during
the horseshoe crab trawl survey will identify species that are susceptible to this specific
type of benthic trawl gear. This will assist managers to understanding some of the
ecosystem-level effects of the horseshoe crab trawl fishery.
Project objectives
The purpose of this study was to collect data that will assist managers in working
toward an ecosystem-level approach to managing the horseshoe crab fishery. The main
objective was to identify the non-target species that may be negatively affected by the
horseshoe crab trawl fishery. To do this, data were collected and analyzed to:
1. identify species that are susceptible to horseshoe crab trawl gear within the study area,
2. compare species composition and distribution among sites within the study area, and

21
3. identify the abiotic (geographical and environmental) factors that contribute to differences in species composition and distribution.
A secondary purpose of this study was to test the methods currently used by state
agencies to convert landing data from numbers of crabs to pounds of crabs. I also
developed a model to predict the weight of a horseshoe crab based on a measured
prosomal width in order to determine if this method would provide a more accurate
estimation of weight than the current conversion factors do.
Conclusion
Horseshoe crabs are important to many stakeholders. This species supports
commercial fisheries along the Atlantic coast, is used by biomedical companies to
improve human health, and provides vital nutrients to migrating shorebirds. Over the
past ten years, strides have been made to improve the management of horseshoe crabs.
An FMP was developed for this species and numerous research projects have been
initiated to provide crucial information about this species. However, to date, the species
that are commonly caught as bycatch in the horseshoe crab trawl fishery have not been
identified. A benthic trawl survey was developed to collect data on horseshoe crab
populations along the Atlantic coast. I collected species composition data aboard the
horseshoe crab trawl survey and used these data to identify non-target species that are
susceptible to the gear used in the commercial fishery. I also used these data to identify
the distribution of these species. These results from my study identify non-target species
that may be affected by the horseshoe crab trawl fishery and assist managers in
understanding some of the potential effects that this fishery may have at an ecosystem-
level.

22
Cape Hatteras, NC
Cape Cod, MA
Middle
Atlanti
c Bigh
t (MAB)
Montauck, NY
Cape May, NJ
New York Bight
CTNY
NJ
DE
VA
NC
MD
Cape Hatteras, NC
Cape Cod, MA
Middle
Atlanti
c Bigh
t (MAB)
Montauck, NY
Cape May, NJ
New York Bight
CTNY
NJ
DE
VA
NC
MD
Atlantic Ocean
Cape Hatteras, NC
Cape Cod, MA
Middle
Atlanti
c Bigh
t (MAB)
Montauck, NY
Cape May, NJ
New York Bight
CTNY
NJ
DE
VA
NC
MD
Cape Hatteras, NC
Cape Cod, MA
Middle
Atlanti
c Bigh
t (MAB)
Montauck, NY
Cape May, NJ
New York Bight
CTNY
NJ
DE
VA
NC
MD
Atlantic Ocean
Figure 1.1. A horseshoe crab trawl survey sites along the Middle Atlantic Bight (MAB). The MAB extends from Georges Bank (offshore of Cape Cod, Massachusetts) to Cape Hatteras, North Carolina. The New York Bight is included within the MAB, extending from Montauk, New York to Cape May, New Jersey.

23
Chapter 2.
Identifying species composition and distribution of bycatch associated with a
horseshoe crab (Limulus polyphemus) trawl survey along the Middle Atlantic Bight USA.
Abstract
Horseshoe crabs (Limulus polyphemus) have been harvested along the east coast
of the United States since the 1800s, however a Fishery Management Plan (FMP) was
only recently created for this species. To date, there have not been any studies that have
attempted to identify or quantify bycatch in the horseshoe crab trawl fishery. A
horseshoe crab trawl survey was started in 2001 to collect data on the relative abundance,
distribution, and population demographics of horseshoe crabs along the Atlantic coast of
the United States. Species composition data were collected at sites sampled by the
horseshoe crab trawl survey in 2005 and 2006. Seventy-six different taxa were caught
and identified. These species are susceptible to the trawl gear and may have potential to
be caught as bycatch in the horseshoe crab trawl fishery. Non-metric multidimensional
scaling (NMS) was used to cluster sites and identify the spatial distribution of taxa. Sites
strongly clustered into distinct groups, suggesting that species composition shifts between
northern and southern sites. Location and bottom water temperature explain most of the
variation of species composition among sites. These results identify species that are
susceptible to the gear used in the horseshoe crab trawl fishery and describe the
distribution of these species during fall months throughout the study area. They also
provide researchers with a better understanding of which non-target populations may be
affected by the horseshoe crab trawl fishery. Identifying non-target species is a first step
24
in beginning to understand the effects that the horseshoe crab trawl fishery may have at
the ecosystem level.
Introduction
Traditionally, marine fisheries have been managed using a single-species
approach. This type of management is not always appropriate because it ignores the
direct and indirect effects that harvesting a target species may have at the ecosystem level
(Botsford et al. 1997; Pikitch et al. 2004), and the possible effects of distant ecosystem
components on the target species itself. Oftentimes the harvest of one species can affect
habitat characteristics, predator and prey relationships, and other ecosystem components
(Pikitch et al. 2004). Today, managers are adapting a more holistic approach to
management. The overall objective of ecosystem-based fisheries management is to not
only sustain fisheries, but also to sustain healthy ecosystems to support fisheries (Pikitch
et al. 2004). To do this, researchers, managers, and politicians must work to understand
the abiotic and biotic interactions between fisheries and the ecosystem, and incorporate
these interactions into management plans. Some of the most important aspects of
ecosystem management are managing ecosystems to avoid the degradation, minimizing
the risk of irreversible changes to natural species assemblages and processes of the
ecosystem, obtaining and maintaining long-term socioeconomic benefits, and generating
knowledge of ecosystem processes to better understand the consequences of
anthropogenic effects (Pikitch et al. 2004).
In the late 1990s, The National Marine Fisheries Service (NOAA Fisheries)
encouraged each Fishery Management Council to develop a Fisheries Ecosystem Plan

25
(FEP) for all major ecosystems within their regions, describing interactions among
physical, biological, and human components of the ecosystem (NMFS 1999). One step in
developing an FEP is to calculate the total removals within each fishery. This
measurement includes all target and non-target species, whether the individuals are
landed or caught and released (NMFS 1999). Intense removal of target and non-target
individuals can impact communities and the ecosystem by altering population abundance,
changing predator and prey relationships, and competitive interactions (Alverson et al.
1994; Kennelly 1995; Crowder and Murawski 1998). NMFS suggests that FEPs should
list all species that are susceptible to incidental mortality within each fishery and describe
the spatial and temporal distribution of these species (NMFS 1999).
Horseshoe crabs (Limulus polyphemus) have supported a commercial fishery
along the Atlantic coast since the mid-1800s (Shuster and Botton 1985). Fishers harvest
horseshoe crabs for use as bait for American eel (Anguilla rostrata) and whelk
(Busycotypus spp.) fisheries (ASMFC 1998). Additionally, horseshoe crabs are harvested
for biomedical companies, which use a clotting agent found in horseshoe crab blood
(LAL, Limulus Amoebocyte Lystate) to test for pathogenic endotoxins on medical
devices (ASMFC 1998). In the 1990s, fishing effort increased, some local populations of
horseshoe crabs began to decline, and many stakeholders became concerned that the
fishery was being overexploited (ASMFC 1998). In 1998, an FMP was developed to
provide consistent management and regulation for the horseshoe crab fishery (ASMFC
1998). Managers believed a coordinated management strategy along the Atlantic coast
could preserve the viability of this resource (ASMFC 1998). However, the data needed
for proper management of the stock were lacking (Berkson and Shuster 1999).

26
In 2001, a benthic trawl survey was initiated by the Horseshoe Crab Research
Center (HCRC) at Virginia Tech to collect data on the abundance, distribution, and
population demographics of horseshoe crabs along the Atlantic coast of the United States.
Although many fishery-independent trawl surveys had sampled this area, most were
inefficient in sampling gear or design (ASMFC 1998). For example, the National Marine
Fisheries Service (NMFS) has been conducting annual fall and spring surveys along the
middle and northern Atlantic coast of the United States since the 1960s, using benthic
trawl nets that are equipped with rollers (Reid et al. 1999). Data from these surveys are
not appropriate for determining the status of horseshoe crab populations because the gear
has the potential to roll over, and thus undersample, buried crabs. Commercial fishers
have developed a method for targeting buried horseshoe crabs. Instead of using rollers,
commercial fishing nets are modified with heavy chains along the footrope of the trawl to
dig into the sediment (Hata and Berkson 2003). The horseshoe crab trawl survey,
developed by the HCRC, uses the same gear deployed in the commercial trawl fishery.
I collected species composition data and environmental data during the HCRC
trawl survey in the fall season of 2005 and 2006. NOAA Fisheries suggests that
managers identify species that are caught as bycatch in each fishery and show how
bycatch changes spatially and temporally (NMFS 1999). The data collected during these
surveys will assist FEP development for this region. I have created a list of species that
are susceptible to commercial horseshoe crab trawl gear and have the potential to be
caught as bycatch in the fishery. My results also identify the spatial and seasonal changes
of species composition throughout the study area and the environmental variables
influence these changes.

27
Methods
Data collection
I conducted my sampling throughout the Middle Atlantic Bight, from the eastern
tip of Long Island, New York, USA (approximately 71 50’W and 41 04’N) to the
southern tip of the Delmarva Peninsula, Virginia, USA (approximately 75 55’W, and 37
05’N) (Figure 2.1). I sampled sites that were randomly selected using a stratified
sampling approach based on the methods of Hata and Berkson (2004). Sites between
Atlantic City, New Jersey (approximately 74 5’W and 39 20’N) and the southern tip of
the Delmarva Peninsula, Virginia were randomly selected based on the site’s distance
from shore (inshore and offshore) and bottom topography (trough and non-trough). Sites
within state waters (0 – 3 nautical miles) were defined as inshore sites, and those within
federal waters (3 – 12 nautical miles) were defined as offshore sites. Troughs were
defined as areas where bottom depressions were at least 2.4 m deep, no more than 1.8 km
wide, and more than 1.8 km long. All other sites were defined as non-trough. Sites north
of Atlantic City, New Jersey were randomly selected based on their distance from shore.
Sites were also designated as northern or southern sites. All sites sampled north of
Atlantic City, New Jersey were classified as northern sites and all sites sampled south of
Atlantic City, New Jersey were classified as southern sites.
Commercial stern trawlers sampled each site using a flounder trawl net with
modified ground gear: a Texas sweep that consisted of a chain line instead of a footrope
(Hata and Berkson 2003; 2004). This type of net is commonly used in the commercial

28
horseshoe crab trawl fishery (Hata and Berkson 2003). Each site was towed for 15 min at
a speed of 4.6 to 5.6 km/h.
I sampled 156 sites during two fall seasons (September – November): 73 sites in
2005 and 83 sites in 2006 (Figure 2.1). I recorded the time, depth, and geographic
coordinates (latitude/longitude) at the start and end of each tow. Bottom water
temperature and bottom salinity were measured at the beginning of each tow. After the
net had been towed for 15 min, I identified and sorted the catch. Jellyfish and sea
anemones (Phylum Cnidaria) were classified to the lowest identifiable group. I identified
all other taxa to the species level, except little and winter skates (Leucoraja spp.),
bullnose and southern eagle rays (Myliobatis spp.), seastars (Asterias spp. and
Astropecten spp.), moon snails (Lunatia spp.), hermit crabs (Pagurus spp.), and spider
crabs (Libinia spp.), which were grouped by genus. The total count and biomass (to the
nearest 0.01 kg) were recorded for all taxa. For large catches, I used a haphazard method
to collect a subsample of all taxa that were in high abundance. I weighed the subsample
and counted the remaining individuals not included in the subsample. I estimated the
total weight of the counted individuals based on the weight of the subsample, and
summed these values to calculate the total weight for the subsampled taxa. Because
some fishes were too large to be weighed, I estimated the mass. I used the body length to
estimate their weight using published length-weight relationships (Franks et al 1998;
NMFS 2003). I used prosomal-width-to-crab-weight relationships to estimate the total
biomass of horseshoe crabs from each tow based on sex and maturity stage (Chapter 3,
this thesis). For each trawl, I measured the total length (to the nearest 1 mm) for all or a

29
subsample of at least 15 individuals of most taxa. I also recorded the weight of each
individual when time was available.
Data analysis
Descriptive analysis
For each survey, I calculated total count and biomass, percent occurrence, and
percent total catch for each taxa. The distance towed (km) was calculated using the
beginning and ending coordinates for each sites. I used the distance towed at each site to
calculate the catch per unit effort (CPUE) for the count (number of individuals/km) and
biomass (kg/km) of each taxa for 2005 and 2006.
Community analysis
I analyzed CPUE of count and biomass data for sites sampled in 2005, 2006, and
both years combined. I normalized these data using a log transformation and removed
rare species (i.e., those present in less than 5% of tows) from the data set (Gomes et al.
1992; Mahon et al. 1998; McCune and Grace 2002; Sousa et al. 2005). I used non-metric
multidimensional scaling (NMS; PC-ORD version 5) to group sites based on similarity of
species composition and local abundance. NMS, an ordination method that ranks
samples based their on similarities and is considered the most generally effective of all
ordination methods (McCune and Grace 2002). Many studies have used similar methods
to identify fish assemblages in marine and estuarine systems (Greenstreet et al. 1999;
Able et al. 2001; Beentjes et al. 2002; Layman 2000; Massuti and Moranta 2003; Fock et
al. 2004; Stergiou et al. 2006). The main advantages of NMS are that this method does
not assume a linear relationship among variables, works well with data sets that contain

30
many zeroes because distance measures are rank transformed, and allows the use of any
distance measure (McCune and Grace 2002). I used a Bray-Curtis distance measure to
calculate the dissimilarity between sites. The Bray-Curtis distance measure is often used
in community analyses because it not affected by zeroes and weights more abundant
species more heavily than less abundant species (Bray and Curtis 1957; McCune and
Mefford 2006). NMS provided a stress value for each ordination plot which measures
the departure from monotonicity in the plot of dissimilarity among points in original
space compared to the distance among points in ordination space (McCune and Grace
2002). The closer the plot in ordination space fits the original data, the better the fit and
the lower the stress (McCune and Grace 2002). According to Clarke (1993) an
ordination plot with a stress value less than 0.20 provides an accurate representation of
the data.
Community analysis: influence of abiotic factors
To determine whether bottom sediment type contributed to the change in species
composition throughout the study area, I used a data set from the United States
Geological Service (USGS, usSEABED, version 1.0; Reid et al. 2005) to estimate the
bottom composition (percent clay, mud, sand, and gravel) at each site trawled (Reid et al.
2005). I used Geographic Information System (GIS; ArcMap, version 9.1) to interpolate
point data in the usSEABED database and estimate bottom composition at each of the
sites towed. I used a cross-validation method to determine which interpolation method
was best for this data set. I randomly selected 10% of points from the original data set
and removed them from interpolation (n = 4271). I used the remaining 90% to
interpolate bottom type throughout the study area using 1000 meter plots (n = 41557).

31
Each interpolation method was cross-validated by comparing the estimated values of
bottom composition to the observed values. I determined that inverse distance weighting
(IDW) provided the closest estimates of bottom type for the USGS data set within the
study area and then used all data points to determine across-site estimates of bottom type.
I used PC-ORD (version 5) to incorporate abiotic factors, including bottom
temperature, bottom salinity, depth, and bottom composition, in each of the final NMS
solutions. The direction and length of each resulting vector indicated how strongly a
variable was correlated with a group of sites. An R2 value was calculated for each abiotic
factor, indicating the amount of variation explained along each NMS axis.
I also used PC-ORD (version 5) to perform Multi-Response Permutation
Procedures (MRPP) to determine if changes in species composition were due to location
(north or south of Atlantic City, New Jersey ), distance from shore (inshore or offshore),
or time of tow (day or night). MRPP output provided a p-value to indicate statistical
significance, however with a large sample size, statistical significance can occur even if
the groups being tested do not have a large effect on species composition (McCune and
Grace 2002). To determine whether groupings had an effect on species composition, a
chance-corrected within-group agreement index, A, was given to describe the
homogeneity of species composition within groups compared to what is expected at
random (McCune and Grace 2002). When A = 1, all items are identical within the groups
and when A = 0, all items within the groups are the same as expected by chance. A fairly
high A-value (A > 0.30) is usually associated with an ecologically significant difference
between the groups (McCune and Grace 2002).

32
Community analysis: species composition
Differences in species composition among sites were identified using PC-ORD
(version 5). I overlaid the main matrix which displays the relative abundance of species
at each site on the plot in ordination space. This also allowed me to identify the species
that were abundant at each group of sites.
Results
Descriptive analysis
In 2005 and 2006, distances of 88.66 km and 104.95 km were trawled,
respectively. Over both years, 46,415 individuals from seventy-six different taxa were
caught (n = 60 in 2005, n = 69 in 2006), including 47 finfish species from 33 families
(Table 2.1). Skates comprised more than half of the total biomass and horseshoe crabs
comprised one-third of the total biomass caught during each year surveyed (Figure 2.2).
CPUE (kg/km) was highest for little (Leucoraja erinacea) and winter (Leucoraja
ocellata) skate, horseshoe crab, and clearnose skate (Raja eglanteria) (Table 2.1).
Clearnose skate, horseshoe crab, summer flounder (Paralichthys dentatus), spider crab,
and windowpane flounder (Scophthalmus aquosus) were caught throughout the entire
survey area and were present in over half of tows (Table 2.2; Figure 2.3). Horseshoe
crabs were found at sites throughout the study area, but were more abundant at southern
sites (Figure 2.4).
Community analysis
NMS for count (number of individuals/km) and biomass (kg/km) data for 2005,
2006, and both years combined resulted in two well-supported groups of sites based on

33
species presence and abundance. These two groups were consistent throughout analyses:
one group was comprised of all southern sites (sites south of Atlantic City, New Jersey)
and the other group of mostly northern (sites north of Atlantic City, New Jersey) sites.
NMS of biomass data collected in 2005 and 2006 both resulted in 2-dimensional
solutions with stress values of 0.14 in 2005 and 0.15 in 2006 (Figure 2.5; Figure 2.6).
NMS of biomass data from both years combined resulted in a 3-dimensional solution
with a stress value of 0.11 (Figure 2.7). When the sites sampled in 2005 and 2006 were
combined for analyses, three subgroups were formed within the larger group consisting
of mostly northern sites. These subgroups consisted of an intermediate subgroup,
comprised of northern and southern groups; a subgroup consisting of all northern sites;
and a subgroups consisting of all deep water, northern sites (Figure 2.7).
Community analysis: influence of abiotic factors
Species composition varied with location, specifically whether a site was located
south or north of Atlantic City, New Jersey. The difference in species composition due to
location is evident from the NMS ordination plots in which most southern and northern
sites grouped separately. MRPP results indicated that the grouping of north versus south
was statistically and ecologically significant for all data sets, with A-values ranging from
0.28 to 0.37 (Table 2.3).
Bottom temperature and salinity explained most of the observed variation in the
differences in species composition of sites sampled in 2005 and both years combined
(Table 2.4, Figure 2.5, Figure 2.7). These abiotic factors were inversely correlated;
higher bottom temperatures were more common at southern sites and higher bottom

34
salinities at northern sites. Bottom temperature and salinity did not explain much of the
variation in species composition among sites sampled in 2006 (Table 2.4; Figure 2.6).
Depth explained the most variation in species composition among sites sampled
in 2006 (R2 = 0.51; Table 2.4). Other factors, including depth, distance from shore, time
that a site was sampled, and bottom type, did not greatly contribute to the predicted
clustering of sites sampled in 2005, 2006, or when all data were combined (Table 2.4).
Community analysis: species composition
Species presence and abundance differed between the group comprised of
southern sites and the group comprised of mostly northern sites (Table 2.1, Table 2.2).
The differences in species composition between northern and southern sites seemed to be
driven by the distribution of southern species; many southern species were not found at
any northern sites. Many northern species were found at various sites throughout the
study area, but were more abundant at northern sites.
Species composition differed among the three subgroups within the larger group
comprised of mostly northern sites. The first subgroup was comprised of northern and
southern sites (“Intermediate” subgroup, Figure 2.7). All of the southern sites within this
subgroup were sampled in November and had colder bottom temperatures. The species
composition at these sites was very different than at southern sites that were sampled
earlier in the fall. Most species that were common to southern sites were not found at
southern sites that were sampled in November. Channeled (Busycotypus canaliculatus)
and knobbed (Busycon carica) whelks were found at all southern sites independent of
bottom temperature. Migrating species were also found at the southern sites sampled in

35
November, including little skate, winter skate, bluefish (Pomatomus saltatrix), striped
bass (Morone saxatilis), and spiny dogfish (Squalus acanthias).
The species composition of northern sites sampled in deeper, offshore waters
differed slightly from most northern sites (“Deep” subgroup, Figure 2.7). Deep-sea
scallop (Placopecten magellanicus) and jonah crab (Cancer borealis) were more
abundant at deep water sites than at other sites.
Lastly, some species were common throughout the study area, independent of
location (Table 2.1, Table 2.2). These species included clearnose skate, hermit crab, and
windowpane flounder, sea star (Asterias spp.), spider crab, and summer flounder.
Clearnose skate and horseshoe crabs were more abundant at southern sites and
windowpane flounder and hermit crab at northern sites.
Discussion
Descriptive analysis
The gear used during this survey was effective at targeting horseshoe crabs and
also at catching many non-target organisms. The majority of the species caught during
the surveys were benthic fishes or invertebrates that live or feed on the bottom (Table
2.1). However, catch was not limited to benthic organisms. Since the benthic trawl net
also fishes the a few meters of the water column, many demersal fishes were caught
during the survey (Table 2.1).
Community analysis
NMS for all data sets resulted in two distinct groups of sites based on differences
in species composition. I can be confident the ordination plots of each of these analyses

36
are accurate based on their corresponding stress value. The stress values for each final
solution of NMS were relatively low, ranging from 0.11 to 0.15. All of these stress
values are less than 0.20, and therefore the ordination plots provide a useful interpretation
of the data (Clarke 1993). The values I have reported are also within the range of stress
values from previous published studies (Greenstreet et al. 1999; Layman 2000; Massuti
and Moranta 2003; Stergiou et al. 2006).
Community analysis: influence of abiotic factors
Based on my results, the clustering of sites due to changes in species presence and
abundance was mainly correlated with two factors: latitudinal location and bottom
temperature. The shift in species composition due to location can be explained by the
latitudinal distribution of species along the Middle Atlantic Bight. Most species found at
southern sites were not found at any northern sites during fall months [e.g., knobbed
whelk, channeled whelk, southern stingray (Dasyatis americanus), bullnose ray
(Myliobatis freminvillei), and southern eagle ray (Myliobatis goodei); Figure 2.8].
Species more common to southern sites, such as Atlantic croaker (Micropogonias
undulatus, ASMFC 2005b) and spot (Leiostomus xanthurus, ASMFC 1987) have a
distribution that is centered at the southern portion of the study area. Other species were
more common to northern sites including little skate (Packer et al. 2003a), spiny dogfish
(McMillan and Morse 1999), and winter flounder (Pseudopleuronectes americanus,
Pereira et al. 1999) and have distributions that are centered in northern portion of the
study area during fall months (Figure 2.9).
Another explanation for the shift in species composition between northern and
southern sites may be the wind-driven upwelling events that occur along the inner shelf

37
off New Jersey (Munchow and Chant 2000; Chant et al. 2004). During summer months,
water on the shelf becomes strongly stratified, with surface temperatures becoming much
warmer than bottom temperatures (Chant et al. 2004). Southwesterly winds, driven by
the Bermuda High, begin to move up the coast, counteracting the northeasterly water
currents (Chant et al. 2004). Waters begin to flow offshore and cold, bottom water is
pulled to the surface by advection (Munchow and Chant 2000). This flow reversal has
been documented many times in the past, but only during summer months. However, this
upwelling process could affect the shift in species composition between northern and
southern sites by affecting the transport of larvae (Norcross and Shaw 1984; Cowen et al.
1993).
Differences in species composition also were correlated with bottom water
temperature. Most species common to southern waters can only tolerate warmer
temperatures [e.g., Atlantic croaker: Miglarese et al. 1982; striped burrfish
(Chilomycterus schoepfii): Holmquist 1997] and are less likely to be found in northern
waters during fall months. Species common to northern waters (e.g., little skate: Packer
et al. 2003a; winter flounder: Perceira 1999) are able to tolerate cooler temperatures and
persist in these areas when water temperatures drop. Other species can tolerate a wide
range of temperatures (e.g., horseshoe crab: Shuster 1979, 1982; summer flounder:
Packer et al. 1999; and windowpane flounder: Chang et al. 1999) and are common
throughout the entire survey area independent of bottom temperature.
Other abiotic factors did not strongly explain the variation in species composition
among sites. Changes in species composition were statistically significant, but not
ecologically significant (A < 0.30; Table 2.3), due to distance from shore (inshore or

38
offshore). This is not surprising since inshore and offshore sites had very similar
characteristics. At most, offshore sites were 12 nautical miles from the shore and did not
change much in depth or temperature from inshore sites. Changes in species composition
also were not ecologically significant based on the time that a site was sampled (day or
night). Research has shown that some species, such as little skate, are more active at
night and remained buried in depressions during the day (Packer et al. 2003a). However,
during the survey, little skate were caught at large numbers independent of time of day.
It is possible that the heavy chains on the trawling gear allowed us to catch individuals
that were buried in sediment, reducing variation between day and night sampling.
Bottom type did not contribute largely to the grouping of sites, although research has
shown that species are associated with certain bottom types and grain sizes (Methratta
and Link 2006). This is probably because the categories lacked fine-scale characteristics
of bottom type, resulting in very similar estimates of bottom type throughout the study
area (Figure 2.10). If more variables were included in my analyses, such as grain size
and benthic structure, I would predict that bottom type would have explained more
variance in the grouping of sites.
Community analysis: species composition
Species presence and abundance were explained by the latitudinal distribution and
preferred temperature of species found throughout the study area. Many species were
only found at southern sites when bottom temperatures were between 19o and 24.5oC
(Table 2.1, Table 2.2). These species were not found at sites of cooler temperatures (i.e.,
northern sites or southern sites that were sampled in November), suggesting that these
species prefer warmer water temperatures. Atlantic croaker, spot, and southern kingfish

39
(Menticirrhus americanus) were common to southern sites. Spot and southern kingfish
are commonly found within southern waters (Wenner and Sedbury 1989). Research has
shown that Atlantic croaker are common to water temperatures between 9oC and 31oC,
but most abundant at temperatures above 24oC (Miglarese et al. 1982).
Within the larger group that was comprised of mostly northern sites, species
composition varied among subgroups of sites. One subgroup was comprised of northern
and southern sites (“Intermediate” subgroup; Figure 2.7). All of the southern sites that
joined this subgroup were sampled in November. The bottom temperatures at these
southern sites (13 - 15oC) were very similar to most northern sites (14.5 - 19oC). Due to
the colder water temperatures, fewer southern species were found at these sites. Atlantic
croaker numbers were lower at southern sites sampled in November than southern sites
sampled early in the fall, probably because this species had migrated to warmer, southern
waters (Miglarese et al. 1982; ASMFC 2005b). Other southern species [e.g., bullnose
ray, smooth butterfly ray, southern stingray, southern eagle ray, southern kingfish
(Menticirrhus americanus), and spiny butterfly ray (Gymnura altavela)] were not found
at any southern sites sampled in November, most likely because these species prefer
warmer water temperatures.
Less mobile species, such as channeled and knobbed whelk, were found at the
southern sites independent of bottom temperature. Whelks are found throughout the
study area, but are most abundant in the southern region of the survey area, south of New
Jersey (Gosner 1978). It seems that these species can tolerate cool, winter temperatures
at southern sites because they did not migrate as water temperatures dropped. Some
research has shown that whelks move along intertidal and subtidal flats, but do not
40
migrate long distances (Walker 1988). When water temperatures drop, whelks bury
themselves instead of migrating (Walker 1988). This may explain why channeled and
knobbed whelks were found at southern sites even in November when temperatures had
dropped.
Species composition at southern sites sampled in November was very similar to
the species composition at most northern sites. This suggests that many of these species
had migrated, moving from northern sites to southern sites as water temperatures drop.
Studies have shown that bluefish (Shepherd and Packer 2006), striped bass (ASMFC
1981), and spiny dogfish (Bigelow and Schroeder 1948) migrate in a southern direction
in the winter as water temperature changes.
Many species that were found at northern sites can tolerate, but are not restricted
to, cooler northern waters during fall months. All northern sites were sampled when
bottom temperature ranged from 14.5o to 19oC. Past surveys and studies have shown that
winter flounder (Perceira et al. 1999), spiny dogfish (Bigelow and Schroeder 1948), little
skate (Packer et al. 2003a), smooth dogfish (Mustelus canis; Compagno 1984), and black
sea bass (Centopristis striata; Drohan et al. 2007) are all common to temperatures
between 6 and 15oC. Rock crabs (Cancer spp.) have a wide distribution throughout the
Mid-Atlantic bight and are commonly found at temperatures of 8oC to 18oC during fall
months (Stehlik et al. 1991). Hermit crabs are also common throughout the Atlantic
coast (Gosner 1978) within an optimal temperature from 15oC to 17oC (Young 1991).
Changes in species composition were also found at northern sites sampled in deep
waters, when temperatures ranged from 16oC to 18oC. Northern species at these sites
included spiny (Bigelow and Schroeder 1948) and smooth dogfish (Bigelow and

41
Schroeder 1948), rock crab (Stehlik et al. 1991), little skate (Packer et al. 2003a), and
winter flounder (Perceira 2004), all which can tolerate cooler water temperatures. Some
of these species are also common to deeper waters. Spiny dogfish also have been
documented to move offshore during winter months (Bigelow and Schroeder 1953;
Colvocoresses and Musick 1980). Deep sea-scallops are commonly found in deep waters
(10 to 20 meters) along the middle Atlantic coast (Stewart and Arnold 1994). Jonah
crabs are typically found at temperatures of 3oC to 23oC, migrating to offshore zones of
the Mid-Atlantic Bight during winter months (Stehlik et al. 1991).
Finally, there were many species that were found throughout the entire study area
(e.g., clearnose skate, horseshoe crab, summer flounder, and windowpane flounder).
These species are common throughout the Middle Atlantic Bight and can tolerate a wide
range of bottom temperatures. Studies have shown that clearnose skate are most
commonly caught at bottom temperatures between 18oC and 22oC, but have been found
at temperatures as low as 10oC (Packer et al. 2003b). Surveys have consistently caught
most adult summer flounder at temperatures between 9oC and 26oC (Packer et al. 1999)
and adult windowpane flounder at temperatures between 12oC and 18oC (Chang et al.
1999). Horseshoe crabs are considered ecologic generalists that can live in a wide range
of environmental conditions (ASMFC 1998). This species is found along the Atlantic
coast and is capable of surviving temperatures from below 0oC to 41oC (Shuster 1979,
1982). These species can tolerate a wide range of temperatures, allowing them to live
throughout the study area during all months.

42
Species assemblages
Many studies have analyzed NMFS fall trawl survey data to identify species
assemblages along the Middle Atlantic Bight (Colvocoresses and Musick 1984; Phoel
1985; Gabriel 1992; Mahon et al. 1998). Species assemblages that included horseshoe
crabs were not identified during these studies because data were collected using benthic
trawl nets equipped with rollers, a type of gear that has potential to under-sample
horseshoe crabs. The results from these studies, however, could be used to compare the
co-occurrences of benthic and demersal species. During the horseshoe crab trawl survey,
winter flounder, little skate, and spiny dogfish were common at northern sites. These co-
occurrences are similar to results reported by Colvocoresses and Musick (1984), Phoel
(1985), and Mahon (1998). Smooth dogfish, summer flounder, and windowpane
flounder also commonly co-occurred throughout the study area, a result that is similar to
past studies (Colvocoresses and Musick 1984; Phoel 1985; Gabriel 1992; Mahon 1998).
Data collected from the HCRC trawl survey could not be used to identify species
assemblages due to the short time span of the study. Studies that persist over long
periods of time are more appropriate for determining species assemblages because the
chance of incidental co-occurrence is reduced (Tyler et al. 1982; Gomes et al. 2001).
With only two years of data, I could not determine whether species co-occurred by
chance alone. I did, however, identify species that were commonly caught with
horseshoe crab throughout the survey area. Horseshoe crab were commonly caught with
knobbed and channeled whelks, clearnose skate, southern stingray, spider crab, and
summer flounder at southern sites; and clearnose skate, hermit crabs, little and winter
skates, spider crab, windowpane flounder, striped searobin (Prionotus evolans), and

43
summer flounder at northern sites. This does not necessarily mean that these species
compose an assemblage; all of these species may have just been very abundant
throughout the study area. Over both years, horseshoe crabs were caught at only 32 out
of 156 sites. To understand whether these species do commonly occur with horseshoe
crabs, more sites where horseshoe crabs are not present must be sampled and data should
be collected over numerous years. This will give us a better understanding of whether
these species are commonly associated with horseshoe crabs.
Management Implications
In recent years, managers have been working toward an ecosystem-level of
management; developing FEPs to incorporate interactions among physical, biological,
and human components of the ecosystem into fisheries management plans (Botsford et al.
1997). One objective in developing FEPs is to calculate the total removal of target and
non-target species in each fishery. NOAA Fisheries suggests that to achieve this
objective, managers must identify a list of species that are caught as bycatch in each
fishery and show how bycatch changes spatially and temporally (NMFS 1999).
My study identified 76 taxa that are susceptible to the trawl gear that is used in the
commercial horseshoe crab trawl fishery. Based on life history characteristics,
conservation status, and current management strategies it seems that some species may be
more heavily affected by removal as bycatch in the horseshoe crab trawl fishery than
others (Table 2.5). By examining these categories, we can prioritize the species
susceptible to the trawl gear used in the horseshoe crab fishery and give managers a
better understanding of which species may be in need of the most protection.

44
Based on this study, it seems that skates have the highest potential to be caught as
bycatch in the horseshoe crab trawl fishery. Skates comprised over half of the biomass
during both sampling years, and clearnose, little, and winter skates had high CPUE
values. Clearnose, little, and winter skates also have low population doubling times (4.5
– 14 years, Table 2.5; Fishbase 2007) suggesting that the populations of these species
may be affected by high removal as bycatch. The commercial harvest of skate species is
currently monitored and managed by the New England Fishery Management Council
(NEFSC 2007). Clearnose and little skate populations are not considered to be
overfished (NEFSC 2007); however overfishing is occurring on winter skate populations
(NEFSC 2007). Therefore, it is essential that the bycatch of skates within this fishery be
quantified and included in management plans.
Many other managed species, such as summer flounder and spiny dogfish, were
also commonly caught throughout the study area (Table 2.1; Table 2.2). Summer
flounder currently support a large fishery along the Atlantic coast (Packer et al. 1999).
Although this fishery is not currently overfished, overfishing is occurring (ASMFC
2006a). By quantifying bycatch in the horseshoe crab trawl fishery, managers can
include total removals in stock assessments for summer flounder.
Spiny dogfish were also identified as susceptible to horseshoe crab trawl gear,
although they were not caught in high abundance throughout the study area (Table 2.5).
This species is of concern because it is currently listed on the IUCN (The World
Conservation Union) Red List as vulnerable, which is defined as facing a high risk of
extinction in the wild (IUCN 2006). Spiny dogfish also have a very low population
doubling time (>14 years, Table 2.5; Fishbase 2007), suggesting that populations may not

45
be quick to recover when individuals are removed. Although spiny dogfish are currently
listed on the IUCN Red List, this species is still fished along the eastern coast of the
United States (NEFSC 2007) and the stock is not considered to be overfished (NEFSC
2007).
Many protected species, including Atlantic angel shark (Squatina dumeril),
Atlantic sturgeon (Acipenser oxyrinchus), and dusky shark (Carcharhinus obscurus), also
were identified as susceptible to horseshoe crab fishery trawl gear. Harvest of these
species is currently restricted within United States waters (Fishbase 2007; NEFSC 2007).
Atlantic sturgeon and dusky shark are listed as near threatened on the IUCN Red List
(IUCN 2006). Atlantic angel shark is not currently listed on the IUCN Red List because
not enough data are available to properly access the status of this species IUCN 2006).
All of these species have low population sizes and life history characteristics that do not
allow quick recovery of populations when individuals are removed (Fishbase 2007;
NEFSC 2007; Table 2.5). Therefore, it is important to quantify the number of individuals
being removed as bycatch in the horseshoe crab trawl fishery.
Lastly, there were many species that were caught during the horseshoe crab trawl
survey that are not protected or managed within U.S. waters, including smooth dogfish,
cownose ray (Rhinoptera bonasus), and southern stingray. Smooth dogfish, for example,
is commercially and recreationally fished in U.S. waters (Fishbase 2007), but is not
currently managed. The same is true for cownose ray, although no directed fishery exists
in the U.S. (Fishbase 2007). Both of these species have low population doubling sizes
and are listed as near threatened on the IUCN Red List (Fishbase 2007; IUCN 2006;
Table 2.5). Lastly, southern stingray is commercially harvested and has a very low

46
population doubling size (Table 2.5; Fishbase 2007). This species is not currently listed
on the IUCN Red List because the data is lacking to properly assess its population status
(IUCN 2006).
Overall, it seems some of the species identified as susceptible to horseshoe crab
trawl gear may be more vulnerable than others. A small number of species caught during
this survey have life history characteristics or low population sizes that suggest
populations will not be quick to rebound. Other species are already listed as near
threatened or protected by management regulations. Managers may want to focus
conservation actions on these species instead of other populations that seem to be
relatively stable, currently managed, and considered not to be overfished.
This study also provides data on the spatial and temporal distribution of the
species that are susceptible to horseshoe crab trawl gear during fall months. My results
suggest that species composition shifts due to location and bottom temperature.
Although bottom temperature seems to be the driving force in determining species
distribution (e.g., southern waters have warmer temperatures and northern waters have
cooler temperatures), setting regulations based on location is much easier for
management purposes. My study suggests that during the fall season species
composition will shift north and south of Atlantic City, New Jersey. My study also
identified which species have potential to be caught in each of these areas. By
documenting and understanding species distribution and migration patterns, fishing areas
can be closed to protect species if needed.
Although, it may not be feasible for managers to set regulations based on water
temperature, this result is still important for management purposes. Preferred

47
temperature ranges have been published for many species along the Atlantic coast. My
data suggests that, during the fall season, species are commonly found in areas where
water temperatures are within the preferred temperature ranges identified by past studies.
By collecting bottom temperature data along the Atlantic coast, managers can use
previously published data on preferred temperature ranges to predict species that are
likely to be caught as bycatch in the horseshoe crab trawl fishery during other seasons.
Conclusion
I have identified species that are susceptible to horseshoe crab trawl gear in
waters off the coasts of New York to Virginia, where the majority of the commercial
trawl fishery occurs (ASMFC 1998). This may not be a complete list because data were
only collected during fall months over a two-year time span; however it is a first step in
identifying bycatch within the commercial horseshoe crab trawl fishery. My study
suggests that species composition shifts by location, specifically north and south of
Atlantic City, New Jersey, and bottom temperature. These results allow managers to
better understand the distribution of species along the Atlantic coast. To fully identify
and quantify bycatch occurring in the commercial fishery along the Atlantic coast, data
need be collected directly from the commercial fishery. This will allow managers to
calculate total removals of all species which is a critical component to the development of
ecosystem-level management in the horseshoe crab trawl fishery.

48
Table 2.1. Catch per unit effort (CPUE) for all species caught during the 2005 and 2006 horseshoe crab trawl survey. Sites between Montauk, New York and Atlantic City, New Jersey were defined as northern sites and sites between Atlantic City, New Jersey and the southern tip of the Delmarva Peninsula were defined as southern sites.
2005 CPUE (kg/km) 2006 CPUE (kg/km)
Taxa- common name Scientific name Southern
Sites Northern
Sites All sites
Southern Sites
Northern Sites
All sites
American lobster Homarus americanus 0.01 0.08 0.04 <0.01 0.04 0.02 Asteriid sea star Asterias spp. 0.30 1.18 0.65 0.15 0.56 0.39 Atlantic angel shark Squatina dumeril 2.25 0.00 1.35 0.50 0.00 0.21 Atlantic croaker Micropogonias undulatus 5.22 0.04 3.15 1.12 0.01 0.47 Atlantic sharpnose shark Rhizoprionodon terraenovae 0.00 0.00 0.00 0.09 0.00 0.04 Atlantic sturgeon Acipenser oxyrinchus 0.00 1.73 0.69 1.11 0.87 0.97 Atlantic thread herring Opisthonema oglinum <0.01 0.00 <0.01 0.00 0.00 0.00 Black drum Pogonias cromis <0.01 0.00 <0.01 0.03 0.00 0.01 Black sea bass Centopristis striata 0.01 0.03 0.02 0.00 0.07 0.04 Blue crab Callinectes sapidus 0.45 0.12 0.32 0.09 0.02 0.05 Blue mussel Mytilus edulis 0.00 0.00 0.00 0.00 0.03 0.02 Bluefish Pomatomus saltatrix 0.32 0.64 0.45 0.10 0.36 0.25 Bullnose/Southern eagle ray Myliobatis freminvillei/goodei 3.29 0.00 1.97 0.28 0.00 0.11 Butterfish Peprilus triacanthus 0.01 <0.01 0.01 0.04 <0.01 0.02 Channeled whelk Busycotypus canaliculatus 1.12 0.00 0.67 1.12 0.00 0.46 Clearnose skate Raja eglanteria 49.15 2.20 30.37 16.19 2.83 8.35 Cobia Rachycentron canadum 0.00 0.00 0.00 1.13 0.00 0.46 Conger eel Conger oceanicus 0.00 0.00 0.00 0.01 0.00 0.00 Cownose ray Rhinoptera bonasus 0.77 0.11 0.50 0.58 0.00 0.24 Deep-sea scallop Placopecten magellanicus 0.00 3.09 1.24 0.00 1.12 0.66 Dusky shark Carcharhinus obscurus 0.40 0.00 0.24 0.28 0.00 0.12 Fourspot flounder Paralichthys oblongus 0.00 <0.01 <0.01 0.00 0.00 0.00 Gray triggerfish Balistes capriscus 0.00 0.03 0.01 0.00 0.00 0.00

49
Table 2.1 continued.
2005 CPUE (kg/km) 2006 CPUE (kg/km)
Taxa- common name Scientific name Southern
Sites Northern
Sites All sites
Southern Sites
Northern Sites
All sites
Hermit crab Pagurus spp. 0.03 0.32 0.15 0.29 0.46 0.39 Hogchoker Trinectes maculatus 0.00 0.00 0.00 <0.01 0.00 <0.01 Horseshoe crab Limulus polyphemus 80.61 18.66 55.82 131.95 8.10 59.24 Jellyfish (unk) n/a 0.00 0.00 0.00 0.04 0.01 0.02 Jonah crab Cancer borealis <0.01 1.29 0.51 <0.01 0.08 0.05 Knobbed whelk Busycon carica 7.31 0.00 4.39 1.96 0.00 0.81 Lady crab Ovalipes ocellatus <0.01 <0.01 <0.01 0.01 <0.01 0.01 Lesser blue crab Callinectes similis 0.00 0.00 0.00 <0.01 0.00 <0.01 Lightning whelk Busycon contrarium 0.03 0.00 0.02 0.01 0.00 0.00 Little/Winter Skate Leucoraja erinacea/ocellata 3.58 95.86 40.50 19.72 134.87 87.32 Long-finned squid Loligo pealei 0.01 0.02 0.01 0.07 0.01 0.03 Margined sea star Astropecten spp. 0.00 0.05 0.02 0.00 0.01 0.00 Northern stargazer Astroscopus guttatus 0.06 0.08 0.07 0.52 0.00 0.21 Monkfish Lophiodes americanus 0.00 0.24 0.09 0.00 0.00 0.00 Moon snail Polinices heros 0.00 0.24 0.10 <0.01 0.11 0.07 Mud crab Panopeus spp. <0.01 0.00 <0.01 0.00 0.00 0.00 Northern puffer Sphoeroides maculatus 0.01 0.03 0.02 0.02 <0.01 0.01 Northern searobin Prionotus carolinus 0.10 0.03 0.07 0.01 0.11 0.07 Octopus (unknown) n/a 0.00 0.00 0.00 <0.01 <0.01 <0.01 Pigfish Orthopristis chrysoptera 0.00 0.00 0.00 <0.01 0.00 <0.01 Purple sea urchin Arbacia punctulata 0.02 <0.01 0.01 0.02 0.02 0.02 Quahog Mercenaria mercenaria 0.00 0.00 0.00 0.00 <0.01 <0.01 Red drum Sciaenops ocellatus 0.20 0.00 0.12 0.00 0.00 0.00 Red hake Urophycis chuss 0.00 0.01 <0.01 0.00 0.01 0.00 Rock crab Cancer spp. 0.02 0.24 0.10 0.02 0.13 0.08 Sand dollar Echinarachnius parma <0.01 <0.01 <0.01 0.00 <0.01 <0.01

50
Table 2.1 continued.
2005 CPUE (kg/km) 2006 CPUE (kg/km)
Taxa- common name Scientific name Southern
Sites Northern
Sites All sites
Southern Sites
Northern Sites
All sites
Scup Stenotomus chrysops 0.02 0.48 0.21 0.04 0.03 0.03 Sea anemone (unk) n/a 0.00 0.00 0.00 <0.01 0.00 <0.01 Sea cucumber Sclerodactyla spp. 0.09 0.00 0.06 0.16 0.00 0.06 Sea mouse Aphrodita aculeata 0.00 0.00 0.00 0.00 0.02 0.01 Seahorse Hippocampus spp. 0.00 0.00 0.00 0.00 <0.01 <0.01 Sheepshead Archosargus probatocephalus 0.00 0.00 0.00 0.22 0.00 0.09 Shrimp (unk) n/a <0.01 0.00 <0.01 0.00 <0.01 <0.01 Silver hake Merluccius bilinearis 0.00 <0.01 <0.01 0.00 0.01 <0.01 Smallmouth flounder Etropus microstomus 0.00 0.00 0.00 0.00 <0.01 <0.01 Smooth butterfly ray Gymnura micrura 3.04 0.00 1.82 0.19 0.00 0.08 Smooth dogfish Mustelus canis 2.01 1.35 1.75 0.11 0.24 0.18 Southern kingfish Menticirrhus americanus 0.07 0.00 0.04 0.11 0.00 0.05 Southern stingray Dasyatis americanus 18.85 0.00 11.31 1.35 0.00 0.56 Spider crab Libinia spp. 0.59 1.30 0.87 0.31 0.32 0.31 Spiny butterfly ray Gymnura altavela 5.49 0.00 3.30 1.77 0.00 0.73 Spiny dogfish Squalus acanthias 0.00 3.95 1.58 0.67 1.40 1.10 Spot Leiostomus xanthurus 0.13 0.00 0.08 0.02 0.00 0.01 Spotted hake Urophycis regia 0.00 0.00 0.00 0.00 <0.01 <0.01 Striped bass Morone saxatilis 0.33 1.40 0.76 0.33 0.24 0.28 Striped burrfish Chilomycterus schoepfii 0.05 0.00 0.03 0.04 0.00 0.02 Striped searobin Prionotus evolans 0.05 1.22 0.52 0.13 1.98 1.22 Summer flounder Paralichthys dentatus 2.98 0.86 2.13 1.55 4.99 3.57 Surf clam Spisula solidissima 0.01 1.45 0.59 0.03 0.36 0.22 Weakfish Cynoscion regalis 0.05 0.04 0.05 0.07 0.05 0.06 Windowpane flounder Scophthalmus aquosus 0.31 1.35 0.73 1.43 1.54 1.49 Winter flounder Pseudopleuronectes americanus 0.00 0.27 0.11 0.00 0.19 0.11
Witch flounder Glyptocephalus cynoglossus 0.00 0.04 0.01 0.00 0.00 0.00

51
Table 2.2. Percent occurrence of most commonly caught taxa during the 2005 and 2006 horseshoe crab trawl surveys. Only taxa that were present in at least 10% of tows for at least one survey are listed. 2005 Percent occurrence 2006 Percent occurrence
Common name Northern
Sites Southern
Sites All
sites Northern
Sites Southern
Sites All
sites
Sea star (Asterias spp.) 54% 27% 33% 76% 29% 51% Atlantic croaker 4% 51% 29% 3% 33% 19% Blue crab 18% 38% 27% 16% 31% 24% Bluefish 25% 4% 11% 11% 2% 6% Bullnose/Southern eagle ray 0% 47% 25% 0% 11% 6% Butterfish 4% 9% 6% 16% 7% 11% Channeled whelk 0% 73% 40% 0% 84% 46% Clearnose skate 75% 100% 80% 82% 91% 87% Hermit crab 71% 13% 31% 68% 51% 59% Horseshoe crab 68% 93% 73% 55% 93% 76% Jellyfish 0% 0% 0% 18% 7% 12% Jonah crab 29% 2% 11% 8% 4% 6% Knobbed whelk 0% 82% 45% 0% 73% 40% Lady crab 4% 2% 2% 8% 13% 11% Little/Winter Skate 100% 16% 42% 100% 47% 71% Long-finned squid 18% 11% 12% 21% 18% 19% Moon snail 43% 0% 14% 32% 4% 17% Northern Puffer 18% 7% 10% 5% 2% 4% Northern searobin 18% 27% 20% 32% 4% 17% Rock crab 50% 29% 33% 63% 22% 41% Scup 29% 20% 20% 45% 11% 27% Smooth butterfly ray 0% 31% 17% 0% 9% 5% Smooth dogfish 39% 11% 19% 16% 2% 8% Southern kingfish 0% 24% 13% 0% 16% 8% Southern stingray 0% 67% 36% 0% 13% 7% Spider crab 61% 73% 60% 58% 58% 58% Spiny butterfly ray 0% 22% 12% 0% 7% 4% Spiny dogfish 39% 0% 13% 8% 16% 12% Spot 0% 51% 28% 0% 9% 5% Striped searobin 68% 13% 30% 79% 20% 47% Summer flounder 57% 78% 61% 71% 47% 58% Surf clam 46% 4% 18% 47% 4% 24% Weakfish 7% 20% 13% 5% 13% 10% Windowpane flounder 86% 51% 57% 97% 44% 69%

52
Table 2.3. Multiple response permutation procedure (MRPP) tests among changes in species composition at sites due to location, time of tow, and distance from shore. Tests were preformed using rank transformed Bray-Curtis distance measures. A chance-corrected within-group agreement value (A) greater that 0.30 indicates ecological significance.
Fall 2005 Fall 2006 2005 and 2006
combined
Abiotic factor p-value A p-value A p-value A
Location (north/south) < 0.001 0.37 < 0.001 0.29 < 0.001 0.34
Time of tow (day/night) < 0.001 0.10 0.007 0.03 < 0.001 0.05
Distance from shore (inshore/offshore) 0.001 0.04 0.009 0.03 < 0.001 0.04

53
Table 2.4. Non-metric multidimensional scaling (NMS) environmental loadings on axes 1 and 2. NMS analyses were conducted for horseshoe crab trawl survey data collected in 2005, 2006, and both years combined.
Fall 2005 Fall 2006 2005 and 2006
combined
Abiotic factor NMS
axis 1 (R2) NMS
axis 2 (R2) NMS
axis 1 (R2) NMS
axis 2 (R2) NMS
axis 1 (R2) NMS
axis 2 (R2) Bottom temperature -0.840 0.625 -0.369 0.333 -0.686 -0.294 Bottom salinity 0.741 -0.541 0.219 -0.204 0.554 0.170 Depth 0.457 0.070 0.510 -0.108 0.395 -0.391 Percent gravel 0.256 -0.069 0.277 -0.201 0.270 -0.060 Percent sand -0.296 0.108 -0.145 0.123 -0.189 0.092 Percent clay 0.233 0.034 -0.045 -0.147 0.057 -0.197 Percent mud 0.135 -0.093 -0.088 0.091 -0.002 -0.019

54
Table 2.5. List of species caught as bycatch during the horseshoe crab trawl survey. A measure of resilience and the status of the fishery, management, and conservation are listed for each species.
Occurrenceb Abundancec Common namea
(within present study) Resilenced Fishery status worldwidee Management status IUCN
listingf
American lobster Rare Very Low Unknown (Blue
Ocean Institute 2005) Fished (C/R) (NEFSC 2007) Managed
(NEFSC 2007) None
Asteriid sea star Common Very Low No info available No info available No info available None
Atlantic angel shark Rare Very Low Low Fishery closed in U.S. Managed (Fishbase 2007)
Data deficient
Atlantic croaker Common Low Medium Fished (C/R) Managed; Not overfished/ no overfishing (ASMFC 2007; MD DNR 2007)
None
Atlantic sturgeon Rare Very Low Very Low Fished (C/R); Fishery closed in U.S.
Managed; Current moratorium (NEFSC 2007)
Near thr.
Black drum Rare Very Low Medium Fished (C/R) Managed (MD DNR 2007)
None
Black sea bass Uncommon Very Low Medium Fished (C/R) Managed; Not overfished, overfishing status unknown (ASMFC 2007; MDDNR 2007)
None
Blue crab Common Very Low High (Blue Ocean Institute 2005)
Fished (C/R) Managed (MD DNR 2007)
None
Blue mussel Rare Very Low No info available Fished (C) (ME DMR 2007) Managed (ME DMR 2007)
None

55
Table 2.5 continued.
Occurrenceb Abundancec Common namea
(within present study) Resilienced Fishery status worldwidee Management status IUCN
listingf
Bluefish Uncommon Very Low Medium Fished (C/R) Managed; Not overfished/ no overfishing (ASMFC 2007; MD DNR 2007)
None
Bullnose ray Uncommon Low Very Low Fished (C) No info available None
Butterfish Uncommon Very Low High Fished (C/R) Managed; Not overfished, overfishing status unknown (NEFSC 2007)
None
Clearnose skate Abundant High Low Fished (C) Managed; Not overfished/ no overfishing (NEFSC 2007)
None
Cownose ray Uncommon Very Low Low Fished (C); No direct fishery in U.S. waters
No info available Near thr.
Deep-sea scallop Uncommon Low Medium (Blue Ocean Institute 2005)
Fished (C) Managed; Not overfished, no overfishing (NEFSC 2007)
None
Dusky shark Rare Very Low Very Low Fished (C); Fishery closed in U.S. waters (NMFS 2007a)
Managed; Listed as "species of concern" (NMFS 2007b)
Near thr.
Hermit crab Common Very Low No info available No info available No info available None

56
Table 2.5 continued.
Occurrenceb Abundancec Common namea
(within present study) Resilienced Fishery status worldwidee Management status IUCN
listingf
Jellyfish (unk) Uncommon Very Low No info available No info available No info available None
Jonah crab Uncommon Very Low Unknown (Monterey Bay Aquarium: Seafood Watch 2007)
Not currently managed (Monterey Bay Aquarium: Seafood Watch 2007)
Not currently managed (Monterey Bay Aquarium: Seafood Watch 2007)
None
Knobbed whelk Common Medium No info available Fished (C/R) (Monterey Bay Aquarium: Seafood Watch 2007)
Managed (VA MRC 2007)
None
Lady crab Uncommon Very Low No info available No info available No info available None
Little skate Abundant High Low Fished (C) Managed; Not overfished/ no overfishing (NEFSC 2007)
None
Long-finned squid Uncommon Very Low High (Blue Ocean Institute 2005)
Fished (C) (NEFSC 2007) Managed; No overfishing (NEFSC 2007)
None
Northern Puffer Uncommon Very Low High No info available Not currently managed
None
Northern searobin Uncommon Very Low Medium Fished (C) No info available None
Northern stargazer Uncommon Very Low Medium Fished (R) No info available None
Red hake Rare Very Low Medium Fished (C/R) Managed; Not overfished/ no overfishing (NEFSC 2007)
None

57
Table 2.5 continued.
Occurrenceb Abundancec Common namea (within present study)
Resilienced Fishery status worldwidee Management status IUCN listingf
Rock crab Common Very Low No info available No info available No info available None
Sand dollar Uncommon Very Low No info available No info available No info available None
Scup Common Very Low Medium Fished (C/R) Managed; Not overfished, overfishing status unknown (ASMFC 2007)
None
Silver hake Rare Very Low Medium Fished (C) Managed; Not overfished/ no overfishing (NEFSC 2007)
None
Smooth butterfly ray
Uncommon Low Very Low Fished (C); No direct fishery in U.S. waters
No info available Data deficient
Smooth dogfish Uncommon Low Low Fished (C/R) Not currently managed
Near thr.
Southern eagle ray Uncommon Low Very Low Fished (C) No info available None
Southern kingfish Uncommon Very Low Medium Fished (C/R) Managed (GA DNR 2007)
None
Southern stingray Common Medium Very Low Fished (C/R) No info available Data deficient
Spider crab Abundant Very Low No info available No info available No info available None
Spiny butterfly ray Uncommon Low Very Low Fished (C/R) No info available None

58
Table 2.5 continued.
Occurrenceb Abundancec Common namea
(within present study) Resilienced Fishery status worldwidee Management status IUCN
listingf
Spiny dogfish Uncommon Low Very Low Fished (comm.) Managed; Not
overfished/ no overfishing (NEFSC 2007)
Vul.
Spot Uncommon Very Low High Fished (C) Managed; Overfished/ overfishing unknown (ASMFC 2007)
None
Striped bass Uncommon Very Low Low Fished (C/R) Managed; Not overfished, overfishing status unknown (MD DNR 2007; NEFSC 2007)
None
Striped burrfish Uncommon Very Low No info available Fished (R) No info available None
Striped searobin Common Low Medium Fished (C/R) No info available None
Summer flounder Abundant Medium Medium Fished (C/R) Managed; Not overfished, overfishing is occurring (MD DNR 2007; NEFSC 2007)
None
Surf clam Common Very Low No info available Fished (C) (NEFSC 2007) Managed; Not overfished/ no overfishing (NEFSC 2007)
None

59
Table 2.5 continued. Occurrenceb Abundancec
Common namea (within present study)
Resilienced Fishery status worldwidee Management status IUCN
listingf
Weakfish Uncommon Very Low High Fished (C) Managed; Not
overfished/ no overfishing (NEFSC 2007)
None
Windowpane flounder
Abundant Low Medium Fished (C) Managed; Not overfished/ no overfishing (NEFSC 2007)
None
Winter flounder Uncommon Very Low Medium Fished (C/R) Managed; Not overfished/ no overfishing (NEFSC 2007)
None
Winter skate Abundant High Low Fished (C) Managed; Not overfished, overfishing is occurring (NEFSC 2007)
None
a. Species caught during HCRC trawl survey
b. Percent of tows in which species was present; Abundant: > 50%, common: 21-50%, uncommon: 6-20%, rare: <5% of tows (Data from present study).
c. Percent of total biomass that species comprised; High: >10%, Medium: 2-10%, Low: 1%, Very Low <1% of biomass (Data from present study).
d. Population doubling time; High: <15 months, Medium: 1.4-4.4 years, Low: 4.5-14 years, Very low: >14 years (FishBase 2007 unless noted otherwise).
e. Fishery status worldwide; C: commercial fishery, R: recreational fishery (FishBase 2007 unless noted otherwise). f. IUCN Listing; Vul: vulnerable, facing high risk of extinction in the wild, Near thr.: near threatened, close to qualifying for threatened category in the future, Data deficient: appropriate data are lacking (IUCN 2006).

60
ba ba
Delmarva Peninsula, VA
Long Island, NY
Delmarva Peninsula, VA
Long Island, NY
Atlantic City, NJ Atlantic City, NJ
ba ba
Delmarva Peninsula, VA
Long Island, NY
Delmarva Peninsula, VA
Long Island, NY
Atlantic City, NJ Atlantic City, NJ
Figure 2.1. Sites sampled during the horseshoe crab trawl survey during the fall season of 2005 (a) and 2006 (b). Northern sites were defined as sites north of Atlantic City, New Jersey and southern sites as sites south of Atlantic City, New Jersey.

61
Figure 2.2. Percentage of total biomass and count data for major taxa caught during the 2005 and 2006 horseshoe crab trawl surveys. Skates and horseshoe crabs comprised the majority of catch.
Horseshoe crab
Other fishes
Sharks
Skates
Rays
Other (invertebrates)
Count data Biomass data
19%
< 1%18%
55%< 1%
8%
33%
6%4%
49% 2%6%
Horseshoe crab
Other fishes
Sharks
Skates
Rays
Other (invertebrates)
Count data Biomass data
19%
< 1%18%
55%< 1%
8%
33%
6%4%
49% 2%6%

62
a
dc
ba
dc
b
Atlantic City, NJ
Atlantic City, NJAtlantic City, NJ
Atlantic City, NJ
a
dc
ba
dc
b
Atlantic City, NJ
Atlantic City, NJAtlantic City, NJ
Atlantic City, NJ
Figure 2.3. Distribution and catch per unit effort (CPUE, kg/km) for species commonly caught during the horseshoe crab trawl survey. Summer flounder (b), windowpane flounder (c), and spider crab (d) were often caught in the same areas as horseshoe crabs (a).

63
a ba b
Atlantic City, NJAtlantic City, NJ
a ba b
Atlantic City, NJAtlantic City, NJ
Figure 2.4. Catch per unit effort (CPUE, kg/km) for horseshoe crabs during the 2005 (a) and fall 2006 (b) horseshoe crab trawl surveys. Horseshoe crabs were caught in higher abundance at southern sites during both years.

64
-1.5
-1.5
-1.0 -0.5 0.0 0.5 1.0 1.5 2.0
-1.0
-0.5
0.0
0.5
1.0
1.5
NMS axis 1
NM
S a
xis
2
-1.5
-1.5
-1.0 -0.5 0.0 0.5 1.0 1.5 2.0
-1.0
-0.5
0.0
0.5
1.0
1.5
NMS axis 1
NM
S a
xis
2
Salinity
TemperatureDepth
Stress = 0.14
= northern sites
= southern sites
-1.5
-1.5
-1.0 -0.5 0.0 0.5 1.0 1.5 2.0
-1.0
-0.5
0.0
0.5
1.0
1.5
NMS axis 1
NM
S a
xis
2
-1.5
-1.5
-1.0 -0.5 0.0 0.5 1.0 1.5 2.0
-1.0
-0.5
0.0
0.5
1.0
1.5
NMS axis 1
NM
S a
xis
2
Salinity
TemperatureDepth
Stress = 0.14
= northern sites
= southern sites
= northern sites
= southern sites
Figure 2.5. Cluster ordination using non-metric multidimensional scaling (NMS) with a Bray-Curtis distance measure for species composition data collected during the 2005 horseshoe crab trawl survey. Sites formed two distinct groups: one group of all southern sites and one group of mostly northern sites. Temperature and salinity explained most of the variation in species composition among sites.

65
-2.0
-1.5
-1.5 -1.0 -0.5 0.0 0.5 1.0 1.5
-1.0
-0.5
0.0
0.5
1.0
1.5
NMS axis 1
NM
S a
xis
2
-2.0
-1.5
-1.5 -1.0 -0.5 0.0 0.5 1.0 1.5
-1.0
-0.5
0.0
0.5
1.0
1.5
NMS axis 1
NM
S a
xis
2
TemperatureDepth
Stress = 0.15
= northern sites
= southern sites
-2.0
-1.5
-1.5 -1.0 -0.5 0.0 0.5 1.0 1.5
-1.0
-0.5
0.0
0.5
1.0
1.5
NMS axis 1
NM
S a
xis
2
-2.0
-1.5
-1.5 -1.0 -0.5 0.0 0.5 1.0 1.5
-1.0
-0.5
0.0
0.5
1.0
1.5
NMS axis 1
NM
S a
xis
2
TemperatureDepth
Stress = 0.15
= northern sites
= southern sites
Figure 2.6. Cluster ordination using non-metric multidimensional scaling (NMS) with a Bray-Curtis distance measure for species composition data collected during the 2006 horseshoe crab trawl survey. Sites formed two distinct groups: one group of all southern sites and one group comprised of northern and southern sites. Temperature and depth explained most of the variation in species composition among sites.

66
Inter-
mediate
Northern
Deep
-1.5
-1.5
-1.0 -0.5 0.0 0.5 1.0 1.5
-1.0
-0.5
0.0
0.5
1.0
NMS axis 1
NM
S a
xis
2
-1.5
-1.5
-1.0 -0.5 0.0 0.5 1.0 1.5
-1.0
-0.5
0.0
0.5
1.0
NMS axis 1
NM
S a
xis
2
TemperatureDepth
Salinity
Stress = 0.11
= 2005, northern sites
= 2005, southern sites
= 2006, northern sites
= 2006, southern sites
= 2005, northern sites
= 2005, southern sites
= 2006, northern sites
= 2006, southern sites
Figure 2.7. Cluster ordination using non-metric multidimensional scaling (NMS) with a Bray-Curtis distance measure for species composition collected at sites during the 2005 and 2006 horseshoe crab trawl survey. Sites formed two distinct groups: one group of all southern sites and one group comprised of mostly northern sites. The group comprised on mostly northern sites contained three sub-groups: one subgroup comprised of northern and southern sites (“Intermediate”), one sub-group of all northern sites (“Northern”), and the last sub-group comprised of northern, deep-water sites (“Deep”). Temperature explained most of the variation in species composition among sites.

67
c
a
d
b
c
a
d
b
Atlantic City, NJ
Atlantic City, NJAtlantic City, NJ
Atlantic City, NJ
c
a
d
b
c
a
d
b
Atlantic City, NJ
Atlantic City, NJAtlantic City, NJ
Atlantic City, NJ
Figure 2.8. Distribution and catch per unit effort (CPUE, kg/km) of species commonly caught at southern sites during the 2005 and 2006 horseshoe crab trawl survey. Maps are shown for knobbed whelk (a), channeled whelk (b), southern stingray (c), bullnose and southern eagle ray (d).

68
a
dc
ba
dc
b
Atlantic City, NJ
Atlantic City, NJAtlantic City, NJ
Atlantic City, NJ
a
dc
ba
dc
b
Atlantic City, NJ
Atlantic City, NJAtlantic City, NJ
Atlantic City, NJ
Figure 2.9. Distribution and catch per unit effort (CPUE, kg/km) of species commonly caught at northern sites during the 2005 and 2006 horseshoe crab trawl survey. Maps are shown for little and winter skate (a), spiny dogfish (b), striped searobin (c), winter flounder (d).

69
a
c d
ba
c d
b
Figure 2.10. Percent sand (a), mud (b), clay (c), and gravel (d) throughout the study area. Bottom composition throughout most of the study area consisted of more than 80% sandy substrate.

70
Atlantic City, NJAtlantic City, NJ
Figure 2.11. Distribution and catch per unit effort (CPUE, kg/km) of Atlantic sturgeon caught during the horseshoe crab trawl survey.

71
Chapter 3.
Examining current and alternative approaches to estimating biomass of horseshoe crab
(Limulus polyphemus) landings along the Middle Atlantic Bight.
Abstract
Conversion factors are currently used by states along the Atlantic coast to convert
landing data from numbers of horseshoe crabs to biomass (pounds) of crabs. However
the accuracy of these conversion factors has not been thoroughly investigated. These
conversion factors vary by state, for example Virginia uses one conversion factor to
estimate the biomass of harvested horseshoe crabs, whereas New Jersey and Delaware
each use two conversion factors, one for males and one for females, to estimate biomass.
I designed a study to test the accuracy of the conversion factors used by the states of
Maryland, New Jersey, Delaware, and Virginia and to develop and test an alternative
approach, using prosomal-width-to-crab-weight equations, to estimate the biomass of
landing data. I derived two width-weight equations from individual prosomal width and
weight measurements collected in trawlable waters off the coasts of New York, New
Jersey, Delaware, Maryland, and Virginia. I tested these two approaches (i.e., using
conversion factors versus using width-weight equations) with four independent data sets.
The calculated width-weight equation provided a relatively accurate prediction of weight,
but not more accurate than the conversion factors that are currently used by New Jersey,
Delaware, and Maryland. The width-weight equations and the conversion factors used by
New Jersey, Delaware, and Maryland predicted biomass much more accurately than
conversion factor that is currently used by the state of Virginia. On average, the Virginia

72
conversion factor underestimated biomass 45% more than the conversion factors used by
New Jersey, Delaware, and Maryland. This study suggests that of the approaches I
tested, using two conversion factors, based on sex, is the best method to estimating
biomass from landing data reported in numbers of horseshoe crabs.
Introduction
Horseshoe crabs (Limulus polyphemus) are considered a multiple-use resource.
They are valued by many stakeholders, including commercial fishers, biomedical
companies, and environmental interest groups (Berkson and Shuster 1999). Horseshoe
crabs are commercially harvested and sold as bait for American eel (Anguilla rostrata)
and whelk (Busycotypus spp.) fisheries (ASMFC 1998). This species is also harvested
for biomedical companies because its copper-based blood contains a unique clotting
agent (LAL, Limulus Amoebocyte Lysate) that is used to detect pathogenic endotoxins
on medical devices and in injectable drugs (Novitsky 1984; Mikkelsen 1988). Horseshoe
crabs are ecologically important because their eggs serve as a food source for migrating
shorebirds (Shuster and Botton 1985; Mikkelsen 1988).
Despite their importance to many stakeholders, it was not until 1998 that a
Fishery Management Plan (FMP) was developed for this species. Current regulations
require commercial fishers to report the harvest of horseshoe crabs for bait or biomedical
companies to the National Marine Fisheries Service (NMFS) (ASMFC 1998). These
landings must include the sex, harvest method, number, and pounds of all horseshoe
crabs harvested (ASMFC 1998). However, in many cases, fishers do not report landings
in pounds, but only in numbers of crabs landed. Conversion factors are then used by state

73
agencies to convert number of crabs to pounds (ASMFC 1998). Due to the uncertainty in
these conversion factors and resulting biomass estimates, managers only use numbers of
crabs (not biomass) when assessing the status of the stock (S. Michels, Delaware
Division of Fish and Wildlife, personal communication).
The conversion factors used to convert landings from numbers to pounds of
horseshoe crabs vary by state and are based on previously collected fishery-independent
and fishery-dependent data (J. Brust, New Jersey Department of Fish and Game, personal
communication; S. Michels, Delaware Division of Fish and Wildlife, personal
communication; S. Doctor, Maryland Department of Natural Resources, personal
communication). Some states, such as Virginia, use only one conversion factor (2
lbs/crab; L. Gillingham, Virginia Marine Resource Commission, personal
communication) to calculate the weight of each crab harvested. Other states, such as
New Jersey, Delaware, and Maryland, use two conversion factors, taking the sex of the
horseshoe crab into account (New Jersey/Delaware: 5.12 lbs/female crab, 2.32 lbs/male
crab; S. Michels, Delaware Division of Fish and Wildlife, personal communication;
Maryland: 4.97 lbs/female crab, 2.12 lbs/male crab; S. Doctor, Maryland Department of
Natural Resources, personal communication).
The accuracy of these conversion factors has not been thoroughly investigated. I
designed a study to test the accuracy of the conversion factors currently used by the states
of New Jersey, Delaware, Maryland, and Virginia and to test an alternative approach to
estimating the biomass of landing data (using prosomal-width-to-crab-weight equations).

74
Methods
Calculating the width-weight equations
To develop prosomal-width-to-crab-weight equations, width and weight
measurements were collected from horseshoe crabs along the Atlantic coast from the
eastern tip of Long Island, New York (approximately 71o50’W and 41o04’N) to the
southern tip of the Delmarva Peninsula, Virginia (approximately 75o55’W and 37o05’N)
during September, October, and November of 2005 and 2006, and June of 2006 (Figure
3.1). Trawling gear, specifically a flounder net, was used to collect all crabs. The ground
gear was modified with a Texas sweep, which has a chain line instead of a footrope (Hata
and Berkson 2003; Hata and Berkson 2004). I recorded prosomal width (to the nearest 1
mm), weight (to the nearest 0.01 kg), sex, and maturity for all or a subsample of
horseshoe crabs at each site. Maturity was classified into three groups: immature, newly
mature (primiparous), and mature (multiparous). Maturity stages in females were not
always morphologically distinct, so some individuals had to be probed with an awl to
look for eggs and determine the stage of maturity. Females with eggs but no rub marks,
which are indicative of amplexus, were categorized as newly mature and those with eggs
and rub marks were categorized as mature (D. Hata, Virginia Tech, personal
communication). During the fall seasons of 2005 and 2006, I collected measurements
during the horseshoe crab trawl survey conducted by the Horseshoe Crab Research
Center (HCRC) at Virginia Tech (for methods see Hata and Berkson 2004). All
horseshoe crabs were collected within 12 nautical miles off the states of New York, New
Jersey, Delaware, Maryland, and Virginia. In the summer of 2006, I sampled horseshoe

75
crabs aboard a commercial trawl vessel harvesting crabs for a biomedical company off
the coast of Ocean City, Maryland.
I normalized the width and weight measurements using a log transformation.
Width-weight regression equations were calculated to estimate the parameters of
conversion between width and weight, using the form
)(log)(log)(log abPWWT eee +⋅= ,
where WT = weight of a horseshoe crab (kg), PW= prosomal width (mm), b = slope,
and a = y-intercept (EXCEL, 2003). I tested the slopes of the linear regressions using a
two sample t-test.
Choosing the conversion factors
The conversion factors currently used by each state to estimate the biomass of
landing data were reported in the horseshoe crab fishery management plan (ASMFC
1998) and verified by researchers from state agencies. I tested the conversion factors
used by New Jersey, Delaware, Maryland, and Virginia; the conversion factor used by
Virginia is independent of sex, whereas New Jersey, Delaware, and Maryland use
separate conversion factors for males and females. I only wanted to test the conversion
factor(s) used by the Atlantic states between New York and Virginia to stay within the
same geographic range of the data collected to calculate the width-weight equations. The
state of New York does not use conversion factors; instead, all management actions are
based on number of horseshoe crabs (R. Burgess, New York Department of
Environmental Conservation, personal communication).

76
Obtaining the independent data sets
I used independent data sets containing individual width and weight
measurements of horseshoe crabs to test and compare the predictive accuracy of the state
conversion factors and the calculated width-weight equations. I obtained these data sets
from researchers from universities and state agencies (M. Botton, Fordam University,
personal communication; S. Michels, Delaware Division of Fish and Wildlife, personal
communication; L. Gillingham, Virginia Marine Resource Commission, personal
communication). Four sets of data were used: three from spawning surveys, each along a
different beach (i.e., the Delaware side of the Delaware Bay, the New Jersey side of the
Delaware Bay, and the Raritan Bay in New Jersey), and one from commercial harvests
from Chincoteague, Virginia (i.e., conch dredge and hand harvest).
Estimating total biomass
I estimated the total biomass of each data set using the conversion factors from
New Jersey, Delaware, Maryland, and Virginia. I also used the appropriate width-weight
equation (i.e., based on the specific state, sex, and maturity stage) to estimate the total
biomass of each data set by summing the estimated weight of each horseshoe crab within
the data set. Lastly, to determine which method provided the most accurate estimate of
biomass, I compared the two methods used to estimate weight to the total observed
biomass for each data set (i.e., conversion factors and calculated width-weight equations).

77
Results
Calculated width-weight equations: estimates of biomass
In total, 925 horseshoe crabs were sampled throughout the study area (Figures 3.1
and 3.2, Table 3.1). The slopes of the relationship between prosomal width and
horseshoe crab weight were significantly different between males and females (t =
177.43; P ≤ 0.05). I therefore developed two prosomal-width-to-weight equations for
testing: one for female horseshoe crabs and one for male horseshoe crabs (Table 3.2).
Maturity stage was not incorporated into these equations because it is not feasible for
fishers to report the maturity stage of every horseshoe crab harvested.
These calculated with-weight equations slightly overestimated or underestimated
the weights of horseshoe crabs from the spawning survey data sets by 3 - 12% (Figure
3.3; Table 3.3). The calculated width-weight equations overestimated the weights of
crabs collected from the Virginia conch dredge fishery by 23 - 29% (Figure 3.1).
Conversion factors: estimates of biomass
The conversion factors currently used by New Jersey, Delaware, and Maryland
provided a more accurate estimate of biomass than the conversion factor used by
Virginia. The New Jersey, Delaware, and Maryland conversion factors overestimated or
underestimated the total observed biomass for the spawning survey data sets by 1 - 15%
(Table 3.3). These conversion factors overestimated the biomass of the Virginia
commercial harvest data set by 2.7 - 18% (Table 3.3). The conversion factor used by the
state of Virginia consistently underestimated the biomass of horseshoe crabs from all data
sets, in some cases by more than 50% (Table 3.3). The conversion factor used by
Virginia provided a more accurate estimate of the biomass of male horseshoe crabs, only

78
underestimating biomass by 3 - 19% (Table 3.3). However, the biomass of female
horseshoe crabs was not accurately estimated, being underestimated by 53 - 66% (Table
3.3).
Discussion
Calculated width-weight equations: estimates of biomass
In most cases, the width-weight equations slightly underestimated biomass of
horseshoe crabs collected during Delaware and New Jersey spawning surveys (Table 3.3;
Figure 3.3). This may be due to the time of year that horseshoe crabs were sampled. The
measurements used to create the width-weight equations were only taken during summer
(June) and fall (September, October, and November) months and therefore might not
accurately predict the weight of horseshoe crabs that are sampled during the rest of the
year. Measurements from the spawning surveys were collected during spring months,
when female horseshoe crabs may have been heavier due to additional weight from eggs.
Some of the measurements collected during the spawning survey may have been recorded
after a female had laid her eggs. However, these horseshoe crabs would still have many
eggs in their prosoma because female horseshoe crabs re-nest several times during
spawning events (Brockmann and Penn 1992), laying clusters of a few thousand eggs
each time (Shuster and Botton 1985). Males will also revisit beaches several times
during spawning season (Brockmann and Penn 1992) and may be heavier due to the
weight of sperm during this time.
The width-weight equations did not predict the weight of crabs from commercial
harvest in Virginia as accurately as they predicted weights from the New Jersey and

79
Delaware spawning surveys. I expected the calculated width-weight equations to
accurately estimate the weight of the horseshoe crabs sampled from Virginia commercial
harvests because all of these measurements were collected in trawlable waters. Instead,
the horseshoe crabs in the commercial data set generally weighed less than crabs used to
calculate the width-weight equations. Horseshoe crabs from Virginia may be
morphologically distinct from other populations within our study area; however this is
probably not the case. Past research has shown that populations along the Middle
Atlantic Bight are very similar in morphology (Shuster 1979; Riska 1981). One possible
explanation of the width and weight differences between horseshoe crabs from Virginia
compared to other areas is that the measurements collected from Virginia commercial
fishery were taken after spawning season, when the crabs had left the beaches and
returned to deeper waters. Body weight may have decreased due to the loss of eggs and
sperm. The majority of horseshoe crabs that were measured to create the width-weight
equations were sampled in the fall season, a few months after spawning season. These
horseshoe crabs may have weighed more due to new batches of eggs and sperm being
produced for the next spawning season. Measuring error of the observed weights of the
horseshoe crabs from the commercial data may have also been a factor.
Conversion factors: estimates of biomass
The conversion factors currently used by New Jersey, Delaware, and Maryland
were more accurate at estimating the biomass of horseshoe crabs than the conversion
factor used by Virginia. Using two conversion factors- one for females and one for
males, provided a more accurate estimate of biomass than using one conversion factor
that was independent of sex. Using two conversion factors that are based on sex is more

80
appropriate because, on average, mature female horseshoe crabs have wider prosomal
width and associated weight than male horseshoe crabs (Yanasaki 1988; Figure 3.2). A
mature female horseshoe crab also has additional weight due to the many eggs (88,000
eggs/mature female; Mikkelsen 1988) within her prosoma. These factors increase the
weight of a female horseshoe crab, generally making it much heavier than a male
horseshoe crab.
According to the data collected to calculate the width-weight equations,
significant differences exist in the width-weight relationship of mature female horseshoe
crabs compared to mature male and all immature horseshoe crabs. The larger prosomal
width and greater weight of mature female horseshoe crabs were most likely the major
factors contributing to the difference in the width-weight relationship. The results from
this study suggest that the average weight per mature female horseshoe crab is much
greater than for mature male horseshoe crabs. Therefore, it is appropriate that different
conversion factors should be used when estimating the weight of female and male
horseshoe crabs.
Management implications
Before this study, there had not been an assessment of the accuracy of the
conversion factors that are currently used by managers to calculate the total biomass of
horseshoe crabs landed. Although landings reported as pounds currently are not used to
manage stocks, it may be important to provide accurate biomass estimates of harvest data
for future management purposes. Therefore, an accurate conversion method should be
developed.

81
At best, width-weight equations provide biomass estimates that are not notably
more accurate than properly used conversion factors. The width-weight equations
calculated in this study may be helpful for researchers who want to estimate the weight of
an individual horseshoe crab based on a measured prosomal width, but are probably not
feasible for management purposes. To calculate the weight of a crab using the width-
weight equations, the prosomal width must be measured. Currently, fishers are not
required to report the prosomal width of each harvested horseshoe crab. This would be
extremely time-consuming for fishers, especially those that are harvesting hundreds of
horseshoe crabs in a matter of hours. An observer program could be implemented to
measure prosomal widths for a subsample of commercial catch and the measurements
could be converted to biomass using the width-weight equations. This might provide
managers with an estimate of harvested biomass; however developing accurate
conversion factors may be a more efficient approach to estimating total biomass of
landing data based on numbers of horseshoe crabs harvested.
It is clear that some conversion factors used by state agencies are better than
others in their accuracy of calculating biomass. The conversion factor used by Virginia
assumes that the average weight of a sample of horseshoe crabs is two pounds. However,
the conversion factor used by Virginia consistently underestimated the total biomass of a
sample, especially of female horseshoe crabs. In some cases biomass was underestimated
by more than 50%, suggesting that an estimate of two pounds for each female horseshoe
crab is far too low (Table 3.3).
Currently there are no size restrictions on the commercial fishery, thus allowing
fishers to harvest horseshoe crabs of all sizes. However, biomedical companies require

82
harvests of adult horseshoe crabs (> 8” prosomal width) because they contain more blood
than smaller horseshoe crabs (Hurton 2003; ASMFC 2006b). These catches, comprised
of larger, heavier horseshoe crabs, that are harvested for biomedical companies would
most likely be underestimated using the Virginia conversion factor.
The conversion factors currently used by New Jersey, Delaware, and Maryland
seem to provide accurate estimates of horseshoe crab biomass. Currently, all horseshoe
crab landings along the Atlantic coast are required to be reported by sex (ASMFC 1998).
Since these data are already being collected, it seems only reasonable that two conversion
factors, based on sex, be used to convert landing data from number of horseshoe crabs to
biomass of horseshoe crabs. Using two conversion factors is also more feasible for
management purposes because, currently, many Atlantic coast states are regulating the
harvest of horseshoe crabs based on sex. New Jersey and Delaware currently only allow
male horseshoe crabs to be harvested (ASMFC 2006b). Maryland allows both male and
female horseshoe crabs to be harvested, but enforces a sex ratio of 2:1 (males:females)
(ASMFC 2006b). Using two conversion factors, based on sex, should provide an
accurate estimate of biomass despite the differing sex ratios among states.
Conclusion
Based on this study, an accurate estimate of biomass can be obtained using a
conversion method that incorporates sex and prosomal width of each individual
horseshoe crab. However, this method may not be feasible for management. This
method would be very difficult to implement and did not provide an estimate of biomass
that was more accurate than the conversion factors that are currently used by New Jersey,

83
Delaware, and Maryland. It seems that the most practical approach to estimating biomass
from data reported by number of horseshoe crabs landed is to use two conversion factors:
one for females and one for males to account for the variation of weight between the
sexes. However, I also suggest that researchers from these states should continuously
collect data on the average weight of female and male horseshoe crabs in order to fine
tune these conversion factors. In this way, the accuracy of these conversion factors could
be improved, thereby providing better data for future management assessments.

84
Table 3.1. Prosomal width and horseshoe crab weight characteristics for female, male, and combined sexes of horseshoe crabs.
Width characteristics (mm) Weight characteristics (kg)
n Mean SE Min Max Mean SE Min Max
Female 482 227 ± 2.36 82 321 1.80 ± 0.05 0.10 3.94
Male 443 194 ± 1.43 80 292 0.87 ± 0.01 0.10 3.14
Both 925 211 ± 1.51 80 321 1.36 ± 0.03 0.10 3.94

85
Table 3.2. Parameters of the relationship ( )(log)(log)(log abPWWT eee +⋅= ) between
prosomal width and weight for female, male, and combined sexes of horseshoe crabs.
n a b SE(a) SE(b) R2
Female 482 3.0246 -15.974 ± 0.024 ± 0.130 0.971
Male 443 2.6378 -14.090 ± 0.041 ± 0.215 0.904
Both 925 3.0134 -15.985 ± 0.024 ± 0.126 0.947

86
Table 3.3. Two methods of estimating biomass were tested (width-weight equations calculated from measurements taken during a horseshoe crab trawl survey and conversion factors currently used by various state agencies) using independent data sets that contained width and weight measurements from individual horseshoe crabs. The percentage that each method over- or under-estimated biomass of female (F), male (M), and all (T) horseshoe crabs is listed in the table below. Percent total weight (kg) was overestimated (+) or underestimated (-) using:
Total observed weight (kg) Width-weight equations
NJ/DE conversion factorsa
MD conversion factorsb VA conversion factorc
Data set F M T F M T F M T F M T F M T Spawning survey Delaware Bay, New Jersey (n =379)
446 237 683 -7% -12% -9% -13% -6% -10% -15% -15% -15% -66% -19% -50%
Spawning survey Raritan Bay, New Jersey (n = 303)
231 192 423 -3% -6% -4% +2% +7% +4% -1% -2% -1% -60% -8% -36%
Spawning survey Delaware Bay, Delaware (n = 348)
631 90 721 5% -5% +4% -4% +1% -3% -7% -7% -7% -63% -13% -56%
Conch fishery Atlantic Ocean, Virginia (n = 252)
378 55 433 29% +24% +29% +18% +13% +18% +15% +3% +13% -54% -3% -47%
Conversion factor(s) used by each state: a. Male = 2.32 lbs/crab, Female = 5.12 lbs/crab (NMFS 1998); b. 2.0 lbs/crab (L. Gillingham, Virginia Marine Resource Commission, personal communication); c. Male = 2.12 lbs/crab, Female = 4.97 lbs/crab (S. Doctor, Maryland Department of Natural Resources, personal communication)

87
Raritan Bay, New Jersey
Chincoteague, Virginia
New York
New York
Maryland
Delaware
New Jersey
Virg
inia
Delaware Bay
Raritan Bay, New Jersey
Chincoteague, Virginia
New York
New York
Maryland
Delaware
New Jersey
Virg
inia
Delaware Bay
Figure 3.1. Sampling location and number of horseshoe crabs measured throughout the study area. Prosomal width and horseshoe crab weight were collected for 925 horseshoe crabs along the Atlantic coast of the United States.

88
0
10
20
30
40
50
60
70
80
90
80 90 100 110 120 130 140 150 160 170 180 190 200 210 220 230 240 250 260 270 280 290 300 310 320 330
Prosomal width (mm)
Fre
quen
cy (
# of
HS
Cs)
0
10
20
30
40
50
60
70
80
90
80 90 100 110 120 130 140 150 160 170 180 190 200 210 220 230 240 250 260 270 280 290 300 310 320 330
Prosomal width (mm)
Fre
quen
cy (
# of
HS
Cs)
Figure 3.2. The prosomal-width-to-frequency distribution of female (solid bars) and male (open bars) horseshoe crabs collected along the Atlantic Coast.

89
0
1
2
3
4
150 200 250 300 350
0
1
2
3
4
150 200 250 300
0
1
2
3
4
150 200 250 300
0
1
2
3
4
150 200 250 300 350
a
c d
b
Wei
ght (
kg)
Prosomal width (mm)
0
1
2
3
4
150 200 250 300 350
0
1
2
3
4
150 200 250 300
0
1
2
3
4
150 200 250 300
0
1
2
3
4
150 200 250 300 350
a
c d
b
Wei
ght (
kg)
Prosomal width (mm)
Figure 3.3. Observed and estimated horseshoe crab prosomal widths and weights. Observed measurements were collected from spawning surveys on the Delaware Bay, New Jersey (a); Raritan Bay, New Jersey (b); and Delaware Bay, Delaware (c); and from commercial harvest (hand and dredge) off the coast of Virginia (d). The observed measurements of male horseshoe crabs are represented by open squares and female horseshoe crabs are represented by open triangles. Two width-weight equations were derived using measurements collected from horseshoe crabs along the Atlantic coast. Weight was estimated based on sex and prosomal width of each individual crab, and is represented by the solid line.

90
Literature cited Able, K. W., D. M. Nemerson, R. Bush, and P. Light. 2001. Spatial variation in Delaware
Bay (U.S.A.) marsh creek fish assemblages. Estuaries 24:441-452. ACCSP (Atlantic Coastal Cooperative Statistics Program). 2005. Welcome to: Atlantic
Coastal Cooperative Statistics Program. Available: www.accsp.org. (April 2005). Alverson, D. L., M. H. Freeberg, S. A. Murawski, and J. G. Pope. 1994. A global
assessment of fisheries bycatch and discards. Food and Agricultire Organization (FAO) Fisheries Technical Paper, No. 339. FOA, Rome.
ASMFC (Atlantic States Marine Fisheries Commission). 1981. Interstate fisheries
management plan for the striped bass. Fisheries Management Report No.1 of the Atlantic States Marine Fisheries Commission. Available:www.asmfc.org. (June 2007).
ASMFC. 1987. Fishery Management Plan for Spot. Fishery Management Report No. 11.
Available:www.asmfc.org. (June 2007). ASMFC. 1998. Interstate Fishery Management Plan for Horseshoe Crab. Fishery
Management Report No. 32. Available:www.asmfc.org. (June 2007). ASMFC. 2003. Special Report No. 79 of the Atlantic States Marine Fisheries
Commission: Linking Multispecies Assessments to Single Species Management. Available: www.asmfc.org. (August 2007).
ASMFC. 2005a. Managed species: Atlantic sturgeon fact sheet. Available:
www.asmfc.org. (March 2005). ASMFC. 2005b. Amendment 1 to the Interstate Fishery Management Plan for Atlantic
Croaker. Fishery Management Report No. 44. Available:www.asmfc.org. (June 2007).
ASMFC. 2006a. 2006 Review of the Atlantic States Marine Fisheries Commission
Fishery Management Plan for Summer Flounder (Paralichthys dentatus). Available:www.asmfc.org. (June 2007).
ASMFC. 2006b. Fishery Management Report No. 32d. of the Atlantic States Marine
Fisheries Commission. Addendum IV to the Interstate Fishery Management Plan for Horseshoe Crab. Available: www.asmfc.org. (August 2007).
ASMFC. 2007. Managed species. Available: http://www.asmfc.org/. (August 2007). Bain, M. B. 1997. Atlantic and shortnose sturgeons of the Hudson River: Common and

91
divergent life history attributes. Environmental Biology of Fishes 48(1-4):347-358.
Beentjes, M. P., B. Bull, R. J. Hurst, and N. W. Bagley. 2002 Demersal fish assemblages along the continental shelf and upper slope of the east coast of the South Island, New Zealand. New Zealand Journal of Marine and Freshwater Research 36:197-223.
Berkson, J. and C. N. Shuster. 1999. The horseshoe crab: the battle for a true multiple-use
resource. Fisheries 24(11):6-10. Bigelow, H. B. and W. C. Schroeder. 1948. Sharks. Pages 59-547 in J. Tee-van, C. M.
Breder, S. F. Hildebrand, A. E. Parr, and W. C. Schroeder, editors. Fishes of the Western North Atlantic, Part I. Sears Foundation for Marine Research, Yale University. New Haven.
Bigelow, H. B. and W. C. Schroeder. 1953. Fishes of the Gulf of Maine. U.S. Fish
Bulletin 53:1-577. Blue Ocean Institute. 2005. Program Areas: Sustainable Seafood. Available:
http://www.blueocean.org/welcome.html. (August 2007). Botsford, L. W., J. C. Castilla, and C. H. Peterson. 1997. The management of fisheries
and marine ecosystems. Science 277(5325):509-515. Bowman, M. J. and L. D. Wunderlich. 1976. Hydrographic properties: Distribution of
hydrographic properties on the New York Bight apex. American Society of Limnology and Oceanography Special Symposium 2:58-68.
Bray, J. R. and J. T. Curtis. 1957. An ordination of the upland forest communities of
southern Wisconsin. Ecological Monographs 27(4):325-349. Brockmann, H. J. and D. Penn. 1992. Male mating tactics in the horseshoe crab, Limulus
polyphemus. Animal behavior 44:653-665. Casey, J. M. and R. A. Myers. 1998. Near extinction of a large, widely distributed fish.
Science 281:690-692. Chang, S., P. L. Berrien, D. L. Johnson, and W. W. Morse. 1999. Essential Fish Habitat
Source Document:Windowpane flounder, Scophthalmus aquosus, Life History and Habitat Characteristics. NOAA Technical Memorandum NMFS-NE-137, Woods Hole, Massachussetts.
Chant, R. J., S. Glenn, and J. Kohut. 2004. Flow reversals during upwelling conditions on
the New Jersey inner shelf. Journal of Geophysical Research 109:C12S03, doi:10.1029/2003JC001941.
92
Clark, K. E., L. J. Niles, and J. Burger. 1993. Abundance and distribution of migrant
shorebirds in Delaware Bay. Condor 95:694-705. Clarke, K. R. 1993. Nonparametric multivariate analyses of changes in community
structure. Australian Journal of Ecology 18(1):117-143. Colvocoresses, J. A. and J. A. Musick. 1980. A preliminary evaluation of the potential for
a shark fishery in Virginia. Special Report in Applied Marine Science and Ocean Engineering No. 234, Gloucester Point, Virginia.
Colvocoresses, J. A. and J. A. Musick. 1984. Species association and community
composition of middle Atlantic bight continental shelf demersal fish. Fishery Bullentin 82(2):295-312.
Compagno, L. J. V. 1984. FAO species catalogue. Vol 4. Sharks of the world, An
annotated and illustrated catalogue of shark species known to date. Part 1. Order Squatiniformes, pp. 145-146. FAO, Rome.
Cowen, R. K., J. A. Hare, and M. P. Fahay. 1993. Beyond hydrography:Can physical
processes explain larval fish assemblages within the Middle Atlantic Bight? Bulletin of Marine Science 53(2):567-587.
Crowder, L. B. and S. A. Murawski. 1998. Fisheries bycatch:implications for
management. Fisheries 23(6):8-17. Davis, M. W. 2002. Key principles for understanding fish bycatch discard mortality.
Canadian Journal of Fisheries and Aquatic Sciences 59:1834-1843. Drohan, A. F., J. P. Manderson, and D. B. Packer. 2007. Essential Fish Habitat Source
Document:Black sea bass, Centropristis striata, Life History and Habitat Characteristics. NOAA Technical Memorandum NMFS-NE-200, Woods Hole, Massachussetts.
Fishbase. 2007. Fishbase. Available: http://www.fishbase.org/. (August 2007). Fluharty, D. 2000. Habitat protection, ecological issues, and implementation of the
Sustainable Fisheries Act. Ecological Applications 10(2):325-337. Fock, H. O., C. Pusch, and S. Ehrich. 2004. Structure of deep-sea pelagic fish
assemblages in relation to the Mid-Atlantic Ridge (45o – 50oN). Deep-sea Research I 51:953-978.
Fox, D. S. and R. M. Starr. 1996. Comparison of commercial fishery and research catch
data. Canadian Journal of Fisheries and Aquatic Sciences 53(12):2681-2694.

93
Franks, J. S., J. R. Warren, and M. V. Buchanan. 1999. Age and growth of cobia, Rachycentron canadum, from the northeastern Gulf of Mexico. Fishery Bulletin 97(3):459-471.
GA DNR (Georgia Department of Natural Resources). 2007. Coastal Resources
Division: Fisheries Management. Available: http://crd.dnr.state.ga.us/. (August 2007).
Gabriel, W. L. 1992. Persistence of demersal fish assemblages between Cape Hatteras
and Nova Scotia, Northwest Atlantic. Journal of Northwest Atlantic Fisheries Science 14:29-46.
Glenn, S., R. Arnone, T. Begmann, W. P. Bissett, M. Crowley, J. Cullen, J. Gryzmski, D.
Haidvogel, J. Kohut, M. Moline, M. Oliver, C. Orrico, R. Sherrell, T. Song, A. Weidemann, R. Chant, and O. Schofield. 2004. Biogeochemical impact of summertime coastal upwelling on the New Jersey Shelf. Journal of Geophysical Research-Oceans 109, C12S02, doi:10.1029/2003JC002265.
Gomes, M. C., E. Serrao, and M. F. Borges. 2001. Spatial patterns of groundfish
assemblages on the continental shelf of Portugal. ICES Journal of Marine Science 58:633-647.
Gosner, K. L. 1984. A Field Guide to the Atlantic seashore from the Bay of Fundy to
Cape Hatteras. Houghton Mifflin Company, Boston, NY. Greenstreet, S. P. R., F. E. Spence, and J. A. McMillan. 1999. Fishing effects in northeast
Atlantic shelf seas:patterns in fishing effort, diversity, and community structure. V. Changes in structure of the North Sea groundfish secies assemblage between 1925 – 1996. Fisheries Research 40:153-183.
Grumbine, R. E. 1994. What is ecosystem management? Conservation Biology 8(1): 27
– 38. Hall, M. A. 1996. On bycatches. Reviews in Fish Biology and Fisheries 6(3):319-352. Hall, M. A., D. L. Alverson, and K. I. Metuzals. 2000. By-catch: problems and solutions.
Marine Pollution Bulletin 41:204-219. Hata, D. and J. Berkson. 2003. Abundance of horseshoe crabs (Limulus polyphemus) in
the Delaware Bay area. Fishery Bulletin 101(4):933-938. Hata D. and J. Berkson. 2004. Factors affecting horseshoe crab Limulus polyphemus
trawl survey design. Transactions of the American Fisheries Society 133:292-299. Holmquist, R. K. 1997. Maximum size revision and Chesapeake distribution for striped
burrfish, Chilomycterus schoepfi. Virginia Journal of Science 48(3):225-230.

94
Horsten, M. B. and E. Kirkegaard. 2002. Bycatch from a perspective of sustainable use.
IUCN SSC European Sustainable Use Specialist Group: Fisheries Working Group, Brussels, Belgium.
Hurton, L. 2003. Reducing post-bleeding mortality of horseshoe crabs (Limulus
polyphemus) used in the biomedical industry. Master’s thesis. Virginia Polytechnic Institute and State University, Blacksburg, Virginia.
IUCN (The World Conservation Union). 2006. 2006 IUCN Red List of Threatened
Species. Available: http://www.iucnredlist.org/. (August 2007). Kennelly, S. J. 1995. The issue of bycatch in Australia’s demersal trawl fisheries. Review
of Fish Biology and Fisheries 5:213-234. Layman, C. A. 2000. Fish assemblage structure of the shallow ocean surf-zone on the
eastern shore of Virginia barrier islands. Estuarine, Coastal and Shelf Science 51:201-213.
Mahon, R., S. K. Brown, K. C. T. Zwanenburg, D. B. Atkinson, K. R. Buja, L. Claflin, G.
D. Howell, M. E. Monaco, R. N. O’Boyle, and M. Sinclair. 1998. Assemblages and biogeography of demersal fishes of the east coast of North America. Canadian Journal of Fisheries and Aquatic Sciences 55:1704-1738.
Manion, M. M., R. A. West, and R. E. Unsworth. 2000. Economic assessment of the
Atlantic coast horseshoe crab fishery. Industrial Economics, Inc. Cambridge, Massachusetts.
Massuti, E. and J. Moranta. 2003. Demersal assemblages and depth distribution of elasmobrachs from the continental shelf and slope off the Balearic Islands (western Mediterranean). ICES Journal of Marine Science 60:753-766.
McCune, B, and J. B. Grace. 2002. Analysis of Ecological Communities. MjM Software,
Gleneden Beach, Oregon, USA. McCune, B. and M. J. Mefford. 2006. PC-ORD. Multivariate Analysis of Ecological
Data. Version 5. MjM Software, Gleneden Beach, Oregon, USA. McMillan, D. G. and W. W. Morse. 1999. Essential Fish Habitat Source Document:Spiny
dogfish, Squalus acanthias, Life History and Habitat Characteristics. NOAA Technical Memorandum NMFS-NE-150, Woods Hole, Massachussetts.
MD DNR (Maryland Department of Natural Resources). 2007. Tidal fisheries
management. Available: http://www.dnr.state.md.us/fisheries/management/tidal_man.shtml. (August 2007).

95
ME DMR (Maine Department of Marine Resources). 2007. The blue mussel in Maine.
Availble: http://www.maine.gov/dmr/rm/bluemussel.html. (August 2007). Meffe, G. K., L. A. Nielsen, R. L. Knight, and D. A. Schenborn. 2002. Ecosystem
Management: Adaptive, Community-based Conservation. Island Press, Washington.
Methratta, E. T. and J. S. Link. 2006. Associations between surficial sediments and
groundfish distributions in the Gulf of Maine-Georges Bank region. North American Journal of Fisheries Management 26:472-489.
Miglarese, J.V., C.W. McMillan and M.H. Shealy, Jr. 1982. Seasonal abundance of
Atlantic Croaker (Micropogonias undulatus) in Relation to Bottom Salinity and Temperature in South Carolina Estuaries. Estuaries 5:216-223.
Mikkelsen, T. 1988. The secret in the blue blood. Science Press, Beijing, China. Monterey Bay Aquarium: Seafood Watch. 2007. Seafood Guide. Available:
http://www.mbayaq.org/cr/SeafoodWatch/web/sfw_factsheet.aspx?gid=8. (August 2007).
MSFCMA (Magnuson Stevens Fishery Conservation and Management Act) (1996).
Magnuson Stevens Fishery Conservation and Management Act of 1976. Pub. L. No. 94-265. Available: http://www.nmfs.noaa.gov/sfa/magact. (June 2005).
Muir, W. C., B. Farren, and M. Barath. 1989. Integrated marine managemtn strategy for
the Middle Atlantic Bight. U.S. Environmental Protection Agency, Philadephia, Pennsylvania.
Munchow, A. and R. J. Chant. 2000. Kinematics of Inner Shelf Motions during the
Summer Stratified Season off New Jersey. Journal of Physical Oceanography 30:247-268.
NEAMAP (Northeast Area Monitoring and Assessment Program). 2003. Development of
a Cooperative State/Federal Fisheries Independent Sampling Program. ASMFC, Washington, D.C.
NEFSC (Northeast Fisheries Science Center). 2007. Status of Fishery Resources off the
Northeastern United States. Available: http://www.nefsc.noaa.gov/sos/species/. (August 2007).
NMFS (National Marine Fisheries Service). 1999. Ecosystem Principles Advisory Panel,
Ecosystem-based fishery management: A report to Congress by the Ecosystem Principles Advisory Panel. NMFS, Silver Spring, Md. Available: http://www.nmfs.noaa.gov/sfa/EPAPrpt.pdf. (April 2007).

96
NMFS. 2001. Sea turtle conservation; shrimp trawling requirements. Federal Register.
66: (6),1601-1603. NMFS. 2003. Length-weight relationships for 74 fish species collected during NEFSC
research vessel bottom trawl surveys, 1992 – 99. NOAA Technical Memorandum NMFS-NE-171, Woods Hole, Massachusetts.
NMFS. 2007a. NOAA Fisheries fact sheet: Shark management. Available:
http://www.nmfs.noaa.gov/sharks/FS_management.htm. (August 2007). NMFS. 2007b. Species of Concern: Dusky shark. Available:
http://www.nmfs.noaa.gov/pr/pdfs/species/duskyshark_detailed.pdf. (August 2007).
NOAA (National Oceanic and Atmospheric Administration). 2003. Evaluating bycatch:
A National approach to standardized bycatch monitoring programs. NOAA Technical Memorandum NMFS-F/SPO-66. United States Department of Commerce, NOAA, NMFS, Washington, D.C.
NOAA. 2005. Essential Fish Habitat: Essential Fish Habitat. Available:
http://www.nmfs.noaa.gov/habitat/habitatprotection/efh/. (May 2005). Norcross, B. L. and R. F. Shaw. 1984. Oceanic and Estuarine Transport of Fish Eggs and
Larvae:A Review. Transactions of the American Fisheries Society 113:153-165. Novitsky, T. J. 1984. Discovery to commercialization: the blood of the horseshoe crab.
Oceanus 27(1):13-18. Packer, D. B., S. J. Griesbach, P. L. Berrien, C. A. Zetlin, D. L. Johnson, and W. W.
Morse. 1999. Essential Fish Habitat Source Document:Summer flounder, Paralichthys dentatus, Life History and Habitat Characteristics. NOAA Technical Memorandum NMFS-NE-151, Woods Hole, Massachusetts.
Packer, D. B., C. A. Zetlin, and J. J. Vitaliano. 2003a. Essential Fish Habitat Source
Document:Little Skate, Leucoraja erinacea, Life history and habitat characteristics. NOAA Technical Memorandum NMFS-NE-175, Woods Hole, Massachusetts.
Packer, D. B., C. A. Zetlin, and J. J. Vitaliano. 2003b. Essential Fish Habitat Source
Document:Clearnose Skate, Raja eglanteria, Life History and Habitat Characteristics. NOAA Technical Memorandum NMFS-NE-174, Woods Hole, Massachusetts.
Perceira, J. J., R. Goldberg, J. J. Ziskowski, P. L. Berrien, W. W. Morse, and D. L.
Johnson. 1999. Essential Fish Habitat Source Document:Winter flounder,

97
Pseudopleuronectes americanus, Life History and Habitat Characteristics. NOAA Technical Memorandum NMFS-NE-138, Woods Hole, Massachusetts.
Phoel, W. 1985. Community structure of demersal fish on the inshore U.S. Atlantic
continental shelf:Cape Ann, MA to Cape Fear, NC. Doctoral dissertation. Virginia Institute of Marine Science, Gloucester Point, Virginia.
Pikitch, E. K., C. Santora, E. A. Babcock, A. Bakun, R. Bonfil, D. O. Conover, P.
Dayton, P. Doukakis, D. Fluharty, B. Heneman, E. D. Houde, J. Link, P. A. Livingston, M. Mangel, M. K. McAllister, J. Pope, and K. J. Sainsbury. 2004. Ecosystem-Based Fishery Management. Science 305:346-347.
Ramsay, K., M. J. Kaiser, P. G. Moore, and R. N. Hughes. 1997. Consumption of
fisheries discards by benthic scavengers: utilization of energy subsidies in different marine habitats. Journal of Animal Ecology 66(6):884-896.
Reid, R. N., F. P. Almeida, et al. 1999. Essential fish habitat source document:Fishery-
independent surveys, data sources, and methods. Mid-Atlantic Fishery Management Council, NOAA (National Oceanic and Atmospheric Administration) Technical Memorandum NMFS-NE-122. Dover, Delaware.
Reid, J.M., J. A. Reid, C. J. Jenkins, M. E. Hastings, S. J. Williams, and L. J. Poppe.
2005. UsSEABED:Atlantic coast offshore surficial sediment data release:U.S. Geological Survey Data Series 118, version 1.0. Available:http://pubs.usgs.gov/ds/2005/118. (June 2007).
Riska, B. 1981. Morphological variation in the horseshoe crab Limulus polyphemus.
Evolution 35 (4): 647 – 658. SEAMAP (Southeast Area Monitoring and Assessment Program). 2000. Results of
trawling efforts in the coastal habitat of the South Atlantic Bight, FY-2000. South Carolina Department of Natural Resources, Charleston, South Carolina.
SEDAR (Southeast Data, Assessment, and Review). 2003. Description of MARMAP
sampling. Available: www.sefsc.noaa.gov. (July 2007). Shepherd, G. R. and D. B. Packer. 2006. Essential Fish Habitat Source
Document:Bluefish, Pomatomus saltatrix, Life History and Habitat Characteristics (Second Edition). NOAA Technical Memorandum NMFS-NE-198, Woods Hole, Massachusetts.
Shuster, C. N. 1979. Distribution of the American horseshoe ‘crab’, Limulus polyphemus
(L.). Progress in clinical and biological research 29:3-26.

98
Shuster, C. N. 1982. A pictorial review of the natural history and ecology of the horseshoe crab Limulus polyphemus, with reference to other Limulidae. Progress in clinical and biological research 81:1-52.
Shuster, C. N. and M. L. Botton. 1985. A contribution to the population biology of
horseshoe crabs, Limulus polyphemus (L.), in Delaware Bay. Estuaries 8(4):363-372.
Song, Y. T., D. B. Haidvogel, and S. M. Glenn. 2001. Effects of topographic variability
on the formation of upwelling centers off New Jersey: A theoretical model. Journal of Geophysical Research-Oceans 106(C5):9223-9240.
Sosebee, K. A. 2000. Status of fishery resources off the Northeastern United States:
skates. NOAA/NMFS, NEFSC. Available: http://www.nefsc.noaa.gov/sos/spsyn/op/skate. (April 2005).
Sosebee, K. A. 2006. Status of fishery resources off the Northeastern U.S. NEFSC-
Resource evaluation and assessment division. Available: http://www.nefsc.noaa.gov/sos/spsyn/op/skate. (July 2007).
Sousa, P., M. Azevedo, and M. C. Gomes. 2005. Demersal assemblages off Portugal:
Mapping, seasonal, and temporal patterns. Fisheries Research 75:120-137. Stehlik, L. L., C. L. MacKenzie Jr., and W. W. Morse. 1991. Distribution and abundance
of four brachyuran crabs on the northwest Atlantic shelf. Fishery Bulletin 89(3):473-492.
Stein, A. B., K. D. Friedland, and M. Sutherland. 2004. Atlantic sturgeon marine bycatch
and mortality on the continental shelf of the northeast United States. North American Journal of Fisheries Management 24(1):171-183.
Stergiou, K. I., D. K. Moutopoulos, M. C. Soriguer, E. Puente, P. G. Lino, C. Zabala, P.
Monteiro, L. A. Errazkin, and K. Erzini. 2006. Trammel net catch species composition, catch rates and metiers in southern European waters: A multivariate approach. Fisheries Research 79:170-182.
Stewart, P. L. and S. H. Arnold. 1994. Environmental requirements of the sea scallop
(Placopecten magellanicus) in eastern Canada and its response to human impacts. Canadian Technical Report of Fisheries and Aquatic Sciences 2005. Dartmouth, Nova Scotia, Canada.
Tyler, A. V., W. L. Gabriel, and W. J. Overholtz. 1982. Adaptive management based on
structure of fish assemblages of northern continental shelves. Pages 149-156 in M. C. Mercer, editor. Multispecies approaches to fisheries management advice. Canadian Special Publication in Fisheries and Aquatic Science. Department of Fisheries and Oceans, Ottawa.

99
VA MRC (Virginia Marine Resources Commission). 2007. Fisheries Management.
Available: http://www.mrc.virginia.gov/fmac/fmoverview.shtm. (August 2007). Votier, S. C., R. W. Furness, S. Bearhop, J. E. Crane, R. W. Caldow, P. Catry, K. Ensor,
K. C. Hamer, A. V. Hudson, E. Kalmbach, N. I. Klomp, S. Pfeiffer, R. A. Phillios, I. Prieto, and D. R. Thompson. 2004. Changes in fisheries discard rates and seabird communities. Nature 427(6976):727-730.
Walker, R. L. 1988. Observations on intertidal whelk (Busycon and Busycotypus)
populations in Wassaw Sound, Georgia. Journal of Shellfish Research 7:473-478. Walls, E. A., J. Berkson, and S. A. Smith. 2002. The horseshoe crab, Limulus
polyphemus: 200 million years of existence, 100 years of study. Reviews in Fisheries Science 10:39-73.
Ward, P. and R. A. Myers. 2005. Shifts in open-ocean fish communities coinciding with
the commencement of commercial fishing. Ecology 86(4):835-847. Wenner, C. A. and G. R. Sedburry. 1989. Species composition, distribution, and relative
abundance of fishes in the coastal habitat off the southeastern United States. NMFS Technical Report No. 79. Springfield, Virginia.
Yanasaki, T., T. Makioka, J. Saito. 1988. Morphology. Pages 69-103 in K. Sekiguchi,
editor. Biology of horseshoe crabs. Science House, Tokyo. Young, A. M. 1991. Temperature-salinity tolerance of two latitudinal separated
populations of the longwrist hermit crab Pagurus longicarpus say (Crustacea, Decapoda, Paguridae). Ophelia 34(1):29-39.

100
Vita
Larissa J. Graham was born in Thomaston, Connecticut. She attended high school at
Holy Cross High School in Waterbury, Connecticut. Larissa graduated with a B.S. in
Environmental Science with a minor in Environmental health from the University of Connecticut
in May of 2002. From 2002 to 2004, she worked as a resource assistant for the Marine Division
of the Connecticut Department of Environmental Protection. In August of 2007, Larissa
completed her M.S. in Fisheries and Wildlife Sciences in the Department of Fisheries and
Wildlife Sciences at Virginia Polytechnic Institute and State University.