BY OKUNGU ZACHARY OBUMBA - erepository.uonbi.ac.ke
55
THE EFFECT OF DONOR FUNDING ON THE ACHIEVEMENT OF FREE PRIMARY EDUCATION IN NAIROBI COUNTY: A CASE STUDY OF KASARANI DISTRICT (2006-2010) BY OKUNGU ZACHARY OBUMBA „ Of.NWtOBI tflWf RXABETE LIBRARY A MANAGEMENT RESEARCH PROJECT SUBMITTED IN PARTIAL FULFILMENT OF THE REQUIREMENT FOR THE DEGREE OF MASTER OF BUSINESS ADMINISTRATION (MBA), UNIVERSITY OF NAIROBI. NOVEMBER 2011
Transcript of BY OKUNGU ZACHARY OBUMBA - erepository.uonbi.ac.ke

THE EFFECT OF DONOR FUNDING ON THE ACHIEVEMENT OF FREE PRIMARY EDUCATION IN NAIROBI COUNTY: A CASE
STUDY OF KASARANI DISTRICT (2006-2010)
BY
OKUNGU ZACHARY OBUMBA
„ Of.NWtOBI tflWf R XABETE
LIBRARY
A MANAGEMENT RESEARCH PROJECT SUBMITTED IN
PARTIAL FULFILMENT OF THE REQUIREMENT FOR THE
DEGREE OF MASTER OF BUSINESS ADMINISTRATION (MBA),
UNIVERSITY OF NAIROBI.
NOVEMBER 2011
DECLARATION
This management research project is my original work and has never been presented in
any other University or College for the award of Degree or Diploma or Certificate.
D61/60119/2010
Date..
This management research project has been submitted for examination with my approval
as the University Supervisor.
Mr. Mohamcd Mwncliiti
Lecturer, Department of Finance and Accounting
n

DEDICATION
This study is dedicated to my dear wife Lilian and children Eddy John Okungu and
Wendy Joano Nyabonga for their love, understanding and patience during the times I was
away from home and could not be with them because of my studies. God's blessings
should be upon all o f you.
It is also dedicated to my late parents. Jonathan Okungu Obumba and Mama Sela Alice
Awiti Okungu whose stewardship, strictness and unparalleled love showed us sound
parenting has values far beyond material wealth. Their sacrifice for our education shall
remain a permanent inspiration in our lives. May your spirits live forever.
in

ACKNOWLEDGEMENT
First and foremost, I thank the almighty God for the gift of life, good health and strength
throughout my studies. 1 appreciate and wish to extend my best wishes and gratitude to
all whose assistance and encouragement enabled me to complete this project.
Special thanks to my supervisor. Mr. Mwachiti for his invaluable input, dedication to this
work, expert support, knowledge, motivation, patience and encouragement. God bless
you mwalimu.
I would like to thank the entire Okungu family whose love and support has enabled me to
pursue my studies with a lot of fulfilment. Special thanks to my wife Lilian for taking
care o f me and our children without complaining during the course o f my study. Lilian,
you are a wonderful wife and a mother, God will always bless you. To my son Eddy John
and daughter Wendy Joano, you are great human beings who never wondered why daddy
could not help with your home work or accompany you to play at Uhuru Park. May the
almighty God reward both o f you with good health and strength as you grow to achieve
your dreams.
1 wish also to thank my friends and classmates for good times we shared together. 1
cannot forget to mention Kennedy Riaga for his invaluable academic support and for
being my friend. God bless you. To Nairobi City Council for providing me with the much
needed data, specifically my sincere appreciation goes to Jacinta o f Education
department.
Finally, to my children Eddy John and Wendy; this is my word to you, “Strong trees do
not grow with ease, the stronger the wind, the stronger the trees”. Thank you for always
withstanding the challenges o f life.
IV

ABSTRACT
This study sought to establish the effect of donor funding towards the achievement of free
primary education in Nairobi County: a case study of Kasarani District. Accordingly, the
objectives of the study was to determine whether the number of girls enrolled in public
primary schools within Kasarani District was related to donor funding and to establish
whether the performance o f pupils in the KCPE within Kasarani District was related to
donor funding. The survey research design was used for the study. The sample size
consisted of 17 schools in Kasarani District selected by way of random sampling and data
was collected using structured questionnaire over five year period to 2010. The analysis
of data collected was done by using the Statistical Package for Social Sciences (SPSS).
The findings of this study revealed that there is a relationship between girls’ enrolment as
a percentage of total enrolment and academic performance. However, this relationship is
only explained by 22.6% variation in donor funding as a percentage o f total funding. The
study further established that donor funding of -0.883 had no effect on girls’ enrolment
and academic performance. This shows that lack of donor funding neglects primary
school performance. Thereafter, one unit change in the number of girls enrolled resulted
to an increase of 1.776 in donor funding whereas the change in academic performance by
a unit mean score resulted into 0.003 increase in donor funding.
In view of the above findings, the study recommends that the government should work
closely with the donors in order to increase the enrolment of girls in public primary
schools. The government should also identify other factors that influence girls' enrolment
and academic performance apart from the donor funding, effort should then be put to
promote those factors.
v

TABLE OF CONTENTSDECLARATION.......................................................................................................................ii
DEDICATION..........................................................................................................................iii
ACKNOWLEDGEMENT....................................................................................................... iv
ABSTRACT..............................................................................................................................v
TABLE OF CONTENTS........................................................................................................ vi
LIST OF TABLES................................................................................................................. viii
LIST OF FIGURES................................................................................................................. ix
ABBREVIATIONS.................................................................................................................. x
CHAPTER O N E......................................................................................................................1
1.0 INTRODUCTION...............................................................................................................1
1.1 Background.......................................................................................................................... 1
1.1.2 Free Primary Education in Kenya.............................................................................3
1.2 Statement of the Problem....................................................................................................7
1.3 Objectives of the study....................................................................................................... 8
1.4 Importance of the study...................................................................................................... 8
CHAPTER TW O .....................................................................................................................9
2.0 LITERATURE REVIEW...................................................................................................9
2.1 Introduction.......................................................................................................................... 9
2.2 Theoretical Literature......................................................................................................... 9
2.3 Empirical Literature...........................................................................................................14
2.4 Summary of Literature Review ........................................................................................16
CHAPTER TH REE............................................................................................................... 18
3.0 RESEARCH METHODOLOGY.....................................................................................18
3.1 Introduction.........................................................................................................................18
3.2 Research design................................................................................................................. 18
3.3 Population of study............................................................................................................18
vi
3.4 Sample design.....................................................................................................................19
3.5 Data collection....................................................................................................................19
3.6 Data Analysis......................................................................................................................19
CHAPTER FOUR................................................................................................................. 21
4.0 DATA ANALYSIS, RESULTS AND DISCUSSION..................................................21
4.1 Introduction........................................................................................................................ 21
4.2 Descriptive Statistics of variables.................................................................................... 21
4.3 Correlation and Regression Analysis............................................................................... 23
4.3.1 Pearson Correlation coefficient................................................................................ 23
4.3.2 Goodness of Fit of the Models.................................................................................. 24
4.3.3 Regression Equations.................................................................................................26
CHAPTER FIVE................................................................................................................... 29
5.0 SUMMARY, CONCLUSIONS AND RECOMMENDATIONS................................ 29
5.1 Summ ary............................................................................................................................29
5.2 Conclusion......................................................................................................................... 30
5.3 Policy Recommendations................................................................................................. 30
5.4 Limitations of the Study................................................................................................... 31
5.5 Suggestions for further studies.........................................................................................31
REFERENCES.......................................................................................................................32
APPENDICES.........................................................................................................................38
Appendix I: Letter of Introduction.........................................................................................38
Appendix II: Letter of Authority............................................................................................ 39
Appendix III: Questionnaire....................................................................................................40
Appendix IV: List of Schools in Kasarani as at December 2010........................................42
Appendix V: K.CPE Performance...........................................................................................43
Appendix VI: Enrolment in Primary School: 2006 to 2010................................................ 44
Appendix VII: Donor Funding: 2006 to 2010.......................................................................45
vii
LIST OF TABLES
Table 4.1: Summary of Descriptive Statistics.......................................................................21
Table 4.2: Pearson Correlation.............................................................................................. 24
Table 4.3: Model Summary....................................................................................................24
Table 4.4: Regression Analysis..............................................................................................26
Table 4.5: Regression Coefficients........................................................................................ 26
Table 4.6: ANOVA..................................................................................................................26
Table 4.7: Regression Coefficients........................................................................................ 26
Vlll
LIST OF FIGURES
Figure 4.1: Scatter Plot- Donor funding/ Total Funding and Girls Enrolment/Total Enrolment................................................................................................................................. 22
Figure 4.2: Scatter Plot- Donor funding/ Total Funding and Academic Performance..... 22
Figure 4.3: Histogram.............................................................................................................. 28
Figure 4.4: Normal P-P Plot o f Regression Standard Residuals........................................28
IX

ABBREVIATIONS
EFA - Education for All
FPE - Free Primary Education
GoK - Government of Kenya
KESSP - Kenya Education Sector Support Programme
MOEST - Ministry of Education Science and Technology
MDGs - Millennium Development Goals
SMCs - Schools Management Committees
TIQET - Totally Integrated Quality Education and Training
UPE - Universal Primary Education
x

CHAPTER ONE
1.0 INTRODUCTION
1.1 Background
Free Primary Education refers to the access to education by all children regardless of
their economic, political or social background (UNESCO, 2000). The World Conference
on Education for All (EFA) held in 1990 made it understood that by making primary
education free it would include children from poor families and thereby perhaps become
universal. Article 1 of the World Declaration on Education for All adopted at the
conference clearly states that “Every person—child, youth and adult— shall be able to
benefit from educational opportunities designed to meet their basic learning needs”,
focusing on value, significance, and effects of education for individuals.
The Dakar Framework for Action of 2000 set the goal with the statement “Ensuring that
by 2015 all children, particularly girls, children in difficult circumstances and those
belonging to ethnic minorities have access to and complete free and compulsory primary
education of good quality.” This was further reflected in the Millennium Development
Goals (MDGs).
Over the past decade several countries in Sub-Saharan Africa have abolished primary
school tuition fees typically as part of renewed attempts to improve their education
systems which have been in decline, and even suffered reduced enrolments after the
initial growth following Independence. Whereas in the eighties and early to mid-nineties,
cost-sharing had been a policy promoted by international financial institutions such as the
World Bank, the direct (and indirect) costs to parents of their children's education
became obstacles to their attendance and continued enrolment. The inability' of parents to
afford such costs fell on girls disproportionately, typically being the first to be pulled out
or allowed to drop out of school (UNESCO. 2004).

It has been observed that children from families with more socio-economic resources
have a higher probability o f being in school as compared to those from families with less
socio-economic resources. This is because direct costs associated with education such as
fees, books and uniforms are less likely to be an obstacle to wealthier families. The
opportunity costs o f children not being able to help at home, at the family farm or by
earning additional income through child labour are less important to them (Basu, 1999).
Education participation for children coming from poor families and the girls is
determined by both quantity and quality of schools (Buchmann & Hannum, 2001;
Colclough et al., 2000; Ersado, 2005; Handa. 2002: Michaelowa, 2001; Vasconcellos,
1997). The case for quantity is obvious because when there are no schools or teachers
available; children are not able to acquire education. Also the distance to school is
expected to play a role. Colclough et al. (2000) conclude that schools are mostly visited
by children living in the neighbourhood.
Quality is also important because it determines to what extent children benefit from going
to school. When parents realize that their children gain less from low quality education,
they may be less willing to send their children to school (Buchmann & Brakewood, 2000;
Colclough et al., 2000). An often used quality indicator is the Pupil Teacher Ratio, which
indicates how many pupils are attended to by each school teacher in a district, and hence
indicates average class size (UNESCO. 2004).
Education offers a vital means to unlock and safeguard other human rights and also
provides some of the scaffolding necessary to achieve the rights to good health, liberty,
security, economic w'ellbeing, and participation in social and political activities. Literacy
is important as it gives access to and enjoyment of all human rights. Through good
education, the imbalances in life chances are lessened (UNESCO. 2002). Education also
plays an important role in helping people to become literate, be able to numerate, become
problem solvers, achieve self-actualization, economic sufficiency, civic responsibility,
and satisfactory human relationships (Brimley & Garfield, 2005).
Good education offers the skill and knowledge that is necessary to move a nation forward
both economically and socially. Good education is vital in improving productivity.
2
creativity in arts, invention in the sciences, perpetuation of cultural values, and reduction
of negative practices such as child labour and forced prostitution (Aduawa-Ogiegbaen.
2006). All over the world, nations have had to review their educational systems to bring
about the most desired change and development because everybody has come to realize
that education is the major instrument for social change (Aluede. 2009).
Educational achievement and economic success are clearly linked just as education is
linked to the health of a nation (Dike, 2002). Literacy and education influence social
welfare through indirect effects on health, fertility, and life expectancy. Education
engenders in the individual a continuous development of the physical, mental, and
spiritual life. In all its forms, education seeks not only to transform natural resources for
the benefit of humanity, but also generates skills and techniques for the solution to the
problems of humanity and for socioeconomic and cultural transformations (Ajuzie,
2001). Literacy and schooling are vital for the technical advances and growth and must
be encouraged for future research and development (Galbraith, 1984).
Education helps in creating professionals and technicians needed to keep the society
functioning. Literacy promotes national progress as young people are trained for
responsible careers which impact their countries tremendously (Taylor- Kamara, 2010).
When any nation educates its people, it serves the good of the entire country. Citizens
who are educated have a sense of purpose and the confidence to pursue careers that add
stability to their nation (Taylor-Kamara, 2010). Education helps people to develop high
cognitive powers for making good decisions. It acts as a formative agent in shaping the
character, attitudes, and values of a child. It is a transmission agent of passing knowledge,
experience, and skill from one generation to another (Taylor-Kamara, 2010).
1.1.2 Free Primary Education in Kenya
Since independence in 1963, the Kenyan government has faced the challenge of
education system through commissions, committees and task forces. The most significant
government reports and commissions included The Ominde Report of 1964, The
Gachathi Report of 1976, The Mackay Report of 1981, The Kamuge Report of 1988 and
The Koech Report o f 2000 (Mutiso, 2011). These initial reports aimed at policies
3

fostering national unity and creation of sufficient human capital and were adopted from
the colonial government. The reports in the 1980s were more focused on redefining
education to foster national unity, social, economic and cultural aspirations of Kenyans
(Mutiso, 2011). Education financing, quality and relevance were introduced in the 1990s.
In 2000, the Commission o f Inquiry into the Education System of Kenya (The Koech
Report, 2000) recommended the Totally Integrated Quality Education and Training
(T1QET). It outlined ways and means of enabling education to facilitate lifelong learning,
national unity, and mutual social responsibility, accelerated industrial and technical
development, while responding to changing circumstances (MOEST, 2005). Whereas the
government did not adopt the TIQET program, some of its core recommendations such as
curriculum rationalization were adopted and implemented.
In 2002, the NARC government implemented the FPE policy, which was a campaign
pledge to the voters through MOEST. The FPE initiative focused on attaining Education
for All (EFA) and in particular, Universal Primary Education (UPE). And as was
expected in a country where a substantial proportion of children were out of school, the
response was overwhelming. In many schools, the head teachers found themselves with
more children to enroll than their capacity could hold. Due to the limited space and
facilities, the heads turned many children away. Since-the government had not given an
age limit, even those who were 'over-age' were enrolled and this worsened the congestion
in schools (UNESCO, 2005). Key concerns were access, retention, equity, quality and
relevance and internal and external efficiencies within the education system (MOEST,
2005). Most classes were too large to be handled by a single teacher. On average, the
teacher: pupil ratio in most schools was 1:50. This had a lot o f implications on teaching
and learning. The teachers were not able to give individual attention to the learners,
especially to the slow ones, and this made it difficult for schools to offer quality
education. Teachers were also unable to take full control of classes. Indiscipline was.
therefore, rampant in schools (UNESCO, 2005).
The FPE implementation in 2003 was critical to attaining the EFA as a key objective to
realizing the UPE goal (MOEST, 2005). The goal o f the government was to have
4

education and training for development translated Elimu Bora Kwa Maendeleo. The
MOEST is mandated with this mission and it works with the stakeholders to provide,
promote and coordinate quality lifelong education training and research for Kenya’s
sustainable development and responsible citizenry. The ministry is responsible for
providing appropriate regulatory framework, develop policies and guidelines, provide
support, mobilize resources for education sector inputs and coordinate human capital
development through education and training. The overall goal o f MOEST and the
government is to achieve EFA by 2015 in tandem with international commitments
(MOEST, 2005).
Nyamute (2006) notes that the current cost of FPE is beyond the normal education
budget allocation. The fact that the country's economy has not been performing as
expected in recent year’s means that it cannot support the realization of the UPE goals
without the infusion of outside funds. Yieke (2006) adds that after the initial euphoria, it
was noticed that there was lack of a sustained and comprehensive communications
strategy for FPE. There was lack of consultation and information on the roles of various
key stakeholders. As a result of this, there was confusion amongst teachers, parents,
school committee members, sponsors and local donors. At the same time, there was lack
of clear guidelines as far as FPE was concerned, and many issues were rushed without
these being addressed adequately.
Prior to the introduction of FPE, education financing was cost-shared by the government,
parents and communities. The Government financed teachers' and administrators'
salaries as well as some school facilities, while parents and communities paid for tuition,
textbooks, materials, examinations and infrastructure. In 2003, the Government
introduced the FPE, making primary education free (UNESCO, 2005).
Kenya's level of investment in education is relatively high. Public expenditure on
education as a percentage o f GDP is 6.3%, higher than the average of high-income
countries (5.2%); 22.5% of total government expenditure is on education, more than in
high-income countries. However, public expenditure per pupil is highly skewed, with less
than 1% of GDP per capita spent on primary education compared with 256.7% on tertiary
education (UNESCO, 2005).
5

Though the Kenyan government increased the allocation o f education financing to
approximately 17 percent o f the national budget from 2003 to date, the FPE programme
is still strongly supported by donor funding. The UK, World Bank, Canada and UNICEF
have been providing ‘pooled’ funding directly through the government to the Kenya
Education Sector Support Programme (KESSP). The UK pledged $88.8 million (Kshs.
6.75 billion) over a five-year period (starting in 2005) and the US $7 million (Kshs. 532
million). UK’s department for International Development (DfID) announced support of
£55 million (Kshs 7 billion) over five years (2005 - 2010) to KESSP. An additional grant
of Kshs. 582 million was agreed in 2009 to specifically target improving water/sanitation
facilities for the poorest schools. Between 2005 and 2008. Kenya received $21 million
(Kshs. 1.6 billion) in Fast Track Initiative (FTI) Catalytic Fund Grants, a World Bank
basket fund. The World Food Programme ($13.9 million) and OPEC ($9.9 million) too
have contributed to making the programme a success (Karemesi, 2010).
The over reliance on donor aid to run Kenya's free primary education programme is a
cause for concern. The cost o f providing free primary education is beyond the scope of
the ordinary education budget, economic performance has not been strong and donor
finance is often temporary. This financing may not be sustainable (Karemesi, 2010).
The current cost of FPE is way beyond the normal education budget allocation. It is also
a fact that the country’s economy has not been performing well in recent years and
cannot support the realization o f the UPE goals without the infusion o f outside funds. For
the country to sustain universal access there will be a need for economic growth to
generate public funds for education. Otherwise, prioritizing UPE is most likely to take
away from the provision for other sectors of education as well as from the health sector
(Sifuna, 2005).
The study will be conducted in Kasarani District, which is one of the seven districts in
Nairobi County. There are 26 public primary schools in Kasarani District (see appendix
IV). Kasarani District has been selected for study because it is home to both middle and
low class city residents and also due to ease of accessibility by the researcher. These
aspects make the schools in the district a representative of the public schools in Nairobi
County.
6

1.2 Statement of the Problem
Primary school education in Kenya is free and the Kenyan government gives a certain
fixed amount of money for every school-going child (MOEST, 2003). This policy of Free
Primary Education (FPE) has seen a tremendous increase in enrolment of school going
children from 5 million in January 2003 to 8 million by May 2009 (World Bank Report.
2009). This rapid increase in numbers of pupils has created constraints and challenges to
successful implementation o f FPE in Kenya, thereby compromising the performance and
quality of standards (MOEST 2003).
The studies done by Muthwii and OWN and Associates in 2004 reported that the
implementation of FPE policy in 2003, increased the net enrolment ratio by a further
22.3%. However, as in the 1970s. the implementation of free primary education was
beset with difficulties. Rapid expansion in enrolment exacerbated problems of teaching
and learning facilities, increased classroom congestion, and raised teacher: pupil ratios.
Although the Kenyan government raised its education budget in 2003-2004 by 17.4%
and was strongly supported by donor funding in its free primary education initiative.
Muthwii (2004) raises questions about the sustainability of the policy.
There are several organizations that play a central role in financing primary education in
Kenya. In particular, international (UNESCO, CIDA) and religious organizations that
sponsor schools are an important source of finance for the schools. There are also NGOs
that actively provide funds for the policy advocacy, review, development of schools and
special programs such as education of the girl-child, training and in-servicing of school
heads and teachers. The approaches, concentration, focus and volume of support varies
from one organization to another (Yetu E, 2003).
Although donor funding is perceived as key to achieving free primary education in
Kenya, little has been written or researched on its effect towards achieving the free
primary education in Nairobi County. Muchemi (2005) studied the capability gap and
challenges encountered in the implementation of free primary education strategy in Kieni
West Division. Shishanya (2005) focused on the implementation process of free primary
education strategy in Kenya, whereas Kariuki (2007) evaluated the financial management
7

practices on free primary' education funds. These studies did not focus on the role o f
donors.
This research project endeavoured to evaluate the effect donor funding had towards the
achievement of Free Primary Education in Nairobi County.
1.3 Objectives of the study
To determine whether the number of girls enrolled in public primary schools within
Kasarani District is related with donor funding.
To establish whether the performance of pupils in the KCPE within Kasarani District is
related to donor funding.
1.4 Importance of the study
This study is important for the following reasons. First, it will provide an understanding
of the extent of donor funding towards the implementation of free primary education.
Secondly, through the study, it will be established whether the achievement of free
primary education in Nairobi County is reliant on donor funding. Thirdly, this study will
be used for future research in determining the appropriate levels of relationship between
the government and the donor communities in the education sector.
8

CHAPTER TWO
2.0 LITERATURE REVIEW
2.1 Introduction
This chapter summarizes the information from other researchers and commissions who
have carried out their research in the same field o f study. It will provide the reader with
an account of how free primary education has evolved over the years and also offer
insight into the problems still being encountered with the implementation of free primary
education.
2.2 Theoretical Literature
Foster (1982) argues that most post colonial states seems committed to national policies
in which education for all (EFA) and the free education at the primary' level is
guaranteed. Further, he argues that private and social rates o f return are higher at the
primary level than at any other level. Coleman (1990) summarized the importance of
education in developing countries by declaring, “As is the state, so is the school- what
you want in the state, you must put in the school”.
The belief by the Kenyan government that there is a link between education and
economic development, is evident in the first 5-year National Development Plan (1964—
1969) and in subsequent National Development Plans (1970-1974; 1974-1978; 1979—
1983; 1984-1988; 1989-1993; 1997-2001; 2002-2008) as well as in the Sessional Paper
No. 10 which also triggered policies of Universal Primary Education. Although it was
believed that true economic value of education could only be realized through the
expansion of secondary education, the government was sympathetic to the view of the
Kenya Education Commission Report of 1964-1965 (Ominde Commission Report) that
primary education was fast becoming a minimum basic educational requirement. The
Kenya Education Commission (Ominde Commission) had also recommended the
abolition of racially segregated schools and strongly advised that the government should
take full charge in the formulation of education policies.
9
The ruling KANU party had committed itself to free primary education by the end of the
decade and in 1971 a presidential decree abolished tuition fees in the most geographically
disadvantaged areas and. in 1973. in all areas for Grades 1 to IV with a uniform fee of
Sh.60 (US$80 pence) imposed for Grades V, VI. and VII throughout the country
(Republic of Kenya, 1964; NDP. 1974-1978). It was anticipated that these measures
would result in a significant increase in enrolment in primary education. Although school
fees had been abolished, no countermeasures were put in place to replace lost revenue,
and consequently, primary schools resorted to the use of a building levy that in most
cases turned out to be higher than the school fees charged previously. Enrolments initially
doubled in most districts following the abolition of school fees but fell back to their
original levels because of the introduction of the building levy (Muthwii, 2004).
The fourth National Development Plan (1979-1983) was released under a new political
leadership. Jomo Kenyatta who was Kenya's founding President, died in August 1978
and was replaced by Daniel Arap Moi, his Vice President. President Moi continued with
the policies of his predecessor under the KANU banner of Fuata Nyayo (follow the
footsteps) by maintaining universal primary education as a standing educational objective
of his new government. Although UPE had not been achieved, enrolment had grown
from less than 50% in 1963, the year Kenya gained independence, to more than 85% by
1978 (Republic of Kenya. 1979; Republic of Kenya's NDP, 1979-1983), the language
had shifted from that of emphasizing secondary education to that of recognizing primary
education as the foundation of economic and national development. The following
statement illustrates this, “The primary stage of education is the most important for any
child since it is here that basic knowledge is given to the child and foundations for an
economically productive and satisfying life are laid” (Republic of Kenya. 1979; Republic
of Kenya's NDP, 1979- 1983). For once, the national education policy was in agreement
with the international goal. The Plan brought forward what had been steady UPE progress
by stating the government’s policy to provide universal primary education of 7 years free
of charge to all children of primary-school age. The government also aimed to abolish
building and other school funds in primary schools and to provide free milk to primary
school children throughout the country (Republic o f Kenya, 1979; Republic of Kenya’s
NDP. 1979-1983).
4
10
During Moi's leadership, primary education continued to experience rapid growth, with
Kenya achieving near universal primary education by the 1990s. Kenya's achievement in
the development o f basic education was a showcase among Sub-Saharan African
countries at the World Conference on Education for All in 1990. However, in the years
that followed, many of the gains made were lost or reversed for a number of reasons,
including economic decline and the introduction of “cost-sharing.” Enrolment and
participation rates at the primary level declined between 1990 and 2000 and transition
and completion rates stagnated. Gross enrolment at the secondary level also declined and
gender and regional disparities widened, whereas children with special needs remained
under enrolled. With this background, the National Alliance Rainbow Coalition (NARC)
Government, which was elected in 2002, pledged to provide free primary education for
all in its 2002 manifesto ( OWN and Associates, 2004).
Consequently, Kenya (re)introduced free primary education in 2003 with a view to
establishing “universal primary education" and meeting the EFA and MDG target of
universal access by 2015. An interim target o f a net enrolment rate of 85% was
established for 2005 (Vos et aL , 2004). Amongst the strategies adopted for meeting the
EFA goals at the primary level was to legislate and enforce free and compulsory primary
education (Ministry of Education Science and Technology, 2001). According to the
Kenya Education Act (2001), every child in Kenya is entitled to Education, the provision
of which is the responsibility of the government and the parents (section 7(1)). In
addition, every child is entitled to free basic education, which is compulsory in
accordance to section 28 of the UN convention on the rights of the child (section 7(2)).
Following the implementation of FPE policy in 2003, the net enrolment ratio in Kenya
grew by a further 22.3%. However, as in the 1970s, the implementation of free primary
education was beset with difficulties. Rapid expansion in enrolment exacerbated
problems of teaching and learning facilities, increased classroom congestion, and raised
teacher: pupil ratios. These problems, again as in the 1970s, are leading to high dropout
rates and have affected the inflow of pupils in the 2nd year of implementation: 2004.
Districts that registered a 20% increase in enrolment in 2003 hardly recorded more than
5% in 2004 (Muthwii, 2004; OWN and Associates).
11
UNIVERSITY Of IM ROtlI AUICD > 1 H T I I
Although the Kenyan government raised its education budget in 2003-2004 by 17.4%
and was strongly supported by donor funding in its free primary education initiative,
Muthwii (2004) raises questions about the sustainability o f the policy. The cost of
providing FPE is beyond the scope of the ordinary education budget, economic
performance has not been strong, and donor finance tends to be temporary. She concludes
that the FPE initiative of 2003, similar to interventions in the past, was pursued as a
matter of political expediency and was not adequately planned resulting to dropout and
falling educational quality. In view of these challenges, she considers the attainment of
sustained FPE an illusion in the context of Kenya (Muthwii, 2004). Mukudi (2004) also
addresses the issues of sustainability with regard to universal primary education in
Kenya, including public resource capacity and educational quality. He asserts that
economic performance in Kenya is a limiting factor and might be considered
disappointing and concludes that without adequate investment, however, the synergies
between educational access, economic growth, and poverty reduction may not be
capitalized on and a vicious cycle may be observed in which global competitiveness
becomes elusive in the absence of investment in knowledge creation. Vos et al. (2004)
argue that given the financial constraints that Kenya faces, meeting the EFA target will
require a more efficient resource allocation within the education sector and that the cost
of the government bearing all household education costs would require a 91% budget
increase or 0.8% of GDP and result in a net enrolment rate (NER) o f 94% (Vos et al.,
2004). The authors conclude that within a tight budget, cost-effectiveness considerations
make a considerable difference (Vos et al., 2004).
The Ministry of Education established a system in which all 18,000 public primary
schools received capitation grants straight from the Ministry through bank accounts. The
annual amount is 1,020 Kenyan shillings (14 US dollars) per pupil, which is earmarked
for purchasing educational materials, such as textbooks and notebooks, as well as for the
repairing of school facilities and to ensure quality assurance. The total grant amount is
determined by the number o f pupils enrolled, whereby, large-scale schools enjoy
advantages over schools with fewer pupils. Along with abolishing school fees, the
government strictly prohibited each school from collecting levies or any money from
parents. In the national budget for fiscal year 2005/06 (Kshs 360,087 million),
12

expenditure for the Ministry o f Education (Kshs 94,927 million) accounted for 26.4% of
the total budget and much o f it was provided by donor agencies (Ministry of Education.
2006). It is in this regard that serious consideration is being given to the need for the
diversification of funding through collaboration and partnership with other stakeholders
in order to realize the objectives of KESSP (Ministry o f Education. Science and
Technology. 2005).
The Kenya Education Sector Support Programme 2005-2010 (KESSP) was launched in
July 2005, as the master education plan for the country. The objective o f KESSP is to put
into operation a new policy document, the Policy Framework for Education. Training,
and Research. The World Bank provided a supplementary 80 million US dollars to
support the plan in addition to its funding for the support of free primary education
(World Bank 2006). In fact, KESSP comprises 23 investment programs, 18 of which are
related to UPE, and also advocates for the provision of educational opportunities to all
Kenyans at various levels (Ministry of Education, Science and Technology 2005).
2009 was the seventh year o f implementation of Free Primary Education (FPE) with
support from Development Partners and the Kenya Education Sector Programme. In
order to enhance access: more funds were injected into the primary school infrastructure
by the Ministry of Education. Constituency Development Fund. Local Authority Transfer
Fund and community contributions. The outcome of which was a rise in classroom
capacity in primary schools from 209.000 classrooms in 2008 to 220,000 classrooms in
2009, an increase of 5.3%. The enrolment rose further by 2.3% from 8.6 million pupils in
2008 to 8.8 million in 2009 in primary education for both public and private schools.
Enrolment in Non Formal Educational institutions also increased from 143,409 in 2008 to
163,340 in 2009 with majority enrolled in Nairobi slum areas and the ASAL districts. In
2009, there were 1,345 Non Formal schools, a majority teaching the formal primary
school curriculum and only a third offering NFE learning curriculum (Economic Survey,
2010).
13
2.3 Empirical Literature
A case study by Kipkoech and Kyalo (2010) on the management challenges facing
implementation of FPE in primary' schools in Keiyo District established that primary
school management face challenges in the implementation o f the program. The head
teachers identified delay in releasing of funds by the government as a major challenge
which makes it very difficult for them to project and plan ahead. Another challenge noted
by head teachers was conflict with parents which was precipitated by parents' resistance
to any attempts to have them supplement the governments' effort in funding of the
primary schools. The resistance was due to the misconception that education is free;
hence the government should fund it. In conclusion. Kipkoech and Kyalo noted that the
government should avail funds to schools at the beginning of the year to enable school
managers to plan ahead. They recommend further sensitization of the public to ensure
more support from the parents and other stakeholders on FPE. They suggest that the
government should also consider increasing the funds meant for the co- curricular
activities. A system should also be established where incase of misappropriation of funds
in the school, all the members of the management committees are held accountable
instead of punishing the head teacher alone.
U4 Anti corruption Resource Centre in 2003 conducted a case study titled Strengthening
of Primary Education Project (SPRED Phase III) on behalf of DFID. The purpose of
SPRED III was to improve access of poor children to better quality primary education.
Outputs of the study included improved provision o f basic teaching/learning materials to
poor children on an equitable basis, improved policy planning and sector management,
increased devolution of responsibility for school management to school level and
improved monitoring and evaluation of the textbook programme at school and district
level. Key outcomes and impacts of SPRED phase III included success in leveraging
more effective allocation of the government education budget with increased non-salary
expenditure, specifically a 25% average annual increase in GoK expenditure on textbooks
leading to more books available for children across the country. Until January 2003,
direct costs of primary education to parents remained prohibitive for many. However,
within one year of schools receiving funding for books, NGO and Inspectorate
14
monitoring teams reported modest but significant increases in attendance (up 3% on
average in the year following first receipt of books) and retention, more highly motivated
teachers and pupils, and some evidence of improved learning achievement. With this
support, declining trends in enrolment appeared to have halted, with no change, or
increases varying between 2% and 23%, reported in June 2002 by schools monitored.
The sound design and successful implementation o f SPRED III proved very attractive to
other external funding agencies and in response to the new government initiative for FPE,
the World Bank agreed an ‘emergency’ project to disburse £33 million as a grant from
July 2003. In addition, SIDA (Sweden) provided £3.3 million and CIDA (Canada)
provided £3.4 million through DFID.
A research study commissioned by the William and Flora Hewlett Foundation and
reported by Overseas Development Institute in February 2010. was based on a large
number of semi structured interviews with a variety of donor agencies, including
bilaterals, multilaterals, foundations and NGOs, as well as case studies on two countries -
Mali and Uganda. The findings outlined why education sector had not attracted the
necessary funding and suggested ways in which external support for basic education
could be increased. The study established six key factors that appear to influence donor
decisions around financing basic education. The most significant are donor prioritization
and leadership, evidence and advocacy and aid architecture. In the case of basic
education, the influence of top leadership was found to be particularly important for some
donors, such as the UK and the World Bank. Furthermore, political and foreign policy
concerns were influential. Other findings were lack of donor coordination, ineffective
division of labour and unpredictability of aid which continues to limit the scale and
effectiveness of financial support to basic education. Lack of a strong global coordination
mechanism was also found to be a particular problem for the education sector. Despite its
strong record on monitoring progress towards the EFA goals through its flagship Global
Monitoring report, UNESCO has been unable to provide the leadership and global voice
needed to raise additional financing for the sector.
15
A study commissioned by UNESCO in 2003/04 to assess whether free primary education
(FPE) had turned the tables on the decline of primary school enrolments was based on
five countries; Kenya, Malawi, Tanzania. Uganda and Zambia. These countries provided
a range of experience dating back to 1994, when Malawi introduced free primary
education, up to the present day, when in 2003, Kenya followed suit. The review of the
countries' experiences with FPE revealed that abolishing tuition fees overcame some of
the obstacles to attending school, as can be judged by the gross and net enrolment rate
increases experienced in all the countries following FPE. The five countries had all
realized the importance of educational quality; the challenge had been to create
sufficiently quickly the increases in human resources, the networks o f communication,
management practices and behaviour that could reinforce, complement and build on the
increased physical resources that had been provided, be they classrooms, textbooks, or,
indeed, teachers. In all five countries, the governments were dependent on external
finance for funding FPE, and this looked likely to be the case for the mid- to long-term.
However the lessons emerging from this study that needs to be highlighted are as follows;
First of all, it is clear that whilst implementing free primary education is seen as a sound
macro policy, it needs to be integrated within a poverty reduction (and economic growth)
strategy that anticipates and provides for the forward and backward linkages of the
expanded system as well as o f those children afforded education. This has implications
for textbook production and distribution, school construction and maintenance, teachers’
conditions of service, the relevance of the curriculum, the role that examinations play, the
provision of early childhood education as an important route into primary education and
the transition rates to post-primary education.
2.4 Summary of Literature Review
Kenya first attempted to achieve Universal Primary Education in 1964 through a 5 year
National Development Plan (1964-1969) and also in the subsequent National
Development Plans. This attempt was supported by views of the Kenya Education
Commission Report o f 1964- 1965 (Ominde Commission Report). Through presidential
decrees o f 1971 and 1973, the government abolished tuition fees for grades 1 to IV and
16
imposed a uniform fees of Kshs 60 (US$ 80 pence) for grades V, VI and VII (Republic o f
Kenya, 1964; NDP, 1974-1978). Failure to put in place countermeasures to replace the
lost revenue, primary schools resorted to the use o f building levy that turned out to be
higher than school fees previously charged and this affected the enrolment of pupils
which had initially doubled in most districts (Muthwii. 2004).
Kipkoech and Kyalo in their 2010 studies on free primary education identified delay in
release of funds by the government and resistance by parents to supplement the
government’s effort in funding of the primary schools as some of the problems faced,
whereas U4 Anti Corruption Resource Centre established in 2003 that donors like world
bank, SIDA and CIDA were more willing to offer grants for the provision of basic
teaching/leaming materials. The Overseas Development Institute reported in February
2010 that donor prioritization and leadership is one of the six factors that influence donor
decisions around financing basic education. Others are evidence and advocacy and aid
architecture. UNESCO in 2004 reported that the governments in all five countries they
studied were dependent on external finance for funding FPE, and this looked likely to be
the case for the mid- to long-term.
Though the Kenyan government increased the allocation of education financing to
approximately 17 percent of the national budget from 2003 to date, the FPE programme
is still strongly supported by donors by providing ‘pooled’ funding through the
government to the Kenya Education Sector Support Programme (KESSP) (Karemesi,
2010).
This research is therefore to evaluate the effect of donor funding towards the achievement
of free primary education in Kasarani District.
17
CHAPTER THREE
3.0 RESEARCH METHODOLOGY
3.1 Introduction
This chapter outlines the overall methodology used in the study. It includes the research
design, population o f the study, sample design, data collection and data analysis.
3.2 Research design
A survey research design was employed in order to evaluate the extent o f donor funding
towards the implementation o f free primary education in Kenya.
The quantitative methodology was used in establishing the level o f donor funding
towards the achievement of free primary education within Nairobi County. It was also to
enable the researcher to determine the extent to which donors had contributed directly or
indirectly towards the achievement of free primary education in Nairobi County.
3.3 Population of study
A population is defined as the total collection of elements about which we wish to make
some inferences. According to Cooper and Schindler (2003), a population element is the
subject such as a person, an organization, customer base or the amount of quantitative
data on which the measurement is being taken. The target population for this study
consisted of all the public primary schools in Kasarani District; Nairobi County.
According to the records at the City Council of Nairobi, there were 26 public primary
schools in Kasarani District as at December 2010.
Kasarani District had been selected for study because it is home to both middle and low
class city residents and also due to ease of accessibility by the researcher. These aspects
made the schools in the district a representative of the public schools in Nairobi County.
18

3.4 Sample design
Public primary- schools in Kasarani District were stratified into two zones. The samples
were then picked from each zone. A random sample of 17 public primary schools was
selected from the two zones comprising 65% of the target population. The table below
shows the number of schools in each of the zones.
Sampling frame for schools
Kasarani DistrictRuaraka Zone (13schools) Sample (lOschools)
Kahawa Zone (13schools) Sample (7schools)
3.5 Data collection
This study used both primary and secondary data. The secondary data consisted of donor
funding and budgetary allocations towards the achievement of free primary education in
Kenya and were obtained from the Ministry of Finance and Education. The primary data
was collected from the 17 sampled public primary schools through structured
questionnaire by way o f drop and pick later method.
3.6 Data Analysis
Statistical package for social scientists (SPSS) software version 17 was used to analyze
the quantitative data. Pearson Correlation Analyses was used to examine the relationship
between dependent variables; Donor funding/ Total Funding and the independent
variables (Girls Enrolment/Total Enrolment and Academic Performance).
Y = a + P1X 1 + P2X2+ e;
Where:
Y= Donor Funding,' Total Funding (represents part o f the funding attributable to donors)
X l = Girls Enrolment/Total Enrolment (represents gender parity brought about by donor
funding)
19

X2 Academic Performance (measured by the average marks attained by the school in
KCPE per pupil; school mean scores)
a = Constant and
P = Beta Coefficient
e = error term
20
CHAPTER FOUR
4.0 DATA ANALYSIS, RESULTS AND DISCUSSION
4.1 Introduction
This section covers the analysis o f the data, discussions and interpretation. The chapter
commences with the descriptive statistics which gives the exploration of the variables
used in the analysis. Then, Pearson correlation coefficients of dependent variable and
independent variables are reported. Regression analysis results highlighting the model
summary, analysis of variance and regression coefficients are reported at the end of the
chapter.
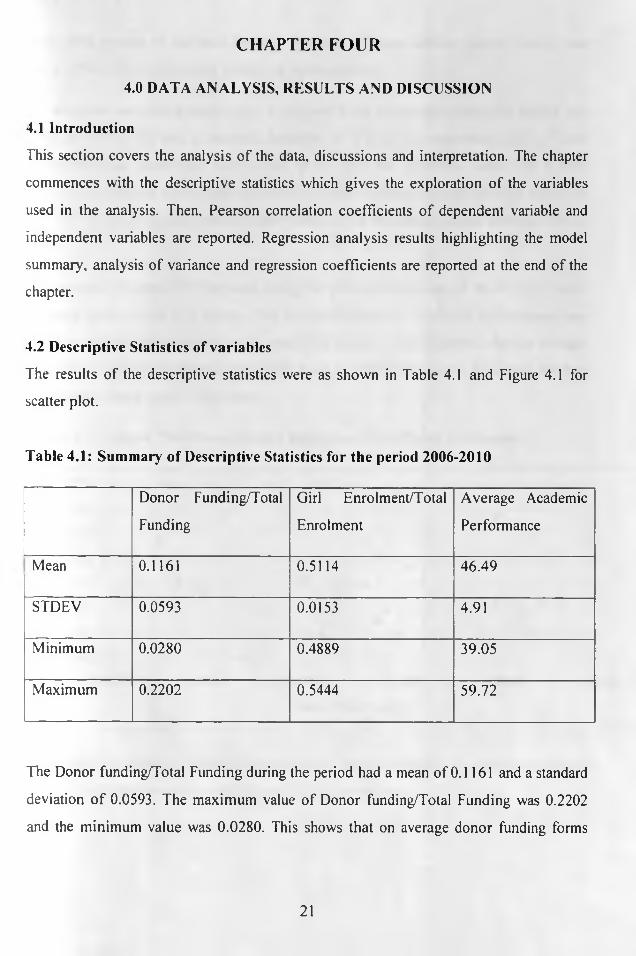
4.2 Descriptive Statistics of variables
The results of the descriptive statistics were as shown in Table 4.1 and Figure 4.1 for
scatter plot.
Table 4.1: Summary of Descriptive Statistics for the period 2006-2010
Donor Funding/Total
Funding
Girl Enrolment/Total
Enrolment
Average Academic
Performance
Mean 0.1161 0.5114 46.49
STDEV 0.0593 0.0153 4.91
Minimum 0.0280 0.4889 39.05
Maximum 0.2202 0.5444 59.72
The Donor funding/Total Funding during the period had a mean of 0.1161 and a standard
deviation o f 0.0593. The maximum value of Donor funding/Total Funding was 0.2202
and the minimum value was 0.0280. This shows that on average donor funding forms
21

about 10% percent of the total funding. However, in some schools, donor funding was
about 22% of the total funding within the 5-year period.
On the other hand the average Girls Enrolment/Total Enrolment during the period was
mean of 0.51(51%) and a standard deviation o f 0.015. The maximum level of Girls
Enrolment/Total Enrolment was 0.5444 (54%) and the minimum value was 0.4889
(49%), resulting to a lower range of 0.05. this depicts that on average the ratio of girls to
boys enrolment in primary schools were same as the enrolment ranged between 49% to
54%.
The average Academic Performance during the period was a mean of 46.49 points and a
standard deviation of 4.91 points. The maximum level of Academic Performance was
59.72 points and the minimum value was 39.05 points. This illustrates that on average,
the primary schools performed below the basic average (50 points). However, the best
performing school was 59.72points.
Figure 4.1: Scatter Plot- Donor/Total Funding and Girls/Total Enrolment
C
Eoh_SUJ154-*o
o
0.00000 0.05000 0.10000 0.15000 0.20000 0.25000
Donor/Total Funding
The scatter plot shows a moderate upward trend. The trend seems to be linear and as such
a linear regression analysis could be used for further analysis.
22
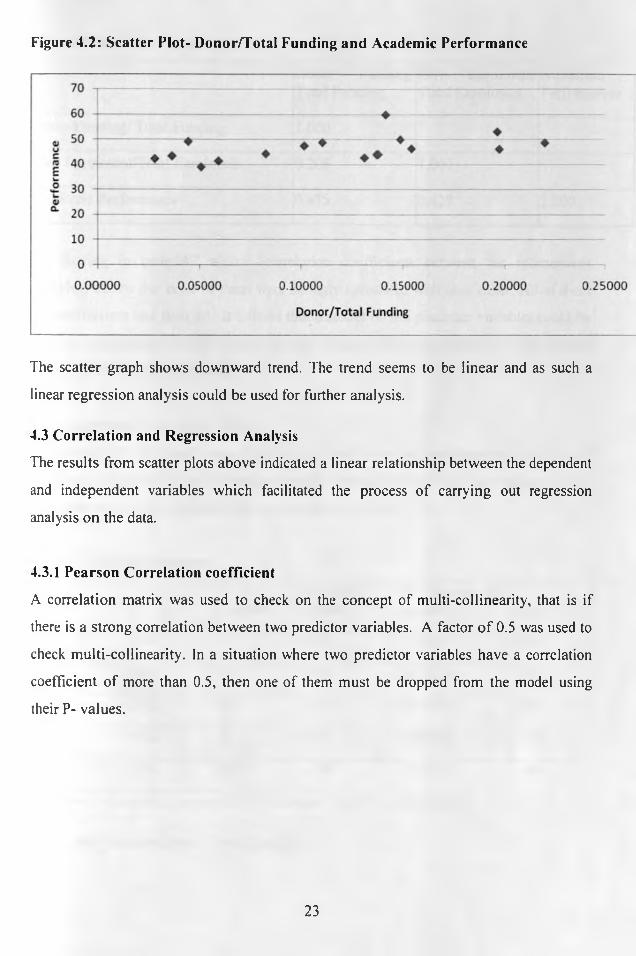
Figure 4.2: Scatter Plot- Donor/Total Funding and Academic Performance
The scatter graph shows downward trend. The trend seems to be linear and as such a
linear regression analysis could be used for further analysis.
4.3 Correlation and Regression Analysis
The results from scatter plots above indicated a linear relationship between the dependent
and independent variables which facilitated the process o f carrying out regression
analysis on the data.
4.3.1 Pearson Correlation coefficient
A correlation matrix was used to check on the concept of multi-collinearity, that is if
there is a strong correlation between two predictor variables. A factor o f 0.5 was used to
check multi-collinearity. In a situation where two predictor variables have a correlation
coefficient of more than 0.5, then one of them must be dropped from the model using
their P- values.
23
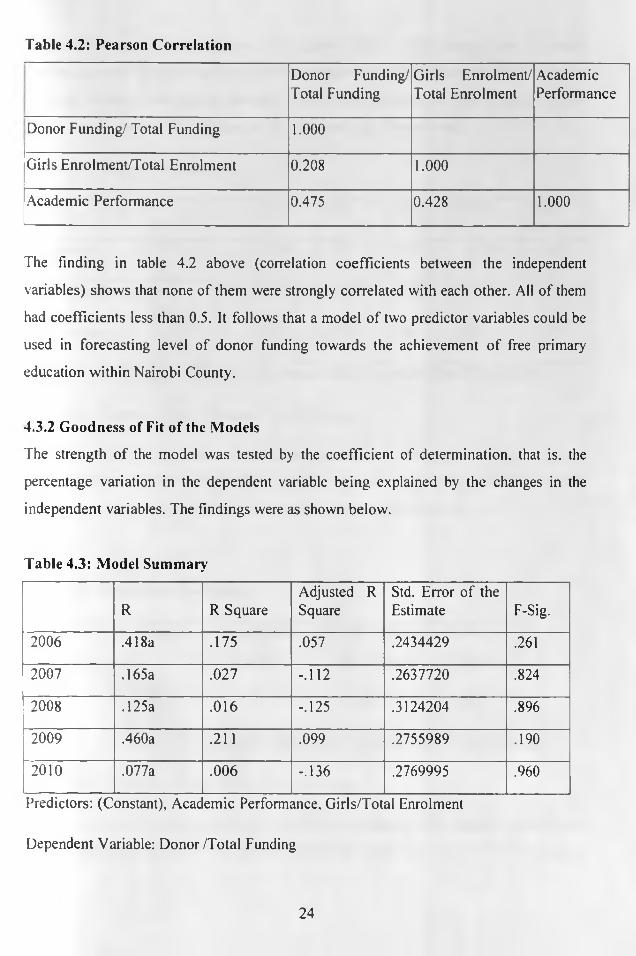
Table 4.2: Pearson Correlation
Donor Funding/ Total Funding
Girls Enrolment/ Total Enrolment
AcademicPerformance
Donor Funding/ Total Funding 1.000
Girls Enrolment/Total Enrolment 0.208 1.000
Academic Performance 0.475 0.428 1.000
The finding in table 4.2 above (correlation coefficients between the independent
variables) shows that none of them were strongly correlated with each other. All of them
had coefficients less than 0.5. It follows that a model of two predictor variables could be
used in forecasting level of donor funding towards the achievement of free primary
education within Nairobi County.
4.3.2 Goodness of Fit of the Models
The strength of the model was tested by the coefficient of determination, that is. the
percentage variation in the dependent variable being explained by the changes in the
independent variables. The findings were as shown below.
Table 4.3: Model Summary
R R SquareAdjusted R Square
Std. Error of the Estimate F-Sig.
2006 .418a .175 .057 .2434429 .261
2007 .165a .027 -.112 .2637720 .824
2008 .125a .016 -.125 .3124204 .896
2009 .460a .211 .099 .2755989 .190
2010 .077a .006 -.136 .2769995 .960
Predictors: (Constant), Acac emic Performance. Girls/Total Enrolment
Dependent Variable: Donor/Total Funding
24
The coefficient of determination (R2) equals 0.226. This shows that Academic
Performance and Girls Enrolment/Total Enrolment explain 22.6 percent of the variation
in Donor funding/Total funding leaving 77.40 percent unexplained. The P- value of 0.001
implies that the model is significant at the 5 percent significance level.
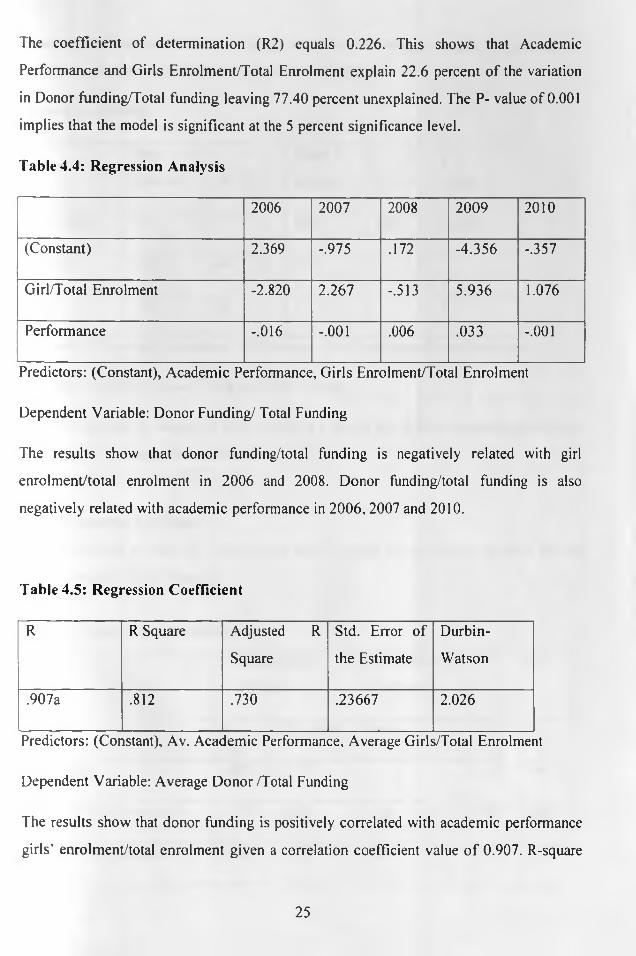
Table 4.4: Regression Analysis
2006 2007 2008 2009 2010
(Constant) 2.369 -.975 .172 -4.356 -.357
Girl/Total Enrolment -2.820 2.267 -.513 5.936 1.076
Performance -.016 -.001 .006 .033 -.001
Predictors: (Constant), Academic Performance, Girls Enrolment/Total Enrolment
Dependent Variable: Donor Funding/ Total Funding
The results show that donor funding/total funding is negatively related with girl
enrolment/total enrolment in 2006 and 2008. Donor funding/total funding is also
negatively related with academic performance in 2006, 2007 and 2010.
Table 4.5: Regression Coefficient
R R Square Adjusted R Std. Error of Durbin-
Square the Estimate Watson
,907a .812 .730 .23667 2.026
Predictors: (Constant), Av. Academic Performance, Average Girls/Total Enrolment
Dependent Variable: Average Donor/Total Funding
The results show that donor funding is positively correlated with academic performance
girls' enrolment/total enrolment given a correlation coefficient value o f 0.907. R-square
25
value of 0.812 was established. That is, 81.2% o f the changes in girls’ enrolment and
academic performance are influenced by donor funding.
Table 4.6: ANOVA
Sum of Mean
Squares D f Square F Sig.
Regression .009 2 .005 .082 .022a
Residual .784 14 .056
Total .793 16
Predictors: (Constant), Academic Performance, Girls Enrolment/Total Enrolment
Dependent Variable: Donor Funding/ Total Funding
ANOVA findings (P value of 0.022) in table 4.4 shows that there is relationship between
the predictor and response variables
4.3.3 Regression Equations
The coefficients in Table 4.7 below were used to write the regression equation for the
Donor Funding / Total Funding:
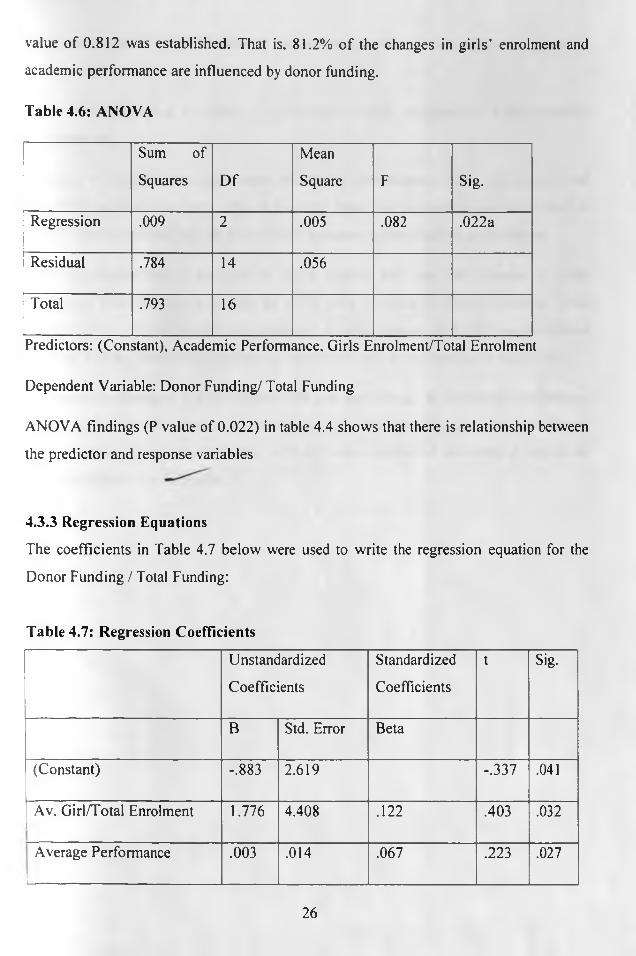
Table 4.7: Regression Coefficients
Unstandardized
Coefficients
Standardized
Coefficients
t Sig.
B Std. Error Beta
(Constant) -.883 2.619 -.337 .041
Av. Girl/Total Enrolment 1.776 4.408 .122 .403 .032
Average Performance
1___ .________ ______________
.003 .014 .067 .223 .027
26
Using un-standardized coefficients (B values), the established multiple linear regression
equation becomes;
Donor /Total Funding = -0.883 + 1.776*Girls /Total Enrolment + 0.003Academic
Performance
Constant = -0.883 shows that when Academic Performance. Girls Enrolment/Total
Enrolment were all rated zero, Donor Funding/ Total Funding average would be rated at
-0.883. This shows that lack of donor funding negates primary school performance.
Girls Enrolment/Total Enrolment = 1.776 shows that one unit change in Girls
Enrolment/Total Enrolment results in 1.776 units increase in Donor Funding/ Total
Funding average other factors held constant. A t-significance of 0.032 was established
showing that the relationship between girl enrolment and donor funding is significant.
Academic Performance = 0.003, shows that one unit change in Academic Performance
results in 0.003 units increase in Donor Funding/ Total Funding average other factors
held constant. A t-significant value of 0.027 was established depicting a significant
relationship with donor funding.
27
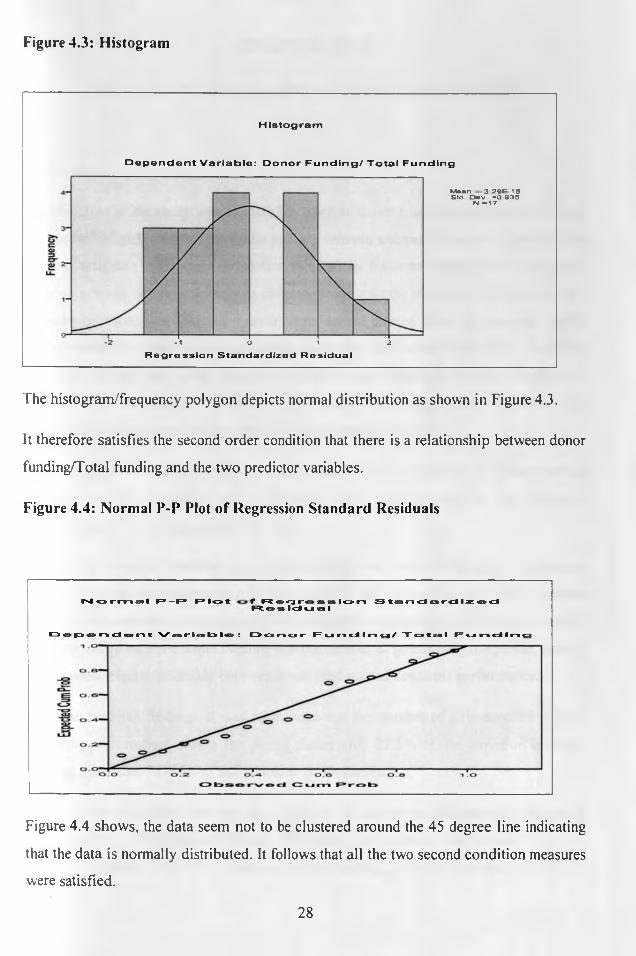
Figure 4.3: Histogram
Histogram
Dependent Variable: Donor Funding/ Total Funding
M o a n — 3 2 9 E - 1 5 Stct D e v - 0 9 3 5
N - 1 7
- 2 - 1 O 1 2
Regression Standardized Residual
The histogram/frequency polygon depicts normal distribution as shown in Figure 4.3.
It therefore satisfies the second order condition that there is a relationship between donor
funding/Total funding and the two predictor variables.
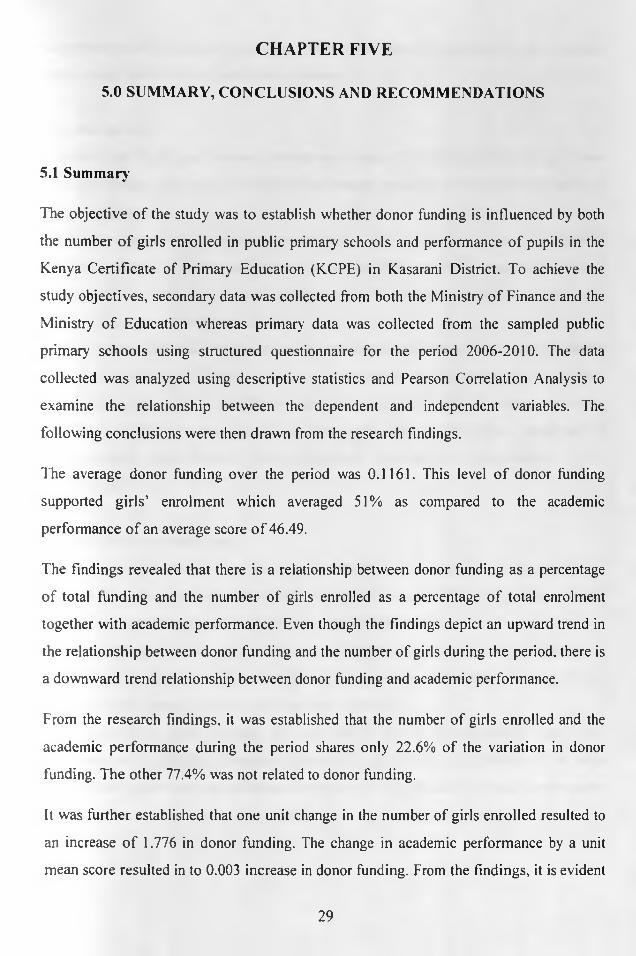
Figure 4.4: Normal P-P Plot of Regression Standard Residuals
Normal R—R R lot T Rocjroasion StandardizocflResldu A I
DeF>ortdont Variable: Donor Funding/ Total Funding
Figure 4.4 shows, the data seem not to be clustered around the 45 degree line indicating
that the data is normally distributed. It follows that all the two second condition measures
were satisfied.
28
CHAPTER FIVE
5.0 SUMMARY, CONCLUSIONS AND RECOMMENDATIONS
5.1 Summary
The objective o f the study was to establish whether donor funding is influenced by both
the number o f girls enrolled in public primary schools and performance o f pupils in the
Kenya Certificate of Primary Education (KCPE) in Kasarani District. To achieve the
study objectives, secondary data was collected from both the Ministry o f Finance and the
Ministry o f Education whereas primary data was collected from the sampled public
primary schools using structured questionnaire for the period 2006-2010. The data
collected was analyzed using descriptive statistics and Pearson Correlation Analysis to
examine the relationship between the dependent and independent variables. The
following conclusions were then drawn from the research findings.
The average donor funding over the period was 0.1161. This level o f donor funding
supported girls’ enrolment which averaged 51% as compared to the academic
performance o f an average score o f 46.49.
The findings revealed that there is a relationship between donor funding as a percentage
of total funding and the number of girls enrolled as a percentage o f total enrolment
together with academic performance. Even though the findings depict an upward trend in
the relationship between donor funding and the number of girls during the period, there is
a downward trend relationship between donor funding and academic performance.
From the research findings, it was established that the number o f girls enrolled and the
academic performance during the period shares only 22.6% of the variation in donor
funding. The other 77.4% was not related to donor funding.
It was further established that one unit change in the number of girls enrolled resulted to
an increase o f 1.776 in donor funding. The change in academic performance by a unit
mean score resulted in to 0.003 increase in donor funding. From the findings, it is evident
29

that enrolment o f girls greatly influenced the level o f donor funding unlike the academic
performance which had very minimal influence.
5.2 Conclusion
In general, the findings o f the study corroborate those o f UNESCO in 2003/04 which was
to assess whether free primary education had turned the tables on the decline of primary
school enrolments.
The reintroduction of free primary education in 2003 was with a view to establish
universal primary education and also to meet the EFA and MDG target of universal
access by 2015. Following the implementation of FPE policy in 2003. the net enrolment
ratio in Kenya grew by a further 22.3%.
In this context, Kasarani district recorded impressive enrolment of girls over the period
2006-2010 resulting to a mean o f 51% as a percentage of total enrolment. The donor
funding as a percentage o f total funding also had a mean of 0.1161. The extent by which
any change in donor funding influenced a change in Girls' enrolment as a percentage of
total enrolment and academic performance was explained by 22.6% leaving 77.4%
unexplained.
5.3 Policy Recommendations
In order to sustain the level of girls' enrolment, it is important for the government to
work hand in hand with the donors with an aim to increase funding to public schools.
This will go a long way in achieving the EFA and MDG targets.
However, the government should find ways of improving the academic performance of
public primary schools. Failure to address the academic performance may negatively
impact the enrolment of girls in public primary schools.
Since increase in donor funding only explains 22.6% of the increase in both girls'
enrolment and academic performance, the ministry of education should identify the other
unexplained conditions that influence the enrolment o f girls and academic performance.
Enough effort should then be put in addressing those unexplained factors.
30
5.4 Limitations of the Study
In the collection of data from the public primary schools in Kasarani District, the study
encountered gaps since the headmasters of many schools could not estimate the value of
indirect donor funding for the period 2006 to 2010.
By focusing on the effect of donor funding towards the achievement o f free primary
education in Nairobi County, the study restricted its scope to quantitative data in terms of
girls’ enrolment as a percentage o f total enrolment and academic performance. The study
did not delve into the qualitative aspects of achievement.
The study only focused on Kasarani District for a period of 2006 to 2010.
5.5 Suggestions for further studies
Given that this study’s findings indicate that only 22.6% of academic performance and
girls’ enrolment as a percentage o f total enrolment was entirely influenced by donor
funding, there is need to expand the scope of the study to assess what other factors
influence academic performance and girls’ enrolment in public primary schools.
There is also need to undertake the study in other counties in the country so that it can be
established whether there is a relationship between academic performance and girls’
enrolment.
Further studies may also look into the qualitative aspects of achievement o f free primary
education such as quality of education offered by free primary education as opposed to
limiting themselves to the quantitative aspects such as girls enrolled and the KCPE mean
scores.
31
REFERENCES
Aduawa-Ogiegbaen, S.E.O. (2006) Assessment of the Provision o f Educational Services
under the Universal Basic Education (UBE) scheme in Southern Nigeria Education,
127(2), 176-1 86.
Ajuzie, M.V. (2001) A concise history of education in Nigeria: Issues and new
challenges. Akoka Lagos, Nigeria: Time Publications.
Aluede, O. (2009). The Teacher Matters: Strategies fo r making the teaching profession
more relevant in Nigerian educational system. International Journal o f Education and
Science, 1 (I), 39-44.
Basu, K. (1999) Child labour, consequence, and cure, with remarks on international
labour standards: Journal o f Economic Literature, 37, 1083-1119.
Brimley, V. and Garfield, R. R. (2005) Financing Education In A Climate of Change,
Boston: Pearson Education Inc.
Buchmann, C., and Brakewood, D. (2000) Labour structure and school enrolments in
developing societies: Thailand and Kenya compared; Comparative Education Review,
44(2), 175-204.
Buchmann, C. and Hannum, E., (2001) Education and stratification in developing
countries: A review o f theories and research; Annual Review o f Sociology, 27, 77-102.
Colclough. Ch., Rose, P. and Tembon, M., (2000). Gender inequalities in primary
schooling: The roles o f poverty and adverse cultural practice: International Journal o f
Educational Development, 20, 5-27.
Coleman (1990) Education and Politics, New York: Klinston Publishers.
32
Dee, T. S. (2005). A teacher like me: Does race, ethnicity, or gender matter? The
American Economic Review, 95(2), 158-165.
Dike, V. (2002). The State o f Education in Nigeria & The Health of The Nation: African
Economic Analysis
Ersado, L. (2005) Child labour and schooling decisions in urban and rural areas:
Comparative evidence from Nepal, Peru and Zimbabwe. World Development, 33(3),
455-480.
Foster Philip (1982). Post Colonial States Experiences with Education, London: Rutledge
and Kegan Paul.
Galbraith, J. K. (1984). The affluent society, Boston: Houghton Mifflin.
Handa, S. (2002) Raising primary school enrolment in developing countries: The relative
importance o f supply and demand; Journal o f Development Economics, 69, 103-128.
Karemesi, J (2010) Concern Worldwide: Urban slums Basic Education Campaign; Issue
5- April 2010)
Kariuki, G.W (2007) An evaluation of financial management practices on free primary
education funds: The case o f Thika District. Unpublished MBA thesis, University o f
Nairobi
KESSP (2005) Delivering Quality Education and training to all Kenyans.
Kipkoech and Kyalo (2010) Management challenges facing implementation of free
primary education in Kenya: A case o f Keiyo District
33
Leach, F. (2006) Researching gender violence in schools: Methodological and ethical
considerations. World Development, 34(6), 1129-1147.
Michaelowa, K. (2001). Primary education quality in francophone Sub- Saharan Africa:
Determinants o f learning achievement and efficiency considerations. World
Development, 29(10), 1699-1716.
Ministry of Education (2000) Education for all in Kenya: National handbook for 2000
and beyond, Nairobi, Government printers.
Ministry of Education (2006) Education Statistical Booklet 1999-2004.
Ministry of Education (2006) 2006/2007: Budget Analysis, Ministry o f Education.
Ministry of Education, Science and Technology (2001) Education for all in Kenya: A
National handbook fo r 2000 and beyond, Nairobi.
Ministry of Education, Science and Technology (2003) Free Primary Education. Every
Child in School.
Ministry of Education, Science and Technology (2005) Sessional Paper No. 1 of 2005 on:
A Policy Framework for Education, Training and Research. Nairobi: Government
Printer.
Ministry of Education, Science and Technology, (2005) Kenya Education Sector Support
Programme 2005-2010: Delivering quality education and training to all Kenyans.
Muchemi, A.W (2005) A survey o f capability gap and challenges encountered in the
implementation of free primary education strategy in Kieni West Division: Unpublished
MBA thesis, University o f Nairobi.
34
Mukudi, E. (2004) Education for all: a framework for addressing the persisting illusion
for the Kenyan context. International Journal o f Educational Development.
Muthwii M. (2004) Free Primary Education: The Kenyan journey since independence.
Mutiso, M. M. (2011) The impact o f free primary education on performance of teaching
stakeholders in public schools in Kenya: A case o f public primary schools in Bungoma
East District. International Journal o f Current Research Volume 2, Issue 1PP. 151-162
Nyamute Michael (2006) Kenya’s Experience with Direct Support to Schools through
Block Grant Mechanism: Part o f Report on the 2006 ADEA Biennial Consultative
meeting
OWN and Associates (2004) Monitoring of the free primary education and establishing
the unit cost o f primary education in Kenya: Report submitted to Elimu Yetu
Coalition/Action Aid Kenya.
Overseas Development Institute (2010) What drives donor financing ot basic education
Oxfam & ANCEFA (2004) UPE-Myth or Reality: A Review o f Experiences, Challenges
and Lessons from East Africa. Nairobi.
Republic of Kenya (1964) Kenya Education Commission report: (Government Printers,
Nairobi, Kenya).
Republic of Kenya: The Education Act
Republic of Kenya (2001) The Children’s Act. Nairobi
35(UNIVERSITY OF NAIROBI
I A l l i e n i/» n e r r
Republic o f Kenya (1964-1969; 1970-1974; 1974-1978; 1979-1983; 1984-1988; 1989-
1993; 1997-2001; 2002-2008) National Development Plan; (Government Printers,
Nairobi, Kenya).
Shishanya, J.P (2006) Implementation process of free primary education strategy in
Kenya (2003-2006): Unpublished MBA thesis, University o f Nairobi.
Taylor-Kamara, A. (2010) The Importance of Education in Nation Building: Retrieved
July 28, 2011, from http:'/www. thetorchl iaht.com. index, php'7 opt ion - com
U4 (2003) Senior level forum on development effectiveness in fragile states: Retrieved
August 18, 2011, from hlto://www. u4. no/proiects/educationproiectken vapdf
UNESCO (2000) Education For All Monitoring Report: Is the World on Track?
wwvf. ibe. unesco. org/international/ice4 7/mesmoe. kenya
UNESCO (2002) Teacher Education through distance learning, Paris: UNESCO
UNESCO (2004) Paper commissioned for the EFA Global Monitoring Report 2003/4:
The Leap to Equality.
UNESCO (2005) Challenges of Implementing Free Primary Education in Kenya:
Assessment Report; Unesco, Nairobi Office
UNESCO, (2005) Early Childhood Care and Education in Kenya: Early Childhood and
Family Policy Series, N° 11 - 2005
Vasconcellos, E. A. (1997). Rural Transport and Access to Education in Developing
Countries: policy issues. Journal o f Transport Geography, 5(2), 127-136.
36

Vos R, Bedi R, Kimalu P. Manda D. K, Nafula N. N., (2004) in working paper.
Department of Economics (University o f Connecticut), Achieving universal primary
education: Can Kenya afford it?
World Bank (2003) Kenya: Free Primary Education Support Project (Project ID:
P0823 78). [http://web. worldbank. org/external/projects/j
World Bank (2006) Kenya: Education Sector Support Program (Project ID: P0874 9).
[http: //web. worldbank. org/external/projects/j
Yetu E (2003) Monitoring of the Free Primary Education and establishing the unit cost ot
primary education in Kenya:Coalitionhttp://www.commonwealtheducationJund.org/downloads/KenyaMonitoringFPE.
Yetu E (2003a) Commonwealth Education Fund and Elimu Yetu Coalition, 2003: Reform
Agenda fo r Education Sector in Kenya, Nairobi.
Yieke A. (2006) Free Primary Education in Kenya: Examining the Benefits, ( hallenges
and Sustainability. Part o f a report on the Millennium Development Goals Project.
37

LETTER OF INTRODUCTION
Telephone 020-2059162 Telegrams "Varsity". Nairobi Telex: 22095 Varsity
INIVERSity of NAIROBISCHOOL OF BUSINESS
kfflA programmeP.O. Box 30197 Nairobi. Kenya
DATE I
TO WHOM IT MAY CONCERN
The bearer of this letter... . ..Q.'... ^ .........................
Registration No. .4-?.£?'.Y.i.iOD \ . L % . i .P........................................................
is a bona fide continuing student in the Master of Business Administration (MBA) degree program in this University.
He/she is required to submit as part of his/her coursework assessment a research project report on a management problem. We would like the students to do their projects on real problems affecting firms in Kenya. We would, therefore, appreciate your assistance to enable him/her collect data in your organization.
The results of the report will be used solely for academic purposes and a copy of the same will be availed to the interviewed organizations on request.
Thank you.
V\a X pLJUSfifNEjMAGUTU ASSISTANT REGISTRAR . MBA OFFICE, AMBANK HOUSE
8CHO O i o rP ^ N A ,! iOE3l
P S m “| wessC ob3,0 ,9 7

L f ITER OF AUTHO^ I L 0 P
XX
5
TELEGRAM "SCHOOLING"
TELEPHONE: 221166/224281
EXT: 2426/2590
CITY HALL ANNEXE
P. 0. BOX 30298 GPO
NAIROBI
CITY EDUCATION DEPARTMENTGL/NC/142 VOL 1/60
30,h September, 2011
HeadteachersKasarani District Primary schools Nairobi.
RE: RESEARCH AUTHORIZATION
This is to certify that Zachary O. Okimgu, a postgraduate student at the University of Nairobi has been granted authority to collect data in your school for his academic research.
His research topic is the ‘Effect o f Donor Funding Towards the Achievement o f Free primary Education in Nairobi County; A case study o f Kasarani District’.
You arc therefore requested to accord him necessary assistance that may be required in ibis study.
JECGNTA N: CHARLESDEpW y'CHIEF a d v i s o r t o s c h o o l s
FOR: DIRECTOR CITY EDUCATION
CC: Zachary 0 . Okungu P.O. Box 26529-00100 Nairobi.
Education Officer, Kasarani District

Appendix III: Questionnaire
Instructions
The questionnaire has two sections. Kindly answer all the questions in each section. If a
question is not applicable, kindly indicate “N/A”. If you do not have knowledge, then
indicate “NK” The interv iew to sign and stamp against the name of the school.
PART A: Demographic Data
1. Please indicate the following details of your school;
Name of Primary School........................................................Stamp:
D istrict.......................................................
Division............................................
2. Indicate the following;
a) Location of school Slum area ( ) middle class area ( )
b) Number of streams per class _____________
c) Number of pupils ______________
d) Number of teaching staff ______________
e) Number of non teaching staff _____________
3. Indicate the number of enrolment of pupils per class for the following years
Class 1 Class 2 Class3 Class 4 Class 5 Class 6 Class 7 Class 8
2003
2004
2005
2006
2007
2008
2009
2010
40

4. Indicate the number o f enrolment of girls per class for the following years
Class 1 Class 2 Class3 Class 4 Class 5 Class 6 Class 7 Class
2003
2004
2005
2006
2007
2008
2009
2010
5. Please indicate the average performance o f your school in the KCPE in the following years;
Year 2003 2004 2005 2006 2007 2008 2009 2010
Performance
41

Appendix IV: List of Schools in Kasarani as at December 2010
Same TSC Code Zone
3aba Dogo 934001001 Ruaraka
2 Daniel Comboni 934001035 Ruaraka
Drive In 934001040 Ruaraka
4 G.S.U. 934001045 Ruaraka
5 Garden Estate 934001003 Kahawa
6 Githurai 934001020 Kahawa
7 Cahawa Garrison 934001048 Kahawa
8 Cahawa Primary 934001006 Kahawa
9 Camiti 934001007 Kahawa
10 Cariobangi North 934001005 Ruaraka
11 Casarani 934001004 Kahawa
12 Cenyatta University Primary 934001022 Kahawa
13 Ciwanja 934001037 Kahawa
14 M. M. Chandaria 934001051 Ruaraka
15 Mahiga 934001019 Kahawa
16 Mararui 934001050 Kahawa
17 Marura 934001047 Ruaraka
18 Mathare 4a 934001038 Ruaraka
19 Mathare North 934001032 Ruaraka
20 Murema 934001049 Kahawa
21 Muthaiga 934001008 Ruaraka
22 Ngunyumu 934001039 Ruaraka
23 Njathaini 934001033 Kahawa
24 Roysambu 934001027 Kahawa
25 Thika Road 934001023 Ruaraka
26 Tree Side Special 9340 Ruaraka
42
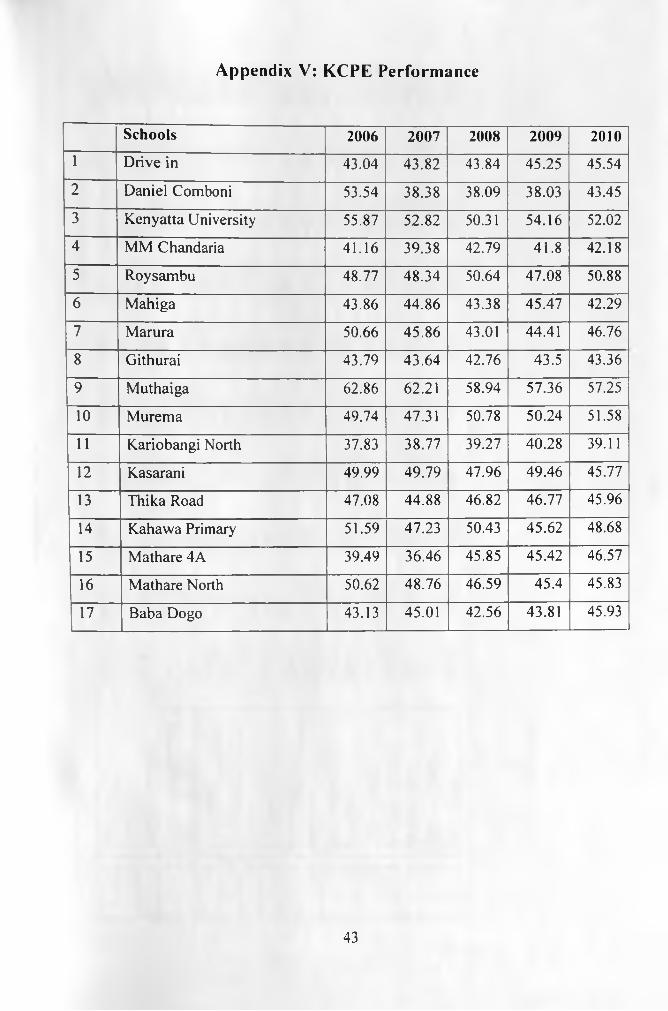
Appendix V: KCPE Performance
Schools 2006 2007 2008 2009 2010
1 Drive in 43.04 43.82 43.84 45.25 45.54
2 Daniel Comboni 53.54 38.38 38.09 38.03 43.45
3 Kenyatta University 55.87 52.82 50.31 54.16 52.02
4 MM Chandaria 41.16 39.38 42.79 41.8 42.18
5 Roysambu 48.77 48.34 50.64 47.08 50.88
6 Mahiga 43.86 44.86 43.38 45.47 42.29
7 Marura 50.66 45.86 43.01 44.41 46.76
8 Githurai 43.79 43.64 42.76 43.5 43.36
9 Muthaiga 62.86 62.21 58.94 57.36 57.25
10 Murema 49.74 47.31 50.78 50.24 51.58
11 Kariobangi North 37.83 38.77 39.27 40.28 39.11
12 Kasarani 49.99 49.79 47.96 49.46 45.77
13 Thika Road 47.08 44.88 46.82 46.77 45.96
14 Kahawa Primary 51.59 47.23 50.43 45.62 48.68
15 Mathare 4A 39.49 36.46 45.85 45.42 46.57
16 Mathare North 50.62 48.76 46.59 45.4 45.83
17 Baba Dogo 43.13 45.01 42.56 43.81 45.93
43
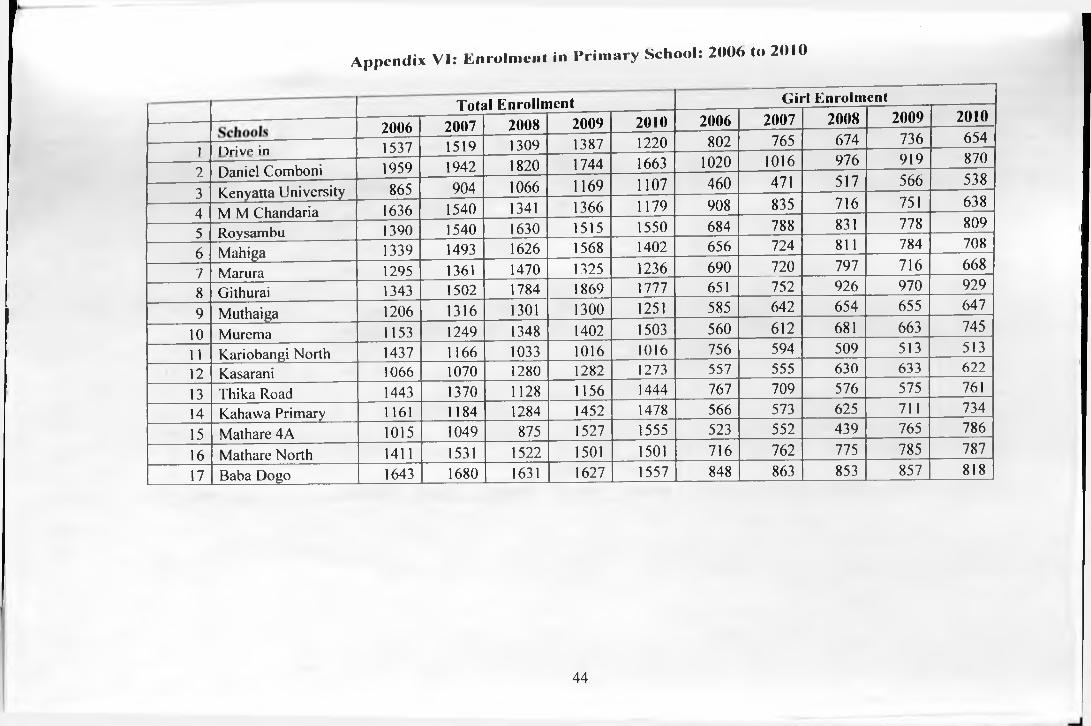
A ppendix VI: E nro lm en t in P rim ary School: 2006 to 2010
2006Tot:
2007il Enrolln
2008lent
2009 2010 2006Gii
2007rl Enrolin
2008ent
2009 2010
1 Hrivp in 1537 1519 1309 1387 1220 802 765 674 736 654
2 Daniel Comboni 1959 1942 1820 1744 1663 1020 1016 976 919 870
3 Kenyatta University 865 904 1066 1169 1107 460 471 517 566 538
4 M M Chandaria 1636 1540 1341 1366 1179 908 835 716 751 638
5 Roysambu 1390 1540 1630 1515 1550 684 788 831 778 809
6 Mahiga 1339 1493 1626 1568 1402 656 724 811 784 708
7 Marura 1295 1361 1470 1325 1236 690 720 797 716 668
8 Githurai 1343 1502 1784 1869 1777 651 752 926 970 929
9 Muthaiga 1206 1316 1301 1300 1251 585 642 654 655 647
10 Murcma 1153 1249 1348 1402 1503 560 612 681 663 745
11 Kariobangi North 1437 1166 1033 1016 1016 756 594 509 513 513
12 Kasarani 1066 1070 1280 1282 1273 557 555 630 633 622
13 Thika Road 1443 1370 1128 1156 1444 767 709 576 575 761
14 Kahawa Primary 1161 1184 1284 14521 1478 566 573 625 711 734
15 Mathare 4A 1015 1049 875 1527 1555 523 552 439 765 786
16 Mathare North 1411 1531 1522 1501 1501 716 762 775 785 787
17 Baba Dogo 1643 1680 1631 1627 1557 848 863 853 857 818
44

Appendix VII: Donor Funding: 2006 to 2010
Donor Funding Tola1 Funding
Prim ary School 2006 2007 2008 2009 2010 2006 2007 2008 2009 2010
] D riv e in 0 0 0 9 8 0 ,0 0 0 0 1 5 6 7 7 4 0 1 5 4 9 3 8 0 1 3 3 5 1 8 0 2 3 9 4 7 4 0 1 2 4 4 4 0 0
2 D a n ie l C o m b o n i 1 0 0 ,0 0 0 0 0 1 1 0 ,0 0 0 6 0 ,0 0 0 2 0 9 8 1 8 0 1 9 8 0 8 4 0 1 8 5 6 4 0 0 1 8 8 8 8 8 0 1 7 5 6 2 6 0
3 K e n y a tta U n iv e rs ity 0 5 5 ,1 7 5 3 ,0 9 2 ,8 0 0 2 8 5 ,5 0 0 8 8 2 3 0 0 9 7 7 2 5 5 1 0 8 7 3 2 0 4 2 8 5 1 8 0 1 4 1 4 6 4 0
4 M M C h a n d a r ia 0 2 0 0 ,0 0 0 1 7 0 ,0 0 0 0 9 3 ,3 6 0 1 6 6 8 7 2 0 1 7 7 0 8 0 0 1 5 3 7 8 2 0 1 3 9 3 3 2 0 1 2 9 5 9 4 0
5 R o y sa m b u 1 0 9 ,6 0 0 0 1 0 9 ,6 0 0 0 1 5 0 ,0 0 0 1 5 2 7 4 0 0 1 5 7 0 8 0 0 1 7 7 2 2 0 0 1 5 4 5 3 0 0 1 7 3 1 0 0 0
6 M a h ig a 4 8 4 ,3 1 5 6 5 0 ,0 3 4 0 0 1 9 9 ,7 6 3 1 8 5 0 0 9 5 2 1 7 2 8 9 4 1 6 5 8 5 2 0 1 5 9 9 3 6 0 1 6 2 9 8 0 3
7 M a ru ra 0 5 7 0 ,8 8 0 0 5 6 4 ,5 9 6 8 3 6 ,8 6 2 1 3 2 0 9 0 0 1 9 5 9 1 0 0 1 4 9 9 4 0 0 1 9 1 6 0 9 6 2 0 9 7 5 8 2
8 G ith u ra i 8 0 ,0 0 0 0 1 5 0 ,0 0 0 1 0 0 ,0 0 0 0 1 4 4 9 8 6 0 1 5 3 2 0 4 0 1 9 6 9 6 8 0 2 0 0 6 3 8 0 1 8 1 2 5 4 0
9 M u th a ig a 1 0 0 ,0 0 0 1 0 0 ,0 0 0 2 0 0 ,0 0 0 1 .0 0 0 ,0 0 0 0 1 3 3 0 1 2 0 1 4 4 2 3 2 0 1 5 2 7 0 2 0 2 3 2 6 0 0 0 1 2 7 6 0 2 0
10 M u re m a 5 3 1 ,9 7 5 0 8 4 2 ,9 3 9 0 82 ,251 1 7 0 8 0 3 5 1 2 7 3 9 8 0 2 2 1 7 8 9 9 1 4 3 0 0 4 0 161531111 K a r io b a n g i N o rth 497,000 0 0 0 0 1 9 6 2 7 4 0 1 1 8 9 3 2 0 1 0 5 3 6 6 0 1 0 3 6 3 2 0 1 0 3 6 3 2 012 K a sa ra n i 0 0 2 ,6 0 0 ,0 0 0 0 1 .0 0 0 ,0 0 0 1 0 8 7 3 2 0 1 0 9 1 4 0 0 3 9 0 5 6 0 0 1 3 0 7 6 4 0 2 2 9 8 4 6 0
13 T h ik a R o ad 0 5 5 0 ,0 0 0 1 ,1 0 0 ,0 0 0 0 0 1 4 7 1 8 6 0 1 9 4 7 4 0 0 2 2 5 0 5 6 0 1 1 7 9 1 2 0 1 4 7 2 8 8 014 K a h a w a P r im a ry 0 0 9 4 8 ,3 0 0 2 2 5 .7 0 0 0 1 1 8 4 2 2 0 1 2 0 7 6 8 0 2 2 5 7 9 8 0 1 7 0 6 7 4 0 1 5 0 7 5 6 0
15 M a th a re 4 A 4 5 3 ,8 4 0 2 7 7 ,8 5 0 0 2 5 9 ,2 7 8 0 1 4 8 9 1 4 0 1 3 4 7 8 3 0 8 9 2 5 0 0 1 8 1 6 8 1 8 1 5 8 6 1 0 0
16 M a th a re N o rth 0 0 0 4 0 3 .7 6 0 6 4 9 ,5 5 5 1 4 3 9 2 2 0 1 5 6 1 6 2 0 1 5 5 2 4 4 0 1 9 3 4 7 8 0 2 1 8 0 5 7 517 B a b a D o g o 3 1 0 ,0 0 0 3 4 9 ,8 2 0 1 3 0 .0 0 0 3 0 0 ,0 0 0 2 5 0 ,0 0 0 1 9 8 5 8 6 0 2 0 6 3 4 2 0 1 7 9 3 6 2 0 1 9 5 9 5 4 0 1 8 3 8 1 4 0
45