BY: LYDIA TUHAISE UGANDA BUREAU OF STATISTICS MDG RELATED STATISTICS PRESENTED TO STATISTICS SIERRA...
51
BY: LYDIA TUHAISE UGANDA BUREAU OF STATISTICS MDG RELATED STATISTICS PRESENTED TO STATISTICS SIERRA LEONE WITH SUPPORT FROM SESRIC
-
Upload
charles-mcdonald -
Category
Documents
-
view
267 -
download
1
Transcript of BY: LYDIA TUHAISE UGANDA BUREAU OF STATISTICS MDG RELATED STATISTICS PRESENTED TO STATISTICS SIERRA...

BY: LYDIA TUHAISE
UGANDA BUREAU OF STATISTICS
MDG RELATED STATISTICS
PRESENTED TOSTATISTICS SIERRA
LEONEWITH SUPPORT FROM
SESRIC
BACKGROUND TO STATISTICS
Session Objectives
To discuss the development and meaning of statistics
To justify the importance of reliable and timely statistics
in planning
To introduce some key statistical concepts
Background to Statistics Meaning of statistics Development of statistics Major sources of statistics Uses of statistics Key statistical concepts Data types Data analysis
Meaning of Statistics
1. The word statistics is used in either two senses.
Commonly used to refer to data. Principles and methods which have been
developed for handling numerical data.
2.Statistics is defined as a branch of mathematics or science that deals with the collection, analysis and interpretation of numerical information.

Meaning of Statistics contd…3. Statistics changes numbers into information.
4. Statistics is the art and science of deciding:
what are the appropriate data to collect, deciding how to collect data efficiently using data to give information, using data to answer questions, using data to make decisions.
Meaning of Statistics contd…
5. Statistics” are data obtained by collecting, processing, compiling, analyzing, publishing and disseminating results, gathered from respondents through statistical collections or from administrative data
6. Statistics is making decisions when there is uncertainty.
We have to make decisions all the time, in everyday life, as part of our jobs.
Meaning of Statistics contd…
7. Statistics is a mathematical science pertaining to the
collection, analysis, interpretation or explanation, and presentation of data.
Meaning of Statistics contd…
8. Statistics are used for making informed decisions
and misused for other reasons
9.Statistics is the science of learning from data.
A Quote
“When you can measure what you are speaking about and express it in numbers, you know something about it; but when you cannot measure it, when you cannot express it in numbers, your knowledge is of the meager and unsatisfactory kind’, - Lord Kelvin (British physicist)
Development of Statistics
The word statistics is believed to have been derived from the word “states”. The administration of states required the collection and analysis of data of population and wealth for the purpose of war and finance.
Development of Statistics contd... Some concepts of statistics were developed by students
of games of chance, such games lean on probability.
The fertile grounds for application and development of statistical methods included; insurance, biology and other natural sciences.
To date, there is hardly any discipline which does not find statistics useful. Economics, sociology, business, agriculture, health and education; all lean heavily upon statistics.
Sources of data1. Primary sources.
Censuses
Surveys
Experiments
The great advantage of such data is that the exact information wanted is obtained.
Sources of data contd….
Secondary Sources.
Often data is picked from reports and publications of researchers, institutions and organizations. Such data is referred to as secondary.

Uses of statisticsStatistics is a discipline which was developed to
extract relevant facts from a large body of information and to help people make decisions when uncertainty exists concerning the information.
Statistics form the basis for planning. Statistics provide information and data (facts and figures) as an input for planning, monitoring and evaluation of programmes.

Population (1948 - 2008)- million
56.5
12.6
16.7
24.2
9.5
29.6
1948 1959 1969 1980 1991 2002 2008
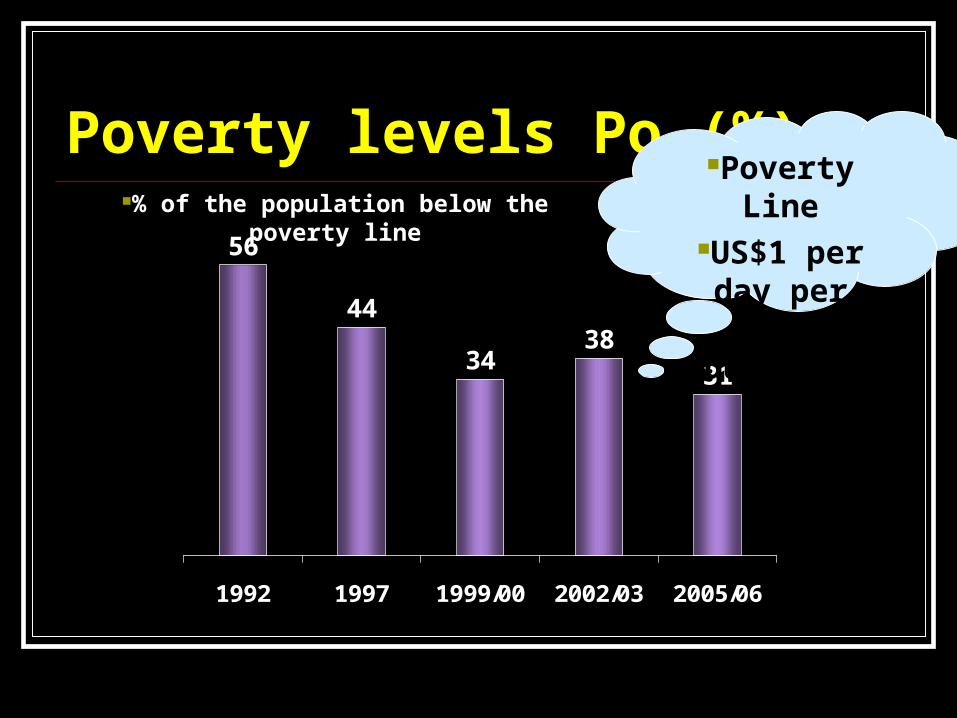
Poverty levels Po (%)
56
44
3438
31
1992 1997 1999/00 2002/03 2005/06
Poverty LineUS$1 per day
per adult equivalent
% of the population below the poverty line
Overview on Data Management

Design survey
Design questionnaire
Enumerators collect data in the field
Data entered onto computer
Manual checking, editing etc.
Data analysis
Reporting of results
Computer data management
Data management cycle
Conception
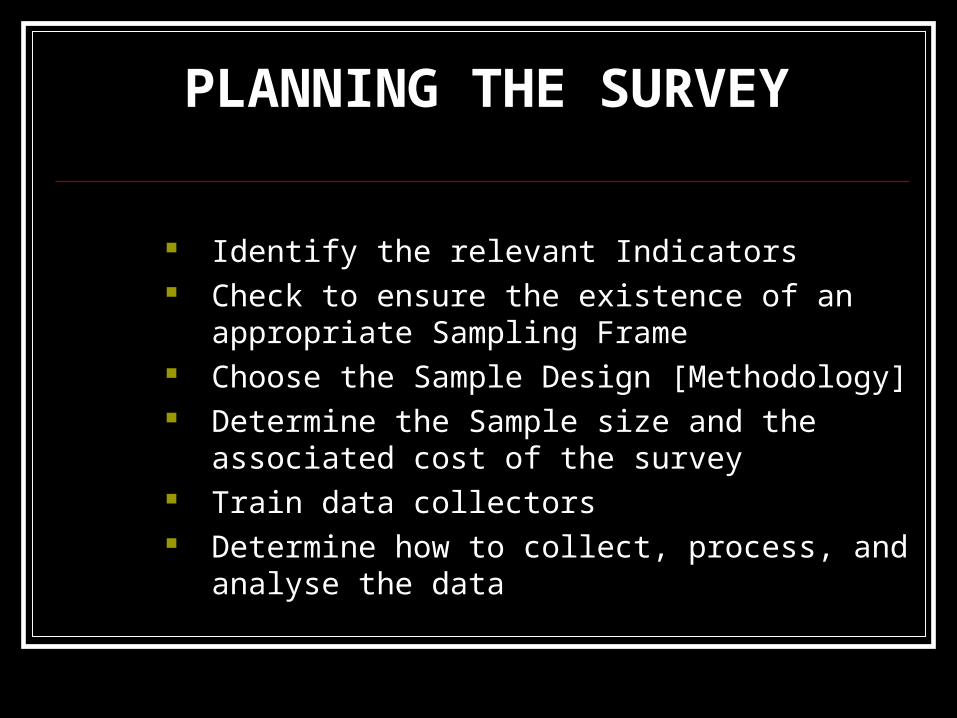
PLANNING THE SURVEY
Identify the relevant Indicators Check to ensure the existence of an appropriate
Sampling Frame Choose the Sample Design [Methodology] Determine the Sample size and the associated
cost of the survey Train data collectors Determine how to collect, process, and analyse
the data

PLANNING THE SURVEY...Contd
Determine the work-plan closely linking it to the budget.
Consider the financial, material, and human resource available
All these must be well perceived and well arranged at this stage. A failure can derail the survey.

Data collection
Data could be collected by: conducting a census conducting a sample survey use of administrative records conducting experiments observation and review of secondary sources

STEPS IN DATA COLLECTION
STEP 1 Formulate the problem
Develop objectives of data collection Plan, human resource, logistics, scheduling,
budgeting Discuss with stakeholders

STEPS OF DATA COLLECTION …Contd
STEP 2 Determine sources of information
Define approach to data collection Identify concepts, definitions and classifications to
be used

STEPS OF DATA COLLECTION …Contd
STEP 3: Determine techniques of data collection
Determine best approach to data collection

STEPS OF DATA COLLECTION …Contd
STEP 4: Prepare data collection forms
Design data collection forms
STEPS OF DATA COLLECTION …Contd
STEP 5: Pretest data collection instruments
Collect some information to refine the questionnaire/ data collection form.
Determine feasibility of obtaining data
STEPS OF DATA COLLECTION …Contd
STEP 6: Finalise data collection forms
Discuss final questionnaire/form with stakeholders and reproduce questionnaires/forms

STEPS OF DATA COLLECTION …Contd
STEP 7: Collect data
Put in place a team of data collectors/ fieldworkers Train data collectors

DATA COLLECTION TECHNIQUES
Data collection techniques allow us to systematically collect information about our objects of study; and about the setting in which they occur.
Data collection techniques generate both qualitative and quantitative data.
DATA COLLECTION … ContdQualitative techniques of data collection involve
the identification and exploration of a number of related variables for in-depth understanding of the phenomena.
Qualitative data is often recorded in a narrative form.
DATA COLLECTION … ContdQuantitative techniques of data collection are
used to generate quantifiable data.
Both qualitative and quantitative techniques are often used in a single study, since the two compliment each other.
QUALITATIVE METHODS The qualitative methods most commonly used in
evaluation can be classified in three broad categories:
In-depth interview Observation methods Document review
QUALITATIVE METHODS …Contd
These methods are characterized by the following attributes:
They tend to be open-ended and have less structured protocols
They rely more heavily on interactive interviews;
QUALITATIVE METHODS …Contd
They use triangulation to increase the credibility of their findings
Generally, their findings are not generalizable to any specific population
SOME QUALITATIVE METHODS In-Depth interview Participant observation Direct observation Document/literature review
QUANTITATIVE METHODS
Typical quantitative data gathering strategies include:
Experiments/clinical trials. Observing and recording well-defined events (e.g.,
counting the number of patients waiting in emergency at specified times of the day).
QUANTITATIVE METHODS … Contd
Obtaining relevant data from management information systems.
Administering surveys with closed-ended questions

COMPILATION AND ANALYSIS
STEPS Cleaning and organizing the data for analysis (
Data Preparation) Describing the data (Descriptive Statistics) Testing Hypotheses and Models (
Inferential Statistics)

SOME STATISTICAL CONCEPTS Population Sample Parameter Statistic Variable Estimation
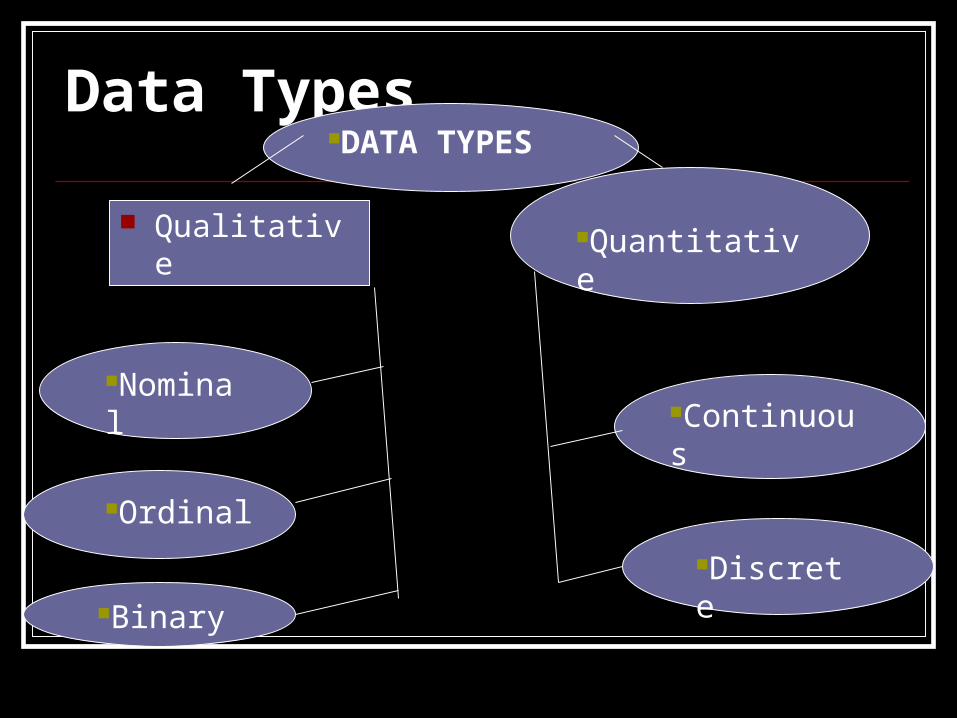
Data Types DATA TYPES
Continuous
Quantitative
Nominal
Ordinal
Binary
Discrete
Qualitative

DATA PREPARATION
Checking the data for completeness accuracy
Preparing data entry screen
Entering the data into the computer
Transforming the data
DATA PRESENTATTION AND DESCRIPTION
Used to describe the basic features of the data in a study
DATA PRESENTATION Graphical
Histograms Bar charts Pie charts Error bars More….
PRESENTATION … Contd Tabular
Frequency tables Percentages
TYPES OF STATICTICSA- Descriptive statistics
B – Relational Statistics Univariate, bi-variate, and multi-variate analysis
C- Inferential statistics Branch of statistics devoted to making
generalizations.
DATA DESCRIPTION
They provide simple summaries about the
sample and the measures.
Simply describing what is; what the data
shows

DESCRIPTION … Contd
Measures of Central Tendency
Mean, median, mode
Measures of Dispersion
Variation
HOW TO DESCRIBE DATA WELL
Look at the oddities in the data and be prepared to adapt the summaries you calculate
Look at the data using tables and graphs Understand how to summarise the categorical
variables Understand how to summarise the numerical
variables Identify any structure in your data and use it to
summarise your data

INFERENTIAL STATISTICS Investigate questions, models and
hypotheses.
Confidence Intervals
Hypothesis testing

THANK YOU