By J. Gitutu ,J Muthama, C. Oludhe Kenya Meteorological ... · OVER KENYA By J. Gitutu ,J Muthama,...
27
A COMPARATIVE VERIFICATION OF PRECIPITATION FORECASTS FOR SELECTED NUMERICAL WEATHER PREDICTION MODELS OVER KENYA By J. Gitutu ,J Muthama, C. Oludhe Kenya Meteorological Department
Transcript of By J. Gitutu ,J Muthama, C. Oludhe Kenya Meteorological ... · OVER KENYA By J. Gitutu ,J Muthama,...

A COMPARATIVE VERIFICATION OF PRECIPITATION FORECASTS FOR SELECTED NUMERICAL WEATHER PREDICTION MODELS
OVER KENYA
By
J. Gitutu ,J Muthama, C. Oludhe
Kenya Meteorological Department
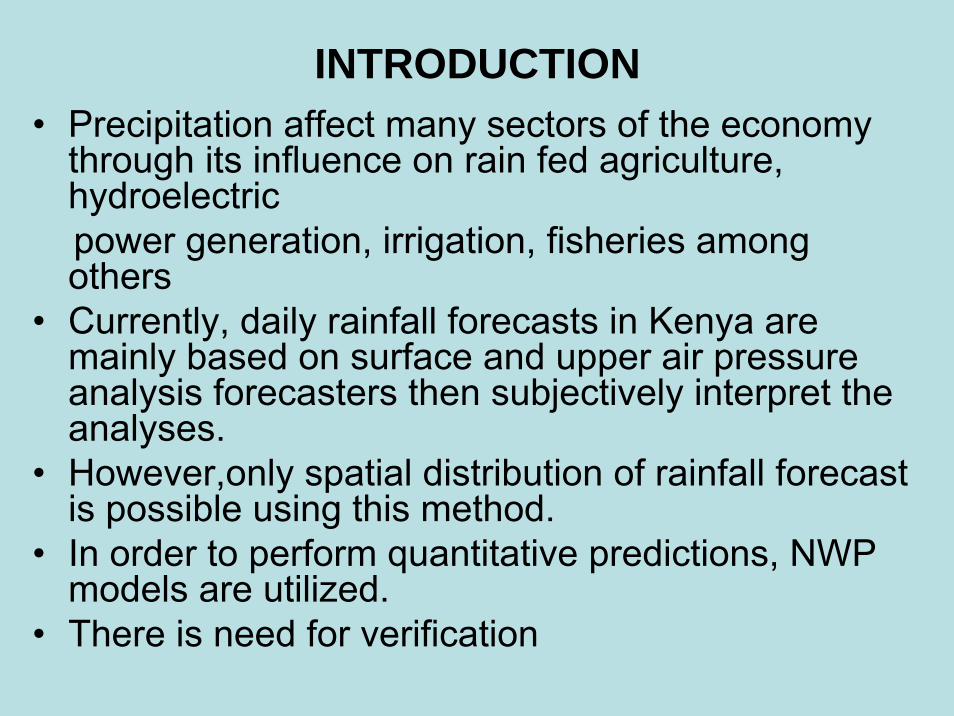
INTRODUCTION• Precipitation affect many sectors of the economy
through its influence on rain fed agriculture, hydroelectricpower generation, irrigation, fisheries among others
• Currently, daily rainfall forecasts in Kenya are mainly based on surface and upper air pressure analysis forecasters then subjectively interpret the analyses.
• However,only spatial distribution of rainfall forecast is possible using this method.
• In order to perform quantitative predictions, NWP models are utilized.
• There is need for verification

What is forecast verification?• Forecast verification is the process of assessing
the accuracy and skill of a forecasting system. The forecast is verified against a corresponding observation of what actually occurred.
• Verification gives an insight into weaknesses and strengths of forecasting systems, thus allowing a more complete use of the information contained in the forecasts (Anna Ghelli and Francois, 2001).
• The three most important reasons to verify forecasts are:

WHY VERIFY?
• To monitor forecast quality - how accurate are the forecasts and are they improvingover time?
• To improve forecast quality - the first step toward getting better is discovering whatyou're doing wrong.
• To compare the quality of different forecast systems i.e. to what extent does one system give better forecasts than another
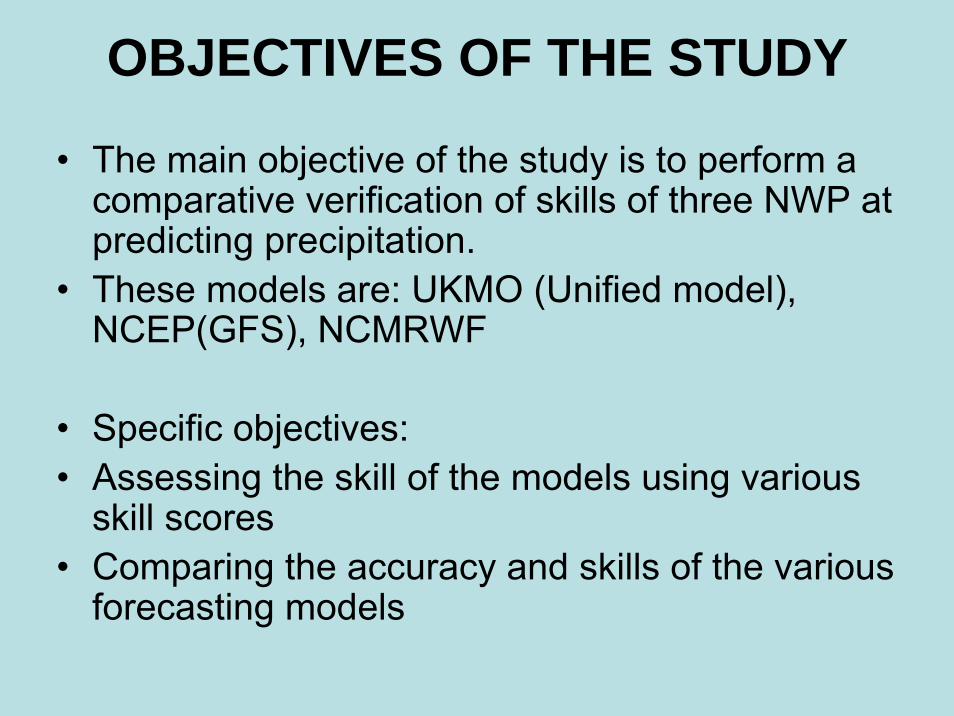
OBJECTIVES OF THE STUDY
• The main objective of the study is to perform a comparative verification of skills of three NWP at predicting precipitation.
• These models are: UKMO (Unified model), NCEP(GFS), NCMRWF
• Specific objectives:• Assessing the skill of the models using various
skill scores• Comparing the accuracy and skills of the various
forecasting models
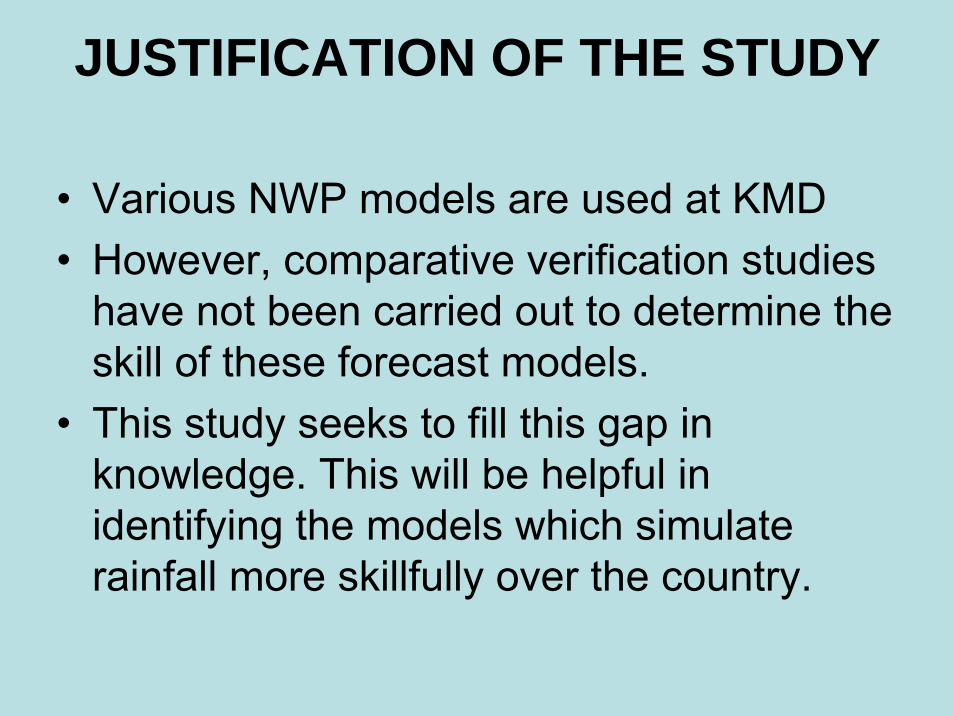
JUSTIFICATION OF THE STUDY
• Various NWP models are used at KMD• However, comparative verification studies
have not been carried out to determine the skill of these forecast models.
• This study seeks to fill this gap in knowledge. This will be helpful in identifying the models which simulate rainfall more skillfully over the country.

BACKGROUND OF VERIFICATION METHODS
• Visual -look at the forecast and observations side by side and use human judgment to discern the forecast errors.
• However, the visual method is not quantitative, and it is very prone to individual, subjective biases of interpretation
• good if only a few forecasts are being considered.

• Stanski et al. (1989), Harolds (1996), Jerome (2003) have described some of the standard verification methods and scores in use. These include scores derived from contingency tables for dichotomous forecasts.
• A dichotomous forecast says, “Yes”, an event will happen, or “no”, the event will not happen. Rain is a common example of yes/no forecasts.
• A threshold is usually specified to• separate "yes" and "no", for example,
rainfall greater than one millimeter.
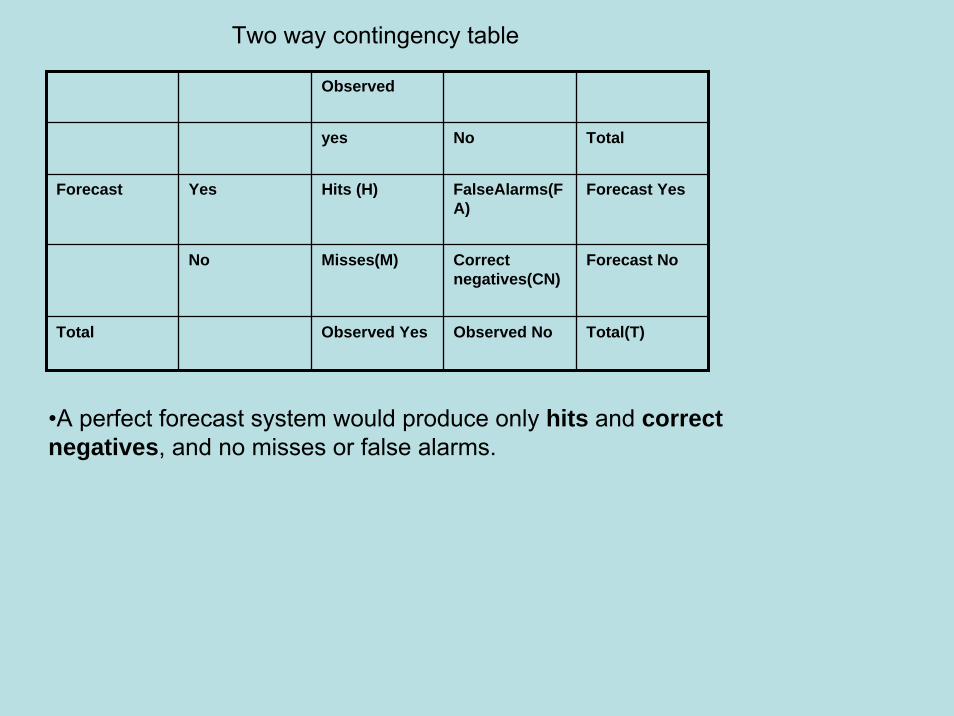
Observed
yes No Total
Forecast Yes Hits (H) FalseAlarms(FA)
Forecast Yes
No Misses(M) Correct negatives(CN)
Forecast No
Total Observed Yes Observed No Total(T)
Two way contingency table
•A perfect forecast system would produce only hits and correct negatives, and no misses or false alarms.

DATA AND METHODOLOGY• Rainfall observations for twenty two stations for a period
of one year were collected from November 2004-October 2005.
• One year’s output from November 2004-October 2005 for the UKMO model, Nine months daily output from the NCMRWF model (Jan2005-September 2005) and six months from theNCEP model (March2005-September 2005).
• The NCMRWF model’s horizontal resolution was 1.4° x 1.4°, UKMO model’s resolution was 0.5° x 0.8° and NCEP model’s resolution was 1° x 1° .

Stations and Gridpoint positions
35 36 37 38 39 40 41
-4
-3
-2
-1
0
1
2
3
4
5
KisiiNarok
Dagoretti
Embu
Katumani
Voi Malindi
Lamu
Nyr
Lodwar
Wajir
Mandera
Marsabit
Moyale
Makindu
Kitale
Kisumu Meru
Mombasa
Nkr
Eldoret
Ker Garissa
34 35 36 37 38 39 40 41 42-5
-4
-3
-2
-1
0
1
2
3
4
5
33 34 35 36 37 38 39 40 41 42 43
-4
-3
-2
-1
0
1
2
3
4
5
33 34 35 36 37 38 39 40 41 42 43-5
-4
-3
-2
-1
0
1
2
3
4
5
NCEP grid points NCMRWF grid pointsUKMO grid points Rainfall stations

FORMULATION OF A SCORING METHODOLOGY
• Root mean square Error = ( )2/1
1
2
⎥⎥⎥⎥
⎦
⎤
⎢⎢⎢⎢
⎣
⎡−∑
=
N
OFN
iii
• BIAS SCORE = (H+FA)/(H+M)
The bias score is a measure of the relative frequency of rain forecasts compared with observations.
• PROBABILITY OF DETECTION
Probability detection = MHHPOD+
=
It gives a simple measure of proportion of rain events successfully forecast by the model.

• FALSE ALARM RATIO
FAHFAFAR+
=
It gives a simple proportional measure of the model’s tendency to forecast rain where none was observed.
⎥⎦⎤
⎢⎣⎡
+ MHH
⎥⎦⎤
+ FCNCNHK =
⎢⎣⎡
+ -1
• HANSEN-KUIPERS SCORE (HK)
Thus HK= accuracy for events (POD) +accuracy for nonevents
The HK score gives equal emphasis to the ability of the forecast model to correctly predictevents and non events.
The bias score, false alarm ratio, probability of detection, Hansen-Kuipersscore (HK) will be developed for different thresholds of rainfall (i.e. 0.1, 0.2, 0.5, 1, 2, 5, 10, 15, 20, 25 mm/day).
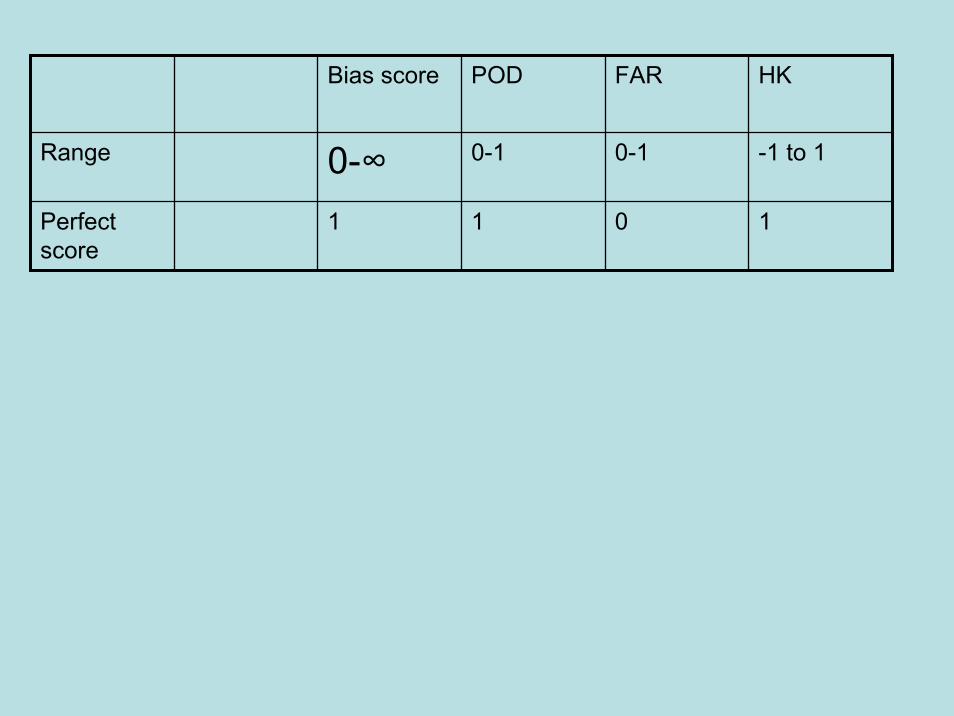
Bias score POD FAR HK
Range 0-∞ 0-1 0-1 -1 to 1
Perfect score
1 1 0 1
RESULTS AND DISCUSSION
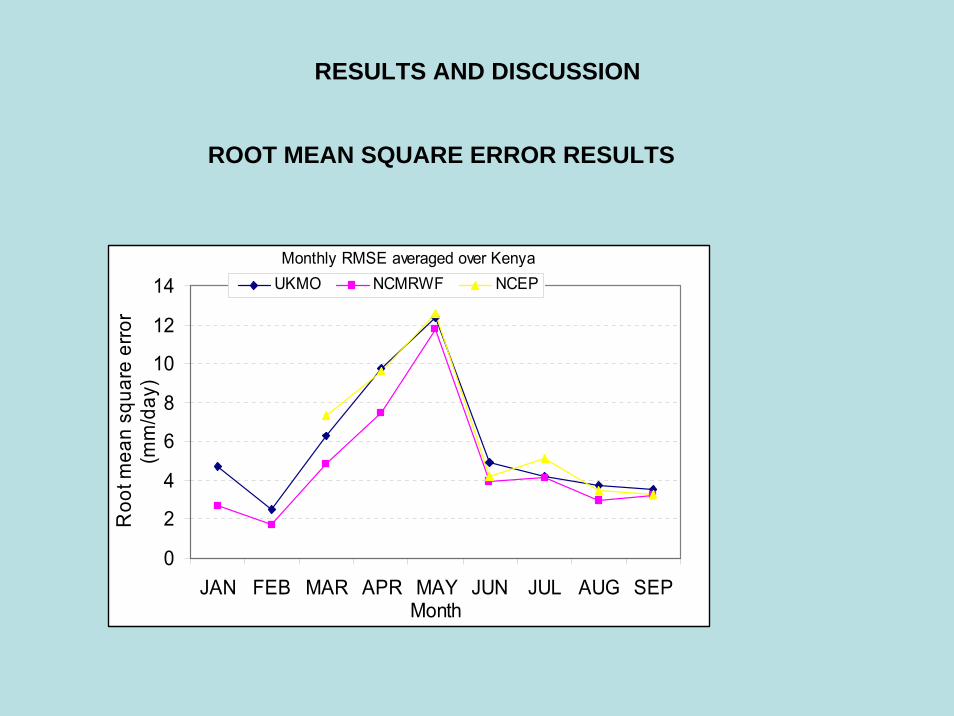
ROOT MEAN SQUARE ERROR RESULTS
Monthly RMSE averaged over Kenya
0
2
4
6
8
10
12
14
JAN FEB MAR APR MAY JUN JUL AUG SEPMonth
Roo
t mea
n sq
uare
erro
r(m
m/d
ay)
UKMO NCMRWF NCEP

• show significant monthly variations of root mean square error values of rainfall in millimeters per day
• error is largest during the rainy season of March-May
• The error is relatively low for the drier months
• NCMRWF model has slightly lower RMSE than the other two models
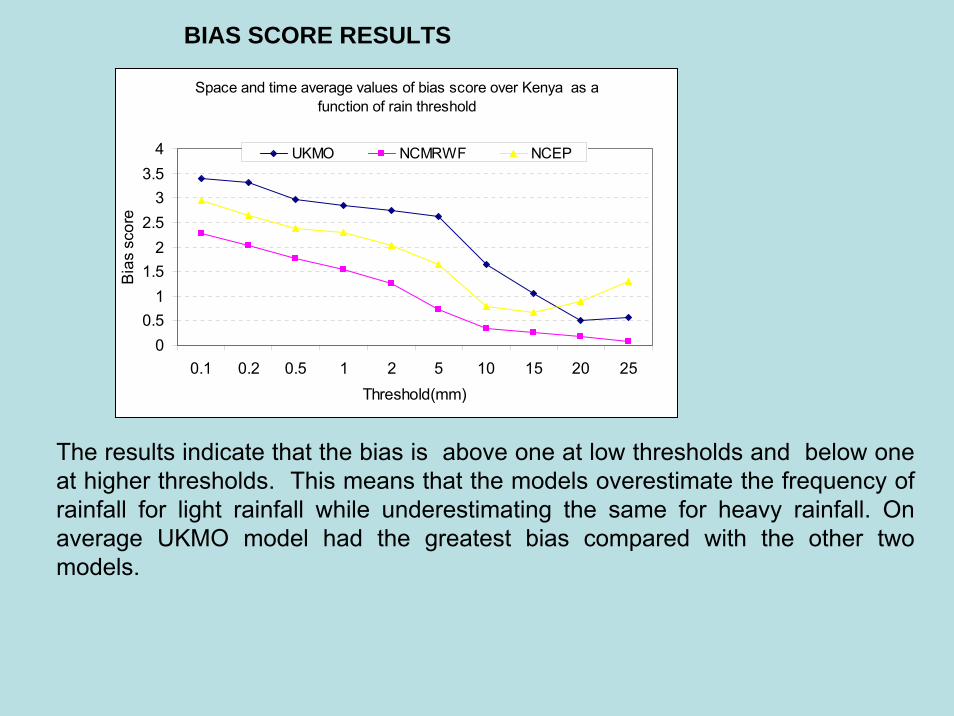
The results indicate that the bias is above one at low thresholds and below one at higher thresholds. This means that the models overestimate the frequency of rainfall for light rainfall while underestimating the same for heavy rainfall. On average UKMO model had the greatest bias compared with the other two models.
BIAS SCORE RESULTS
Space and time average values of bias score over Kenya as a function of rain threshold
00.5
11.5
22.5
33.5
4
0.1 0.2 0.5 1 2 5 10 15 20 25Threshold(mm)
Bia
s sc
ore
UKMO NCMRWF NCEP

PROBABILITY OF DETECTION
POD values were very high especially for the UKMO model for rainfall up to about a threshold of 5mm. This model detects more than 80% of rain occurrences at a threshold of 2mm/day. Thereafter the POD values drop rapidly as a function of threshold. This means that it is much more difficult for the models to detect heavy rainfall than light rainfall. Averaged over all the stations, the UKMO model could detect rainfall better than the other two models followed by NCEP model.
Time and space average values of POD over Kenya as a function of rain threshold
0
0.2
0.4
0.6
0.8
1
1.2
0.1 0.2 0.5 1 2 5 10 15 20 25
Threshold(mm/day)
Prob
abili
ty o
f det
ectio
n UKMO NCMRWF NCEP

Monthly values of POD
Monthly average POD values over Kenya
0
0.2
0.4
0.6
0.8
1
1.2
JAN FEB MAR APR MAY JUN JUL AUG SEP
Month
Prob
abilit
y of
det
ectio
n
UKMO NCMRWF NCEP

FALSE ALARM RATIO
• The false alarm ratios are lower for low thresholds of rainfall and increases with threshold.
• This probably means that if a model predicts heavy rainfall it is much more likely to be a false alarm than if it predicted light rainfall.
• False alarm ratios for the NCMRWF model were slightly lower than the other models
Time and space average values of FAR over Kenya as a function of rain threshold
0
0.2
0.4
0.6
0.8
1
1.2
0.1 0.2 0.5 1 2 5 10 15 20 25
Threshold(mm/day)
Fals
e A
larm
Rat
ioUKMONCMRWFNCEP

Monthly average FAR
Monthly average FAR values over Kenya
00.1
0.20.3
0.40.5
0.60.7
0.80.9
JAN FEB MAR APR MAY JUN JUL AUG SEP
Month
Fals
e al
arm
ratio
UKMO NCMRWF NCEP
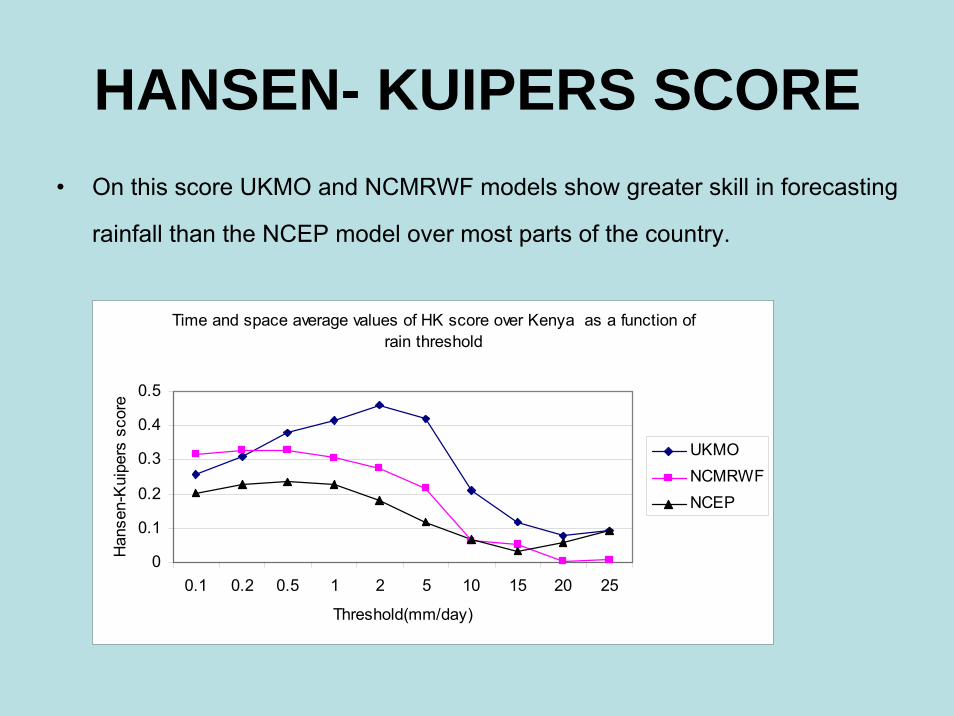
HANSEN- KUIPERS SCORE• On this score UKMO and NCMRWF models show greater skill in forecasting
rainfall than the NCEP model over most parts of the country.
Time and space average values of HK score over Kenya as a function of rain threshold
0
0.1
0.2
0.3
0.4
0.5
0.1 0.2 0.5 1 2 5 10 15 20 25
Threshold(mm/day)
Han
sen-
Kui
pers
sco
re
UKMONCMRWFNCEP

SUMMARY AND CONCLUSIONS• The results showed significant monthly variations of RMSE. For all
the models the RMSE was largest during the rainy season of MAM. However the RMSE was found to be low for the drier months. The RMSE was particularly high on occasions of heavy precipitation which all the models failed to simulate
• The models overestimate the frequency of rainfall for light rainfall while underestimating the same for heavy rainfall.
• The probabilities of detection values were found to be very highespecially for the UKMO model
• This model detected more than 80% of rain occurrences at a threshold of 2mm/day. Thereafter the Probability of detection values dropped rapidly as a function of threshold. A probable conclusion here is that it is much more difficult for the models to detect heavy rainfall than light rainfall. NCEP model generally had the lowest POD values.
• Model skill as measured by Hansen-Kuipers(HK) score indicated that UKMO and NCMRWF models had greater skill in forecasting rainfall than the NCEP model over most parts of the country
• On the overall, no single model was better than the others in all aspects of accuracy and skill. The UKMO tended to have higher values of bias than the other models. It also overestimated amounts of rainfall. However it was able to detect presence of rainfall better than the other models and its Hansen-Kuipersscore was higher. On the other hand NCMRWF model tended to have lower values of bias. Its false alarm ratio scores were also lower. Its Hansen -Kuipersvalues were also higher than the other models especially over western Kenya. On the whole NCEP model seemed to perform poorly in most of the skill scores than the other two models.

SUGGESTIONS FOR FURTHER WORK
• In order to produce better inter-comparison, it may be necessary to transform the gridded rainfall to a standard grid size, i.e 1°latitude-longitude. Observations of rainfall may also need to be analyzed and put on a similar grid.
• Efforts should also be made to acquire precipitation products from other global operational models such as ECMWF and Meteo-France models. The study should also be expanded to cover a larger region i.e. the whole of East Africa where these models are used to forecast daily rainfall.
• A longer period of study is necessary in order to be able to generalize the results. Collaboration efforts between the modeling centers and the Department should be sort in order to make it easier for acquisition of model output data for verification purposes.
• Other measures of skill should also be incorporated in the study in order to make the investigation as broad and exhaustive as possible. These are; threat score, equitable threat score, probability of false detection and Heidke skill score. Verification of other weather parameters such as wind speed and direction, humidity and temperature should also be done in order to get an overall picture of the performance of the models

» ACKNOWLEDGEMENTS• National Centers for Environmental Prediction (NCEP), • UK met office • National Centre for Medium range Weather Forecasting (NCMRWF) of India for availing their precipitation model
outputs.• WMO• Anna Ghelli•• REFERENCES
• A. Ghelli. and F. Lalaurette, (2001): Verification of precipitation forecasts over the Alpine region using a high density observing network. Journal of Weather and forecasting Vol. 17 pp. 239–249.
•• Brian A.C., K.J. Westrick, and C.F. Mass, (1998): Evaluation of MM5 and ETA-10 Precipitation forecasts over the
pacific North West during the cool season. Journal of Weather and Forecasting, vol. 14, pp 137-153.• Ebert E.E. and McBride J.L., (1999): Verification of quantitative precipitation forecasts from operational
numerical weather prediction models over Australia. Journal of Weather and forecasting, vol. 15, pp 103-121.
• Environmental Modeling Centre (2003): The GFS Atmospheric Model http://www.emc.ncep.noaa.gov/gmb/moorthi/gam.html
• Harolds E. B. and C.A. Dowswell, (1996): A comparison of Measures oriented and distributions oriented approaches to forecast verification. Journal of Weather and forecasting, vol. 11, pp 288- 303.
• Indenje M, F.H.M. Semazzi, and L.J. Ogallo, (2000): Enso Signals in East African Rainfall Seasons. Int.j. Climatol., 1 19-46.
• Jerome P.C., (2003): Comparative Verification of Recent Quantitative Precipitation Forecasts in the National Weather Service: A Simple Approach For Scoring Forecast Accuracy Journal of Weather and forecasting, vol. 18, pp 161- 183.
• Lynn E. J. and B.G. Olsen, (1996): Assessment of Quantitative Precipitation Forecasts: Journal of Weather and forecasting, Vol. 13, No. 1, pp. 75–83.
• Murphy, A.H and R.L. Winkler, (1987): A general framework for forecast verification Weather Review, 115 pp 1330-1338.
• Murphy, A.H., (1991): Forecast Verification: Its complexity and Dimensionality. Monthly Weather Review, 119, pp 1590-1601.
• Murphy, A.H., (1993): What is a good forecast? An essay on the nature of goodness in weather forecasting. Weather Review, 8, pp 281-293.
• Nurmi, P., (2003): Recommendations on the verification of local weather forecasts (at ECWMF member states). ECMWF Operations Department.
• Stanski H.R., L. J. Wilson, W. R. Burrows, (1989): Survey of Common Verification Methods in Meteorology. WMO World Weather Watch Technical Report No.8, WMO/TD No. 358.

• THANK YOU