
1 Christopher Gutteridge @cgutteridge. 2 Christopher Gutteridge @cgutteridge.

UNIVERSITY OF SOUTHAMPTON
FACULTY OF PHYSICAL SCIENCES AND ENGINEERING
School of Electronics and Computer Science
Enterprise Mobility and Social Media Analytics as
Leverage for Corporate Knowledge Management
by
Christopher Adetunji
A Thesis submitted in partial fulfilment of the requirements
for the Award of a PhD Degree
February 2018


UNIVERSITY OF SOUTHAMPTON
ABSTRACT
FACULTY OF PHYSICAL SCIENCES AND ENGINEERING
School of Electronics and Computer Science
Doctor of Philosophy
ENTERPRISE MOBILITY AND SOCIAL MEDIA ANALYTICS AS
LEVERAGE FOR CORPORATE KNOWLEDGE MANAGEMENT
by
Christopher Adetunji
Research has shown that Knowledge Management (KM), as a field of practice and study,
gained momentum from the rise of the World Wide Web (Web) in the 1990s. With the
extant growth of the Web into a full scale social space and the emergence of Social Media
(SM) platforms like Twitter, the hierarchical boundaries within the organisation are
broken down and a lateral flow of information is created. As socio-technical platforms,
social media are regarded as social machines that are co-constituted by humans and
technology to facilitate the social processes of knowledge sharing. These processes are
enabled by the ordinary social interaction and communication flow that exists within a
corporate organisation. In recent years, these social interactions have been phenomenally
facilitated by the increased use of social media (SM) as well as the consumerisation and
adoption of mobile devices within the workplace. Apart from the exponential increase in
the amount of potentially insightful data being generated, this trend has created some
tension between KM and SM in which SM is perceived as a new trend that threatens the
sustainability of KM as a viable field of practice. There is a division between scholars
who question the value of KM within the current socio-technical trends, given that KM
has previously suffered an image problem in the past, and those who argue for these
new socio-technical trends as an extension of knowledge management. To address this
dilemma, this work presents EMSoD — A Framework for repositioning KM within the
current socio-technical trends of Enterprise Mobility and Social (media) Data. The
framework highlights the cyclical interaction between the process of tacit to explicit
knowledge conversion, knowledge discovery from either – or a combination of – public
social media data and data from corporate social media within a managed platform.
At the core of this framework is KM value to organisations, for which a measurement
mechanism is also devised in this thesis. Also presented in this thesis is a granular study
of the impact of enterprise mobility on employee engagement as a function of their usage
satisfaction from mobile devices and social applications.


Contents
Authorship xiii
Acknowledgements xv
1 Introduction 1
1.1 Research Motivation and Problem Space . . . . . . . . . . . . . . . . . . . 3
1.2 Research Question . . . . . . . . . . . . . . . . . . . . . . . . . . . . . . . 5
1.2.1 Extended Research Question (ERQ) . . . . . . . . . . . . . . . . . 5
1.3 Research Aims and Objectives . . . . . . . . . . . . . . . . . . . . . . . . 6
1.4 Research Contribution/Publications . . . . . . . . . . . . . . . . . . . . . 6
1.4.1 Research Publications . . . . . . . . . . . . . . . . . . . . . . . . . 7
1.4.1.1 Journal Article . . . . . . . . . . . . . . . . . . . . . . . . 7
1.4.1.2 Conference Paper . . . . . . . . . . . . . . . . . . . . . . 8
1.5 Research Theme and Structure . . . . . . . . . . . . . . . . . . . . . . . . 8
2 Literature Review 11
2.1 Web Science and Knowledge Management . . . . . . . . . . . . . . . . . . 11
2.2 What is Knowledge Management? . . . . . . . . . . . . . . . . . . . . . . 12
2.3 The Current State of KM . . . . . . . . . . . . . . . . . . . . . . . . . . . 14
2.4 The Perceived Tension between KM and Social Media . . . . . . . . . . . 17
2.5 Knowledge Web Technologies . . . . . . . . . . . . . . . . . . . . . . . . . 18
2.6 The Social Machine Paradigm . . . . . . . . . . . . . . . . . . . . . . . . . 19
2.7 Employee Engagement and Knowledge Sharing . . . . . . . . . . . . . . . 22
2.7.1 Employee Engagement . . . . . . . . . . . . . . . . . . . . . . . . . 22
2.7.2 Knowledge Sharing . . . . . . . . . . . . . . . . . . . . . . . . . . . 24
2.8 Enterprise Mobility . . . . . . . . . . . . . . . . . . . . . . . . . . . . . . . 26
2.8.1 A Synoptic View . . . . . . . . . . . . . . . . . . . . . . . . . . . . 27
2.8.2 Document Analysis of Knowledge Management Literature . . . . . 27
2.8.3 What is Enterprise Mobility? . . . . . . . . . . . . . . . . . . . . . 29
2.8.4 Enterprise Mobility Management Strategies . . . . . . . . . . . . . 29
2.8.5 Privacy and Security . . . . . . . . . . . . . . . . . . . . . . . . . . 31
2.9 Knowledge Engineering from Big Data Analytic . . . . . . . . . . . . . . . 32
2.10 Chapter Summary . . . . . . . . . . . . . . . . . . . . . . . . . . . . . . . 33
3 Research Methodology 37
3.1 Methodology Overview . . . . . . . . . . . . . . . . . . . . . . . . . . . . . 37
3.1.1 Mixed Methods Research . . . . . . . . . . . . . . . . . . . . . . . 38
3.1.2 Triangulation . . . . . . . . . . . . . . . . . . . . . . . . . . . . . . 38
v

vi CONTENTS
3.2 Research Methods . . . . . . . . . . . . . . . . . . . . . . . . . . . . . . . 39
3.2.1 Literature Review . . . . . . . . . . . . . . . . . . . . . . . . . . . 42
3.2.2 Document Analysis . . . . . . . . . . . . . . . . . . . . . . . . . . . 43
3.2.3 Conceptual Framework . . . . . . . . . . . . . . . . . . . . . . . . 43
3.2.4 Thematic Analysis . . . . . . . . . . . . . . . . . . . . . . . . . . . 44
3.2.5 Case Study . . . . . . . . . . . . . . . . . . . . . . . . . . . . . . . 44
3.2.6 Knowledge Discovery . . . . . . . . . . . . . . . . . . . . . . . . . . 45
3.2.7 Textual/Data Analysis . . . . . . . . . . . . . . . . . . . . . . . . . 46
3.2.8 Survey Method . . . . . . . . . . . . . . . . . . . . . . . . . . . . . 46
3.2.9 Social Network Analysis . . . . . . . . . . . . . . . . . . . . . . . . 47
3.3 Chapter Summary . . . . . . . . . . . . . . . . . . . . . . . . . . . . . . . 47
4 The Conceptual Framework 49
4.1 Background . . . . . . . . . . . . . . . . . . . . . . . . . . . . . . . . . . . 49
4.2 Harmonisation of Literature . . . . . . . . . . . . . . . . . . . . . . . . . . 50
4.2.1 The Making of the Conceptual Framework . . . . . . . . . . . . . . 52
4.3 EMSoD - The Conceptual Framework . . . . . . . . . . . . . . . . . . . . 53
4.3.1 Managed Platform . . . . . . . . . . . . . . . . . . . . . . . . . . . 53
4.3.1.1 Enterprise Mobility Strategy . . . . . . . . . . . . . . . . 54
4.3.2 Tacit Knowledge . . . . . . . . . . . . . . . . . . . . . . . . . . . . 55
4.3.3 Social Media . . . . . . . . . . . . . . . . . . . . . . . . . . . . . . 58
4.3.4 Knowledge Discovery . . . . . . . . . . . . . . . . . . . . . . . . . . 63
4.3.5 KM Value for Organisations . . . . . . . . . . . . . . . . . . . . . . 63
4.4 Implementing the Framework . . . . . . . . . . . . . . . . . . . . . . . . . 64
4.5 Emergent Conceptual Model . . . . . . . . . . . . . . . . . . . . . . . . . 66
4.6 Chapter Summary . . . . . . . . . . . . . . . . . . . . . . . . . . . . . . . 66
5 Research Findings and Analysis 69
5.1 Measurement Mechanism for KM Value . . . . . . . . . . . . . . . . . . . 70
5.2 Knowledge Discovery from Social Media Data . . . . . . . . . . . . . . . . 71
5.2.1 A Case of Public Twitter Data for SMEs . . . . . . . . . . . . . . 71
5.2.2 Choosing a SME for the Case Study . . . . . . . . . . . . . . . . . 72
5.2.3 Organisational Change and the Enterprise Mobility Agenda . . . . 73
5.2.4 Data Gathering and Processing . . . . . . . . . . . . . . . . . . . . 73
5.2.5 Content Classification of Tweet Data . . . . . . . . . . . . . . . . . 76
5.3 Knowledge Elicitation from Tweet Data Contents . . . . . . . . . . . . . . 76
5.3.1 Impact of Technology on Disability . . . . . . . . . . . . . . . . . . 78
5.3.2 Information Gathering . . . . . . . . . . . . . . . . . . . . . . . . . 79
5.3.3 Political Opinions (#votecameronout) . . . . . . . . . . . . . . . . 80
5.3.4 Social Welfare Benefits . . . . . . . . . . . . . . . . . . . . . . . . . 81
5.3.5 Living with Autism . . . . . . . . . . . . . . . . . . . . . . . . . . 83
5.4 Actionable Knowledge from the Case Study . . . . . . . . . . . . . . . . . 83
5.4.1 Further Insights from Recent Twitter Data . . . . . . . . . . . . . 84
5.5 A Focus on Actionable Knowledge . . . . . . . . . . . . . . . . . . . . . . 85
5.5.1 Measurement Mechanism for ‘Actionable Knowledge’ . . . . . . . . 87
5.6 Engaged Workforce . . . . . . . . . . . . . . . . . . . . . . . . . . . . . . . 89
5.6.1 Social Network Analysis . . . . . . . . . . . . . . . . . . . . . . . . 90

CONTENTS vii
5.6.2 Understanding the Topical Network . . . . . . . . . . . . . . . . . 91
5.6.3 Limitation of the Topical Network . . . . . . . . . . . . . . . . . . 91
5.6.4 Understanding the Twitter (Structural) Network . . . . . . . . . . 93
5.6.4.1 Grouping the Network on the Basis of Node Importance . 95
5.6.4.2 Decomposing the Network Group of 93 Nodes . . . . . . 96
5.6.5 Measurement Mechanism for ‘Engaged Workforce’ . . . . . . . . . 98
5.7 Chapter Summary . . . . . . . . . . . . . . . . . . . . . . . . . . . . . . . 100
6 Survey Data Analysis and Findings 101
6.1 The Survey Instrument . . . . . . . . . . . . . . . . . . . . . . . . . . . . 102
6.2 Framing the Survey Questions . . . . . . . . . . . . . . . . . . . . . . . . . 102
6.3 Recruiting Survey Participants . . . . . . . . . . . . . . . . . . . . . . . . 103
6.4 Survey Questions Analysis and Discussions . . . . . . . . . . . . . . . . . 105
6.4.1 Survey Question 1 . . . . . . . . . . . . . . . . . . . . . . . . . . . 105
6.4.2 Survey Question 2 . . . . . . . . . . . . . . . . . . . . . . . . . . . 106
6.4.3 Survey Question 3 . . . . . . . . . . . . . . . . . . . . . . . . . . . 107
6.4.4 Survey Question 4 . . . . . . . . . . . . . . . . . . . . . . . . . . . 110
6.4.5 Survey Question 5 . . . . . . . . . . . . . . . . . . . . . . . . . . . 112
6.4.6 Survey Question 6 . . . . . . . . . . . . . . . . . . . . . . . . . . . 116
6.4.7 Survey Question 7 . . . . . . . . . . . . . . . . . . . . . . . . . . . 118
6.4.8 Survey Question 8 . . . . . . . . . . . . . . . . . . . . . . . . . . . 121
6.5 Key Findings from Survey Analysis . . . . . . . . . . . . . . . . . . . . . . 121
6.6 A Review of Key Findings from Survey . . . . . . . . . . . . . . . . . . . 125
6.7 Chapter Summary . . . . . . . . . . . . . . . . . . . . . . . . . . . . . . . 127
7 Conclusion and Recommendations 129
7.1 Conclusion . . . . . . . . . . . . . . . . . . . . . . . . . . . . . . . . . . . 129
7.2 Research Thesis Contribution . . . . . . . . . . . . . . . . . . . . . . . . . 131
7.3 Discussion and Recommendations . . . . . . . . . . . . . . . . . . . . . . . 131
7.4 Assumptions and Limitations . . . . . . . . . . . . . . . . . . . . . . . . . 132
7.5 Twitter versus Email — A Caveat . . . . . . . . . . . . . . . . . . . . . . 133
7.6 Future Work . . . . . . . . . . . . . . . . . . . . . . . . . . . . . . . . . . 134
7.6.1 Further Insights from additional Social Media Platforms . . . . . . 134
7.6.2 Dis-benefits of Employee Engagement on Social Media . . . . . . . 135
7.6.3 A Single Case Study for both Parameters of KMV . . . . . . . . . 135
7.6.4 Privacy and Security . . . . . . . . . . . . . . . . . . . . . . . . . . 135
7.7 Concluding Remark . . . . . . . . . . . . . . . . . . . . . . . . . . . . . . 136
Appendices 137
A Survey Questionnaire Sample 139
B Reasons why respondents say they enjoy the device they say they enjoyusing most at/for work 147
C Code references of the 5 Prevalent Themes from coded nodes 158
D Participants’ level of agreement with statements meant to check theveracity of the reasons why they enjoy the device they enjoy most 165

viii CONTENTS
E Participants’ frequency of putting the company’s device into non-workrelated use 174
F How often do participants use or access each of the social applicationpresented to them from mobile devices (Smartphone, tablet, etc.) 182
G A Sample of the Survey recruitment email 186
H A Copyright permission obtained from Emerald Insight 188
Bibliography 191

List of Figures
1.1 Tacit Knowledge Flow (Adapted from Google Images) . . . . . . . . . . . 2
2.1 The DIKW Pyramid. Source: (Rowley, 2007) . . . . . . . . . . . . . . . . 12
2.2 Nonaka’s Model of Knowledge Conversion (Nonaka and Takeuchi, 1995) . 26
2.3 A Word cloud for ‘Mobilisation’ from the literature . . . . . . . . . . . . 28
2.4 Enterprise Mobility. [Source: Banafa (2014)] . . . . . . . . . . . . . . . . . 30
2.5 Enterprise Mobility Management; from Notify Technology (2015) . . . . . 32
3.1 An Overview of Triangulated Research Methods . . . . . . . . . . . . . . 40
4.1 Enterprise Mobility and Social Data (EMSoD): A Framework for KM Value 62
4.2 KM in Social Media Era - A Process to Value Model . . . . . . . . . . . . 66
5.1 The Top 5 Languages of Tweets Polled . . . . . . . . . . . . . . . . . . . . 76
5.2 The Top 5 Countries of Tweets Polled . . . . . . . . . . . . . . . . . . . . 77
5.3 Original Tweet with Link to Project on Innovative Technology . . . . . . 78
5.4 Retracted Study Linking Vaccine to Autism . . . . . . . . . . . . . . . . . 78
5.5 The Proliferated Re-tweets of Political Opinion . . . . . . . . . . . . . . . 81
5.6 Public Spending on Benefits in the UK (Source: http://bit.ly/1dtVQEh) . 82
5.7 Tweet about Cure for Autism . . . . . . . . . . . . . . . . . . . . . . . . . 85
5.8 Top Issues from Newer Twitter Data . . . . . . . . . . . . . . . . . . . . . 85
5.9 Influencers Engagement Network Graph . . . . . . . . . . . . . . . . . . . 92
5.10 A Directed Network Graph of @unisouthampton . . . . . . . . . . . . . . 93
5.11 Graph of 93 Vertices, grouped according to Betweenness Centrality . . . . 96
5.12 Expanded Group of Nodes According to Betweeness Centrality . . . . . . 97
5.13 A Chart of Betweeness Centrality Spread among the 93 Vertices . . . . . 99
6.1 Full/Part time Workers according to Gender . . . . . . . . . . . . . . . . . 104
6.2 Frequency of Device Usage . . . . . . . . . . . . . . . . . . . . . . . . . . 106
6.3 Device Usage and Perceived Satisfaction . . . . . . . . . . . . . . . . . . . 107
6.4 Coded Nodes for Survey Participants’ Reasons for Laptop Preference. . . 108
6.5 Coded Nodes for Survey Participants’ Reasons for Desktop Preference. . . 109
6.6 Prevalent Themes across Coded Nodes. . . . . . . . . . . . . . . . . . . . 110
6.7 Respondents level of agreement with Statement 3 . . . . . . . . . . . . . . 111
6.8 Respondents level of agreement with Statement 4 . . . . . . . . . . . . . . 112
6.9 A Chart of Participants’ Responses to “Own or Company’s Device”? . . . 113
6.10 Device Ownership and Usage Satisfaction . . . . . . . . . . . . . . . . . . 114
6.11 Using Company’s Device to Keep in touch with Friends and Family . . . 117
6.12 Using Company’s Device to Keep in touch with Work Colleagues . . . . . 117
ix

x LIST OF FIGURES
6.13 Level of Importance Attached to Knowledge Sharing . . . . . . . . . . . . 119
6.14 Usage Frequency for Twitter/Yammer . . . . . . . . . . . . . . . . . . . . 122
6.15 Usage Frequency for Facebook . . . . . . . . . . . . . . . . . . . . . . . . 122
6.16 Usage Frequency for Whatsapp . . . . . . . . . . . . . . . . . . . . . . . . 123
6.17 Usage Frequency for Snapchat . . . . . . . . . . . . . . . . . . . . . . . . . 123
6.18 Usage Frequency for Skype . . . . . . . . . . . . . . . . . . . . . . . . . . 124
6.19 Usage Frequency for Email . . . . . . . . . . . . . . . . . . . . . . . . . . 124
6.20 Usage Frequency for Google+ . . . . . . . . . . . . . . . . . . . . . . . . . 125

List of Tables
2.1 Historical Information Sharing Technologies . . . . . . . . . . . . . . . . . 16
2.2 Bain & Company’s Top 10 Management Tools . . . . . . . . . . . . . . . . 23
2.3 Document Types of KM Literature . . . . . . . . . . . . . . . . . . . . . . 28
3.1 A Mapping of Research Questions with Research Methodology/Methods . 41
3.2 Indications of Research Methods . . . . . . . . . . . . . . . . . . . . . . . 42
4.1 Harmonisation of Literature . . . . . . . . . . . . . . . . . . . . . . . . . . 51
5.1 Distribution of Tweets by Languages . . . . . . . . . . . . . . . . . . . . . 75
5.2 Tweets without Country Value . . . . . . . . . . . . . . . . . . . . . . . . 75
5.3 Content Classification of Tweet Data . . . . . . . . . . . . . . . . . . . . . 77
5.4 Knowledge Contents and their Weights . . . . . . . . . . . . . . . . . . . . 88
5.5 Graph Metrics for the Directed Network Graph of @unisouthampton (Fig-ure 5.10) . . . . . . . . . . . . . . . . . . . . . . . . . . . . . . . . . . . . . 94
5.6 Graph Metrics for the Network Graph of 93 Vertices identified within theUniversity of Southampton’s Twitter Network . . . . . . . . . . . . . . . . 95
5.7 Groups of Vertices according to Betweeness Centrality metric . . . . . . . 96
5.8 Top 12 Individual Node Metrics . . . . . . . . . . . . . . . . . . . . . . . . 98
6.1 Survey Questionnaire Response and Completion Rates . . . . . . . . . . . 102
6.2 Number of Part-time/Full Time Workers according to Gender . . . . . . . 105
6.3 Device Usage Frequency Table . . . . . . . . . . . . . . . . . . . . . . . . 105
6.4 Participants’ Use of their Own Device or Company’s Device . . . . . . . . 113
6.5 Device Ownership and Employee Usage Satisfaction . . . . . . . . . . . . 114
6.6 Chi-Square Test Results based on Device Ownership and Usage Satisfac-tion (Figure 6.10) . . . . . . . . . . . . . . . . . . . . . . . . . . . . . . . . 115
6.7 Correlation Between Device and Usage Satisfaction . . . . . . . . . . . . . 116
6.8 Company’s Devices for some Personal Use . . . . . . . . . . . . . . . . . . 118
6.9 Level of importance attached to Knowledge sharing . . . . . . . . . . . . . 120
xi


Declaration of Authorship
I, Christopher Adetunji, declare that this thesis and the work presented in it are my own and
has been generated by me as the result of my own original research on:
Enterprise Mobility and Social Media Analytic as Leverage for
Corporate Knowledge Management
I confirm that:
• This work was done wholly or mainly while in candidature for a research degree at this
University;
• Where any part of this thesis has previously been submitted for a degree or any other
qualification at this University or any other institution, this has been clearly stated;
• Where I have consulted the published work of others, this is always clearly attributed;
• Where I have quoted from the work of others, the source is always given. With the
exception of such quotations, this thesis is entirely my own work;
• I have acknowledged all main sources of help;
• Where the thesis is based on work done by myself jointly with others, I have made clear
exactly what was done by others and what I have contributed myself;
• Parts of this work have been published as:
— Adetunji, C. and Carr, L. (2016). Knowledge Discovery from Social Media Data: A
Case of Public Twitter Data for SMEs. In: 8th International Conference on Informa-
tion, Process and Knowledge Management (eKnow), (c), 2016, Venice: IARIA XPS Press,
p.119125.
— Adetunji, C. and Carr, L. (2017). EMSoD A Conceptual Social Framework that
Delivers KM Values to Corporate Organizations. International Journal on Advances in
Software, 9 (3&4), p.303 - 321.
Signed:
Date:
xiii


Acknowledgements
I give glory to God almighty, in whom I live, I move and have my being; and, without
whose grace, provision and sustenance, I wouldn’t have been able to complete this PhD
research project.
Although, it’s been an arduous journey, the experience has been altogether worthwhile.
In retrospect, I wouldn’t have been able to commence on the journey at all, had Drs Lisa
Harris and Thanassis Tiropanis not considered and recommended my application. Prof
Leslie Carr, an erudite scholar of impeccable credentials who, throughout what I call my
apprenticeship, rigorously drilled out the best in me, and for whose insightful supervision
and support this project has not remained a pipe dream, I am forever grateful. Dr Gary
Wills, following my upgrade viva, meticulously provided me with very meaningful expert
feedback by which I was guided on to the motorway of speedy completion. I thank you
sincerely for your incredibly exceptional manner of addressing, motivating and believing
in me and my work.
A numerous number of academic, research, and administrative staff within the Web
and Internet Science (WAIS) lab have been tremendously helpful directly and/or indi-
rectly. These include all my survey participants and especially Brigitte Mayne-Reed, who
helped in recruiting them. I must thank Drs Yvonne Howard, Simon Hettrick, Charlie
Hargood, Ramine Tinati, Steven Crouch, Rikki Prince and Priyanka Singh. Also, Dr.
Tope Omitola, Adriana Wilde, John Robinson, Christopher Gutteridge, Nicola Need,
Ola Oluwasuji, Jane Morgan, Claire Wyatt, and a host of others, too numerous to men-
tion. I cannot but mention Gunawan Budiprasetyo, with whom I shared an office space,
with whom I’ve regularly burnt the midnight oil, and with whom I’ve sometimes visited
Indonesia without having to leave the office. Also of notable mention are some exter-
nal resource persons like Ms Laura Spooner, whose professional advice helped during
my survey design, and Mr Henrik Holgerson, who facilitated access to the case study
organisation used in this research.
To my very own jewel of inestimable value who granted me the sabbatical away from
home whilst shouldering the upkeep and other responsibilities at home, thank you so
very much, Bukola, for your relentless support and for being such a wonderful woman of
valour. And, my two lovely angels of the BP Crew — Jesse and Michelle — How can
we not talk about family when family’s all that we got? , thank you for rocking
my world! Now, we gat to get doin our thang again. . .
xv


forToluwani & Ogooluwa
xvii


Chapter 1
Introduction
The consumerisation of mobile devices has driven the popularity of social media and cre-
ated a class of personalised Web-based information applications. This has impacted the
strictly-controlled world of corporate IT services, creating an agenda of Enterprise Mo-
bility that is implemented by employee-owned devices adapted for company use and/or
company-owned devices that support personal use. Consequently, an enormous amount
of rapid and varied data is being produced by social applications embedded in the
workplace, potentially available for organisations insights, using techniques of Big Data
Analytics (Zikopoulos et al., 2012; Lamont, 2012), largely because Web social networks
like Twitter and Facebook have made social networks tangible sources of realistic big
data (Cuzzocrea, 2014). These trends and concepts can be understood by the study
of Social Machines as a unified model for social/computing processes (Buregio et al.,
2013). Essentially, Social Machines are abstract systems in which humans do the creative
work and machines do the [computational] administration (Berners-Lee and Fischetti,
2000). Based on this premise, Shadbolt (2013) presents a vision of the Social Machine as
Knowledge Acquisition systems. This research is therefore focused on how to exploit the
socio-technical convergence of Enterprise Mobility and Social Data Analytics for knowl-
edge capture and sharing, with the aim of developing a model knowledge social machine
that helps Knowledge Management (KM) deliver value to corporate organisations.
KM within organisations has traditionally been through a top-down, process approach
(Ford and Mason, 2013a, 7); (Turban et al., 2011b) which precludes employees from
collaborating and/or participating in the process of generating and sharing valuable
knowledge that is relevant for the organisations competitive advantage. In making KM
a part of everyone’s job (Davenport and Prusak, 1998, 107), the top-down approach
to KM is being broken down by current and emerging Web technologies like microblogs
(e.g., Twitter), social media/networking (e.g. YouTube/Facebook), and multimedia chat
platforms (e.g. Skype) (Razmerita et al., 2014). These are pervasive technologies, and
are most profound in their capabilities to, in the words of Mark Weiser of Xerox Lab
1

2 Chapter 1 Introduction
Figure 1.1: Tacit Knowledge Flow (Adapted from Google Images)
(Sorensen, 2011), weave themselves into the fabrics of everyday life until they are in-
distinguishable from it, thanks to the ubiquity (and consumerisation) of mobile devices
like tablets and smart phones. In recent times, these devices have woven themselves
around us in so much so that employees are impulsively using them to keep in touch
with friends and families even while at work. Many organisations have therefore, al-
ready subscribed to the theory and practice of enterprise mobility on the grounds that,
allowing employees to access corporate systems and data over these devices — a policy
known as Bring Your Own Devices (BYOD) — enhances productivity while also helping
to maintain work and life balances (Sørensen et al., 2008). It also enhances knowledge
sharing within the organization in its capacity for fostering discussions over documents
and thereby enabling organisations to build social environment or communities of prac-
tice necessary for facilitating the sharing of tacit knowledge (Davenport and Prusak,
1998; Zikopoulos et al., 2012, p.26).
Tacit knowledge is usually in the domain of subjective, cognitive and experiential learn-
ing; it is highly personal and difficult to formalise (Turban et al., 2011a, p.478), which
is why Polanyi (2009) classifies tacit knowledge as one class of knowledge for which we
cannot tell as much as we know. How then do we capture and/or engineer this tacit
knowledge being inadvertently generated by employees in the enterprise mobility and
social media space? This research attempts answering this question from a big social

Chapter 1 Introduction 3
data perspective, drawing insights from the literature, and, using a conceptual social
framework - EMSoD. Moreover, a vision of a knowledge social machine is encapsu-
lated in this framework, which leverages the flow of tacit knowledge on existing social
interactions within the boundary of the organisation as defined by its enterprise mo-
bility strategies. This social machine has the organisations workforce as its user base,
using their own devices (BYOD) or using the company-owned devices that have been
personally enabled for them (COPE). The social machine produces company-relevant
insights and knowledge as output, taking its input from a combination of internal data
(enterprise social media, transactional data, system/web logs, etc.) and open/public
data, together with the active participation of the employees, in the process of knowl-
edge management. This vision is illustrated in Figure 1.1 and elaborated upon in the
conceptual framework presented in Chapter 4
Also, to gain a better insight into the organisation’s knowledge, this work explores ex-
ploitation of the collective intelligence of the organisation within the spectra of enterprise
mobility and enterprise social network for organisational insights.
1.1 Research Motivation and Problem Space
The traditional top-down approach to KM mentioned in the introduction above has
also resulted in KM becoming a lacklustre concept, considering the perceived lack of
maturity and the general state of apathy in the field, as evidenced in a recent Knowledge
Management Observatory survey referenced by Griffiths and Moon (2011) and the 2015
follow up of same report (Griffiths et al., 2015). This research attempts to explore
how these innovative technological trends of mobility and social media analytics can be
exploited for rejuvenating the concept and practice of KM (Delic and Riley, 2009).
There is hardly any sector in which organisations have not embarked on a Knowledge
Management programme or project to improve on their organisation practice; research
has shown that knowledge-oriented management has a significant influence on perfor-
mance, in spite of the image problem suffered by KM due to its overselling by vendors
and consultants in the 1990s (Bolisani and Handzic, 2015).
To shake off this image problem and to douse the perceived tension between KM and
social media by which some scholars question the continued relevance of KM in spite
of a persistent social media ascendancy (Ford and Mason, 2013b), participants in a re-
cent massive survey into the future of KM by the Global Knowledge Research Network
(GKRN - Network of Researchers sharing an interest in undertaking joint research on
knowledge management) published in Bolisani and Handzic (2015), regard social soft-
ware as an advancement of the KM field. The research suggestion in this regard, places
clear emphasis on the economic, organisational and human context factors related to

4 Chapter 1 Introduction
the use and implementation of this new social software technologies. This organisa-
tional and human context factor is what culminated in the concept of Enterprise Social
Networking, also referred to as Enterprise 2.0 (or E2.0, for short). Although, some of the
proponents of Knowledge Management were initially hostile towards the new concept
of E2.0 as propagated by McAfee (2006), describing it as a new wine in an old bottle,
Davenport (2008) for one, concluded in a Harvard Business Review’s blog post that,
‘If E2.0 can give KM a mid-life kicker, so much the better. If a new set
of technologies can bring about a knowledge-sharing culture, more power to
them. Knowledge Management was getting a little tired anyway.’
These new sets of technologies that can bring about a knowledge sharing culture has been
found in social media and their social networking capabilities, as enabled and popularised
by the consumerisation of mobile devices. KM can therefore, be repositioned within these
innovative technological trends of enterprise mobility and social media analytics, which
can be exploited for rejuvenating the concept and practice of KM, in consonance with
Delic and Riley (2009)’s assertion that,
‘The field of knowledge management, having passed several hypes and dis-
appointments, has yet another chance of reappearing in totally new techno-
logical and social circumstances.’
In essence, rather than considering Social Media as a pervasive trend that threatens the
concept and practice of Knowledge Management, this study aims at finding a fusion
between the two. Such fusion as brings about a knowledge sharing culture and thereby
help in rejuvenating the concept and practice of Knowledge Management altogether.
The overarching issue recognised in the GKRN research mentioned above is the chal-
lenge for KM in being able to deliver measurable value for businesses. The conceptual
social framework (see Section 4.3) presented in this research places the value proposition
of KM at the centre of organisational knowledge management processes. To the best
of this researcher’s knowledge, this is the first framework of its kind that seeks to use
the convergence of enterprise mobility and social (media) data as leverage for corpo-
rate knowledge management in such a way that corporate organisations can derive KM
value from the synergy. Also, this framework not only helps in delivering KM value to
corporate organisations, it also serves to answer the research question of an appropriate
framework for such a task, as posed in the Extended Research Question (ERQ 1) in
Section 1.2.1. Meanwhile, this framework has not been arrived at on the fly. The core
elements of the framework have emanated from a rigorous review of relevant literature,
the process of which is described in Section 4.2.

Chapter 1 Introduction 5
1.2 Research Question
Based on the research motivation and a thematic review of literature that cuts across
Chapter 2 and the Conceptual Framework proposed in Chapter 4, some key points
emerge: That KM, which gained momentum through the rise of the Web in the 1990s,
has now grown to a full-blown social space, as powered by social media platforms like
Twitter. Social media has broken down the hierarchical boundaries within the corporate
organisation, creating a lateral flow of information. This facilitates knowledge sharing,
which is underpinned by the ordinary social interaction within the organisation, enabled
by the consumerisation of mobile devices and applications.
This trend has resulted in an exponential increase in the volume of varied data and the
speed at which they are generated. This data is potentially rich in insightful knowledge
for the competitive advantage of corporate organisations. Also, this trend has created a
perceived tension between KM & social media (SM) in which SM is seen as threatening
the continued relevance of KM as a management function. The debate is polarised
between scholars who question the continued relevance of KM within the current socio-
technical trends on one hand, and those who see SM as an extension of KM. However,
no proposed modalities for integrating SM as an extension of KM. Also, KM still suffers
from the image problem of the past in which it is criticised for a want of measurable
value.
This research therefore, sets out to answer an overarching formative question of how
social media platforms like Twitter can deliver measurable value to corporate organisa-
tion:
“How Can Social Media Platforms like Twitter Deliver Knowledge Manage-
ment Value to Corporate Organisations?”
1.2.1 Extended Research Question (ERQ)
In an attempt to discover the best approach at deriving KM value from the convergence
of KM and SM, the overarching research question is extended to finding an appropriate
framework that helps in re-positioning KM within the current trend of enterprise mo-
bility and social media in such a way that corporate organisations derive value from the
synergy(ERQ 1). Secondly, the National Audits Office, which is the office from which
Government’s expenditures are held accountable to Parliament, defines Value for Money
as the optimal use of resources to achieve an intended outcome. So, what intended out-
comes from an investment in social media-oriented initiative can KM value be measured
by? (ERQ 2). The research question is also extended to cover how social media — as
resources, coupled with the mobile social applications and devices that power them —
serve as leverage to achieve the intended outcomes (ERQ 3).

6 Chapter 1 Introduction
Basically, the Extended Research Question is stated as follows:
ERQ 1. What is an appropriate social framework for delivering KM values?
ERQ 2. What are the intended outcomes from social media by which KM values can be
measured?
ERQ 3. What are the impacts of mobile devices and social applications on employee en-
gagement?
1.3 Research Aims and Objectives
This research is mainly aimed at studying the convergence of enterprise mobility and
social media trends with a view to exploring how enterprise mobility and social media
trends can be exploited for knowledge management value that enhances the competitive
advantage of corporate organisations.
In achieving this aim, the research proceeds on the basis of the following specific objec-
tives:
1. To analyse prevalent themes in KM literature in order to develop an appropriate
framework for deriving KM value from social media
2. To conduct a primary empirical inquiry that investigates the potential discovery
from social media data, of insightful domain knowledge that propels an organisa-
tion’s competitive advantage.
3. To establish the parameters and the mechanism for measuring KM value derived
from the framework.
4. To collect and analyse primary data through survey for gaining a general overview
on the impact of mobile devices and mobile (social) applications on employee
engagement.
5. To make recommendations that potentially empowers corporate organisations and
Knowledge Management practitioners on the systematic utilisation of findings from
this research for the derivation of KM value and enhancement of competitive ad-
vantage.
1.4 Research Contribution/Publications
In redressing the image problem faced by Knowledge Management (KM) and its criti-
cism for a lack of measurable value, this research has delivered EMSoD — Enterprise

Chapter 1 Introduction 7
Mobility and Social Data — as an appropriate conceptual social framework for de-
livering KM value to corporate organisations. KM value is measured in terms of the
actionable knowledge discoverable from an abundance of social media data available to
an organisation, as well as the level of employee engagement facilitated by social appli-
cations and the mobile devices that power them.
Meanwhile, the significance of this research is not only in its delivery of the EMSoD
social framework for delivering KM value but also in the devising of a measurement
mechanism by which both parameters of KM value — actionable knowledge and employee
engagement — can be measured. To the best of this researcher’s knowledge, this is the
first attempt at devising a measurement mechanism for KM value, and one that satisfies
both academic and business concerns, given that businesses are increasingly being faced
with a need to justify KM investments in terms of normalised quantitative measures
while developing a case for returns on such investments.
Moreover, the opportunity to harness actionable knowledge and insights from social
media data for the strategic competitive advantage of corporate enterprises is not being
exploited by small and medium-scale enterprises (SMEs) as much as it is by larger
enterprises. This is due in part, to a self imposed exclusion by SMEs themselves, as I
have observed. That is, self imposed exclusion borne out of consideration for cost and
the question of relevance. This research has demonstrated, through a systematic, cost-
effective approach to knowledge discovery from social media data, how any enterprise
of any size — even the small and the medium scaled ones — can exploit social media
data for its strategic competitive advantage, and this is regardless if its presence or
participation on social media.
Meanwhile, in relation to the above, the research contribution includes the publications
outlined in Section 1.4.1
1.4.1 Research Publications
1.4.1.1 Journal Article
Adetunji and Carr (2016a). EMSoD — A conceptual social framework that delivers KM
values to corporate organisations, Int. J. Adv. Softw., vol. 9, no. 3&4, pp. 304–322,
Dec. 2016.
Abstract — As social software is becoming increasingly disruptive to organisational
structures and processes, Knowledge Management (KM) initiatives that have hitherto
taken the form of a ‘knowledge repository’ now need redefining. With the emergence
of Social Media (SM) platforms like Twitter, the hierarchical boundaries within the
organisation are broken down and a lateral flow of information is created. This has
created a peculiar kind of tension between KM and SM, in which one is perceived as

8 Chapter 1 Introduction
threatening the continued relevance of the other. Particularly, with the advances of
social media and social software, KM is more in need of delivering measurable value
to corporate organisations, if it is to remain relevant in the strategic planning and
positioning of organisations. In view of this, this paper presents EMSoD — Enterprise
Mobility and Social Data — a conceptual social framework which mediates between KM
and SM to deliver actionable knowledge and employee engagement. Meanwhile, given
that the main objective of this research is in the delivery of KM value to corporate
organisations, this paper devises some mechanisms for measuring actionable knowledge
and employee engagement, both as parameters of KM value.
1.4.1.2 Conference Paper
Adetunji and Carr (2016b). Knowledge discovery from social media data: a case of
public twitter data for SMEs, in eKNOW 2016, The Eighth International Conference on
Information, Process, and Knowledge Management, 2016, pp. 119125.
Abstract — Making sense of social media data is increasingly becoming a subject of
concern to corporate organisations. It is therefore, no coincidence that the subject of
Knowledge Identification and Discovery is currently receiving a huge attention within in-
dustry and academia. Research has shown that there is an enormous wealth of actionable
knowledge to be gained from social media data for organisations strategic competitive
advantage. However, this opportunity is not being harnessed by Small and Medium-
sized Enterprises (SMEs) as much as it is by larger enterprises. This is due, in part,
to a misconception that social media is not that relevant to SMEs as much as it is to
larger corporations. This paper presents a qualitative exploratory study, which attempts
to show that social media can be mined for organisational knowledge that is relevant
to the strategic competitive advantage of SMEs. A case of a medium-sized enterprise,
which is previously without a significant social media presence, is explored with regards
to how public Twitter data is exploited to discover actionable knowledge that propels
the enterprises strategic competitive advantage.
1.5 Research Theme and Structure
Themed with Sociam — the theory and practice of Social Machines (http://sociam.org)
— a secondary aim of this research is to conceptualise a model knowledge social ma-
chine as a contributory effort towards the theory and practice of social machines, a
ground breaking research project pioneered by leading researchers and academics at the
University of Southampton and across the UK. Studying the implications of Enterprise
Mobility and Social Data Analytics on KM can be understood by the study of Social
Machines as a unified model for social/computing processes (Buregio et al., 2013). In

Chapter 1 Introduction 9
chapter 2 therefore, this work presents an understanding of current knowledge-oriented
Web technologies vis-a-vis the social machine paradigm (See Chapter 2.6). A compara-
tive study of current Web technologies within the context of knowledge elicitation and
sharing help in identifying gaps in the theory and practice of social machines that this
research’s social knowledge machine vision will fulfil. Then, the work focuses on the
emerging trends of Big (Social) Data Analytics and Enterprise Mobility (COPE and
BYOD) as functions of Enterprise Social Networking. The former serves as a parameter
for measuring knowledge extraction while the later serves to measure knowledge shar-
ing. This takes a cursory look at the value and impact of integrating knowledge sources
(Wimmer et al., 2013) while linking social, open and enterprise data (Omitola et al.,
2014). The aim of this review was to identify the gap that exists within the current sta-
tus of Knowledge Management. This has helped in establishing a conceptual framework
to resolve the research motivation and problem space described above.
The rest of the thesis develops in this fashion: The research methodology is presented
in Chapters 3 while the conceptual framework — with its core elements — is presented
in Chapter 4. Meanwhile, Chapter 5 is relatively bulky, not only because it contains the
substance of this research work, which is its findings, but also because it enunciates the
data-driven process of arriving at Knowledge Management Value (KMV) and its mea-
surement parameters of actionable knowledge and an engaged workforce. The thesis also
contains a section (Chapter 6) wholly dedicated to the analysis and findings from a sur-
vey questionnaire, which highlights the major impacts of enterprise mobility — in terms
of mobile devices and mobile applications — on employee engagement and knowledge
sharing. Chapter 7 summarises and concludes the thesis with some recommendations
for corporate organisations as well as suggestions for future direction towards which this
work could be extended. The chapter also discusses some assumptions that guide the
research while acknowledging its limitations.


Chapter 2
Literature Review
This chapter provides a contextual background to this research as it explores the liter-
ature that has culminated in an understanding of enterprise mobility, social media and
knowledge management. An understanding of these concepts would help in appreciating
how enterprise mobility could serve as leverage for corporate knowledge management.
As this research is under the auspices of the Web Science Institute of the School of
Electronics and Computer Science, this chapter begins with an attempt to create an
understanding of the role of the Web in the evolution and development of knowledge
management as a management function.
2.1 Web Science and Knowledge Management
James Hendler, Nigel Shadbolt et al. (2008) and Hall et al. (2006) describe Web Science
as an interdisciplinary field of studies concerned with the study of large-scale socio-
technical systems, such as the World Wide Web. They suggest the study of the Web
as distinct entity of its own, having its own protocol, infrastructure, algorithms and
architectural principles, positing that this would help in understanding some of the
technical and social challenges that must be overcome in order to keep the Web growing,
and understand its continued social impact. Essentially, Web Science attempts to create
an understanding of how the Web benefits the human race (Web Science Institute —
University of Southampton).
As such, the Web was instrumental to the birth of Knowledge Management in the
1990s when consultants found that they could leverage the organisation’s knowledge on
Internet technologies, using the Intranet to share and connect document and information
across their various sites (Koenig, 2012). Now that the Web has grown into a full scale
social space, with social media being the most conspicuous face of the Web, Knowledge
Management on the social Web can be understood through the theory and practice of
11

12 Chapter 2 Literature Review
social machines, which is the main thrust of Web Science as a field of study (Tiropanis
et al., 2015).
2.2 What is Knowledge Management?
According to Koenig (2012), Davenport’s (1994) definition of Knowledge Management
as “the process of capturing, distributing, and effectively using knowledge”, is still the
widely quoted definition while, a few years later, Gartner Group (A global research and
advisory company) expanded the definition as follows:
“Knowledge management is a discipline that promotes an integrated ap-
proach to identifying, capturing, evaluating, retrieving, and sharing all of an
enterprise’s information assets. These assets may include databases, docu-
ments, policies, procedures, and previously uncaptured expertise and expe-
rience in individual workers”
The above definitions purport that knowledge is always tangible in nature. This arises
from the view of knowledge in terms of the distinction between data and information
wherein, data is considered as raw facts, figures and/or symbols while information is the
meaning derived when data is processed (Ackoff, 1999). The distinction between data,
information, knowledge and wisdom is often modelled with the the wisdom hierarchy
(Rowley, 2007), which highlights the progression from data to wisdom, as represented
by the DIKW pyramid in Figure 2.1.
Figure 2.1: The DIKW Pyramid. Source: (Rowley, 2007)
The proportional significance of each element of the pyramid in (see Figure 2.1) in
relation to the one below it, is captured in Ackoff’s (1999) assertion that,
1. An ounce of information is worth a pound of data.
2. An ounce of knowledge is worth a pound of information.
Chapter 2 Literature Review 13
3. An ounce of understanding is worth a pound of knowledge.
Knowledge Management is essential, not only because of the worth of knowledge in
comparison to information, but also because knowledge is considered the most important
resource for an organisation’s competitive advantage, according to the knowledge based
view (KBV) of the organisation (McIver and Wang, 2016; Vanini and Bochert, 2014;
Kirsimarja and Aino, 2004).
However, there are other perspectives of KM that define it, not only in terms of its tangi-
bility as evident in the distinction between data, information and knowledge, but also in
terms of its tacit dimension. One of the definitions that encapsulate these perspectives
is the one advanced by Alavi (1999):
“A System and organisationally specified process of acquiring, organising
and communicating both tacit and explicit knowledge of employees so that
other employees can use it to be more effective and productive in their own
work”
Alavi’s (1999) definition is more all-encompassing as it recognises the tacit dimension
(Polanyi, 2009) of knowledge, which makes knowledge actionable piece of information
that is possessed in the minds of individuals, making it difficult to formalise and ex-
ternalise. Social media helps in the spontaneous externalisation of thoughts even on
the spur of the moment (Ziko-2012). This places this research in perspectives, as it
explores how this social media capability can be harnessed in the realisation of the tacit
to explicit knowledge conversion, which is one of the major challenges of KM. This is in
consonance with McDermott’s (1999) assertion that “the art of professional practice is
to turn information into solution”.
Tacit knowledge, as identified in Alavi’s (1999) definition of KM, is not as easy as ex-
plicit knowledge to codify, document and circulate by way of sharing. Tacit knowledge
is usually in the subjective domain of cognitive and experiential learning (Turban et al.,
2011a, p.478). There is necessarily a spiral interaction between the processes of sociali-
sation, internalisation, externalisation and combination through which tacit knowledge
can be rendered explicit (Nonaka and Takeuchi, 1995).
For this research, Knowledge Management’s efforts are not limited to ‘knowledge of em-
ployees’, as this seems to be a limitation set by the Alavi’s (1999) definition. KM is
regarded as connoting all organisational efforts at managing and integrating all sorts
of knowledge that are relevant to the organisation’s prosperity. These include envi-
ronmental knowledge, knowledge of competition, knowledge of customers, knowledge of
products and, of course, knowledge held by employees.
14 Chapter 2 Literature Review
2.3 The Current State of KM
In an attempt to ascertain the current state of KM, it is pertinent to profile a brief
background into its evolution and development, as enabled through the advances in
Web technologies.
Wiig (1997) uses Treacy and Wieserma’s (1993) model to illustrate an evolutionary
perspective of Knowledge Management by observing how economic focus has shifted
over time: during the Industrial Revolution of the 18th/19th century and Information
Revolution of the 20th century, economic focus was on operational excellence. Having
presented a 20-year time-line of the evolution of Knowledge Management, Wiig (1997)
posits that the 21st century marks the advent of the Knowledge Revolution where focus
has now shifted towards how well knowledge and other intellectual assets are brought to
bear as differentiating competitive factors for organisations. He predicts the future of
KM from four perspectives, which are, (i) the extent of KM as a continuous management
initiative; (ii) the scope of efforts that will be undertaken to manage knowledge; (iii) the
speed of evolution of KM methods and practices; (iv) the availability and sophistication
of KM tools and technological infrastructure
Gaines (2013) observes that prediction about future directions [of KM] are often incor-
rect. He however describes the Internet as an “essential extension of our selves, providing
multimedia memory expansion, instant access to a dynamic corpus of knowledge well
beyond our capabilities to assimilate and store, and instant communication with our so-
cial networks”. This highlights the significance of social networks in the current state of
KM even as participants in a recent massive survey into the future of KM by the Global
Knowledge Research Network (GKRN) regard social software as an advancement of the
KM field (Bolisani and Handzic, 2015).
Vanini and Bochert (2014) use the concept of knowledge management maturity in an
attempt to determine what level of KM maturity is effective and efficient for a company.
They conducted an exploratory study, which shows that the practical applicability of
KM maturity models is still limited, as evidenced in their conclusion that none of the
companies they surveyed could be categorised as having a high KM maturity level despite
their multiple uses of KM tools. This perceived lack of maturity in the field, is evidenced
in a Knowledge Management Observatory referenced in Delic and Riley (2009), which
made Delic and Riley (2009) posit that the field of KM, having passed several hypes and
disappointments... has yet another chance of reappearing in totally new technological
and social circumstances.
As stated earlier, the 21st century marks the advent of the Knowledge Revolution, which
is usually referred to as the Knowledge Economy (Powell and Snellman, 2004; Drucker,
1969). Intrinsic in this knowledge economy is a horizontal flow of knowledge, which
is facilitated by the new technological and social circumstances occasioned by social

Chapter 2 Literature Review 15
media and the technical Web infrastructure that powers them. For example, (Delic and
Riley, 2009, p.50) describe the computing infrastructure which hosts the blogosphere...
as a new form of ‘knowledge management’ which “looks like a big social agglomeration
providing a kind of collective intelligence”.
The above description of social software as a new form of knowledge management, cou-
pled with Mcafee’s (2006) and Davenport’s (2008) position on the same topic, has height-
ened the debate and the tension (see Section 2.4) between KM and social media (Ford
and Mason, 2013a; Bradley and McDonald, 2011); and the best attempt to resolve this
tension yet is in the GKRN survey where participants regard social media as an ad-
vancement of Knowledge Management.
Meanwhile, how did we arrive at this current state of KM where social software is
polemically entwined with KM? Succinctly, this can be attributed to the advent and
growth of the World Wide Web (the Web).
The Web has played a pivotal role in shaping the current state of KM. Carr et al.
(2010) chronicles the evolution of humans’ attempt to manage knowledge and informa-
tion flow from the traditional Press of Reuters in the 1850s through the commencement
of the exploitation of the Web for commerce and academy from the 1990s, as detailed
in Table 2.1. Also, between the year 2000 and 2006, the Engineering and Physical Sci-
ences Research Council (EPSRC) funded the Advanced Knowledge Technologies (AKT),
which is a collaborative project between internationally recognised research groups at
the Universities of Southampton, Aberdeen, Edinburgh, Sheffield and the Open Univer-
sity (AKT Project). AKT was aimed at understanding the best integrative approach at
tackling the challenges of knowledge creation and acquisition, modelling and represen-
tation, storage and retrieval, use and re-use, publication and maintenance. By the very
nature of its aims, it can be deduced that the project defined the challenges of KM only
in terms of explicit knowledge and from the perspective of Information Technology, and
thus, attempted a technological solution. However, this research establishes in Section
2.2 that the art of rendering tacit knowledge explicit is one of the challenges of knowl-
edge management, which an IT-only solution cannot deliver (McDermott, 1999). There
is need for a holistic approach by which both the human and technological approaches
are integrated. The synchronous interactivity and user-generated content provision on
the current social Web is a partial fulfilment of this need.
While Wiig (1997) describes 1989 as the year that marks the commencement of inter-
nal efforts to manage knowledge by several management consulting firms (e.g. PWC),
Gaines (2013) acknowledges the invention of the Web by Tim Berners-Lee in the same
year as a source of significant impetus for the acquisition of knowledge, thereby cre-
ating a huge information overload that was quickly tamed through Google’s indexing
technologies (Langville and Meyer, 2006, as cited in Gaines, 2013).

16 Chapter 2 Literature Review
Table 2.1: Historical Information Sharing Technologies
(Adapted from Carr et al. (2010))
Apart from the information overload that heralds its advent, the Web provides an avenue
for social software and social networking to thrive. It can be said that the same Web
infrastructure, which gave rise to the image problem suffered by KM due to its overselling
by vendors and consultants in the 1990s (Bolisani and Handzic, 2015), also provides a
platform in social software and social networking for KM to be rejuvenated.
Therefore, as stated in Section 2.2, it can be inferred from the above that the upsurge
in KM as a field of practice and study in the 1990s, was occasioned by the rise of the
Web at about the same time. Now that the Web has grown into a full scale social space,
the reappearance of KM on the social Web can be understood through the theory and
practice of social machines, which is the main thrust of Web Science as a field of study
(Tiropanis et al., 2015).. With social media being the most conspicuous face of the Web
in recent times, understanding the current state of KM from a Web Science perspective
would help in placing this research in perspective as this would help in appreciating the
potentials in using social media and mobile (social) applications as leverage for corporate
knowledge management.

Chapter 2 Literature Review 17
2.4 The Perceived Tension between KM and Social Media
This section attempts to place the perceived tension between knowledge management
and social media mentioned in Section 2.3, in perspective. In their “Multilevel Per-
spective of Tensions Between Knowledge Management and Social Media”, Ford and
Mason (2013a) conclude that social media and knowledge management are complemen-
tary rather than being in conflict, with the later being a major organisational trend
that leads to the former. However, they agree that social media amplify the tension
between the organisational and individual levels of the organisation, with regards to the
ownership and control of knowledge.
The question of ownership and control of knowledge is pertinent as a result of the
heightened security threats posed by the technologies that power social media. As such,
an organisation’s perception of these security threats is impacted by its perception of
knowledge. According to Vayrynen et al (2013), as cited by Ford and Mason (2013b), “if
an organisation views knowledge as something it owns, then it will perceive social media
as a greater security threat than if the organisation views knowledge as housed by the
people”. Vayrynen et al, therefore, conclude that the challenges of information security,
reputation and management faced by organisations, are amplified by social media trends.
This, they say, is as a result of the blurred line between private and professional identities,
coupled with the speed of information distribution on social media.
Giving an example of how viral events and double-filter process inherent in social me-
dia [can] alter the linear knowledge process often portrayed by knowledge management
models, Hemsley and Mason (2013) reflect on how the process of knowledge creation
and operations within knowledge-based enterprises are challenged by the capabilities
inherent in social media.
The tension created by the question of ownership, control and reputation concern (Ford
and Mason, 2013a; Vayrynen et al., 2013) notwithstanding, Ford and Mason (2013b) ac-
knowledge the work of authors like Hemsley and Mason (2013) and Jarrahi and Sawyer
(2013) who agree on the fact that social media amplifies the potential benefits of in-
creased innovation and faster knowledge transfer, especially when leveraged on social
networks.
What Ford and Mason (2013b) fail to highlight in their report is the fact that the added
benefits in social media is largely in the comparison between modern social media and
traditional social media, like the telephone and email, as highlighted by Jarrahi and
Sawyer (2013), who conclude that modern social media compete with each other for
attention as much as they compete with traditional media.
In accordance with the perceived tension and potential benefits, Ford and Mason (2013b)
pose some questions, among which is:

18 Chapter 2 Literature Review
“How do organisations determine when/if it is acceptable to use social media
at work and for work purposes?”
This question is explored further in this thesis, in the survey on occupational use of mobile
phones and applications as presented in Chapter 6. Also in this thesis, a conceptual
framework is developed, which mediates between knowledge management and social
media, with knowledge management value at its core. The conceptual framework is
presented in Chapter 4.3.
2.5 Knowledge Web Technologies
Organisations’ Knowledge has traditionally been in form of Lessons Learnt from projects,
knowledge maps, policies and procedures as well as best practices, all stacked away as
documents and folders. This is evident in a study aimed at facilitating new knowl-
edge creation and obtaining KM maturity, in which Arling and Chun (2011) found that
databases consisting of documents previously siloed in folders and file cabinets, do make
up some of the earliest attempts at knowledge management in the study’s case study
organisation. In recent years however, Web technologies are largely being used in the
form of Knowledge Management Systems (Alotaibi et al., 2013) as well as a range of
Knowledge Management Instruments (KMI) (Peinl, 2011). Prevailing knowledge Web
technologies include, chiefly, those which emphasise and broaden the vision of computer
interoperability empowered by knowledge: semantic Web. With the growth and emer-
gence of abstract social machines on the Web (Smart and Shadbolt, 2014), there arises
the need for domain-specific search. In the medical domain for example, an approximate
search result on the best treatment for a disease cannot be sufficient. Accuracy, preci-
sion and an up to date search result is critical(Schreiber, 2013). In as much as Semantic
Web (OWL/RDF) and linked data technologies are paving the way for domain-specific
search, they can also provide the means for knowledge representation and reasoning and
enable further support for [abstract] social machines (Tiropanis et al., 2015) upon which
this research is themed.
Social media has been adopted in organisations to support both the personal and col-
lective processes of managing knowledge (Razmerita et al., 2014). They are a sort of
social machines that facilitate human interactions on the Web. Essentially, they include
tools and software platforms that enable humans to participate in the social process of
content and knowledge generation, collaboration and knowledge sharing. Social media
trends began with the rise of so-called Web 2.0, in which sites became sophisticated
apps and content-management platforms designed to facilitate the creation and shar-
ing of user-generated data and content (Kleek and O’Hara, 2013). They include social
sharing and networking tools like Facebook, Twitter, blogs, wikis and forums (Ford
and Mason, 2013b; McAfee, 2006; Guy et al., 2013; Sousa et al., 2010). In addition,

Chapter 2 Literature Review 19
Smart and Shadbolt (2014, p.2) identify mySpace, Ushahidi, Galaxy Zoo, reCaptcha
and Wikipedia as social software exemplars of social machines. Facebook is essentially
a social networking tool in that it provides a platform for people of the same or similar
interest to gravitate over their interests and/or relationships. Blogs are used by individ-
uals or groups to maintain conversation with an audience wherein the audience responds
through questions or comments. While many people use content management systems
like Joomla or Wordpress platforms to implement their blogs, others use ready-made
blogging platforms like Blogger and/or micro blogging platforms like Twitter. Forums
allow any member to initiate a discussion or a support request while any other member
could respond. Despite the advances in social media as the world knew it about half a
decade ago, forums and message boards were probably the most common platform for
questions and answers about products and brands (Falls, 2012).
Social interaction software includes a wide range of communication tools, often based
on Internet technologies (e.g., instant messaging, text chats, forums, virtual worlds,
and social media). The concept of social software arose from the terms groupware and
computer-supported collaborative work (CSCW) both of which denote software that
facilitate and support group interactions (Haefliger et al., 2011). As hinted earlier, social
media is built on the ideological and technological foundations of Web 2.0, a platform
for social interaction, communication, and collaboration that allows the creation and
exchange of user-generated contents (Kaplan and Haenlein, 2010; Sankar and Bouchard,
2009; O’Reilly, 2005). Technological foundations and infrastructure notwithstanding,
knowledge creation and sharing may not be achieved without a level of interaction among
the human participants in the social process of knowledge creation (Soto-Acosta et al.,
2013). Such interaction, despite the prevalence of social media, is extremely personal
in as much as knowledge is created, processed, applied, and exchanged by individuals
whose contribution to knowledge repositories, and participation in the collective process,
is often individually motivated (Razmerita et al., 2014; Bohringer and Richter, 2009;
Kleek and O’Hara, 2013). The collective involvement of multiple individuals as active
participants with technology, in the social process of Knowledge Management, offers
an opportunity for the holistic approach mentioned earlier in Section 2.3; and, it is
the thesis in the theory and practice of social machines, which Tiropanis et al. (2015)
describe as the main thrust of Web Science.
This individual participation in the social interaction is strengthened by the practice
and concept of social bookmarking, folksonomies/hashtags, which is discussed further
in Chapter Section 4.3.3, Item No. 2.
2.6 The Social Machine Paradigm
Shadbolt et al. (2013) describe social machines as “current socio-technical systems which

20 Chapter 2 Literature Review
exploit large-scale interaction of humans with machines”. They (Shadbolt et al) drew
comparisons between traditional machines that were ‘programmed by programmers’
and ‘used by users’, and social machines in which the users are no more just mere users
but mutually important participants in the functionality of the system through their
contributions borne out of their intrinsic motivations (Bohringer and Richter, 2009).
The paradigm shift towards social machines has emanated from the rise of the social
web, which refers to the range of web technologies, services and resources that are aimed
at fostering collaboration and social interactions. These are social networking sites like
Facebook, social media sites like YouTube and microblogging sites like Twitter (Smart
and Shadbolt, 2014). The pervasiveness of these social web technologies has led Tinati
and Carr (2012) to create an understanding of how social machines are enabling humans
and technologies to interact and shape each other. So, does this mean there were no
human interactions with previous computational machines that existed before the Web?
Tinati and Carr (2012) assert that it was actually the pre-existing human interaction that
helped in “gaining more of an understanding of what it will take to achieve the dream
of collaboration through shared knowledge...” thus exploiting the platform and power
of the Web to create ‘abstract social machines’ with computational input, through what
Berners-Lee and Fischetti (2000) describe as “processes in which people do the creative
work and machine does the administration”.
In as much as pre-Web computational machines would require users’ consent in down-
loading and installing software and even using their CPU and network bandwidth, they
were regarded as some sort of social machines by Tinati and Carr (2012). This could
have resulted in an over-simplification of the social machine, given that, in that regard,
the Turing machine (Weisstein, 2017) could also be regarded as a social machine as it
requires human efforts to operate. They were however, quick to inform that social ma-
chines exist in different scales ranging from those which harness the collective problem
solving capabilities of humans to perform computational hard processes (lightweight) to
those that exist as a result of interactions between human creativity and technological
capabilities in a mutually reinforcing relationship (heavyweight). The heavyweight ap-
proach helps in understanding social machines as those Web technologies that facilitate
information sharing by individuals while having a ripple effect on methods of knowledge
transfer and the society at large (Carr et al., 2010), rather than studying every Web
technology from a social machine perspective.
In order to prevent a hasty generalisation of every Web technology as social machine,
the literature abounds with a plethora of attempts to drive home the specificity of the
characteristic of a particular Web technology that qualifies such technology as social ma-
chine. Tinati and Carr (2012) posits that “any task that requires the co-constitutional
involvement of humans and technologies is a form of social machine”. Smart and Shad-
bolt (2014) extends this co-constitutional involvement with the notion of “active human
participation” as being critically important to what makes a Web technology a social

Chapter 2 Literature Review 21
machine. In this case, the involvement of multiple human individuals facilitates the
involvement of many social machines in the realisation of ‘social processes’ defined by
interaction, communication and relationships between human individuals. Such reali-
sation fosters employee engagement and knowledge sharing in a corporate environment
and thus can be classified as knowledge social machines.
The initial insight into social machines arise from the statement made by Berners-Lee
and Fischetti (2000) in their book, ‘Weaving the Web: The Original Design and Ultimate
Destiny of the World Wide Web’:
“Real life is and must be full of all kinds of social constraint - the very
processes from which society arises. Computers can help if we use them to
create abstract social machines on the Web: processes in which the people
do the creative work and the machine does the administration.”
The above statement has hitherto been used as definition of social machine and has also
been subject to critical evaluation by scholars in its limitation. It can be argued that
Berners-Lee and Fischetti (2000) do not attempt to define social machine but explain
a concept that gives rise to the birth of social machines. However, Smart et al. (2014)
discountenanced this classification and characterisation of social machines solely on the
basis of the distinction in the contributions of each element, i.e, the human element and
the machine element, as per their creative and administrative contributions, respectively.
They argue that functions of creativity and administration are intertwined and can be
interchanged between the human and the machine participants in the social process,
e.g., where Wikipedia bots do the creative work (purportedly meant for humans) and
where humans do the tagging that helps in sorting Flicker’s pictures, an administrative
task purportedly meant for machines, in accordance with Berners-Lee and Fischetti’s
(2000) statement above. They (Smart et al., 2014) conclude that “a perspective that
seeks to limit the kinds of roles that can be performed by human and machine elements,
and which additionally seeks to impose a strict (and rather artificial) boundary on where
particular processes need to take place, risks blinding us to many of the opportunities
that the Web provides...”. They have therefore defined social machines as:
“Web-based socio-technical systems in which the human and technological
elements play the role of participant machinery with respect to the mecha-
nistic realisation of system-level processes”.
The above working definition of social machine provides a clearer understanding of the
concept as it highlights the features or conditions that qualify particular systems or
processes as social machine. That is, they are essentially socio-technical systems as
they involve the participation of both human and technological components. Secondly,
they are Web-based systems. Although the authors (Smart et al., 2014) do not rule

22 Chapter 2 Literature Review
out the possibility of social machines that are independent of the Web (e.g, clocks), the
focus of this study is on Web-based social machines. Also, social machines involve the
participation of multiple individuals as opposed to a ‘Web-extended mind’ onto which
individuals can offload cognition (Carr and Harnad, 2011). Nonetheless, these multiple
individuals are comprised of personal entities for whom an enhanced autonomy, offered
through technological support, would promote a more adaptive, flexible and robust
social fabric. Maintaining this personal autonomy in the midst of a cloud of multiple
individuals has been addressed by Kleek and O’Hara (2013) in their work, “The Future
of Social is Personal: The Potential of the Personal Data Store”.
Furthermore, an insight into social machines can be gained when one is confronted
with a process that calls for a theoretical explanation of the contributions of multiple
individuals and Web-based technology as as joint participants in the realisation of such
process (Smart et al., 2014). It can therefore be inferred that a social machine facilitates
a social process.
Meanwhile, while Buregio et al. (2013) see the concept of social machine as an auspicious
paradigm to deal with the complexity of the new emerging Web around us, Hendler
and Berners-Lee (2010) are concerned with the challenges of developing technologies
that allow user communities to construct, share and adapt social machines so that
successful models can evolve through trials, use and refinement. Such technologies are
better understood from the social machine paradigm; and, surmounting the challenges
in developing them requires, first and foremost, an appropriate conceptual framework.
As indicated in Chapter 1.5, this research studies the convergence of enterprise mobility
and social (media) data analytic and its implication on KM, which can be understood
from the study of social machines as a unified model for social/computing processes
(Buregio et al., 2013). This research also culminates in a conceptual model (see Chap-
ter 4.5) that helps in fullling the aim of developing a data model for knowledge social
machine, which would help Knowledge Management (KM) deliver value to corporate
organisations.
2.7 Employee Engagement and Knowledge Sharing
It is important at this juncture, to be reminded of the need for a knowledge social
machine framework, which is to foster the social process of knowledge sharing, a process
that can be fuelled by employee engagement.
2.7.1 Employee Engagement
From the foregoing section, it can be seen how a social machine defines the active par-
ticipation of humans with technology towards the realisation of a social process. In an

Chapter 2 Literature Review 23
organisational context, the humans are the employees whose active participation is a
function of their engagement. A recent survey of Management Tools and Trends (Bain,
2015) presented in Table 2.2 positions Employee Engagement Survey among the top 10
Management tools for the second year running (2012 & 2014). Employee engagement
is measured in terms of employees’ involvement and enthusiasm about the organisation
and their work. These surveys help organisations identify and build upon the strengths
and talents of their workforce to gain competitive advantage. This is based on the
premises that an intellectually motivated workforce would result in improved business
performance and increased customer satisfaction. To remain intellectually motivated
therefore, employees must assume the role of mutually important participants - as ma-
chines - in the functionality of the knowledge sharing system through their contributions
which are, according to Bohringer and Richter (2009), borne out of their intrinsic moti-
vations, as stated earlier in the discussion on the social machine paradigm in Section 2.6.
Table 2.2: Bain & Company’s Top 10 Management Tools
2000 2006 2010 2012 2014
1StrategicPlanning
StrategiPlanning
BenchmarkingStrategicPlanning
CRM
2Mission &VisionStatement
CRMStrategicPlanning
CRM Benchmarking
3 BenchmarkingCustomerSegmentation
Mission &VisionStatement
EmployeeEngagementSurveys
EmployeeEngagementSurveys
4 Outsourcing Benchmarking CRM BenchmarkingStrategicPlanning
5CustomerSatisfaction
Mission &VisionStatement
OutsourcingBalancedScorecards
Outsourcing
6GrowthStrategies
CoreCompetencies
BalancedScorecards
CoreCompetencies
BalancedScorecards
7StrategicAlliances
OutsourcingChangeManagement
OutsourcingMission &VisionStatement
8Pay-for-Performance
Business ProcessReengineering
CoreCompetencies
ChangeManagement
Supply ChainManagement
9CustomerSegmentation
Scenario &Contingency Planning
StrategicAlliances
Supply ChainManagement
ChangeManagement
10CoreCompetencies
KnowledgeManagement
CustomerSegmentation
Mission &VisionStatement
CustomerSegmentation
(Adapted from: Management Tools & Trends (Bain, 2015))
It is evident from the positioning of Employee Engagement Surveys (3rd on the list of
top 10) that organisations are now paying more attention to their employees’ motiva-
tion which can be measured through their engagement with the organisation’s products,
services, tools and activities. As mentioned earlier, Kumar et al. (2014) conducted em-
pirical research that positions employee engagement as a top business priority given

24 Chapter 2 Literature Review
that researchers have demonstrated that, having a highly engaged workforce not only
maximises a company’s investment in human capital and improves productivity, but it
can also significantly reduce costs (such as cost of employee turnover) which directly
impacts the bottom line. It is staggering to note from this research finding that despite
71% of company executives who rank employee engagement as very important to achiev-
ing overall organisational success, only 24% of them can affirm that employees in their
organisations are highly engaged. Thus, in an organisational setting, the utilisation of
social networking for knowledge sharing and as a source of knowledge elicitation can be
influenced and measured by employees’ engagement which is underscored by the En-
terprise Mobility policies of Bring Your Own Device (BYOD) and/or Company-Owned
devices that are Personally-Enabled (COPE).
There is, therefore, no disconnect between this finding and the findings of King et al.
(2002) which position the issue of motivation as one of the top ten most important is-
sues in Knowledge Management. The question is how to motivate individuals employees
to participate in the social process of knowledge sharing, owing to the correlation be-
tween employee motivation and the culture of knowledge sharing within the organisation
(Connelly et al., 2013). In this research, Employee Engagement emerges as one of the
parameters for measuring KM values (see Chapter 5.6).
2.7.2 Knowledge Sharing
“Knowledge sharing allows workers to avoid ‘re-inventing the wheel’; they can learn from
others’ experiences and improve their own performance as a result”, is how Connelly
et al. (2013) summarise the many benefits of knowledge sharing to organisations. Despite
its benefits, knowledge sharing is intrinsically difficult for knowledge workers. This is
due, in part, to a perception of erosion of their own competitiveness and also the time
pressure they are subjected to. A test scenario for a study (Connelly et al., 2013) was
set at a group of 444 undergraduates who were tasked with Mathematical problem-
solving exercise while being faced with request for knowledge sharing from colleagues.
The authors conclude with an expectation that the feeling of being too busy to share
knowledge with colleagues will increase proportionately with an increase in organisations’
demand for staff productivity in less time. They (the authors), however, affirmed that
one of the limitations to this study rests in the fact that a Mathematical problem-
solving exercise requires explicit knowledge which can be easily captured and replicated
verbally. They suggest further work to integrate tacit knowledge sharing with the sharing
of explicit knowledge. Tacit knowledge is discussed further in Chapter 4.3.2 as one of
the core elements of the conceptual framework output from this research.
Unlike explicit knowledge, in which we are aware of and can describe in words how we
are able to do what we are doing (Carr and Harnad, 2011), tacit knowledge is usually in
the domain of subjective, cognitive and experiential learning; it is highly personal and

Chapter 2 Literature Review 25
difficult to formalise (Turban et al., 2011a, p.478). More so, as opposed to the process
(top-down) approach, the practice approach assumes that a huge amount of organisa-
tional knowledge is tacit in nature and, therefore, rather than build formal systems to
manage knowledge, organisations should build social environments or communities of
practice necessary to facilitate the sharing of tacit knowledge. This presupposes that
organisations need to shift their attention from documents to discussions (Davenport
and Prusak, 1998, p.106). It is quite possible for an employee or a subject matter expert
to share tacit knowledge by expressing his/her feelings, thoughts and experiences while
carrying out, or having just performed, certain tasks. This is enhanced by the advent of
the social media, which makes it possible for anyone to express their sentiments within
the spur of the moment (Zikopoulos et al., 2012, p.26). This is even without being
confined to a set location, especially with over five billion mobile subscriptions that
enable a vast majority of the world’s population to communicate on the go, nowadays
when the world is witnessing a major shift to mobility as the main technological focus
of IT development as a new network structure and as a facilitator of business activities
(Kietzmann et al., 2013).
How then do we capture and/or engineer this tacit knowledge being inadvertently gen-
erated by employees in the enterprise mobility and social media space? This would
help in answering the question of how social media is delivering KM value to corporate
organisations
This work tends to view an organisation’s knowledge within the social media space as an
encapsulation of the organisation’s Enterprise Mobility strategy. Knowledge encapsula-
tion is a simple but powerful form of knowledge restructuring, which involves gradually
building a structure that connects fragmented knowledge items (Littlejohn and Mar-
garyan, 2013). It must not be taken for granted that the organisation’s knowledge
largely resides in its people. This can be viewed as fragmented knowledge items that
make up the organisation’s collective intelligence. As these fragments of knowledge are
being created, regenerated, shared and re-used by individual employees within the social
media space, and empowered by the readily available mobile devices as stated earlier, it
becomes expedient for the organisation to capture and manage this flow of knowledge
if it must count as intellectual capital for the organisation’s competitive advantage. If
not captured and managed, employees own their knowledge and can take it away with
them when they leave the organisation (Drucker, 1994). The exponential growth in the
data being generated by the social processes of knowledge exchange has given rise to
the concept and study of Big Data Analytic. This PhD research is therefore exploring
the use of Big Data Analytic in an attempt to mechanistically build a model knowledge
social machine on the enterprise mobility platform that supports the social processes of
knowledge capture and knowledge sharing, in such a way as it allows tacit knowledge to
flow seamlessly, as illustrated with Figure 1.1 in Chapter 1. In that model (Figure 1.1),
the corporate knowledge management system is no longer a mere knowledge base as it

26 Chapter 2 Literature Review
Figure 2.2: Nonaka’s Model of Knowledge Conversion (Nonaka and Takeuchi, 1995)
were, but an amalgamation of the active participation of a truly engaged workforce with
the social processes of knowledge acquisition, sharing and management. Such is a model
that is believed to utilise a combination of Web technologies with human participation
to support the realisation of Nonaka and Takeuchi’s (1995) four modes of spiralling
knowledge generation:
1. Socialisation mode, which is the exchange of tacit knowledge among members [of
a community who in this case, are employees of an enterprise] through their social
interactions and shared experiences.
2. Externalisation mode, which is the translation of tacit knowledge into explicit
knowledge through models, concepts, metaphors, analogies, stories, etc.
3. Combination mode, which is the generation of new and explicit knowledge by
combining and bundling together different bodies of explicit knowledge.
4. Internalization mode, which is the creation of new tacit knowledge from explicit
knowledge.
All of the conversion modes in Figure 2.2 are highly intertwined and interdependent, as
described by Haslinda and Sarinah (2009). The spiralling relationship between them can
be facilitated by the affordances of enterprise mobility which would help in rendering
tacit knowledge explicit.
2.8 Enterprise Mobility
“The most profound technologies are those that disappear. They weave them-
selves into the fabric of everyday life until they are indistinguishable from it”
(Mark Weiser of Xerox Lab, as cited by Sorensen (2011))

Chapter 2 Literature Review 27
from
2.8.1 A Synoptic View
With regards to the image problem suffered by KM in the 1990s, there has been a con-
certed effort by KM consultants and academics, since the 2000s, to explore how the
growing trends of enterprise mobility — as manifest in the surge in mobile devices and
applications — can be exploited for corporate Knowledge Management (Bolisani and
Handzic, 2015). This is evident in Knowledge Management literature, which abounds
with issues and concerns about Enterprise Mobility. For this research, about 160 knowl-
edge management literature materials published between 2004 and 2016 were analysed.
Analysing documents in this way helps in arriving at research outputs without data
collection (Seuring and Muller, 2008). The analysed publications include books, book
sections, conference papers, journal articles reports, thesis and web pages. The term,
‘mobilization’ - with variants of mobile, mobility, mobilise - is topmost in the list of Top
50 most frequently used words in these KM literature. This word frequency is repre-
sented in a word cloud in Figure 2.3. The method of document analysis of KM literature
resulting in this synoptic view is described in Section 2.8.2
2.8.2 Document Analysis of Knowledge Management Literature
1. Having decided on Enterprise Knowledge Management as the Web Science re-
search perspective for this research (see Section 2.1, a search of Google Scholar
was conducted, with the exact phrase, ”Knowledge Management”, and either ”en-
terprise” or ”organisation” in the title of the article. The search was made to
return publications from 2004 to 2016. However, considering that this search was
conducted in January, 2016, there was laterally no 2016 publication contained in
the search results. Meanwhile, over a thousand search results were returned.
2. Based on their accessibility either through the availability of PDF or URL links, a
few of the documents were selected and imported over to Mendeley — the preferred
bibliographic reference management tool for this researcher — where the articles
were read, reviewed and had annotations placed on the go.
3. In a bid to analyse and synthesise the findings from these various papers, NVivo
— a qualitative data analysis package — was employed. The reference library was
imported from Mendeley into NVivo as a RIS (Research Information Systems)
file format. RIS is a file format for portability across bibliographic referencing
platforms.
4. Using the Source Classification feature of NVivo, 160 documents were classified
according to their types, as seen in Table 2.3:
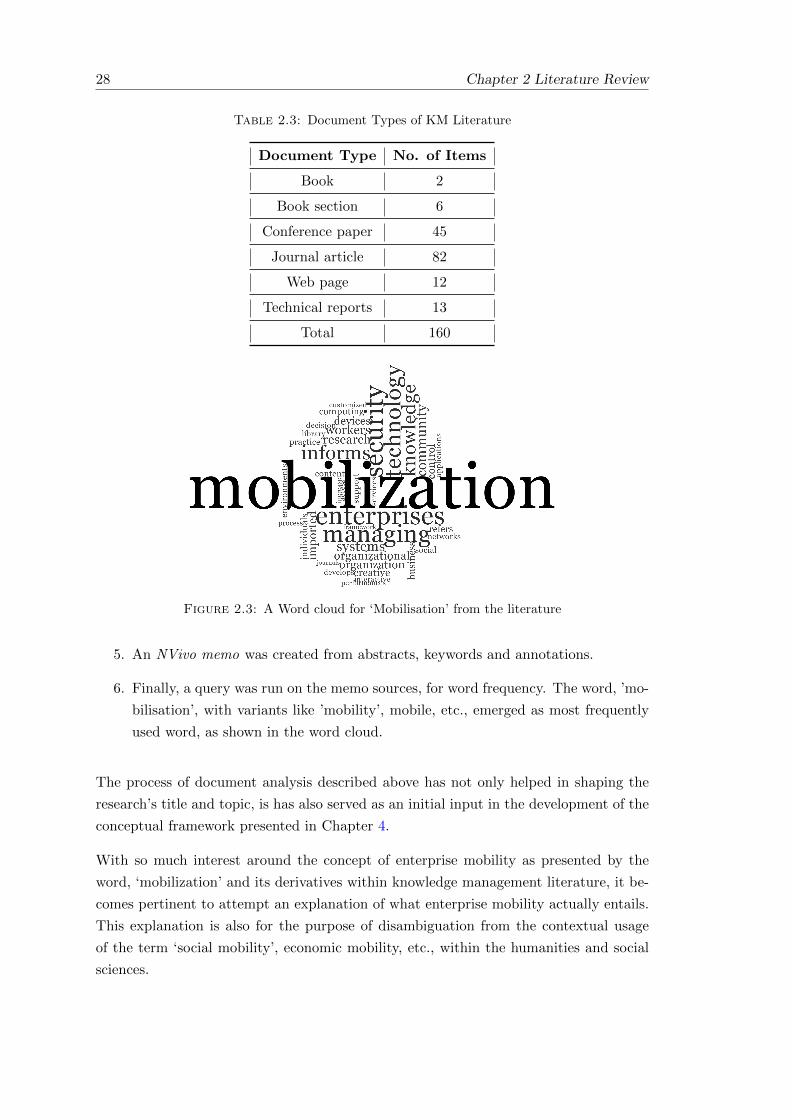
28 Chapter 2 Literature Review
Table 2.3: Document Types of KM Literature
Document Type No. of Items
Book 2
Book section 6
Conference paper 45
Journal article 82
Web page 12
Technical reports 13
Total 160
Figure 2.3: A Word cloud for ‘Mobilisation’ from the literature
5. An NVivo memo was created from abstracts, keywords and annotations.
6. Finally, a query was run on the memo sources, for word frequency. The word, ’mo-
bilisation’, with variants like ’mobility’, mobile, etc., emerged as most frequently
used word, as shown in the word cloud.
The process of document analysis described above has not only helped in shaping the
research’s title and topic, is has also served as an initial input in the development of the
conceptual framework presented in Chapter 4.
With so much interest around the concept of enterprise mobility as presented by the
word, ‘mobilization’ and its derivatives within knowledge management literature, it be-
comes pertinent to attempt an explanation of what enterprise mobility actually entails.
This explanation is also for the purpose of disambiguation from the contextual usage
of the term ‘social mobility’, economic mobility, etc., within the humanities and social
sciences.

Chapter 2 Literature Review 29
2.8.3 What is Enterprise Mobility?
Enterprise Mobility has been defined as “the use of mobile Information Technology
(IT) for the accomplishment, coordination and management of organisational activities”
(Sorensen, 2011). It is a growing trend that defines collaboration at work while helping
employees maintain work and life balances, using mobile information technology that are
built on current technological innovations like Apple’s IOS and its range of iPhones and
iPads; Google’s Android and its range of smart phones and tablets; Skype and its ability
to enable communications on the go; even with over five billion mobile subscriptions
supporting an approximate 80% of the world’s populations (Sorensen, 2011; Kietzmann
et al., 2013).
The consumerisation of IT has led to a plethora of mobile devices like laptops, Web-
enabled tablets and smart phones which have all become incredibly affordable, in ac-
cordance with Moore’s Law, which guides the exponential cost and simplified design
advantage that results from continually ‘cramming’ more capabilities and functionality
on to Integrated Circuits (Moore, 1998). With these devices, not only are employees
able to access their emails and browse the Internet on the go, they are also able to
access the organisation’s tools and resources necessary to perform their work without
having to be glued to a desk at an office location. Also, using these devices, employees
are able to access and interact with their own networks of friends and family (work and
life balance). In recent times, these technologies have woven themselves around us in so
much so that using them for keeping in touch with family/friends becomes an impulsive
reflex action even while at work (Chang et al., 2014). Many organisations have there-
fore, subscribed to the theory that, allowing employees to access corporate systems and
data over these devices (BYOD) enhances productivity (Microsoft, 2015). Also, it can
be suggested that allowing employees to access a network of corporate resources and
discussions over similar social networks within the enterprise would promote employ-
ees’ engagement with the corporate data, Knowledge Management System and, more
importantly with colleagues, in as much as the organisation’s knowledge largely resides
in its people (Griffiths and Moon, 2011). Has this trend truly promoted engagement
and productivity and to what extent? This is the basis for the third extended research
question (ERQ.3) in Section 1.2.1
2.8.4 Enterprise Mobility Management Strategies
Organisations have either a choice between — or a fusion of — two basic options for
their enterprise mobility implementation:
1. Bring Your Own Device (BYOD).

30 Chapter 2 Literature Review
Figure 2.4: Enterprise Mobility. [Source: Banafa (2014)]
.
This covers mobile devices owned by the employee and can be used for work or
personal use at any location. The choice of the brand, functionality, installed
apps are entirely that of the employee (Armando et al., 2013). Driven by the
financial pressure imposed on schools by the funding cuts by Governments, for
example, schools managements are increasingly adopting BYOD as it eliminates
the cost of funding on technological equipment, like computers, for individual
students (Stavert, 2013). When these devices are allowed to be used to access
the corporate data from anywhere the employee may be located, it exposes the
organisation to the risk of compromise of the privacy and security of its corporate
data. Also, because there are as many different devices as there are employees, the
organisation is faced with the challenge of how to integrate these disparate devices
into a platform for ease of support and interoperability.
2. Company-Owned Personally-Enabled Devices (COPE).
This is also known as ‘Choose Your Own Device (CYOD)’. These are pre-approved
devices normally owned by the company and can be used anywhere by employees.
In most cases, the company maintains the device and controls the applications
that are installed on them, in which case, they are strictly for business purposes.
Sometimes, employees are given options from a list of approved devices (Scott,
2013) and can also use them for personal purposes with their own choice of apps
(especially for games and social networking) that are not for work purposes. Secu-
rity and privacy of corporate data is therefore, a concern here, and this is discussed
briefly, next.

Chapter 2 Literature Review 31
As can be inferred from the foregoing, there are risks and challenges associated with
enterprise mobility giving rise to organisational concern, as evident with the National
Health Service (NHS) (Hitchcock, 2012). However, this research contends that portray-
ing an organisational lag on the basis of these concerns may make the organisation lose
sight of the benefits inherent in enterprise mobility. With the fulfilment of BYOD, social
integration, analytics, mobile apps and security, enterprise mobility offers the benefits
as illustrated in Figure 2.4. Regardless of the concerns about privacy, security, cost
and complexity, a successful organisation should resolve the mobility challenge with an
integrated solution that would help them weigh the risks and opportunities presented
by mobility and social networks thereby, devising the means of exploiting this trend to
promote collaboration and knowledge sharing in such a way that mitigates against the
risks and maximises the opportunities. This is where Enterprise Mobility Management,
integrated into the vision of knowledge social machine, tends to bridge the gap between
traditional knowledge management and current/emerging Web trends and technologies.
It ultimately helps in delivering the promise of Knowledge Management. This promise
includes real-time enterprise data access, seamless collaboration and knowledge shar-
ing, knowledge capture, storage, reuse and preservation, all aimed at preserving and
exploiting the organisation’s intellectual capital for enhanced performance, efficiency
and productivity leading to a strategic competitive advantage that ultimately impacts
profitability.
Enterprise Mobility Management thus becomes the cynosure around which people, tech-
nology, processes and environment revolves, as illustrated in Figure 2.5.
2.8.5 Privacy and Security
It is mentioned in Section 2.8.4 that the issue of privacy and security of corporate data,
when accessible from heterogeneous devices and from any location, is becoming a growing
concern to organisations when considering the implementation of an enterprise mobility
policy. When one considers the fact that the kind of security threats of cybercrimes
through brute force attacks, SQL injection, etc., are now also becoming rampant threats
on mobile devices as they were on personal computers (Vorakulpipat, 2014), one cannot
but forgive an organisational lag that is based on restraint. Moreover, if organisational
knowledge, or core ‘trade secrets’, can be so easily replicated by another organisation,
such knowledge will sooner than later lose its value as a constituent of the organisation’s
intellectual capital. Meanwhile, the privacy of corporate data can easily be compromised
through the liberalisation of organisational hierarchical structure to accommodate the
flow of tacit knowledge over an enterprise mobility agenda. What are the actual privacy
and security risks and issues involved in the adoption of enterprise mobility? To what
extent have these risks constitute a threat to corporate organisations? and, what are the

32 Chapter 2 Literature Review
Figure 2.5: Enterprise Mobility Management; from Notify Technology (2015)
mitigating factors against the risks? These questions set the pace for another interesting
research area beyond the scope of this research.
2.9 Knowledge Engineering from Big Data Analytic
Consequent upon the consumerisation and proliferation of mobile devices and appli-
cations, coupled with the availability of enterprise mobility management platforms to
delimit the organisational boundaries for privacy, security and efficiency, an enormous
amount of structured and unstructured data are being generated within the enterprise
mobility and social media space (Zikopoulos et al., 2012). The complexity of these
data is evident in their variety (a mix of text and multimedia data and their associated
metadata from social media as well as operational and external data). The speed at
which these data are generated is also an evidence of its complexity, making it challeng-
ing for organisations to derive valuable insightful knowledge that is worth sharing for
decision-making, competitive advantage and the ultimate impact on profitability. As
hinted earlier, in an attempt to tackle this challenge, this research uses textual analysis
technique of big data analytic to perform knowledge engineering on social media data.

Chapter 2 Literature Review 33
Shadbolt and Smart (2015) describe knowledge engineering as a discipline that has
evolved to support the whole process of specifying, developing and deploying knowledge-
based systems. According to them, knowledge engineering encompasses knowledge ac-
quisition from any source, which in turn, encompasses knowledge elicitation from a do-
main expert. Meanwhile, ‘any source’ of organisation’s knowledge acquisition includes
knowledge discovery in databases, market monitoring, community, and collaboration
networks (Peinl, 2011). The research work in this thesis is primarily concerned with
knowledge discovery in community and collaboration networks in terms of the insights
gained from the sentiments shared by employees, for example, through their engagement
with the organisation’s own knowledge social machine, which presents as the enterprise
mobility and social network platforms. To achieve this, we seek to explore and exploit the
integration of knowledge discovery from community and collaboration networks using
some techniques in big data analytic.
However, traditional databases have limitations (Lamont, 2012) that are placed by cer-
tain structural constraints, making them rather unsuitable for storing and analysing
the kind of data produced through social networks as tacit knowledge. In as much as
online conversations have grown so exponentially as a result of the huge volume and
variety of user-generated contents powered by enterprise social media (Enterprise 2.0),
traditional data gathering and knowledge elicitation approaches like questionnaires and
even relational database queries can no longer cope with the size and speed at which
the social data are being generated. As such, there is a need for another approach to
data gathering and analysis that is not bound by the constraints of the traditional ap-
proaches, if organisations are going to derive any valuable insights for their competitive
advantage from such a powerful enabler of KM as Big Data, such that could previously
only have been possible, if at all, with expensive high performance computational in-
vestments (Lamont, 2012; Chen and Huang, 2012). A simple case of less intrusive and
cost effective solution for small and medium scale organisation, using textual analysis of
data, is presented in Chapter 5.2.1
2.10 Chapter Summary
This review has cited some work like those of Peinl (2011), Chen and Huang (2012),
Lamont (2012), and Shadbolt and Smart (2015) to establish the need for other data
gathering and analytic techniques for knowledge discovery that are not bound by the
constraints of traditional databases. These authors agree that there is need to re-assess
the impact of KM but they are reassessing from a technological perspective, with the ex-
ception of Peinl (2011) who shows some consideration for the human factor by extending
his source of knowledge discovery to community and collaboration networks.

34 Chapter 2 Literature Review
On the other hand, McAfee (2006), Davenport (2008), Delic and Riley (2009), Griffiths
and Moon (2011), and Griffiths et al. (2015) have established the current fidgety status
of KM as a field of practice and are therefore, looking — from a human perspective —
to solutions potentially inherent in the social interactions that social media platforms
provide.
However, the above two propositions are not mutually exclusive. Together, they both
highlight the co-constitutional involvement ((Tinati and Carr, 2012) of human and ma-
chine in the social process of knowledge creation and knowledge sharing. As this is the
hallmark of the social machine paradigm, a theme that runs through this review, the
literature has established knowledge sharing as an act borne out of the intrinsic moti-
vation of individual employees (Drucker, 1994; Turban et al., 2011a; Carr and Harnad,
2011; Connelly et al., 2013) which strengthens the people dimension of a socio-technical
system (Piccoli, 2008, pg. 35-38) by which a social machine can be defined.
The volatility of KM within the context of the complexity and dynamism of the tech-
nological trends that are shaping it has resulted in fragments of divergent views on the
defining concepts by numerous authors. Paradoxically, the harmonisation of these di-
vergent views from the literature (see Table 4.1) has emanated in a convergence of the
basic elements of the conceptual framework which is a major research output presented
in this thesis.
Moreover, it can be deduced from the literature that KM, having been previously over-
sold to organisations by its consultants, was quickly becoming a lacklustre concept due,
largely in part, to a want of measurable value, and also to a perceived ‘rivalry’ between
KM and the new technological trend of social media (see Section 2.4. However, even
though there is a consensus over the need of KM to deliver value to organisations again if
it were to remain relevant and sustainable within the context of new technological trends
of social media, there is not yet a framework that integrates KM value for organisations
into the current trends. This framework is achieved in this research and it is presented
in Chapter 4.3 of this thesis.

Chapter 2 Literature Review 35
———


Chapter 3
Research Methodology
In addition to an outline of the research methods employed for this research (see Fig-
ure 3.1), this chapter also provides a broad overview of the general philosophical under-
pinning that guides the choice of the research methods. This philosophical foundation
is discussed first in Section 3.1.
3.1 Methodology Overview
Research Methodology is often explained from two perspectives. One is the perspective
of the methods, processes and techniques used in data collection, analysis and deci-
sion making (Kothari, 2004, pg. 7). The second perspective highlights the distinction
between the research method, as indicated by the first perspective above, and the re-
search methodology, wherein, methodology is the overall approach to research linked
to the paradigm or theoretical framework while the method refers to systematic modes,
procedures or tools used for collection and analysis of data (Mackenzie and Knipe, 2006).
In alignment with the second perspective for explaining the concept of research method-
ology, the research methodology for this research is underpinned by the theoretical
framework of pragmatism, which Mackenzie and Knipe (2006) describe as the research
paradigm that is “not committed to any one system of philosophy or reality” but applies
whatever approach that works towards resolving the research problem. The entrench-
ment of this practical approach in Mixed Methods Research is why it has been closely
linked with the pragmatic research paradigm (Morgan, 2014; Cameron, 2011; Johnson
and Onwuegbuzie, 2004).
37

38 Chapter 3 Research Methodology
3.1.1 Mixed Methods Research
For this thesis, mixed methods research can be defined as a paradigmatic research method
that serves as a bridge between the qualitative and the quantitative research methods.
According to Kothari (2004), “qualitative approach to research is concerned with subjec-
tive assessment of attitudes, opinions and behaviours”. It helps researchers in exploring
insights, discovery and interpretation rather than hypothesis testing or measurements
in terms of quantity, amount, intensity or frequency (Noor, 2008). This approach lends
some credence to the researcher’s subjective interpretations in as much as one cannot be
separated from the knowledge that one possesses, making the researcher the only source
of contextual reality. This assertion is according to Johnson and Onwuegbuzie (2004),
who also inferred that quantitative approach, on the other hand, promotes an objec-
tive style of inquiry in which the researcher’s biases and emotions are detached from
the study, and stated hypotheses are empirically justified. Johnson and Onwuegbuzie
(2004), therefore, join forces with the pragmatic school of thoughts in advocating that
a mixed method approach allows researchers to mix and match research components
that offer the best solution at resolving their research questions, while also addressing
the perceived dichotomy between qualitative and quantitative research methodology.
(Mackenzie and Knipe, 2006; Johnson and Onwuegbuzie, 2004, pg.15).
Although, most studies of computer systems are based on quantitative methods (Kaplan
et al., 1988), missing out on the benefits inherent in mixing the outcome with insights
from qualitative analysis. Miles and Huberman (1994) also suggest that qualitative data
“are a source of well-grounded, rich descriptions and explanations of processes in identi-
fiable local contexts”. They (Miles and Huberman argue further that, “words, especially
organised into incidents or stories, have a concrete, vivid, meaningful flavor that often
proves far more convincing to a reader — another researcher, a policymaker, a prac-
titioner — than pages of summarised numbers”. This is probably why Mackenzie and
Knipe (2006) argue that discussions of research methods in research texts and univer-
sity courses should include mixed methods and should address the perceived dichotomy
between qualitative and quantitative research methodology.
This research is largely underpinned by a pragmatic exploratory approach in which a
triangulation technique of mixed method research is adopted.
3.1.2 Triangulation
Triangulation is defined as the mixing of data or methods so that diverse viewpoints or
standpoints cast light upon a topic (Olsen, 2004). It is also described as an attempt
to explain more fully, the complexity in human behaviour by studying it from more
than one perspectives, using both qualitative and quantitative data (Simuforosa and
Wiseman, 2015, p.88).

Chapter 3 Research Methodology 39
For this research, quantitative data were gathered from survey to establish which of
the devices used at/for work employees are most satisfied with (see Chapter 6). Yet,
there is a need to position these quantitative data within the context of participants’
reasons for being mostly satisfied with their chosen devices. This falls within the realms
of qualitative method, in which textual data from the free expressions of participants
were captured and analysed. In essence, the design of this embedded pragmatic mix of
methods within the same survey is influenced by the concept of triangulation, even in
as much as a survey could be based on a mix of quantitative and qualitative method
(Jick, 1979).
Considering that triangulation could be based on data sources, data types, researcher,
theory and/or methods (Mertens and Hesse-Biber, 2012; Miles and Huberman, 1994), the
methodology used in this research is largely based on the triangulation of methods. For
example, having used Social Network Analysis (SNA) to measure an engaged corporate
workforce, this research also studies the impacts of mobile devices and applications on
the intrinsic motivation of individual employee for engagement, using a survey. Even
within the survey questionnaire, there are questions that allow for free text responses
which provide further contexts and insights to multiple choice and Likert scaled questions
(E.g., see Chapter 6.4.3).
Triangulation has helped in establishing the veracity of the conceptual framework (see
Figure 4.1) emanating from this research as well as the findings and recommendations
(Mertens and Hesse-Biber, 2012). This approach has also resulted in a fine-tuned artic-
ulation of the research question as extended in Section 1.2.1.
An overview of triangulated research methods employed throughout this research is
visually depicted in Figure 3.1.
The next section discusses the individual research methods shown in Figure 3.1, together
with their indications within the thesis.
3.2 Research Methods
With reference to the research questions in Chapter 1.2, Table 3.1 on page 41 presents a
mapping of the research questions with the research methods used in this research. As
indicated in Table 3.1, resolving each research question requires more than one research
methods. Also, a research method could be used in resolving more than one research
question. For example, literature review cuts across the entire research questions —
from the overarching research questions through the extended research questions. Social
Network Analysis (SNA), Case Study, as well as Texual/Data Analysis all cut across
both Extended Research Questions 1 and 2.

40 Chapter 3 Research Methodology
Figure 3.1: An Overview of Triangulated Research Methods

Chapter
3Research
Meth
odology
41
Table 3.1: A Mapping of Research Questions with Research Methodology/Methods
Research Questions Research Methodology/Methods *
OverarchingResearchQuestion
How Can Social MediaPlatforms like Twitter DeliverKnowledge Management Valueto Corporate Organisations?
Triangulation technique of Mixed Methodsapproaches, as guided by the pragmatic paradigmof research. Informs the articulation of the extendedresearch question as well as the choice of researchmethods to address the questions;
ExtendedResearch
Question 1
What is an appropriate socialframework for delivering KMvalues?
Document Analysis;Thematic AnalysisConceptual framework
ExtendedResearch
Question 2
What are the intended outcomesfrom social media by which KMvalues can be measured?
Knowledge Discovery;Textual/Data AnalysisSocial Network Analysis (SNA)
ExtendedResearch
Question 3
What are the impacts of mobiledevices and social applicationson employee engagement?
Survey;Thematic AnalysisSNA
Case
Study
S.N.A./Textual/Data
Analysis
Literature
Review

42 Chapter 3 Research Methodology
Table 3.2 is an indication across this thesis, of methods highlighted in Figure 3.1 and
Table 3.1.
Table 3.2: Indications of Research Methods
Methodology Indication
Literature Review Chapter 2 & Entire Report
Document Analysis Chapters 2.8.2 & 2.10
Conceptual Framework Chapter 4
Thematic Analysis Chapter 6.4.3
Case Study Chapter 3.2.5
Knowledge Discovery Chapter 5.2
Textual/Data Analysis Chapter 5.2.4
Survey Questionnaire Chapters 6.1 & 6
Social Network Analysis Chapters 5.6.1
The next subsections describe each methods adopted as they evolve within the course
of this research. The three main dimensions of methodological triangulation used in
this research are literature review, case study and data analysis. As can be seen in
Figure 3.1, they are the conduits that run through other research methods adopted.
3.2.1 Literature Review
The literature review is a search and evaluation of the available literature in a given
subject or chosen topic area (Royal Literary Fund, nd), and it represents the foundation
for information systems research (Webster and Watson, 2002).
There are different type of literature review: integrative reviews, systematic reviews,
meta-analyses, and qualitative reviews. In alignment with this research’s overarching
mixed method research approach, the literature review adopts an integrative method
as it is the only approach that allows for the combination of diverse methodologies
(Whittemore and Knafl, 2005).
As stated earlier, the Literature Reviews is one of the three main conduits that connect
the entire thesis. The literature review began with a structured search for relevant
literature for knowledge management publications published between 2004 and 2016, as
described in Chapter 2.8.2. The literature indicates how that the volatility of knowledge
management, within the context of the complexity and dynamism of the technological
trends that are shaping it, has resulted in fragments of divergent views about the future
direction of KM, by different authors. These divergent views in the literature were
harmonised in this research (see Chapter 4.1), resulting in a convergence of the basic

Chapter 3 Research Methodology 43
elements of the conceptual framework (see EMSoD in Chapter 4.3), which is a major
research output presented in this thesis.
3.2.2 Document Analysis
Bowen (2009) describes document analysis as a qualitative research method that involves
a systematic procedure for reviewing or evaluating both print and electronic documents.
This is aimed at using the documents as data source for some research outputs that are
not created on the basis of data collection (Seuring and Muller, 2008).
According to Bowen (2009), the analytic procedure entails finding, selecting, appraising
(making sense of), and synthesising data contained in documents. For this research,
a total of 160 knowledge management documents were analysed. The process of find-
ing, selecting and synthesising these documents are described in Chapter 2.8.2, and,
in accordance with Labuschagne (2003), as cited by Bowen (2009), “document analy-
sis yields data— excerpts, quotations, or entire passages— that are then organised in
to major themes, categories,and case examples specifically through content analysis”.
Content analysis is a qualitative method that runs as theme across document analysi,
textual/data analysis and thematic analysis methods, as described in Section 3.2.7.
The word cloud in Figure 2.3 of Chapter 2 is an output from the data yielded by
the document analysis, which also serves as an input to the process of developing the
conceptual framework in Chapter 4.
3.2.3 Conceptual Framework
Shields and Rangarajan (2013) define a conceptual framework as “the way ideas are
organised to achieve a research project’s purpose”. This is in so far as conceptual frame-
work is viewed from an academic research perspective where it provides some direction
for the researcher before and during the research by mapping out what to cover, who to
consult and why (Miles and Huberman, 1994). However, in the spirit of pragmatism, as
discussed in Section 3.1, the conceptual framework in this research has been developed
from the business perspective, as described by the Business Dictionary:
“A theoretical structure of assumptions...that hold together the ideas com-
prising a broad concept”.
For example, in an attempt to resolve the differences among entrepreneurs and among
their ventures, Gartner (1985) developed a conceptual framework for describing new
venture creation. This is analogous to Financial Times’s definition of conceptual frame-
work as “a theory of accounting prepared by a standard-setting body against which
practical problems can be tested objectively” (Financial Times, nd).

44 Chapter 3 Research Methodology
In essence, the EMSoD framework developed from this research was not meant to pro-
vide direction for the research but attempted to put together a theoretical structure of
assumptions that hold together the proposed solution to a business problem, which is
ultimately aimed at redeeming the image of knowledge management and re-positioning
it for value within the context of current social media trends. The detailed method em-
ployed in the making of the conceptual framework has been an iterative process between
four phases, as described in Chapter 4.2.1. However, there is no formal constraints on
the order of inter-relatedness of variables within each element of the EMSoD structure.
Such formal constraints on the inter-relatedness of variables can only be tested and val-
idated with a model, and not a framework. The operationalisation of such constraints
within a corporate software is a developmental research area to which this research could
be extended, with the emergent conceptual model from this framework, as presented in
Chapter 4.5.
3.2.4 Thematic Analysis
Thematic analysis is a method for identifying, analysing, and reporting patterns (themes)
within data through a 6-phase process from familiarisation with the data to producing
report based on established meaningful pattern within the data set (Braun and Clarke,
2006; Fereday and Muir-Cochrane, 2006). As mentioned in Section 3.1.2, there is a need
to position quantitative survey data within the context of participants’ reasons for be-
ing mostly satisfied with their chosen devices. This falls within the realms of qualitative
method, in which textual data from the free expressions of participants were captured
and thematically analysed, through a rigorous process of iteration around the six phases
(Fereday and Muir-Cochrane, 2006), from familiarisation with the data through the
generation of initial codes to the identification of the prominent themes within the data
set. This was aided by the use of NVivo, a software tool for qualitative data analysis,
which is used in filtering responses against each of the devices. The detailed method of
thematic analysis used is described in Chapter 6.4.3, while Figure 6.6 is a direct out-
put of the thematic analysis process, showing the prevalent themes that run across the
participant’s reasons, as supplied within the data set.
3.2.5 Case Study
The case study is defined as an empirical inquiry that investigates a contemporary
phenomenon — which could be an entity, an individual or even a unit of analysis —
within its real life context, using multiple sources of evidence or the relationship between
a limited number of events/conditions (Zaidah and Zainal, 2007; Yin, 2006). It is worth
noting the emphasis of case study on a particular issue, feature or unit of analysis rather
than being a study of the entire organisation (Noor, 2008). Despite its criticism for

Chapter 3 Research Methodology 45
being less generalisable, case study based on critical case can be generalised on the
basis that a proposition that is valid for one case can be valid for one — or many —
cases (Flyvbjerg, 2006). It is on this basis that a medium-scaled organisation is selected
as the most likely suitable case for studying how small and medium-scaled enterprises
(SME) could exploit knowledge discovery from social media data, using Twitter, the
micro-blogging platform. The detailed methods and processes for selecting the case of
Twitter and the SME are discussed in Chapters 5.2.1 and 5.2.2, respectively.
The University of Southampton used in social network analysis, and whose employees
constitute the target population for the survey presented in Chapter 6 is also a critical
case, as findings from its data can be generalised to other Universities where participants
share similar characteristics (education, middle class). These characteristics are also
generalisable across the United Kingdom, a country that has seen an upsurge in the
number of the middle class above the lower, working class (Arnett, 2016).
In addition to the above, the case study is also implied as one of the mixed methods
used for Social Network Analysis as indicated in Chapter 5.6.1 which involves a study
of the University of Southampton’s (@unisouthampton) Twitter network. This is also
true for the recruitment of participants for the survey questionnaire that studied the
impact of mobile devices and mobile (social) applications on employee engagement (see
Chapter 6.3). The implication of the case study in analysing the survey data is that it
allows for further depth in the understanding of participants’ responses (for example,
through a thematic analysis of participants’ free text responses). This is in consonance
with Zaidah and Zainal (2007) who assert that, “case study allows the analysis to go
beyond the quantitative statistical results and understand the behavioural conditions
through the actors perspective”.
3.2.6 Knowledge Discovery
Knowledge discovery is a superset of data mining. This assertion is based on Fayyad
et al’s (1996) description of knowledge discovery in databases (KDD) as “the overall
process of discovering useful knowledge from data” while data mining refers to “a par-
ticular step in this process.” The main thrust of the process [of knowledge discovery] is
the application of specific data mining techniques for pattern discovery and extraction,
in which knowledge is the end product of such data-driven discovery. This is also an
assertion by Fayyad et al. (1996), who further describe knowledge discovery as computa-
tional theories, methods and tools to assist humans in pattern discovery and extraction
of useful information (knowledge) from the rapidly growing volumes of digital data.
Social media have been identified as major sources of the ‘rapidly growing volumes of
digital data’ (Zikopoulos et al., 2012). As such, Twitter data was gathered on the basis
of domain-driven data mining, using categorical keywords of interest to the case study

46 Chapter 3 Research Methodology
organisation’s business domain. The data mining technique for knowledge discovery
used in this research is based on the principle of reducing large amounts of data for
ease of processing, as, only a handful of an enormous amount of data may contain the
valuable and actionable knowledge that propels an organisation towards strategic com-
petitive advantage (Liao and Triantaphyllou, 2008, pg.5). The technique also includes
the use of three methods from Tweepy, a Twitter Python library. They are OAuthHan-
dlers, Stream and StreamListener. The gathered Twitter data (approximately 150,000
tweets) was parsed in JSON (JavaScript Object Notation - A lightweight data inter-
change format) for structure and analysis with Dataframe method of Pandas, another
Python library. A detailed description of the methods and processes, as they evolve
towards knowledge discovery, is contained in Chapter 5.3.
3.2.7 Textual/Data Analysis
Although social media generate a variety of data types in multi-media formats, Twitter,
as a micro-blogging platform, enables expressions in free text, which is why the bulk of
its data are textual. Making sense of textual data requires content analysis technique
by which the researcher explores textual data with a view to grouping together similar
types of utterances and ideas, aimed at identifying key issues in the data (Burnard, 1996).
Content analysis is the process of organising information into categories related to the
central questions of the research (Miles and Huberman, 1994). Miles and Huberman
also recognise content analysis as the intersection point between thematic analysis (see
Section 3.2.4), document analysis (see Section 2.8.2) and textual data analysis.
The textual Twitter data harvested for the investigation of knowledge discovery from so-
cial media data in this research were categorised in accordance with the content analysis
technique, as presented in Chapter 5.3.
3.2.8 Survey Method
The survey is used in gathering relatively small amount of data from a relatively large
sample of people from a target population to make some inference about the wider
population (Kelley et al., 2016).
The rationale for the survey and the actual questionnaire used as survey instrument is
described in Chapter 6.1. Also, the detailed method and process of framing the survey
questions and recruiting the survey participants are highlighted in Chapters 6.2 and 6.3,
respectively.

Chapter 3 Research Methodology 47
3.2.9 Social Network Analysis
In consonance with the principles of triangulation as discussed in Section 3.1.2, frequency
of access and usage of an organisation’s social network within a managed platform (see
Chapter 4.3.1), in addition to the employees social contributions, could be studied as
a measure of their engagement. Not only would this relieve employees of the burden
of responding to surveys, (Baesens, 2004, p.180) assert that it is also acceptable to
use analytic techniques to extract information linked to the users’ interaction where it
becomes infeasible to conduct an engagement survey traditionally.
The use of traditional survey method (as reported in Chapter 6) notwithstanding, the
main thrust of social network analysis method used in this research is for a detailed
examination of the structure of the social network and its effect on the engagement
of actors (people) within the network, where the structure is considered to be more
important than the individual actors (Keenan and Shiri, 2009). A detailed description
of this method and process, which involve the identification of two network types — the
topical network and the structural network — is presented in Chapters 5.6.1 and 5.6.4.1.
Moreover, statistically studying frequency of access and usage of an organisation’s so-
cial network entails quantitative data analysis. However, quantitative data are more
restrictive while qualitative data allows for methods used to interpret meaning of net-
work diagrams and measures (Coviello, 2005). Also, Coviello (2005) further argues that
networks are both structure and process at the same time, and therefore evade simple
categorisation as either quantitative or qualitative phenomena. This is why the social
network analysis in this research has been approached not only from a quantitative but
also from a qualitative perspective. This is evident in the attempt made at creating
an understanding of features and limitations of the topical, and, the structural Twitter
networks, as presented in Sections 5.6.2 to 5.6.4 of Chapter 5.
3.3 Chapter Summary
This chapter provides a justification for the pragmatic approach to the techniques of
mixed methods used in this research. The trickle down effects of the overarching re-
search methodology on the entire research methods, as well as the indicative use and
implications of the individual methods, are highlighted from a topic-based perspective.
This is closely aligned with the non-linear development of the narratives in this thesis.


Chapter 4
The Conceptual Framework
4.1 Background
Some key issues were identified in the Research Motivation and Problem Space discussion
in Chapter 1.1 and in the Literature Review in Chapter 2. These include the fact
that KM is becoming a lacklustre concept, in terms of its application as a strategic
management tool (Griffiths and Moon, 2011) and the perceived tension between KM
and Social Media (Ford and Mason, 2013a). Griffiths et al. (2015) also conclude in their
2015 Global Knowledge Management Observatory report, that KM need to reposition
itself and deliver measurable values if it is to remain relevant in organisational strategic
planning and positioning. This is against the backdrop of the criticism for the lack of a
measurable value, which resulted in the image problem KM faced, despite its overselling
by vendors and consultants in the 1990s.
This research had been motivated by the need to proffer pragmatic solutions to the
persistent problems of KM rather than fanning the flames of a new set of concepts like
Enterprise 2.0 (McAfee, 2006), which may soon become ”tired” and in need of a newer
set of concepts for vendors and consultants to ”oversell”. Also, rather than appearing
despondent about the future of KM as some KM experts like Davenport (2008) were
quick to be about a decade ago, the framework propounded in this thesis, adopts a
pragmatic approach in establishing itself behind KM as a sustainable concept and a
viable field of practice for which mobile devices and social media are available as new
technological tools.
Moreover, the GKRN research mentioned in Section 1.1, identifies the challenges of KM
in delivering measurable value for business but it fails to suggest ways in which KM can
deliver this value. Even the latest Knowledge Management Observatory as propagated
by Griffiths et al. (2015) highlights the gloomy state of KM wherein KM activities
are technology-driven rather than being people-driven. The report also highlights the
49

50 Chapter 4 The Conceptual Framework
importance of measurable value of KM to organisation but does not delve into what
could constitute measurable value.
In view of the above, this work postulates a rudimentary conceptual framework (Miles
and Huberman, 1994) (See Figure 4.1), which, when fully strengthened, will lend cre-
dence to KM as a sustainable field of practice, in spite of an increasing social media
ascendancy and the want of a measurable value.
4.2 Harmonisation of Literature
With regards to the image problem suffered by KM in the 1990s (Bolisani and Handzic,
2015), there has been an increasing effort by KM consultants and academics, since the
2000s, to explore how the growing trends of enterprise mobility — as manifest in the
surge in mobile devices and applications — can be exploited for corporate Knowledge
Management. This is evident in Knowledge Management literature, which abounds with
issues and concerns about Enterprise Mobility (see Chapter 2.8.2).
Moreover, the conceptual social framework emanated from a synthesis of a wide range
of literature. In Table 4.1, this thesis presents an associative classification of literature
that have been harmonised in formulating the conceptual framework. This is in order
to help the reader in quickly establishing, from the literature, the provenance of the
basic elements of the conceptual framework. Although in-exhaustive, the first column
of Table 4.1 presents a list of literature upon which the development of a conceptual
framework is justified while the other five columns are some literature that inform the
basic elements of the conceptual framework.

Chapter
4TheCon
ceptual
Framew
ork51
Table 4.1: Harmonisation of Literature
Rationale for aConceptualFramework
ManagedPlatform
Social Media Knowledge Discovery Tacit Knowledge KM Value
Griffiths and Moon (2011),Griffiths et al. (2015),Delic and Riley (2009)
Bolisani and Handzic (2015),Ford and Mason (2013a),
McAfee (2006),Davenport (2008),
Ford and Mason (2013b),Turban et al. (2011a),Shadbolt et al. (2013),
Lamont (2012)Buregio et al. (2013)
Bradley and McDonald (2011)
Mallis (2009),Piccoli (2008),
Dalmeyer and Tsipis (1997)Hitchcock (2012),Sorensen (2011),
Kietzmann et al. (2013)Davenport (2008),
Zikopoulos et al. (2012),Moore (1998),
Griffiths and Moon (2011),Microsoft (2015),
Enterprise Mobility Exchange (2015),Enterprise Mobility Exchange (2016)
Adetunji and Carr (2016b),Tiropanis et al. (2015),
Zeng (2014),Cabiddu et al. (2014),
Razmerita et al. (2014),Smart and Shadbolt (2014),
Ford and Mason (2013b),Ford and Mason (2013a),
Guy et al. (2013),Soto-Acosta et al. (2013),
White (2013),Tardanico (2012),
Fischer and Reuber (2011),Miller et al. (2011),
Haefliger et al. (2011)Sousa et al. (2010),
Kaplan and Haenlein (2010)Keenan and Shiri (2009),
Sankar and Bouchard (2009),Delic and Riley (2009),
Davenport (2008),McAfee (2006),O’Reilly (2005)
Adetunji and Carr (2016b),Shadbolt and Smart (2015)
Fang (2015),Guy et al. (2013),Lamont (2012),
Chen and Huang (2012)Falls (2012)
Zikopoulos et al. (2012),Peinl (2011),
Miller et al. (2011),Lin and He (2009)
Turban et al. (2011b),Alavi (1999),
Nonaka and Takeuchi (1995),Connelly et al. (2013),
Carr and Harnad (2011),Davenport and Prusak (1998)
Littlejohn and Margaryan (2013)Drucker (1994)
Haslinda and Sarinah (2009),Zikopoulos et al. (2012),
Schumaker (2011),Ackoff (1999),Chou (2005),
Bellinger et al. (2004),Hijikata et al. (2007),
Terra and Angeloni (2003)
Adetunji and Carr (2016b),Bolisani and Handzic (2015),Griffiths and Moon (2011),Ford and Mason (2013a),Delic and Riley (2009),
McAfee (2006),Koller (1994),
Edvinsson and Malone (1997),Gruman (2007),
Becerra-Fernandez and Rajiv (2001),Porter (2010),Marr (2014),
Kumar et al. (2014)

52 Chapter 4 The Conceptual Framework
4.2.1 The Making of the Conceptual Framework
Arriving at the conceptual framework has been an iterative process between four phases,
as described in this section:
1. In phase one, the document analysis of 160 KM literature described earlier (see
Chapter 2.8.2) serves as an initial input in the construction of the framework. This
involves identifying a wide range of terms and concepts within enterprise mobility,
social media, and Knowledge management, which are the core concepts of the
research title. These were then scaled down to pervading concepts of relevance
and concerns to different schools of thoughts — from those who question the
continued relevance of KM in the face of Social media ascendancy, to those who
still criticise KM for its want of measurable value. The aim was to arrive at a
short list of concepts that would serve to mediate between KM and Social media,
while keeping an outlook for a framework that delivers KM value to corporate
organisations.
2. Phase two involves a process of consolidating into sub components, the pervading
concepts of relevance and concern, as identified in phase one above. For example,
”explicit knowledge” was consolidated within ”tacit knowledge”. This is because
”tacit knowledge” is already a core element, and, one of the main challenges of
KM is the conversion of tacit knowledge to explicit. Understanding and apprecia-
tion of the embedded tacit knowledge within its workforce is sufficient in making
organisations realise the potentials for social media to help in overcoming the chal-
lenge of tacit -to- explicit knowledge conversion. This phase leads to an initial list
of seven core components, which originally included: (1) EMM, (2) Tacit Knowl-
edge, (3) Knowledge Discovery, (4) Social Media Data, (5) Cloud Computing, (6)
Information Security, 7) KM Value. Then, this was taken for a series of informal
consultations for feedback from KM and Social Media scholars from within the
university as well as those met at conferences.
3. The feedback from phase two serves as input to phase three, which involves a pro-
cess of manoeuvring that reduced the list of seven shortlisted core elements into
five: (1) Managed Platform, (2) Tacit Knowledge, (3) Knowledge Discovery, (4)
Social Media, (5) KM Value. For example, ’social media data’ is a distinct ele-
ment from ’social media’, as one can be utilised without the other. This research
has demonstrated how a SME utilised public social media data for its own com-
petitive advantage even when not actively present on the social media platform
concerned. The scope of the framework was reduced to be manageable and delin-
eated by removing the elements of Security and Cloud Computing. This prevents
the framework from being bloated than manageable.

Chapter 4 The Conceptual Framework 53
4. In the final phase, the core elements and sub-elements are fine-tuned and aggre-
gated. The inter-relatedness of each element is determined and it is decided that
KM Value should be at the core, since it should be the ultimate aim of any KM
effort. The framework was finally determined and presented diagrammatically in
a way that describes the loose inter relatedness of the concepts, with KM Value at
the centre and everything else contained within a Managed Platform. The cycli-
cal presentation of the diagram highlights the iterative interaction between the
elements in the process of tacit to explicit knowledge conversion, generating KM
value.
4.3 EMSoD - The Conceptual Framework
This section presents Enterprise Mobility and Social Data (EMSoD) as a conceptual
framework for using enterprise mobility and social data analytics as leverage for corpo-
rate knowledge management, with a description of the basic elements of the framework
as shown in Figure 4.1. The framework is presented cyclically to emphasise their inter-
dependence and that changing one element has an impact on other elements and might
reduce the capability for the framework to deliver the intended KM value at its core,
and that it is necessary to review all of the elements of the framework and not just one
or some of them.
4.3.1 Managed Platform
This framework supports the vision of a knowledge social machine, which serves as a
leverage for the flow and conversion of tacit knowledge on existing social interactions
within the boundary of the organisation, as defined by its enterprise mobility strategies.
This social machine has the organisation’s workforce as its user base, using their own
devices (BYOD) or using the company-owned devices that have been personally-enabled
for them (COPE). With BYOD for example, the choice of the brand, functionality and
installed apps are entirely that of the employee and, as discussed in Chapter 2.8.4, when
these devices are allowed to be used to access the corporate data from anywhere the
employee may be, it exposes the organisation to the risk of compromise of the privacy
and security of its corporate data. Also, because there are as many different devices
as there are employees, the organisation is faced with the challenge of how to integrate
these disparate devices into a platform for ease of support and interoperability. To
mitigate against these constraints of privacy, security and interoperability, there is need
for the organisation’s enterprise mobility strategy and social media data to be contained
within a managed platform, where all mobile processes, technologies policies and people
converge, as illustrated in Figure 2.5.
54 Chapter 4 The Conceptual Framework
4.3.1.1 Enterprise Mobility Strategy
“Given the plethora of devices, operating systems, solution providers and
overall mobility commoditisation, how will technology leaders meet their em-
ployees needs and offer mobile access to corporate system, data and informa-
tion they crave, in order to maximise the potential for productivity and the
competitive advantage that follows?”(Enterprise Mobility Exchange, 2016)
.
The above quote is from Mihaela Biti, the Programme Director of Enterprise Mobility
Exchange, in her Foreword on the Enterprise Mobility Exchange (2016) as reported
by the company, following a global survey. The report shows that the bulk of the
respondents are IT, Mobility and Technology workers, an industry where mobility is
already widely embraced. Also, about 30.1% of the respondents have their operations
globally, which presupposes they would have to mobilise, anyway. The mobility agenda
for these enterprises are largely for automation aimed at operational performances and
not for the facilitation of social interactions among employees. For example, when UPS
successfully introduced the handheld Delivery Information Acquisition mobile Device
(DIAD) for their drivers in 1991 (Mallis, 2009), the question arose as to whether the
next move was for customers to be able to quickly look and see real-time location of
their driver and contact them directly. An answer to this question is FEDEX Mobile
Solutions which allows customers to conveniently track their shipments, find the nearest
FedEx station or drop-box, etc. An enterprise mobility strategy that is geared towards
simple automation with mobile devices is good for enhancing operational efficiency of
an enterprise. Of course, this is a source of competitive advantage, but only up to the
point where they are unique to the company and as such, cannot easily be replicated
(e.g., the Walmart Satelite investment (Dalmeyer and Tsipis, 1997)).
However, the consumerisation of mobile devices has meant that the competitive ad-
vantage that a company derives, if any, from automation or implementation of mobile
solutions will soon erode when competitors have adopted the same or similar solutions.
In essence, a true competitive advantage is attainable when businesses and organisa-
tions proceed to the second - and third - order of organisational change, which are to
informate and transform as highlighted by Piccoli (2008).
Therefore, the focus of this research is on mobile applications and devices that facili-
tate social interaction among employees from which organisational knowledge could be
gained. Such mobile devices as smart phones and tablets as well as the mobile applica-
tions like social media that they enable, which are in turn, enablers of social interaction
within the organisation.

Chapter 4 The Conceptual Framework 55
KM based on the management and facilitation of these social interactions is potentially
able to propel organisation to strategic competitive advantage, especially in this era of
knowledge economy where social media is playing a crucial role.
Technically, custom-made mobile devices for single applications like those used in the
FEDEX and UPS examples can not be integrated with social interaction as the limitation
of their design and capabilities precludes this. Therefore, employees cannot be expected
to bring their own (BYOD), neither could they be expected to choose (CYOD) or have
company’s devices personally enabled (COPE) for them. Nonetheless, the newer tech-
nological trends of smart phones are already being used for the same functions, which
means, delivery drivers can track and manage their delivery on their smart phones while
also using the smart phones to interact with their colleagues on social media. They can,
for example, tweet their locations or ask for direction and get immediate response from
colleagues. On the same smart phone, they could make/receive calls to/from friends,
family or colleagues or even interact with friends and family through social media on the
smart phones. These are healthy for work life balances (Fleck et al., 2015; Nam, 2013),
which results in a satisfied work force that is motivated to engage in social interaction
and as such, knowledge sharing. This is altogether a function of the flexibility of the en-
terprise mobility management strategy (see Section 2.8.4) adopted by the organisation.
If the organisation’s mobility strategy is aimed only at operational efficiency without
the facilitation of social interaction, then the organisation may not be able to reap the
benefits in employee insights and knowledge for its strategic competitive advantage.
Meanwhile, the findings from both 2015 and 2016 Enterprise Mobility Exchange (2015,
2016) would have been sufficient for understanding the current state of Enterprise Mo-
bility. However, as stated earlier, the mobility concentration of the survey is predom-
inantly geared towards enterprise mobility strategies that are inclined towards process
automation. The respondents are also predominantly comprised of those for whom IT,
technology and mobility are an essential part of their job roles (e.g., those who are in the
business of developing mobile applications or selling mobile devices). Since this research
is concerned about such enterprise mobility agenda as facilitates the social interaction
that exists within an organisation, a survey has been designed and administered with
the aim of understanding the impact of these mobile devices and applications on social
interaction, employee engagement and knowledge sharing. A sample of the survey is
available in Appendix A while its findings and results are presented in Chapter 6.
4.3.2 Tacit Knowledge
Inherent in humans is a tacit power by which all knowledge is discovered, and this propels
an “active shaping of experience performed in the pursuit of knowledge” (Polanyi, 2009).
This framework places more emphasis on the externalisation of tacit knowledge, which,
it is believed, has become the more dominant element of the widely known Nonaka’s

56 Chapter 4 The Conceptual Framework
model of knowledge conversion (see Figure 2.2). This is due to the impact of the current
trends of mobile devices and social media which allow an uninhibited externalisation of
thoughts even on the spur of the moment (Zikopoulos et al., 2012), except where the
inhibiting factor is the individual motivation. Three sub-components are identified for
consideration within the tacit knowledge element of the framework:
1. ‘Externalisation’ Driven by Individual Motivation
The distinction between data and information is a given, from Computer Science
and Information Systems perspectives (Langefors, 1987). However, Information
is often used interchangeably with Knowledge, albeit erroneously. Davenport and
Prusak (2000) have gone a step further in attempting to create an understanding of
data and information as necessary tools [or resources] for knowledge, discarding the
notion that knowledge is data or information. Ackoff (1999), Schumaker (2011)
and Bellinger et al. (2004) all agree on a DIKW (Data-Information-Knowledge-
Wisdom) pyramid, which describes the configuration of data, information, knowl-
edge and wisdom while Terra and Angeloni (2003) attempt to highlight the impor-
tant differences between knowledge management and information management. It
is because of the explicit nature of information that it has often been used inter-
changeably with knowledge whereas, explicit knowledge is only one side of the coin
for knowledge. The other side of the coin is tacit knowledge, which people have
in their minds and are not represented in an explicit way (Hijikata et al., 2007)
because it is highly personal and difficult to formalise (Turban et al., 2011b, 478).
One distinguishing factor between knowledge and information is in the disposition
of tacit knowledge through its conversion to explicit knowledge (externalisation)
on the one hand, and the exchange of explicitly codified knowledge on the other.
However, unlike the spiralling movement of tacit knowledge as described by the
SECI (Socialisation-Externalisation-Combination-Internalisation) model of Non-
aka and Takeuchi (1995) (see Figure 2.2), this framework considers the cyclical
flow of tacit knowledge between individuals within an organisation. This flow
consists in each individual ‘externalising’ their views, opinions, sentiments and
know-hows, at the spur of the moment (Zikopoulos et al., 2012) as enabled by the
affordances of social media and mobile devices like smart phones and are supported
by the current social interactions that exist within the organisation. Having es-
tablished engagement as a measurable value for organisations, the measurement
of engagement is hinged upon the analysis of the social network that serves as
the platform for the social interactions that exist within the organisation. The
thesis in this work is in the potential for a vast amount of data being generated
by this social interaction, and from which actionable knowledge of value for the
organisation can be discovered.
2. Subsumption of SECI Model

Chapter 4 The Conceptual Framework 57
Chou (2005) categorises KM processes into knowledge learning and developing
phases. The main task in the knowledge learning phase is to learn new knowledge
and increase employees’ tacit knowledge from other tacit knowledge (Socialisation)
or explicit knowledge (Internalisation). The main task in the knowledge developing
phase is to develop new knowledge by transforming tacit knowledge into explicit
knowledge (Externalisation) or by combining explicit knowledge with other explicit
knowledge (Combination). In as much as tacit knowledge remains the conduit that
connects both phases, the main thrust of this framework is to determine how the
KM process can add value to organisations by enhancing tacit to explicit knowledge
conversion within the construct of new technological trends of social media and
enterprise mobility. This implies that this study is mostly concerned with the
impact of the new technological trends of social media and enterprise mobility in
supporting the “externalisation” pane of SECI model.
As far as this researcher is aware, this is the first framework that subsumes an
aspect of the SECI model into current technological circumstances. By the same
token, this is the very first attempt at positioning an engaged workforce as the
nucleus of an organisational knowledge creation process.
Argyris (1987) argues that socialisation results in what he calls organisation de-
fensive routines with which most individual employees behave consistently even as
the individuals move in and out of the organisation. He concludes, therefore, that
“because the actions used to create or to trigger organisational defensive routines
are used by most people, their use cannot be attributed primarily to individual
psychological anxiety”. In as much as knowledge conversion occurs when individ-
ual employees cooperate voluntarily in the process based on their own intrinsic
motivation (Bohringer and Richter, 2009), the organisational culture would deter-
mine how this cooperation would engender positive knowledge sharing experience
(Sousa et al., 2013). In supporting the externalisation and combination stages of
SECI model, Hijikata et al. (2007) observes the availability of knowledge acquisi-
tion methodologies for expert systems, discussion support systems or groupware in
stimulating people’s interaction. “However, these methods do not support the peo-
ple’s real-time discussion for knowledge acquisition”, notes Hijikata et al. (2007).
Mobile devices and social media trends enhance real-time discussion and as such
require a new methodology in enabling them to support knowledge acquisition
(Zikopoulos et al., 2012).
3. KM Process within New Trends
The tacit knowledge that exists within the socialisation pane of SECI model cannot
be converted to explicit knowledge if it existed solely at this pane, and therefore
would not be usable except in an apprenticeship or a mentoring situation (Chou,
2005). As mentioned above, one of the the main thrusts of this framework is in how

58 Chapter 4 The Conceptual Framework
social media and enterprise mobility support employees in externalising their tacit
knowledge in such a way that shared knowledge is created through a combination
of the explicit knowledge thus created with other explicit knowledge.
This framework subsumes the entire SECI model into the externalisation of indi-
viduals’ tacit knowledge which is enhanced by the Enterprise Mobility strategies
of the organisation coupled with the freedom of spontaneous expression offered by
social media (Zikopoulos et al., 2012). Social media tools like blogs and wikis, in
addition to platforms like Twitter and Facebook, constitute the new technological
trend with which KM must contend and subsist if it were to remain relevant (Ford
and Mason, 2013b; Guy et al., 2013; Sousa et al., 2010)
It is worth noting that existing methodologies in Computer Science do not suffi-
ciently support the SECI model of knowledge conversion (Hijikata et al., 2007),
especially in this new era in which IT has revolutionised the world (Sousa et al.,
2013). Therefore, this framework is all about repositioning KM in a way that it
delivers measurable value to organisations within these new trends.
4.3.3 Social Media
Although, they are becoming increasingly disruptive to organisational structures and
processes, social media have become viable sources of data from which corporate organ-
isations can discover knowledge and insights for their strategic competitive advantage
(see Chapter 5.2.
Social media are the collection of adaptable, scalable Web-based tools and technologies
that facilitate the creation and sharing of user-generated contents (Fischer and Reuber,
2011; Kleek and O’Hara, 2013). Cabiddu et al. (2014) describe them as “browser or
mobile-based applications that allow users to easily create, edit, access and link to
content and/or to other individuals.”. “Perhaps the best definition of social media,
though, is content that has been created by its audience”, posits (Comm, 2010). They
include blogs, wikis and other social networking platforms like Facebook and Twitter
(McAfee, 2006; Sousa et al., 2010; Guy et al., 2013; Ford and Mason, 2013b; Razmerita
et al., 2014), and collaborative platforms like Myspace,Wikipedia, Ushahidi and Galaxy
Zoo (Kaplan and Haenlein, 2010; Smart and Shadbolt, 2014). Although, their origin can
be traced back to the era of “weblog” which coincided with the creation of “Open Diary”
which brought together online diary writers into one community in the sixties, they
have become a popular trend that have become interest to any company (Kaplan and
Haenlein, 2010). Wikis are good for preserving the organisation’s memory while social
networks like Facebook and micro-blogs like Twitter are helpful in expertise identification
and location within the organisation (Miller et al., 2011). When it comes to including
customer insight in an organisation’s social media strategies as suggested by Zikopoulos
et al. (2012), forums and message boards are probably the most common platform

Chapter 4 The Conceptual Framework 59
for questions and answers about products and brands (Falls, 2012), and can as well be
included as a constituent source of external (public) social media — in addition to micro-
blogging platform like Twitter — that serve as external data source to the social data
within the organisation’s managed platform. Following is a discussion of the three main
sub-components of the “Social Media” element that are identified within the EMSoD
framework:
1. Social Interactions on Social Media
Despite the media richness and “lifelike immersive world” that some social media
platforms like Second Life provide, interactions on social media still cannot be as
effective as face-to-face interactions (Ford and Mason, 2013b), which has tradi-
tionally been the means of knowledge creation and transfer (Alavi, 1999, pp. 7).
In fact, there has been a number of criticisms with regards to the authenticity
of the interaction and communication exchange over social media. One example
put forward by Tardanico (2012) is the story of a daughter who attempted sui-
cide while in an actual state of distress whereas, she was at the same time using
smiling emoticons and positive expressions to communicate a state of happiness
to her mother. Perhaps this is why White (2013) believes that social media allows
“individuals to put on masks and hold up shields”. Yet the common denominator
between all the Web-based social media tools and platforms is their ability to fa-
cilitate social interactions and conversations between people (Zeng, 2014; Cabiddu
et al., 2014; Fischer and Reuber, 2011; Keenan and Shiri, 2009; McAfee, 2006).
Moreover, it is not unusual for this online social interactions to extend even to
face-face interaction, as it is found by Fischer and Reuber (2011) where a survey
participant comments that:
“ ...A lot of these people I have engaged in an online fashion have be-
come part of our offline social functions and I formed real relationships
with many. Hundreds of people: my network exploded... it grew expo-
nentially and it’s through Twitter. It’s through connecting with people.
They find me. They reach out to me or I find them. I reach out to them.
And we engage in ongoing conversations online, meeting up sometimes
offline. These are real relationships.”
.
In understanding the nature of social interaction on social media, Keenan and
Shiri (2009) have aptly and succinctly provided some operational definitions of
the following terms, which are reproduced here, with kind permission from the
publishers (See Appendix H):
(a) Sociability

60 Chapter 4 The Conceptual Framework
The ability to interact with others, or to socialize... Websites use features,
design standards or technologies to encourage sociability. For example, an
online dating website uses profiles to encourage users to interact with other
users. Or, a blog with user comments allows readers to respond to a topic
and socialize with both the author and other readers.
(b) Social network theory
An interdisciplinary theoretical lens that emphasizes the relationships be-
tween actors (or users) within the network [wherein] the structure of the
network is understood to be more important than the individual users... So-
cial network theory, also called social network analysis (SNA), examines how
the structure of a network affects users within the network.
(c) Social networking sites
Websites that encourage social interaction through profile-based user ac-
counts. Social networking sites are commonly defined as Web 2.0..., meaning
they mimic desktop applications. Popular social networking sites include
Facebook and MySpace.
(d) Social websites
Websites and web technologies that promote socialisation online. This term
encompasses social networking sites as well as more traditional social web
technologies including bulletin boards, message boards or web-based chat
rooms. This will be the primary term used in this work to describe social
networking websites.
2. Folksonomy
Folksonomy is a term coined as a linguistic contraction of folk, which informally
refers to “people in general” (Wal, 2007); and taxonomy, which, as a formal sys-
tem of structured classification of things and concepts, arose as a solution to the
paramount problem in information management and retrieval: lack of organisa-
tion (Avenue, 2004). Folksonomy is a practice in which individual users save/define
Web contents as bookmarks/keyword in a social environment by attaching anno-
tations in form of tags (Zubiaga, 2012).
While taxonomy is a structured, top-down tagging system which the organisation
or a content creator imposed on the content for ease of retrieval and organisation,
folksonomy is an informal bottom-up approach to tagging where the user assigns
tags to contents depending on the system. These tags are often used to create ag-
gregated informal classifications (or, folksonomy), and as a navigational/discovery
method.
3. Social Network Analysis

Chapter 4 The Conceptual Framework 61
“A social network is a social structure comprised of types of interdependency be-
tween nodes. Nodes are most commonly individuals or organisations. The config-
uration of individual nodes into a larger web of interdependency creates a social
network”, explained Keenan and Shiri (2009), who also identify the two major
types of interaction that exists within the social Web as:
(a) People focused, which emphasises social interaction through user-driven per-
sonal content centred around a personal individual profile (e.g., Facebook,
Twitter).
(b) Activity focused, which emphasises social interaction through site-specific
content centred around a thematic focus for a website with users providing
their own contributions to that specific theme (e.g., Youtube and Flickr for
video and photo themes, respectively).
According to Keenan and Shiri (2009), this analysis of the social web examines
people focused websites and their strategies to encourage sociability. It also entails
studying the structure of the connections and relationships within a social network
like Twitter with regards to the further depths and insights they provide towards
the pieces of knowledge discovered from the network as suggested in Adetunji and
Carr (2016b).

62Chap
ter4TheCon
ceptual
Fram
ework
Figure 4.1: Enterprise Mobility and Social Data (EMSoD): A Framework for KM Value

Chapter 4 The Conceptual Framework 63
4.3.4 Knowledge Discovery
Frawley et al. (1992) describe knowledge discovery as a nontrivial extraction of implicit,
previously unknown, and potentially useful information from data. The word, ‘nontriv-
ial’ in the definition implies that a significant organisational effort must come to bear
on a knowledge discovery initiative. Knowledge discovery has been a cause of significant
concern for corporate organisations since the 1980s when the total number of databases
in the world was an estimated five million (Frawley et al., 1992). These days, with the
proliferation of mobile devices and the social interactions enabled by them, there has
been an exponential increase in the amount of data being produced — an amount that
dwarfs the figure mentioned above. For example, the number of websites on the Internet
recently passed the one billion mark (Berners-Lee, 2014).
As a result, corporate organisations are increasingly exploring and exploiting insights
from the big (social) data being generated, for their competitive advantage (Adetunji
and Carr, 2016b). Not only is there a need for organisations to focus on knowledge
discovery from their private/corporate data, there are potential knowledge and insights
to be gained from public social data as this would help organisations know their industry
trends, know their environments and know their customers better (Zikopoulos et al.,
2012).
Therefore, knowledge discovery efforts must be geared towards exploring and exploiting
both public and private/corporate data, using big (social) data analytics techniques.
4.3.5 KM Value for Organisations
A couple of decades ago, “discounted cash flow value” may have been the best measure of
value creation available (Koller, 1994). In recent years, however, organisations have not
only been regarding value in terms of the Returns on Investments, they have also been
giving consideration to intangible assets — like organisational knowledge, patent and
trademarks — as measures of an organisation’s true value (Bueno et al., 2014; Edvinsson
and Malone, 1997). These indirect assets, according to Edvinsson and Malone (1997),
include employee morale, customer satisfaction and innovation; and, they are poised to
“transform the nature of business transactions by establishing the real value of enterprises
for all stakeholders”.
Knowledge Managers and/or CIOs have often struggled to justify IT expenditure, es-
pecially, since when IT has been viewed from a cost centre perspective. This has often
resulted in intangible field of practice like KM taking the hits from budget cuts as a
result of a lack of measurable value (Gruman, 2007). However, since each process of
Nonaka’s SECI model (from socialisation through internalisation), “is positively associ-
ated with perceived knowledge satisfaction”, Becerra-Fernandez and Rajiv (2001) argue

64 Chapter 4 The Conceptual Framework
that an organisation should focus more on perceived knowledge satisfaction rather than
an objective measure of knowledge effectiveness. This is corroborated by some schools
of thoughts which hold that “the recognition of its presence by informed observers will
establish a value for a firm that dwarfs its balance sheet, even without a common yard-
stick for measuring Intellectual Capital” (Edvinsson and Malone, 1997, p. 6), and it
is against this backdrop that Martın-de Castro (2014) proposes the intellectual capital
based view (ICBV) of the firm, which organises the firm’s intangible assets into the
human capital, organisational capital and social capital within the Intellectual Capital
concept.
Moreover, with regards to value being defined as outcomes relative to cost, cost reduc-
tion without regard to the outcome achieved is dangerous and self-defeating, accord-
ing to Porter (2010), who concludes that, outcomes, which are the numerator of the
value equation, are inherently condition-specific and multidimensional. This position
is strengthened by the NAO’s (National Audits Office) definition of Value for Money
(VFM): “Good value for money is the optimal use of resources to achieve the intended
outcomes” (National Audit Office, 2010). What are these intended outcomes by which
knowledge satisfaction can be perceived, and by which the measure of KM value to
organisations are asserted? These are the issues encapsulated in one of the extended
research questions for this research ( see ERQ 2 in Section 1.2.1):
“What are the intended outcomes from social media by which KM values can
be measured?”
4.4 Implementing the Framework
Whereas a conceptual framework, from a research perspective, provides some direction
for the researcher before and during the research by mapping out what to cover, who
to consult and why (Miles and Huberman, 1994), this research has adopted the use
of conceptual framework from the business perspective, as described by the Business
Dictionary:
“A theoretical structure of assumptions, principles and rules, that hold together the
ideas comprising a broad concept”
In essence, the EMSoD framework was not meant to provide direction for this research
but attempted to put together a theoretical structure of assumptions that hold together
the proposed solution to a business problem, which is ultimately aimed at redeeming
the image of KM as a management function while repositioning it (KM) for value within
the current trend of enterprise mobility and social media.
First, the equation for Actionable Knowledge (see Chapter 5.4) emanating from a knowl-
edge discovery activity implies that there can be any number of knowledge content item
Chapter 4 The Conceptual Framework 65
n, and of course, there is the freedom to assign any weight to each item, depending on
one’s perception of its pertinence to the current undertaking or its effect on decision
making. It has been stated how this could be sufficient in itself as a measure of KM
value derived from the knowledge discovery undertaking. An example of this implemen-
tation is detailed in Section 5.5.1, page 87. However, the KM Value that the EMSoD
framework delivers is of the essence, as far as KM value within the EMSoD framework
is concerned. This is because it considers the social interactions between employees and
the impact of their engagement towards the knowledge generation activities. Therefore,
when one factors in the measure of an engaged workforce, the KM value derived from
the knowledge discovery activity will either be attenuated or amplified.
For example, if the value of employee engagement was zero (0), then actionable knowl-
edge (AK) value of 0.56 that was previously arrived at, will be attenuated by its mul-
tiplication by zero (zero being the value of engaged workforce), resulting in KM value
(KMV) of zero. This could be considered a limitation of the equation for KM value.
However, it would be absolutely impossible to arrive at a value of zero, except, of course,
where it indicates the presence of a moribund corporate social network. This is because,
if the knowledge discovery activity producing the actionable knowledge is not entirely
based on the corporate social media/network, EMSoD need not be implemented in full
but partly. Then, the value of actionable knowledge (AK) would suffice for the knowledge
management value (KMV). An example is the knowledge discovery case study presented
in this thesis.
Emphatically, the value delivered by an element of the framework, Knowledge Discovery,
could be sufficient for the organisation to measure, using the actionable knowledge alone
as parameter. This means EMSoD has not been considered as a whole, highlighting
the distinction between tailoring and a holistic embedding of the EMSoD framework.
This is why this is only a framework, which is a structure of assumptions that hold
the EMSoD idea together. And, of course, there is no formal constraints on how the
variables interrelate to produce KM value. Such formal constraints can be implemented
and operationalised within a corporate software, as a system designed in accordance
with the emergent conceptual model presented in Section 4.5.
Whether tailored or fully embedded, Knowledge Management Value (KMV) thus, be-
comes a normalised quantitative measure in developing a case for return on investment.
This is much more beyond story telling or anecdotal success stories and can be used in
bench-marking similar KM investments for which EMSoD is tailored or wholly imple-
mented.

66 Chapter 4 The Conceptual Framework
4.5 Emergent Conceptual Model
Based on a strategic synthesis of survey findings in Chapter 6 with actionable knowl-
edge and an engaged workforce (see Chapters 5.5 and 5.6) as parameters for measuring
KM value, the interactions between the components of the Conceptual Framework de-
scribed in this chapter can be seen as an iterative process that results in KM value for
organisations, within the construct of social media.
Figure 4.2: KM in Social Media Era - A Process to Value Model
This interaction is conceptually described with the model presented in Figure 4.2. It is
worth noting the distinction between a model and a framework as mentioned in Chap-
ter 3.2.3. In effect, software developers can use this model to define Entity classes that
are independent of a database structure and then, map the components to the tables and
associations of the database. This helps in fulfilling the aim of developing a data model
for knowledge social machine that helps Knowledge Management (KM) deliver value to
corporate organisations, as mentioned in Chapter 1.3. However, operationalisation of
the constructs of this data model within a corporate social software design is potentially
an intensive research outcome to which this research work can be extended.
4.6 Chapter Summary
The framework presented in this chapter conceptualises the re-emergence of KM within
the current technological trends of enterprise mobility and social media, with KM value

Chapter 4 The Conceptual Framework 67
at its core. This is aimed at re-positioning KM as a valuable strategic tool for organisa-
tions’ competitive advantage.
The framework has, as its basic elements, the following: i) a Managed Platform, which
defines the organisational boundary underpinned by the enterprise mobility strategies
adopted within a corporate organisation; ii) Tacit Knowledge, which leads to a horizon-
tal flow of intrinsic knowledge coupled with its explicit conversion. This also highlights
a major concern of this research, which is the impact of the technological trends of social
media and enterprise mobility in supporting the externalisation of tacit knowledge; iii)
Social Media, which serve as platforms for social interactions and enable the develop-
ment of social networks within corporate organisations; iv) Knowledge Discovery, which
highlights the processes and analytic techniques for discovering knowledge from either
a public or a corporate social data; and, v) KM Value for Organisation, which sets an-
other perspective for seeing KM value beyond the Returns on Investment (ROI). In this
element of the framework, KM value is seen in light of the optimal use of resources to
achieve an intended outcome, and this is considered good value for money.
Finally, in order to help the reader in quickly establishing the provenance of each element
of the framework, the research presents an associative classification of literature that
have been harmonised in formulating the conceptual framework.


Chapter 5
Research Findings and Analysis
As explained in Section 1.2.1, this research sought to find answers to the extended ques-
tion of what intended outcomes by which KM value can be measured (ERQ 2) and,
how social media — as resources — can impact the intended outcomes (ERQ 3). The
Enterprise Mobility and Social Data (EMSoD) framework proposed in this research
is an amalgam of components resulting from a convergence of Enterprise Mobility and
Social Media in exploring how social media are delivering Knowledge Management value
to corporate organisations, and as such, answers the question of an appropriate social
framework for delivering KM values to corporate organisations (ERQ 1 in Section 1.2.1).
This is the overarching question of this research. From this framework emerges a con-
ceptual model (see Chapter 4.5) which describes an iterative process that results in KM
value for organisations within the construct of social media. The framework, which has
helped in arriving at the findings below, has also been strengthened by them. The two
broad categories of findings — actionable knowledge and engaged workforce — are from
the case study and a combination of survey and social network analysis, respectively.
Moreover, they are both a measure of KM value to organisations, which is at the centre
of the EMSoD framework. Based on the findings from this research, some recommen-
dations are made in Section 7.3 as to how organisations can harness social media to
achieve the intended outcomes.
The placement of KM value at the centre of the conceptual framework in Chapter 4
presupposes that KM value is the focal point and the driving force behind the framework.
As this is a framework that repositions KM practice within the current trend of enterprise
mobility and social media, the question has naturally arisen as to how social media
are delivering KM value to organisations. It has been established that knowledge is an
intangible asset. As such, its management and measure of value has to take an innovative
approach as this research study has found, using “actionable knowledge” and “employee
engagement” as parameters. But before discussing these parameters further, the next
section presents the measurement mechanism proposed by this research for measuring
KM value within the context of the parameters delivered by the EMSoD framework.
69

70 Chapter 5 Research Findings and Analysis
5.1 Measurement Mechanism for KM Value
As mentioned earlier, this research identifies two intended outcomes from which knowl-
edge satisfaction can be perceived, and by which we assert our measure of KM value
to organisations: (i) the generation of actionable knowledge and, (ii) the facilitation of
employee engagement.
Although many organisations have turned to storytelling and anecdotal success stories to
show the value of their KM investments, there is an increasing need for businesses to show
the business value of KM in terms of normalised quantitative measures in developing
a case for Return on Investments (Vestal, 2002). This is what business managers and
accountants, whose perception of realities is largely in terms of numbers, are looking for
when they criticise KM for want of measurable values. The EMSoD social framework
advanced in this thesis report does not only deliver the KM value but also proffers
solution for the measurement.
Meanwhile, “Metrics fulfil the fundamental activities of measuring (evaluating how we
are doing), educating (since what we measure is what is important; what we measure
indicates how we intend to deliver value to our customers), and directing (potential
problems are flagged by the size of the gaps between the metrics and the standard)”
(Melnyk et al., 2004). It is worth noting that the topic of metrics is viewed differently
from both Management and Academics, as Melnyk et al. (2004) observe:
“The academic is more concerned with the validity and generalisability be-
yond the original context, of the results from such measurements that are
defined, adapted and validated in addressing specific research questions. The
manager, on the other hand, is more than willing to use a befitting measure
if it can quickly provide useful information.”
In view of this, this research has devised a simple measurement mechanism which, it
is believed, satisfies both academic and management concerns. This is denoted by the
formula:
KMV = AK × EW (5.1)
where,
KMV = KM V alue,
AK = Actionable Knowledge
EW = Engaged Workforce.

Chapter 5 Research Findings and Analysis 71
5.2 Knowledge Discovery from Social Media Data
This study adopts a case study method, using textual analysis techniques to make sense
of the unstructured social media data harvested through Twitters Streaming API. Based
on a qualitative exploratory approach, the methods explore how social media data could
serve as leverage for organisational knowledge.
The bulk of the materials used in the methodology and findings from this study are
reproduced here as published in Knowledge Discovery from Social Media Data: A Case
of Public Twitter Data for SMEs (Adetunji and Carr, 2016b).
5.2.1 A Case of Public Twitter Data for SMEs
According to Zaidah and Zainal (2007), “Case studies, in their true essence, explore and
investigate contemporary real-life phenomenon through detailed contextual analysis of
a limited number of events or conditions, and their relationships.” This study adopts a
single case of Twitter data for small and media-scale enterprises in exploring knowledge
discovery from social media data. A multiple case design could have been adopted but a
single case design is considered sufficient in cases where there are no other cases available
for replication (Zaidah and Zainal, 2007).
Any social media platform could have been studied in this case, but Twitter has been
chosen for the public availability of its data for research. For example, Twitter pro-
vides immediate access to public global conversation — even before any data mining
technique — unlike any other social media platform. Also, as a social micro-blogging
utility, Twitter creates increased interest in organisations with regards to growth, fea-
tures and potential benefits to the organisation (Bulearca and Bulearca, 2010). For
example, apart from its significant role in the US Elections of 2008 (Bohringer and
Richter, 2009), (Kaplan and Haenlein, 2010) also alluded to Dells claim that its use of
Twitter has generated 1million in incremental revenue due to sales alerts. Meanwhile,
Russell (2013) describes Twitter as a glorified piece of valuable infrastructure that en-
ables rapid and easy communication and, unlike Facebook or LinkedIn, its asymmetric
relationship model of following allows one to keep up with the tweets of any other user
without the need for the other user to reciprocate. This facilitates a lateral flow of
knowledge that is powered by the intrinsic motivation of individual employees within
the organisation. Moreover, the consumerisation and proliferation of mobile devices like
smart phones has driven the popularity of social media and enabled the adoption of
Web 2.0 affordances, especially the deployment of micro-blogging, to the business en-
vironment. This offers powerful opportunities to distribute tacit knowledge and best
practices within an enterprise (Bohringer and Richter, 2009).

72 Chapter 5 Research Findings and Analysis
An increasing number of large enterprises have already been able to tap into the benefits
of Twitter as a micro-blogging platform. According to a Gartner report referenced in
(Bohringer and Richter, 2009), leading-edge companies are investigating the potential
of micro-blogging to enhance other social media and channels, and, as mentioned above,
Dell recounts its use of Twitter as a leverage for increased revenue gains while the
electoral success of Barack Obama as President in the US General Elections of 2008 is
largely credited to the use of Twitter by the Democratic Party (Bohringer and Richter,
2009). Also, Ford Motors and Zappos (Porterfield, 2011) are a few examples of large
enterprises already exploiting social media. How could this trend be beneficial to Small
and Medium sized enterprises even where the social applications may not be hugely
embedded in the work place? This chapter highlights how this research has helped a
medium-sized enterprise to tap into the wealth of Twitter data for its operational and
strategic insights, and thereby, positioning the organisation for competitive advantage.
5.2.2 Choosing a SME for the Case Study
Beyond their use for building relationships, connections, and/or marketing leads, social
media present an opportunity for Small and Medium-sized Enterprises (SMEs) just
as they do for large corporate enterprises to exploit the wealth of intrinsic insights
embedded in the mass of social data publicly available, for their strategic competitive
advantage. Yet, due to a perceived lack of relevance of social media to certain types
of industry/sector, SMEs are often disinclined to adopting social media (Michaelidou
et al., 2011). This work presents a case of a medium-sized enterprise for which social
media is perceived as not relevant.
The role of Small and Medium-sized Enterprises within an Economy is so crucial that
the World Bank commits hugely to the development of the sector as a significant part
of its efforts in promoting employment and economic growth (Ayyagari et al., 2007).
Liaise Loddon is a medium-sized enterprise with about 220 employees, providing resi-
dential social care for adults with autism and learning disabilities in Hampshire, United
Kingdom. As typical in this sector, operational procedures result in an enormous amount
of documentation arising from daily diaries, incident/activity reports and several other
reporting in compliance with regulatory requirements, analytic purposes and decision
making. It was through involvement in another project that this researcher learnt of
the digital transformation that the company was going through and thus, approached
them as a candidate organisation for a case study. Although the company has recently
deployed an enterprise mobility suite of mobile devices and applications to replace the ex-
isting paper-based documentation system, this investigation explores how this enterprise
mobility agenda could be integrated with knowledge sharing and knowledge extraction
from the mass of social data freely available on Twitter, for example, in such a way as
it supports the organisation at the second level of organisational change (Piccoli, 2008,

Chapter 5 Research Findings and Analysis 73
p.35-38), which highlights the people dimension of a socio-technical system as described
in Section 5.2.3.
5.2.3 Organisational Change and the Enterprise Mobility Agenda
As with the introduction of any new Information Technology that brings about an or-
ganisational change, mobilising Liaise Loddon’s operations over mobile apps and mobile
devices is an effort to move in line with the digital revolution to potentially bring about
organisational change of which there are three levels, as highlighted by (Piccoli, 2008,
p.35-38):
1. Automate: The basic level of organisation change occurs from automation wherein
an IT innovation is introduced to change how an existing process is performed.
Thus, the introduction of mobile devices to change the existing paper-based docu-
mentation processes at Liaise Loddon is at its basic level of organisational change.
This is known as First-Order Change and its limited scope makes it easy to en-
vision, justify and manage. However, true digital revolution does not stop at the
first order change but proceeds to the Second-Order Change, or, Informate.
2. Informate: The fundamental basis of this second order change is on the people
dimension of the socio-technical systems. This level of change seeks to strategically
position the organisation for competitive advantage. One way of doing this is by
tapping into the insights from the wealth of data enabled by the enterprise mobility
platform using big data analytic techniques.
3. Transform: This third-order change has been described as the most pervasive level
of change as it subsumes both first and second order change while also causing
organisational structures disruptions. A flatter or more permeable organisational
structure usually emerges after the technology implementation. Attaining this
level of change requires the utilisation of technologies like the big data analytics
to enable analysts and end users to have easier access to organisational data for
analytical and knowledge discovery purposes.
It is worth reiterating that this research is mainly aimed at re-positioning KM to deliver
value to corporate organisation within the constructs of new technological trends like
social media, for which an appropriate conceptual framework has been developed (see
Chapter 4) to support the organisation at the second level of organisational change.
5.2.4 Data Gathering and Processing
In Fang’s (2015) proposed framework for extracting machine-readable data, four types
of data sources are identified, which are: Web texts, Document Object Model (DOM)

74 Chapter 5 Research Findings and Analysis
trees, existing Knowledge Bases (KBs), and query streams. Out of these four types of
data sources, Web texts is more pertinent to this study. This is largely because the
decomposition of data generated and extracted from social Web platforms like Twitter,
normally results in pure text format, even though pictures and sounds are also important
data in social media.
An investigation was carried out to demonstrate the value of insights derivable from
public Twitter data as relevant to the case study organisation. Ordinarily, the organ-
isation’s operations do not require social media marketing neither does it appear like
the company could benefit from its employees conversations and knowledge sharing over
social blogging platform like Twitter. As such, this organisation, just like many other
small and medium scale enterprises (SMEs), does not have a huge following on Twitter,
neither does it have any such enterprise micro-blogging platform that generates sufficient
data from which employees conversations could be mined for insights. Yet, in a bid to
stay abreast of — and respond quickly to — issues surrounding its area of specialism,
this work harvested, from global public tweets, for Autism and its variants like ‘ASD’
(Autistic Spectrum Disorder) and ‘disability’, which are categorical keywords that tend
to define aspects of its business domain. Therefore, this research polled public Twitter
streaming data for approximately one week from Thursday 30th April to Wednesday
6th May, 2015. The following keywords were specifically polled, as related to insights
aimed for in this research: ‘ASD’, ‘autism’ and ‘disability’. These are keywords that is
believed will help in the capture of any discussion and trends surrounding the topic of
interest, which is autism.
A total of 149,501 tweets were gathered from all tweets across the world against the
above keywords. As such, it would be worth knowing that there are tweets in languages
other than English. For example, the word ‘autism’ means the same thing as ‘autisme’
in French. A person tweeting in French may have mistakenly omitted the letter ‘e’ at
the end of the word, which would have resulted in the French tweet being harvested.
Also, the abbreviation, ‘ASD’, does not always represent Autistic Syndrome Disorder
even in the English language.
To begin making sense of this data, there is need to separate the language of the tweets
as indicated in table 5.1. As some of the tweet languages are insignificant as per the
number of tweets, the preprocessing of the data concentrates on the top 5 languages as
presented in Figure 5.1.
This data would definitely contain some noise. For example, as stated above, the term,
‘ASD’, may mean a different thing in another language other than what is intended for
it to mean in the English language. Even if some tweets in other languages contain the
intended use of the search terms for this experiment, they still would be of little or no
use to this research as it may not be possible to make sense of them. Therefore, non
english language tweets from the data were filtered out. In essence, the efforts in this

Chapter 5 Research Findings and Analysis 75
research are geared towards making sense of, and deriving insights from, the English
language tweets of the research’s Twitter data.
Table 5.1: Distribution of Tweets by Languages
No. Tweets(By ISO)
Language NameNo. Tweets(By ISO)
Language Name
en 131993 English da 28 Danishund 4567 Undecided pl 26 Polishtr 3741 Traditional Chinese cy 24 Cymraeg (Welsh)es 1769 Spanish fi 21 Finnishja 1618 Japanese bs 21 Bosnianin 869 Indonesian sk 20 Slovakru 748 Russian no19 Norwegianit 716 Italian sl 13 Slovenenl 582 Dutch (Netherland) sr 11 Serbiantl 508 Tagalog hr 10 Croatian (hrvatski jezik)pt 425 Portuguese el 7 Greek (modern)ar 384 Arabic vi 7 Vietnamesefr 299 French th 6 Thaisv 175 Swedish (svenska) hy 5 Armeniande 169 German (Deutsch) is 4 Icelandic (slenska)ro 161 Romanian zh 4 Zhngwn (Chinese)et 126 Estonian hi 3 Hindiuk 93 Ukrainian lv 3 Latvianhu 73 Hungarian ta 2 Tamillt 63 Lithuanian bn 2 Bengaliko 51 Korean fa 2 Persian (Farsi)bg 51 Bulgarian iw 1 Hebrew50 Unknown ur 1 Urduht 29 Haitian, Haitian Creole ne 1 Nepali
Moreover, if it was decided to target tweets from particular countries, there would be
need to separate the tweets in this research’s data according to the countries they em-
anated from. However, there is the constraints of people not updating their Twitter
data with their country or location. To compound this, Twitter’s geo-location algo-
rithm could not detect the location, resulting in a ‘null’ value for the ‘place’ key in a
vast majority of the research’s tweets’ data.
In essence, the country could be determined for only about 3.5% of tweets in the Twitter
data, as indicated in Table 5.2.
Table 5.2: Tweets without Country Value
Percentage (%)
No. of Tweets without Country Value 144246 96.5
No. Tweets with Country Value 5255 3.5
Total No. of Tweets 149501 100

76 Chapter 5 Research Findings and Analysis
Figure 5.1: The Top 5 Languages of Tweets Polled
Nonetheless, even from the 3.5% tweets with country value, United Kingdom tops the
list, followed by the United States (Figure 5.2), both which are the two largest English
speaking countries.
5.2.5 Content Classification of Tweet Data
One solution to handling vast volumes of data is to reduce the data (Liao and Trianta-
phyllou, 2008). Therefore, having already reduced the data-set for exploration to only
those with ‘country value’ as indicated in table 5.2, the research further concentrates
on the tweets in English language from the United Kingdom. As indicated in Figure
5.2, there are 1,473 tweets emanating from the United Kingdom. These are classified in
Table 5.3, according to the contents.
5.3 Knowledge Elicitation from Tweet Data Contents
With regards to the case study and data gathering described in sections: 5.2.2 and 5.2.4
respectively, this section presents the findings from the twitter data used for the study.
Immediately following this is a discussion on what constitute actionable knowledge for
the case study organisation.

Chapter 5 Research Findings and Analysis 77
Figure 5.2: The Top 5 Countries of Tweets Polled
Table 5.3: Content Classification of Tweet Data
ContentsNo. of Tweets(Including RTs)
Impact of Technology on Disability 15
Information Gathering 10
Political Opinions (#votecameronout) 132
Social Welfare Benefits 327
Living with Autism 989
Total Tweets 1473
Despite the data collection being based on domain-specific keywords of interest to the
case study organisation, the research is an exploratory study in which there was not a
preconceived idea of the insights/knowledge inherent in the data. Out of an enormous
amount of data, only a handful may contain the valuable and actionable knowledge that
propels an organisation towards strategic competitive advantage (Liao and Triantaphyl-
lou, 2008, pg.5). As such, the bulk of the contents as seen in Table 5.3, are largely
re-tweets (RT) of the original messages and so, may be regarded as extraneous amplifi-
cation of the original tweets. Therefore, while the next section follows with a discussion
on the value and actionability of the knowledge so discovered, this section reproduces
the categories observed in the data as described in Adetunji and Carr (2016b):

78 Chapter 5 Research Findings and Analysis
5.3.1 Impact of Technology on Disability
“RT @BILD tweets: Helping to unlock the secrets of autism - a project using inno-
vative technology aims to change how we address autism http:...”
The above tweet provides an insight into a project using innovative technology to change
how the subject of autism is addressed. As this research’s case study organisation is in
the business of autism support and also currently implementing mobile technologies to
enhance its operational performance, it is worth exploring this piece of insight further.
Figure 5.3: Original Tweet with Link to Project on Innovative Technology
Figure 5.4: Retracted Study Linking Vaccine to Autism
Although the link to the actual URL of the story about the project is missing from
the tweet, the original source of the tweet can easily be followed up, as the above is a
retweet (RT) of @BILD tweets, which is the Twitter handle for BILD (British Institute
of Learning Disabilities). BILD actually tweeted that tweet on the 29th of April, which
is a day before this research’s data capture began, as can be seen in Figure 5.3. This
explains why the original tweet was not captured in this research’s twitter streaming
data capture of 30th April to 6th May. From this original tweet, it has been possible
to extract the URL link (bit.ly/1JRNhV0) to the story about the project on innovative

Chapter 5 Research Findings and Analysis 79
technology. This is about the National Autism Project, which “aims to create a more
strategic approach to addressing the challenges of the condition”. This project highlights
the impact of iPads, picture dictionaries and interactive schedules on the improvements
of communication and vocabulary of autistic people. Strategic competitive advantage
requires an alignment/tagging along with this project. Below are a sample of other
tweets related to this content of Technology’s impact on disability while its pertinence,
as an actionable piece of knowledge, is discussed further in Section 5.4:
“tech reducing the impact of disability - or are the latest gadgets too pricey? Watch
@SkyNewsSwipe at 2130 http://t.co/iHtX1spOqQ”
“Technology limits impact of disability but is it affordable? @TwitterUser GT http://t.co/Az3nJejO32”
5.3.2 Information Gathering
“@TwitterUser @BBCNewsUS @BBCWorld Please direct me to this research, the
thing about vaccines causing autism was admitted to be a fraud.”
The first tweet about vaccines causing autism in this category is a request for infor-
mation. Just as enterprise micro-blogging tool could be used within the organisational
social network, public micro-blogging tools like Twitter provide the platform to quickly
seek information, knowledge and/or ideas from a heterogeneous audience defying the
constraints of space, time and location. Thus, the above tweet was almost instantly
replied to by the one below:
“@TwitterUser Here’s the original study that said that vaccines cause autism, from
a respected, peer-reviewed journal: http://t.co/cmVVKpLQgh”
Even though the original study is from a ‘respected, peer-reviewed journal’, as claimed
by the sender of the above tweet, we know from the link provided that the publication of
the research has been retracted as shown in Figure 5.4. The ability for anyone to search,
gather and distribute information seamlessly in this manner provides an interesting
dimension of social media as “relatively inexpensive and widely accessible electronic
tools that enable anyone to publish and access information...”Murthy (2013).

80 Chapter 5 Research Findings and Analysis
Meanwhile, the following two tweets provide link to further information that could help
drive home the knowledge that the research study in question has actually been rebuffed:
“RT @TwitterUser: @SB277FF vaccines do not cause autism. They don’t. But if
they did, what would you prefer? Autism or incurable smallpox/po”
“”RT @BILD tweets: There is ‘no link between MMR and autism’, major study
concludes. http://t.co/Re9L8fPfGV via the @guardian #autism””
In as much as Twitter allows for an almost spontaneous expression of opinions by anyone
(Lim and Buntine, 2014), it offers a good platform for polarisation and debate (Kalsnes
et al., 2014; Lorentzen, 2014) on topical issues from which knowledge could be mined, as
exemplified by the question of preference between autism and incurable smallpox posed
by one of the tweets above.
Moreover, the following tweet with a URL link to Learning Disability Census is an
example in knowledge discovery (of an official census and regional data on Learning
Disabilities), which when actioned in conjunction with the enterprise resource planning,
could have an impact on the company’s strategic planning:
“RT @dmarsden49: Learning disability census with regional stats is out. Check
http://t.co/Ja3tk7ZRDZ ”
5.3.3 Political Opinions (#votecameronout)
The role of public opinion cannot be over-emphasised insofar as it shapes and is shaped
by government policies. A recent and relevant example is the UK tax credits row, (Tax
Credits Row) which has seen the planned tax credit cuts, at the time of writing this
report, suspended by government because the scheme proved unpopular to the public and
thus, was defeated in the House of Commons. Social media, especially Twitter, provides
a means of capturing and measuring the sentiments and opinions of the electorate.
It is therefore, no coincidence that political opinions that have been expressed, are in-
cluded in the Twitter data gathered over autism and disability keywords:
“#votecameronout Because he wants to get rid of Human Rights Act which will af-
fect: Maternity Rights; Workers rights; Disability Rights”

Chapter 5 Research Findings and Analysis 81
Figure 5.5: The Proliferated Re-tweets of Political Opinion
“For the harassment of people struggling on sick & disability benefits... #Vote-
CameronOut”
“5 more years of the Tories we will lose Social Care, NHS, Human Rights, Workers
Rights, Unions, Disability support. #VoteCameronOut”
Using the hashtag #votecameronout in the run up to the UK General Elections of 2015,
the above tweets represent an active campaign against the then incumbent Tory-led
government in which David Cameron was Prime Minister. It is interesting to note that
the bulk (129) of the political tweets in this experiment’s Twitter data are a prolifer-
ated re-tweets (RT) of the above 3 original tweets as exemplified in Figure 5.5. The
correlation between public sentiments on social media and elections results and/or on
government policies, is another growing area of interest in social media research. In
politics meanwhile, it is not uncommon for opponents to whip up public sentiments
by whatever means possible. Social Welfare issues are quintessentially core, and often
politicised, concerns in the UK. A parallel category of tweets in this work is that of
social welfare benefits, which is described in the next section. Although this research’s
data-set is based, as stated earlier, on categorical keywords that define the business of
the case study organisation, the infiltrated political opinions cannot be ignored in as
much as these are public opinions that shape political trends which potentially impacts
on businesses in terms of government policies. Akin to this is the category on social
welfare benefits, described in the next section.
5.3.4 Social Welfare Benefits
Social Welfare simply implies the “Well being of the entire society” (Business Dictio-
nary), which promotes inclusivity for the disabled, the sick, the elderly/pensioner, the
unemployed and even the low income earners. As this is the hallmark of an egalitarian
society, the UK government renders financial assistance to these categories of people in
form of a range of Social Welfare Benefit payments. Figure 5.6 provides an insight into

82 Chapter 5 Research Findings and Analysis
Figure 5.6: Public Spending on Benefits in the UK(Source: http://bit.ly/1dtVQEh)
public spending on social welfare benefits in the UK. As indicated in the preceding sec-
tion, social welfare issues affect the fabrics of the society and any proposed significant
cut in social welfare benefits is a natural invitation for public dissent. This category
of tweets from this work represents genuine sentiments and opinion of those expressing
them, without political motivations like the preceding category:
“Uproar at thought of @Conservatives cutting child benefits if elected - I wish there
was same media outrage over disability cuts #GE2015 ”
“@George Osborne If only I could live until pensionable age. You‘ve reduced my
disability benefit well below living standards!”
“39 yo woman killed herself after Department Work and Pensions threats to cut off
disability benefits http://t.co/TkVQF2UYki...”
Again, the above are a few samples of sentiments and opinions about Child Benefits
and Disability Benefits, which provide an initial understanding to the unassuming, that
social welfare benefits are not a one-size-fits-all affair but are multifarious (see Figure

Chapter 5 Research Findings and Analysis 83
5.6), with some being exclusively non- means tested (e.g, Child Benefit). These tweets
provide some insights into public sentiments towards government policies. Since any
such social welfare benefit cuts would directly and/or indirectly impact the service users
and providers of social care, it can be inferred that the case study organisation would
also share these public sentiments.
5.3.5 Living with Autism
Autism is defined as a “life-long neurodevelopmental condition interfering with the per-
son’s ability to communicate and relate to others” (Elsabbagh et al., 2012). How can
this definition be juxtaposed with one of the myths surrounding autism (Baldock, 2015,
item 8) that autistic people do not interact? This myth is however, dispelled by the
tweet below, which is a re-tweet of an original tweet by an actual autistic blogger who
attempts to use his blog posts to connect with the general public:
“@matt diangelo RT? It would be truly amazing if u could view my blog about
living with Autism&OCD. Would mean a lot-http://t.co/JCGBBZz8fJ ”
This category constitutes the bulk of the Twitter data for this work as it contains multi-
ple unique re-tweet of the same tweet over 900 times (see Table 5.3). This is an indication
of the public interest/curiosity and positive sentiment towards the subject of autism in
general, and towards the autistic blogger in particular. Despite the NHS’s attempts at
educating the general public by diffusing some of the myth surrounding the subject of
Autism Choices (2015), among several Autism Awareness initiatives, the story of autism
as told by an autistic person appears to garner more public support and understanding.
Measuring public opinion and sentiments through social media impact, reach and net-
works is another interesting research area in social media research towards which this
work can potentially be extended.
5.4 Actionable Knowledge from the Case Study
The real essence of knowledge is its actionability, especially when it contributes to the ad-
vancement of a proposed undertaking (Cross and Sproull, 2004). Each of the knowledge
items discovered from the tweet data, as highlighted above, is capable of providing sig-
nificant insights that would inform decision making, which impacts company’s proposed
undertakings at one point or the other. However, the first item, Impact of Technology on
Disability (see 5.3.1), is more pertinent to the enterprise mobility agenda by which the
company deploys mobile application and devices to its operations. For example, one of

84 Chapter 5 Research Findings and Analysis
the shortened URL above (http://t.co/Az3nJejO32) leads us to a Sky News supplement
on ‘How Tech is Helping with Struggle of Disability’.
To aspire to a leadership position in the health and social care sector, the case study
organisation cannot afford to be oblivious to such reports as this, which could potentially
shape the industry trends and direction. This knowledge, coupled with the insights
gained from the use of iPads and pictorial dictionary mentioned in the ‘Project on
Innovative Technology’ resulted in an official resolution by the company to extend the
use of mobile devices to its service users as well, and not only to help staff in operational
performances. It is worth noting that, although the piece of information regarding the
impact of technology on disability was on the news prior to the extraction of data for this
work, it was not an actionable knowledge for the company until the above decision was
driven by it through a presentation made by this researcher. Discovery of insights and
actionable knowledge is one of the ways in which social media is helping KM to deliver
value to organisations when appropriately leveraged. In corroborating this finding, the
next section presents some further insights from recent Twitter data.
5.4.1 Further Insights from Recent Twitter Data
As it has been over one year since the data used for the case study (as reported in
Section 5.2.4 was gathered, using the categorical keyword of autism, a decision was
made to do a quick check on the current public conversation on the subject. A total
of 6118 tweets were gathered, mentioning the categorical search keyword of autism for
just one day on the 5th of August, 2016. Of these, 3, 290 are original posts by Twitter
users, 2828 are re-tweets of the original posts while the rest are replies-to. Although
the day opens with a tweet containing a pleasant human story about the cure of autism
(Figure 5.7), we found it surprising that some top issues as discovered from our data of
over a year ago, are still currently leading the conversations on the subject, as shown
in Figure 5.8. Considering (A) and (B) from Figure 5.8, the following tweet content, as
tweeted by the CNN, led the conversation at different times of the day, with 111 and 93
reactions, respectively:
“How pokemon go helps kids with autism https://t.co/DZatqTX4sc #Poke-
monGo”
It is worth recalling that the theme of the impact of technology on disability, which
was the most pertinent knowledge item from the previous data, did inform a significant
corporate decision by the case study organisation, as asserted in Section 5.4. The above
tweet on how the new Pokemon Go game helps autistic kids, is an indication of the fact
that the theme of the impact of technology on disability, dominates the conversations
on the subject of autism for the second year running. Although, not directly related to

Chapter 5 Research Findings and Analysis 85
Figure 5.7: Tweet about Cure for Autism
Figure 5.8: Top Issues from Newer Twitter Data
our actionable knowledge gains, another issue that gained prominence in our previous
data was the debate over the causal relationship between vaccines and autism. The same
debate still reappears prominently in the recent newer data on the subject of autism as
shown in Figure 5.8 (C). The next section proceeds with a discussion on actionable
knowledge and presents our proposed mechanism for placing a weighted measurement
for KM value.
The next section presents a discussion on actionable knowledge and its measurement
mechanism.
5.5 A Focus on Actionable Knowledge
“Everyone agrees that Knowledge entails true belief” (Pritchard, 2009), but this is not
always the case. Using an analogy, Gettier (1963) argues that it is possible for a person
to be justified in believing a proposition that is in fact, false. This brings about the
question of what actually counts as knowledge. In light of our data, we shall examine
this question in our discussion on actionable knowledge, next.
According to Argyris (2005), propositions that are actionable are those that actors can
use to implement their intentions effectively. A case in point is the enterprise mobility
agenda of the case study organisation as discussed in Section 5.2.2. The outcomes from
an organisation’s KM efforts cannot adequately be measured from the report card (like
a student’s annual progress/performance report) perspective and indicator systems used

86 Chapter 5 Research Findings and Analysis
in schools, for example. These systems, according to Posner (2009), contribute far less
than they could to school improvement. Posner highlights the following as the reasons
for this assertion:
1. Their purposes and intended audiences are often diffuse or ill-defined.
2. They tend to focus too much on ranking and not enough on exemplary practices
and models for action.
3. Many data sets are overly tied to consumer choice and not enough to citizen
engagement.
4. Despite vast improvements, research remains inaccessible to many people, bringing
knowledge online but not infusing it into capitols, classrooms and kitchen-table
problem-solving
Posner (2009) therefore, suggests that information must be crafted around organising
and action, citing Argyris (1993), who says, “Actionable Knowledge is not only relevant
to the world of practice, it is the knowledge that people use to create that world”.
The action triggered by knowledge is of the essence in determining the value that KM
delivers to an organisation. In fact, the real essence of knowledge is its actionability,
especially when it contributes to the advancement of a proposed undertaking (Cross and
Sproull, 2004).
Each of the knowledge items discovered from the tweet data, as highlighted in Section 5.3,
is capable of providing significant insights that inform decision making, which impacts
company’s proposed undertakings at one point or the other. However, as stated in
5.3, the first item, Impact of Technology on Disability (No.1), is more pertinent to the
enterprise mobility agenda by which the company deploys mobile application and devices
to its operations. For example, one of the shortened URLs contained in one of the tweets
(http://t.co/Az3nJejO32), leads to a Sky News supplement on How Tech is Helping with
Struggle of Disability.
It can be asserted therefore that, to aspire to a leadership position in the health and social
care sector, the case study organisation cannot afford to be oblivious to such reports as
this, which could potentially shape the industry trends and direction. This knowledge,
coupled with the insights gained from the use of iPads and pictorial dictionary mentioned
in the Project on Innovative Technology, resulted in an official resolution by the company
to extend the use of mobile devices to its service users as well, and not only to help staff
in operational performances. It is worth noting that, although the piece of actionable
knowledge regarding the impact of technology on disability was on the news prior to
the extraction of data for that research, it was neither known nor acted upon by the

Chapter 5 Research Findings and Analysis 87
company until the above decision was driven through a presentation made by us, the
authors.
Meanwhile, this research also discovered further insights from recent data, as discussed
in Section 5.4.1, which indicates that the theme of the impact of technology on autism
is still leading the conversations on autism for the second year running. We had earlier
alluded to the criticism of Knowledge Management as a field of practice, in spite of
the gains — albeit intangible — from Knowledge Management and knowledge discovery
efforts. This is due, in part, to the lack of a measurable value of those gains. With
Equation 5.1 in Section 4.3.5, this research proposes a measurement mechanism for
KM Value delivered by the EMSoD framework, which is one of the main objectives of
this work. The next section proceeds with a measurement mechanism for actionable
knowledge as a parameter of KM Value.
5.5.1 Measurement Mechanism for ‘Actionable Knowledge’
The main objective of this work is the delivery of KM value to corporate organisations
which, this researcher believes, the EMSoD framework helps to deliver. Actionable
knowledge had earlier been identified as a measure of KM value, denoted as AK for
measurement purposes (see Equation 5.1 in Section 4.3.5).
To find the numerical value of (AK) in the equation (KMV = AK × EW ), a simple
measurement mechanism is devised, as denoted in Equation (5.2):
∑nWeightnn×MaxWeight
(5.2)
where,
n = total content items
MaxWeight = maximum assignable weight
As an example, considering the knowledge content items from previous investigation on
knowledge discovery from social media data (see Section 5.3) and displayed in Table 5.3,
the total content items (n) is 5 and each one of them is given a weight of 2, 3 or 5, which
represent low, medium or high value, respectively. Please note that the weights have
nothing to do with the No. of Tweets as displayed in the second column of Table 5.3.
However, the weights represent the pertinence of the knowledge item to the matter or
issue at hand within the organisation, where the maximum weight (MaxWeight) of 5
represents a high pertinence, 3 represents medium pertinence and the weight of 2 repre-
sents a low pertinence. High to low pertinence is directly mappable to high to low value,

88 Chapter 5 Research Findings and Analysis
respectively. The probability and freedom for subjectivity in assigning these weights is
acknowledged. It is worth reiterating, for emphasis, that the acknowledgement of the
possibility and freedom for subjectivity is only in the weighting system, where content
items of knowledge are assigned numeric weights based on the perception of pertinence
of the knowledge item to the organisation’s proposed undertaking. For example, “im-
pact of technology on disability” received the highest weight of 5 because of its direct
pertinence to the ongoing mobility agenda of the organisation. The mobility agenda was
of priority to the company, and, any proposition that advances their priority would be
considered of high weight.
In essence, what is considered a priority is a judgement call. Therefore, Knowledge
Management and/or IT practitioners should find out what problem is of priority to a
client organisation so solutions could be proposed that resolve existing problems rather
than searching for new problems that the organisation may not consider to be of priority.
This is according to Ray Dawson in Loughborough University (2013), who suggests that
this approach helps in reducing the likelihood of failure in implementation of knowledge
management initiative. Matching proposed solution to client’s priority also helps in as-
signing weights to the knowledge content items in accordance with the pertinence/direct
relevance of each knowledge item to the organisation’s proposed undertaking, thereby,
reducing the possibility of subjectivity. Moreover, in order to reduce the level of sub-
jectivity, it is recommended for this measurement activity to be carried out only after
the KM activity/event in question has been concluded. In our example, the knowledge
discovery from social media data has been completed and we know which of the knowl-
edge items has had a high impact on management’s decision making for us to assign a
high weight of 5; and, medium weight of 3 and low weight of 2 to items we consider of
medium and low values, respectively, as shown in Table 5.4.
As earlier stated in page 65 during the discussion on the implementation of the framework
(see Chapter 4.4), Knowledge Management Value becomes a normalised quantitative
measure in developing a case for return on investment, regardless of whether the EMSoD
framework is tailored or fully embedded. This is much more beyond story telling or
anecdotal success stories and can be used in bench-marking similar KM investments for
which EMSoD is tailored or wholly implemented.
Table 5.4: Knowledge Contents and their Weights
Content Weight
Impact of Technology on Disability 5
Information Gathering 2
Political Opinions (#votecameronout) 2
Social Welfare Benefits 3
Living with Autism 2
The item with the maximum weight (MaxWeight) of 5, Impact of Technology on Dis-
ability, is of a high pertinence to the enterprise mobility agenda by which the company

Chapter 5 Research Findings and Analysis 89
deploys mobile application and devices to its operations. Therefore, going by Equation
(5.2), the maximum value is 25, being a product of the total number of content items
(5) and the maximum weight (5). Also, with the numerator being a sum of all the
Weightsn, the value of AK from Equation 5.1 is given thus:
KMV = 0.56× EW (5.3)
The EMSoD framework presented in this thesis is predicated upon the capability of
social media in delivering actionable knowledge to corporate organisations. We have
thus, been able to place a measurable value on actionable knowledge (AK). This is
ordinarily sufficient as a measure of KM value derived from such insights from social
media data. However, our framework — and the KM value it delivers to corporate
organisations — is further strengthened by an additional measure of the KM value,
which is employee engagement, denoted as EW (Engaged Workforce) in Equation 5.1.
The next section discusses employee engagement in the light of the social network that
exists within the organisation, the impact of the structure of the network on employee
engagement and knowledge sharing as well as a measurement mechanism for the KM
value of employee engagement.
5.6 Engaged Workforce
As can be inferred from Chapter 2.7.1, it is worth considering the suggestion for employee
engagement as a measure of KM values, given that “the level of employee engagement
is one of the most important indicators of the likelihood of an organisation succeed-
ing financially and delivering to its vision and mission statements” (Marr, 2014). Also,
research has shown that having a highly engaged workforce not only maximises a compa-
nys investment in human capital and improves productivity, but it can also significantly
reduce costs (such as turnover) that directly impacts the bottom line (Kumar et al.,
2014).
Thus, the organisation’s Enterprise Mobility Management (see Managed Platform in
Chapter 4.3.1) defines the organisational boundary within which employees’ contribu-
tions are gathered as a measure of their engagement and as a reference point for the
organisations Social Network Analysis, which can serve as knowledge input to the or-
ganisation’s Intellectual capital.
In an organisational setting, the utilisation of social networking for knowledge sharing
and as a source of knowledge elicitation can be influenced and measured by employee
engagement (see Section 5.6.5, which is underscored by the enterprise mobility policies of
Bring Your Own Device (BYOD) and/or Company-Owned devices that are Personally-
Enabled (COPE). As actors within the social network, how are employees impacted by

90 Chapter 5 Research Findings and Analysis
the use of mobile devices and applications to engage with the organisation, their work
and their colleagues? This research attempts an answer to this question with Findings
from the Survey Questionnaire presented in Section 6.
Based on the above premises, this work posits that knowledge sharing would be rife in an
organisation with a truly engaged workforce. How then, does the social network facilitate
employee engagement? How does the structure of the connections and relationships
within a social network provide further depth and insights to knowledge discovered from
such networks, as highlighted in Section 5.2? This is explored further with the findings
from the Social Network Analysis presented in Section 5.6.1.
5.6.1 Social Network Analysis
Social Network Analysis is described as a detailed examination of the structure of a
network and its effect on users (actors) within the network, wherein the structure of the
network is understood to be more important than the individual users (Keenan and Shiri,
2009). A core component of the EMSoD framework is Social Media (see Section 4.3.3),
which serve as platforms for social interactions on the Web. With the peculiar example
of Twitter, these social interactions are explained by the relationship types of ‘mentions’,
‘replies to’ and just, ‘tweets’. A mentions relationship exist when a message (tweet) on
Twitter mentions another user (@Username) while a replies to relationship exist when
a tweet is in reply to another user’s tweet by preceding the tweet with the other user’s
Twitter ID (@Username) (Itai Himelboim et al., 2017). When a tweet is neither a reply
to - nor contains a mention of - another Twitter user, the tweet creates a relationship
type of tweet, which exist as a self loop and is indicated on a network visualisation as
a node with an arrow that projects and returns unto itself. These relationships develop
into a network of connections.
In strict adherence to the Ethics approval for this research, the University of Southamp-
ton Twitter network (@unisouthampton) is used in this study. As Twitter following
model enables anyone, even without any affiliation with the University, to ‘follow’ or
’join’ the network, the researcher manually identify 93 Twitter users through the @so-
tonwsi node. These are are known to be affiliated to the university by virtue of being
academic/non-academic staff and researchers. Considering its perceived ease of use and
a broad coverage of social network analytic metrics and visualisation features (Hansen
et al., 2013), this research uses NodeXL - a network analysis and visualisation package
designed for the analysis of online social media on Microsoft Excel (Hansen et al., 2010)
- to examine the network (Golbeck, 2015) of relationships that develop over a one month
period (from 26/07/2016 to 25/08/2016) among the 93 users.

Chapter 5 Research Findings and Analysis 91
In social network analysis, the connections between people are considered as the units of
analysis that reveal the flow of information and how these connections define the struc-
ture of the network, which also refers to the presence of regular patterns in relationships
(Wasserman and Faust, 2012). Gaining insights towards the understanding of the com-
ponents and structure of a social network requires a vocabulary and techniques provided
by social network analysis and visualisation (Gruzd and Haythornthwaite, 2013). This
vocabulary and techniques are described in our examination of two different kinds of net-
works identified by Rossi and Magnani (2012) as, (i) the topical network, which is made
up of relationships created through tweets/activities that are aggregated over a topic or
the #hashtag and, (ii) the Twitter network, which is made up of all the relationships
between the users (followers and friends).
5.6.2 Understanding the Topical Network
A topical network is created when users are connected by common topical issues, where
individuals save/define Web contents as bookmarks/keyword in a social environment
by attaching annotations in form of tags (Zubiaga, 2012), normally preceded by the
hash symbol on most keyboards (#). The hashtag can be said to be the democratic
manifestation of taxonomic principles in the social media era (see Section 4.3.3). Trant
(2009) highlights the description of such tags as publicly shared user generated keywords,
which have been suggested for use as a trivial mechanism for further improving the
description of online information resources and their access through broader indexing.
An example of the topical network is shown in the Influencers Engagement Network
Graph presented in Figure 5.9. This network has been aggregated over the search
keyword and hashtag of #autism, as found in our recent data on the subject (see Section
5.4.1. Both this topical network study and the study that results in further insights
on our previous study from recent data, were performed on Southampton University’s
account on the Pulsal Platform — an audience intelligence analytic platform for social
media.
5.6.3 Limitation of the Topical Network
The EMSoD social framework proposed in this research operates within a managed plat-
form (Section 4.3.1)0, which defines the organisational boundary. Although the hash-
tag phenomenon has been successful in aggregating online topical discussions without
boundaries, the relationships created over mutual hash-tagged conversation is ephemeral
(Rossi and Magnani, 2012), and so is the network created. Unless the hashtag can be
tamed, its use on a public Twitter account can be so widespread that it compromises the
need, if there were, to keep the conversations within the organisational boundary. Even
with the use of enterprise Twitter’s alternatives, such as Yammer, aggregating events

92 Chapter 5 Research Findings and Analysis
Figure 5.9: Influencers Engagement Network Graph
and conversation over the hashtag cannot but include Yammer-wide conversations and
events from outside the organisational boundary.
For example, when one takes a look at the topical network created over our recent
data on the subject of autism in Figure 5.9. The nodes are not defined within a single
geographical boundary. The nodes in yellow colour represent those from the United
Kingdom. The location information for the nodes in blue is unavailable. This means
that users from various countries other than the UK are aggregated over this topic.
In fact, the two most engaged influencers’s networks (CNN and genevassky) are not
from the UK. This may be good in that it provides further reach and depth around the
topic but not for classified organisational conversation that needs to be kept within the
boundary of the organisation’s network, assuming the UK was a corporate entity in the
business sense.
Specifying network boundaries in terms of hashtag or keywords that connect people to-
gether in this manner is more akin to the normalist approach of specifying a network,
which is based on the theoritical concerns of the researcher (Wasserman and Faust,
2012), whereas the actors may not even know one another. Contrarily, Wasserman and
Faust also describe a second way of specifying network boundaries, the realist approach,
wherein the actors know one another, since membership of such network is as perceived
and acknowledged by members themselves. In essence, employees would readily acknowl-
edge and engage with fellow colleagues as members of the same network. The realist
approach aligns with the Twitter network as identified by Rossi and Magnani Rossi and

Chapter 5 Research Findings and Analysis 93
Figure 5.10: A Directed Network Graph of @unisouthampton
Magnani (2012). The next section attempts to create an understanding of the Twitter
network.
5.6.4 Understanding the Twitter (Structural) Network
Considering its perceived ease of use and a broad coverage of social network analysis
metrics and visualisation features (Hansen et al., 2013), we used NodeXL — a net-
work analysis and visualisation package designed for the analysis of online social media
on Microsoft Excel (Hansen et al., 2010) — to examine the egocentric network (Gol-
beck, 2015) of relationships that develop over a one month period from 26/07/2016 to
25/08/2016. As stated earlier, relationships emerge when a user (the source) mentions
or replies to another user (the destination) in their tweet. For example, the following
tweet of 29/07/2016, in which @unisouthampton mentions @nature — the Twitter han-
dle for the International Weekly Journal of Science — creates a relationship (mentions)
between the two entities:
“Our #research places us top 50 globally and 4th in the UK, in @nature Index
Rising Stars: https://t.co/XwXKR9N8Az https://t.co/VGQDxPE74y”
A relationship also emerges when a tweet is self sufficient without mentioning or replying
to any other tweet by including or preceding with another Twitter @username, respec-
tively. These are regarded as self loop and is indicated in Figure 5.10 by the red arrow

94 Chapter 5 Research Findings and Analysis
proceeding and returning to the source (@unisouthampton). As can be expected that
a user could tweet without having to mention or reply to any other user, there are 68
such self loops, 102 unique Edges and 129 Vertices (Nodes) within the network so gen-
erated (see Table 5.5). The connections made through the ‘replies to’ relationships are
represented with Edges (connections lines) of 60% opacity than the connections made
through the mentions relationship, which are represented by Edges of 20% opacity.
Table 5.5: Graph Metrics for the DirectedNetwork Graph of @unisouthampton (Figure 5.10)
Vertices 129
Unique Edges 102
Edges WithDuplicates
163
Total Edges 265
Self Loops 68
According to Wasserman and Faust (2012), “the concept of a network emphasises the
fact that each individual has ties to other individuals, each of whom in turn is tied to a
few, some or many others. The phrase, ”social network” refers to the set of actors and
the ties among them. The network analyst would seek to model these relationships to
depict the structure of a group. One could then study the impact of this structure on
the functioning of the group and/or the influence of this structure on individuals within
the group”.
However, the network as it is presented in Figure 5.10 is not an ideal network that en-
courages knowledge sharing and engagement among the actors. The three relationships
that develop were initiated by @unisouthampton’s tweets in which other users were men-
tioned or replied to or in which the tweets were sent wholly to create a tweet relationship.
Querying NodeXL with only the Twitter ID of a corporate or individual’s Twitter ac-
count, as we did with @unisouthampton, would only result in a visualisation of the list
of connections, as Figure 5.10 reveals. Moreover, with over 40,000 nodes, a meaning-
ful visible visualisation of a network of such magnitude as the @unisouthampton’s can
be difficult because of the inherent complexity of the relationships and limited screen
space (Dunne and Shneiderman, 2013). According to Wasserman and Faust (2012), “the
restriction to a finite set or sets of actors is an analytic requirement.”
Therefore, the researcher identified 93 Twitter users (Vertices or Nodes) within the
University of Southampton and examine the network of connections that evolves around
them. Table 5.6 presents the overall graph metrics. Of particular interest in Table 5.6
is the the graph density as it is calculated before the network is grouped in accordance
with the node importance of betweeness centrality (see Section 5.6.4.1.

Chapter 5 Research Findings and Analysis 95
Table 5.6: Graph Metrics for the Network Graph of 93 Verticesidentified within the University of Southampton’s Twitter Network
Graph Metric Value Graph Metric Value
Graph Type DirectedConnectedComponents
9
Vertices 93Single-VertexConnected Components
8
Unique Edges 303Maximum Vertices in aConnected Component
85
Edges withDuplicates
15925Maximum Edges in aConnected Component
15758
Total Edges 16228Maximum,GeodesicDistance (Diameter)
3
Self-Loops 13628Average GeodesicDistance
1.962102
ReciprocatedVertex Pair Ratio
0.221206581 Graph,Density 0.078073866
ReciprocatedEdge Ratio
0.362275449NodeXLVersion
1.0.1.355
5.6.4.1 Grouping the Network on the Basis of Node Importance
Various metrics (Degree centrality, eigenvector centrality, pagerank, etc) capture various
ways in which each individual node (user) acts as a centre of attraction through which
knowledge and information propagates within the network. Sorting by Betweenness
Centrality for example, sorts people who have the quality of most broadly connecting
across the network to the top while Clustering coefficient measures how closely connected
each users connections connected to one another (Smith et al., 2014). As this work is
focused on measuring and seeking to facilitate employee engagement, we have used
Betweeness Centrality as our measure of ranking for node importance based on the
potential of such central points for binding the network together by coordinating the
activities of other points, albeit, they may be viewed as structurally central to the
extent that they stand between others and can therefore facilitate, impede or bias the
transmission of messages (Freeman, 1977). Moreover, measuring proximities can help
to characterise the global structure of a network by showing how closely coupled it is
(Koren et al., 2007).
Accordingly, the 93 nodes (users, also referred to as vertices) in the network are ranked
and grouped on the basis of their Betweeness Centrality, with each group disc sized
according to the number of nodes that make up the range of measures for the group, as
visualised in Figure 5.11 and the group metrics in Table 5.7.

96 Chapter 5 Research Findings and Analysis
Figure 5.11: Graph of 93 Vertices, grouped according to Betweenness Centrality
Table 5.7: Groups of Vertices according to Betweeness Centrality metric
Group VerticesUniqueEdges
Edgeswith
Duplicates
TotalEdges
SelfLoops
MAX.GeodesicDistance
AVG.GeodesicDistance
GraphDensity
G1 41 90 7415 7505 6972 4 2.083 0.115G2 21 1 2112 2113 2113 0 0.000 0.000G3 19 2 2759 2761 2751 1 0.240 0.012G4 12 21 2151 2172 1792 2 1.194 0.462
5.6.4.2 Decomposing the Network Group of 93 Nodes
The smallest group in the network graph presented in Figure 5.11 (Light Green, G4:12)
is a group of 12 nodes with the highest Betweeness Centrality ranging from 115.194
to 2494.640 (see Table 5.8), although the node with the highest Betweeness Centrality
(2494.640) is @unisouthampton, and understandably with over 40,000 followers com-
pared to only 558 followers of the next highest Betweeness Centrality node, @sotonwsi
(at betweeness centrality score of 522.543), and 2390 followers for @lescarr (with a be-
tweeness centrality score of 425.512), in that order.
The largest group (Dark Blue, G1 : 41) is comprised of 41 nodes (vertices) with the sec-
ond highest Betweeness Centrality ranging from 11.408 to 99.715, with the highest being
@garethpbeeston (99.715), @lisaharris (94.079) and @mark weal (93.573) in that order.
Group 3 (Dark Green, G3:19) is composed of nodes with the third highest betweeness
centrality ranging from 1.067 to 8.627.
Group 4, 3 and 1 are subgroups of this directed graph, as demonstrated by the direction
of the arrows on all sides, and as such, potentially represent an engaged network that

Chapter 5 Research Findings and Analysis 97
could possibly facilitate knowledge sharing. Group 2 (Light Blue, G2:21) may be con-
sidered negligible as 16 out of the 21 nodes have zero score for Betweeness Centrality,
and thus, they would have little or no impact on the network. Expanding the graph to
show the nodes in each group (see Figure 5.12) reveals some of the nodes in group 2
(light green dots) are actually outliers that have no tie with the network at all as they
have not engaged in any relationship with any other member of the network, either by
mentioning or replying to, other than themselves by way of tweeting (self loop), hence,
they have each scored zero in the betweeness centrality measurement. We can even
spot 2 of them that have never tweeted within the timeframe and as such, they do not
have the arrow-edged ring of self loop (tweet) but are standing aloof. The top 20 nodes
are labelled 1 through 20 in order of their Betweeness Centrality while the top 12 are
colour coded light green. Essentially, the groups are examples of subgroups in a one-
mode network, in which measurement is based on just a single set of actors (Wasserman
and Faust, 2012), albeit grouped according to their individual attributes of Betweeness
Centrality.
Figure 5.12: Expanded Group of Nodes According to Betweeness Centrality
Meanwhile, the chart in Figure 5.13 reveals that the Red, Dark Green and Green bars
are in the top echelons of nodes with the highest Betweeness Centrality (a total of 23
nodes) while the bulk of the nodes in the entire graph — that is, a total of 70 nodes
represented as Dark Blue bar on the chart — are within the lower range of Betweeness
Centrality. With the highest Betweeness Centrality of 2,494.64 (Colour red on the far
right), the node representing the egocentric network of @Unisouthampton, which is the
official Twitter account of the University of Southampton, has over 40,000 followers.
However, the measure of a node’s Betweeness Centrality is not based on the number of
followers but on the number of shortest paths from all nodes to all other nodes that pass

98 Chapter 5 Research Findings and Analysis
Table 5.8: Top 12 Individual Node Metrics
No. NodeBetweenessCentrality
EigenvectorCentrality
PageRank
ClusteringCoefficient
1 unisouthampton 2494.640 0.038 4.644 0.0922 sotonwsi 522.543 0.037 2.764 0.1983 lescarr 425.512 0.031 2.520 0.1864 ecsuos 349.333 0.028 2.308 0.1915 suukii 325.737 0.019 1.756 0.1656 susanjhalford 206.940 0.029 2.065 0.2277 damewendydbe 179.074 0.028 1.852 0.2848 hughdavis 164.789 0.019 1.538 0.2339 iliadsoton 150.258 0.015 1.646 0.17410 webscidtc 146.866 0.026 1.784 0.26811 richardgomer 134.370 0.14 1.321 0.18012 sotonwais 115.194 0.015 1.176 0.233
through that node (Freeman, 1977). This explains why the node with only 558 followers
(@sotonwsi) has the second highest betweeness centrality (522.543). Although it could
be argued that both @unisouthampton and @sotonwsi are non-personal accounts, it
must be noted that the node with the next highest betweeness centrality of 425.512
(@lescarr) has more follower count (2390) than the previous (@sotonwsi). The top 20
nodes by betweeness centrality can be visualised in the network graph in Figure 5.12
(with each node labelled 1 through 20) while Table 5.8 presents the individual metrics
for 12 of the top 20 nodes (users), according to betweeness centrality, within the network.
The node metric table (Table 5.8) provides another interesting aspect, which is that,
another metric or a combination of metrics may be used depending on the intended
purposes, although we have ranked these 12, out of 20 nodes, according to their scoring
highest in Betweeness Centrality. For example, if the nodes were ranked in accordance
with their Eigenvector Centrality, @susanjhalfod (No.6) would have ranked higher than
@suukii (No.5). Eigenvector is a centrality measure that considers the value of a node,
not in terms of its connections but in terms of the value of centrality of such connections
(Ruhnau, 2000).
5.6.5 Measurement Mechanism for ‘Engaged Workforce’
With reference to our Knowledge Management Value measurement in Formula 5.1, where
KMV = AK × EW (see KM Value in Section 4.3.5), we hereby devise a mechanism
to define the value of an engaged workforce (EW ). We have established that the in-
teractions that create the user network is based on users’ activities in tweeting and/or
mentioning or replying-to another user within their own tweets, thereby creating the
relationships known as Edges in Table 5.7. Each node in the network has been as-
signed to the groups in Table 5.7 based on individual node’s measure of Betweenness
Centrality. Table 5.7 also includes the graph density for each group. A sum of all the

Chapter 5 Research Findings and Analysis 99
Figure 5.13: A Chart of Betweeness Centrality Spread among the 93 Vertices
groups’ graph densities equals 0.59, which can be said to be a network of a little over
medium density. This indicates that users in this network are nearly highly interlinked,
owing that density captures inter-connectivity of individuals in a range between 0 and
1, for low and high density, respectively (Hansen et al., 2010). It should be noted that,
grouping the network users on the basis of node importance (Betweeness Centrality, in
this case) has an effect of bringing the network closer together. This is because a social
network, regardless of its size, is made up small clusters of connected individuals, whose
formation of subgroups within the larger network, results in shorter connections than
the long paths in the larger network (Itai Himelboim et al., 2017). Hence, a higher
network density (of 0.59) than the ordinary network density (of 0.078) calculated for the
entire network graph of 93 vertices before the grouping (see Table 5.6).
Graph density is an indicator of connectedness of a network, given as the number of con-
nections in a graph divided by the maximum number of connections (Lorentzen, 2014).
This connectedness is also a function of the interactions that create the relationships
upon which the network is formed. As such, Itai Himelboim et al. (2017) agree that in-
teraction between individuals lead to shared knowledge which, in turns, leads to further
interaction; they thereby, conclude that the rate of information flow within a network is
a function of its density. We therefore, measure engagement in terms of graph density.
Whatever value we get for AK is either maintained or negated by the value of EW
depending on the spectrum of network density between dense and sparse, respectively.
Hence, Knowledge Management Value (KMV ) is calculated thus:
KMV = 0.56× 0.59 = 0.33 (5.4)
The assumption here is that both measures of actionable knowledge and an engaged
workforce are performed on the same social network as utilised by the same corporate

100 Chapter 5 Research Findings and Analysis
organisation. And, it is worth noting that the measure of an Engaged Workforce (EW )
in terms of the engagement of employees on social media application is underpinned
by the multifarious impact of mobile devices and social applications as found from the
survey questionnaire and its data analysis discussed in Chapter 6.
The Knowledge Management Value (KMV) provides a normalised quantitative measure
in developing a case for return on investments, rather than turning to storytelling and
anecdotal success stories to show the value of their KM investments (Vestal, 2002).
In essence, this could be used as an alternative measure that is closer to the actual
measure of returns on investments , as it is represented in numbers, and not just an
acknowledgement of the presence of some values that cannot be measured. Also, this
method can be used in bench-marking similar KM investments for which the EMSoD
framework is tailored or fully implemented.
This method can be used to compare Knowledge Management values derived from dif-
ferent KM activities/events or expressed in percentage to determine the return on in-
vestments on such activities/events.
5.7 Chapter Summary
This chapter has presented a discussion on the findings and analysis from this research.
With regards to KM value to organisations being at the core of the conceptual frame-
work and the question of how social media can deliver KM value, findings from a study
on Knowledge Discovery, which culminated in the discovery from social media data, of
actionable knowledge to the case study organisation described in Section 5.2.2. Thus,
actionable knowledge is presented as a measure of KM value in so far as the real essence
of knowledge is its actionability, especially when it contributes to the advancement of
a proposed undertaking (Cross and Sproull, 2004). Also in this chapter, findings from
social network analysis were presented concerning the endpoint of an Engaged Work-
force as an intended outcome and second parameter for KM Value which social media
are capable of delivering to corporate organisations. The measurement mechanisms that
result in Knowledge Management Value (KMV ) as a product of actionable knowledge
and engaged workforce has also been presented in this chapter. The next chapter ex-
plores the multifarious impact of mobile devices and social applications on employee
engagement, as found from the analysis of data from the survey questionnaire designed
for this.

Chapter 6
Survey Data Analysis and
Findings
In Section 4.3.1.1, a reference is made to some surveys on the global state of enterprise
mobility. As stated then, the findings from those surveys would have been sufficient
for understanding the current state of enterprise mobility from the perspectives of the
impact of mobile devices and applications on employee engagement, and thereby, knowl-
edge sharing. However, the mobility concentration of those surveys is predominantly
geared towards enterprise mobility strategies that are inclined towards process automa-
tion aimed at operational efficiency. This is the First-Order state of organisational
change in which any derived competitive advantage erodes as soon as competitors adopt
same or similar process automation technology.
Meanwhile, in as much as the enterprise mobility perspective of this research is con-
cerned about such strategies which propel and support the organisation through the
more collaborative, engaging and people-oriented level of organisational change (see
Section 5.2.3), this survey was designed and administered to capture the current state of
such enterprise mobility agenda that facilitate the social interactions that exists within
the organisation. The key findings (see Section 6.5) from this survey provide up-to-date
and representative information on the current state of enterprise mobility in terms of
the mobile devices and social applications enabled by them, which is indicative of their
multifarious impact on employee engagement — a precursor to knowledge sharing — as
expounded with the third extended research question for this work (see Section 1.2.1).
This section presents analysis of the data gathered from the survey questionnaire.
101

102 Chapter 6 Survey Data Analysis and Findings
6.1 The Survey Instrument
In studying the impacts of mobile devices and applications on employee engagement and
thus, finding an answer to the third Extended Research Question (ERQ 3) presented in
this research, this survey focuses on mobile applications and devices that facilitate social
interactions among employees, from which organisational knowledge could be gained.
Table 6.1: Survey Questionnaire Response and Completion Rates
Attempted CompletedResponse
RateCompletion
Rate
PopulationSize
6000
ConfidenceLevel
95%
Margin ofError
5%
Sample Size 362 220 187 52% 85%
To this effect, a survey questionnaire was designed and administered as survey instru-
ment, with the aim of understanding the impact of these mobile devices and applications
on social interaction, employee engagement and knowledge sharing within an estimated
population of about 6,000 staff members (University of Southampton).
6.2 Framing the Survey Questions
All the questions in the questionnaire are designed as build up around the two main
conjectures explored in the survey:
1. That employees’ engagement is impacted by the use of mobile devices.
2. That ownership (BYOD/COPE) of the device used at/for work has an impact on
employee satisfaction by which engagement is enhanced.
The questions are presented in form of likert scale type, multiple choice and open-ended
questions requiring free text inputs. “A likert scale is a psychometric scale that has
multiple categories from which respondents choose to indicate their opinions, attitudes,
or feelings about a particular issue” (Beglar and Nemoto, 2014). One of the advantages
of the likert-scale type of question is in the freedom it allows participants to choose to
be neutral, rather than being forced to express a binary opinion (Smart Survey, 2017).
Multiple choice — sometimes called fixed choice — present the respondent with a number
of options to choose from, and it is widely used because of its reliability and consistency

Chapter 6 Survey Data Analysis and Findings 103
(Zafar Iqbal et al., 2017). These were even made more reliable by randomising the
multiple choice options in order to prevent the order-effect bias. This is based on the
assumption that the “relative position of an item in an inventory of questions or stimuli
may uniquely influence the way in which a respondent reacts to the item” (Perreault
and Jr., 1975) .
Although it can be more difficult and expensive to code and analyse, open-ended question
enables the survey to measure accurately, the opinions of respondents with regards to
their important concerns about the issue (Geer, 1991).
When survey participants are completing the questionnaire, the paths of questions pre-
sented to them are based on previous choices. For example, when asked whether partici-
pants own the device they use most at/for work, or if it is provided by their organisation.
If a respondent chose “I use my own device”, then they are presented with the path of
questions that help in establishing their motivations and willingness to bring their own
device to work (BYOD). Contrarily, If a respondent chose “I use company’s device”,
they are presented with the path of questions which help in understanding how employ-
ees would feel about the synergistic use of work devices (smartphone, tablets, etc) for
personal tasks. An example of such question leading on from this path is:
“In addition to using your own device for work purposes, to what personal
use would you normally put your device?”
This question checks against another question which tries to establish the personal us-
age of employees’ own devices. Some companies provide mobile devices without any
social capability but just operational applications. If the mobile device in use lacks
social/sharing capabilities, it would be irrelevant to knowledge sharing. Granted that
not all mobile devices may be relevant to knowledge sharing, the thesis in this survey
is for operational mobile devices to be powered with social/sharing capability so as to
enrich the knowledge sharing experience that potentially generates enormous amount of
data from which meaningful insights could be mined for the organisation’s competitive
advantage.
6.3 Recruiting Survey Participants
Participants were recruited by email communication (email sample in Appendix G)
targeted at the two largest Faculties in the University. These are the Faculty of Human,
Social and Mathematical Sciences as well as the Faculty of Engineering and Physical
Sciences, which is the parent faculty of the School of Electronics and Computer Sciences,
from which this research originated. A combination of the two faculties is a good blend
that represents the wider workforce in the population as they are comprised of employees

104 Chapter 6 Survey Data Analysis and Findings
Figure 6.1: Full/Part time Workers according to Gender
from the Humanities, Social Sciences, Computer Science, Mathematics and Engineering.
This is also a good representation of the middle class, which the United Kingdom has
become more of, since the turn of the century (Arnett, 2016). It can also be confidently
suggested that the sample size is a true representation of the University, having used
the industry standard of 95% Confidence Level (see Table 6.1).
The emails were aimed at recruiting a minimum of 362 participants for the survey. This
number is representative of the 6000 staff at the University of Southampton, as suggested
by an online sample size calculator on SurveyMonkey.com. This is based on the Central
Limit Theorem, which postulates that inferences can be made about a population based
on a sufficient size of randomly selected samples from the population (Kwak and Kim,
2017). Out of the total emails sent, 220 recipients responded by, at least, attempting the
survey, resulting in a response rate of 52% (220/362), as shown in Table 6.1. Out of the
52% who responded, 85% did complete the survey. An example of demographic findings
that may not be immediately overtly relevant to the questions at hand is that there are
more male participants than female who work full time, as indicated in Figure 6.1 and
Table 6.2.
A sample of the survey questionnaire is available in Appendix A.

Chapter 6 Survey Data Analysis and Findings 105
Table 6.2: Number of Part-time/Full Time Workers according to Gender
Work Part -Time or Full-Time? * Gender Crosstabulation
Gender Total
Female MalePrefer not
to say
Work Part -Timeor Full-Time?
Part-time 21 18 1 40
Full-time 51 76 5 132
unlabelled 0 1 0 1
Total 72 95 6 173
6.4 Survey Questions Analysis and Discussions
The survey data analysis are categorised and discussed by a list of Survey Questions
below while the key findings are summarised in Section 6.5 :
6.4.1 Survey Question 1
How often do you use the following devices for/at work?
This question was set to understand the frequency at which each of the devices high-
lighted are being used at/for work. Table 6.3 and Figure 6.2 are indications of how
the participants responded. It is worth noting that some of the response options in the
survey questionnaire (see Appendix A) have been bundled together for ease of reporting
as presented in Table 6.3. These are “Once a day/Several times a day” and “Once a
week/Several times a week” bundled together to become “At least once a day” and “At
least once a week”, respectively.
Table 6.3: Device Usage Frequency Table
At LeastOnce A Day
At LeastOnce A Week
Once AMonth
Never
Pen & Paper 162 31 4 1
Tablets 44 31 19 100
Smartphones 151 20 4 22
Laptop PC 132 29 16 20
Desktop PC 116 24 15 42
Even though a number of these groups indicate their use of mobile devices (smart phones
and tablets) as well as Pen and Paper, with varying degree of frequency, they do not
really enjoy using them for work as much as they do the Desktop and Laptop computers.
This is inferred from the second question below.

106 Chapter 6 Survey Data Analysis and Findings
Figure 6.2: Frequency of Device Usage
6.4.2 Survey Question 2
Please select one of them that you enjoy using most at/for work
This question tests if the device a participants uses most at/for work is the one most
satisfied with, or if the device most satisfied with is different from the one being used
most at/for work. It emerged however, that the devices most frequently used at/for
work is not the ones most satisfied with. As can be seen in Figure 6.3, a total 163 out
of 198 enjoy using either the Laptop PC (90) or the Desktop PC (73). This represents
a staggering 85% (approximately) of respondents who have a perception of satisfaction
with their use of Laptop and Desktop PC over the mobile devices (smart phones, tablets).
In essence, even though a number of these group indicate their use of mobile devices
(smart phones and tablets) as well as Pen and Paper, with varying degree of frequency,
they do not really enjoy using them for/at work as much as they do the Desktop and
Laptop computers. Considering the much higher frequency of use of the “Pen and
Paper”, its proportionally lower indication of perceived satisfaction raises the question
of whether the idea of a “paperless office” (Milliken, 2014) remains a utopian dream.
So, why do the respondents enjoy the devices they each enjoy using most? This leads
to the next survey question.

Chapter 6 Survey Data Analysis and Findings 107
Figure 6.3: Device Usage and Perceived Satisfaction
6.4.3 Survey Question 3
Please explain why you enjoy the device you enjoy using most at/for
work
In understanding why respondents enjoy the device they enjoy using most at/for work,
this question is cross-tabulated with the question of “which of the devices do you enjoy
using most at work” (Question No. 2 above).
There are as many different reasons as there are participants who responded to this
question and the entire reasons provided by each participant against their preferred
devices are presented in Appendix B. Meanwhile, seeing that “Laptop” and “Desktop”
receive the highest number of responses at 90 and 73, respectively as shown in Figure
Figure 6.3, we focus on these two devices to gain some insights into the reasons why
participants enjoy them most at/for work.
Using NVivo, a “powerful software for qualitative data analysis” (QSR International,
nd), the entire free text responses of participants were coded in vivo, resulting in 25
nodes for laptop and 40 nodes for desktop as shown in Figures 6.4 and 6.5, respectively.
According to Given (2008), “In vivo coding is the practice of assigning a label to a
section of data, such as an interview transcript, using a word or short phrase taken from
that section of the data”.

108 Chapter 6 Survey Data Analysis and Findings
Figure 6.4: Coded Nodes for Survey Participants’ Reasons for Laptop Preference.

Chapter 6 Survey Data Analysis and Findings 109
Figure 6.5: Coded Nodes for Survey Participants’ Reasons for Desktop Preference.
The entire reasons provided by each participant against their preferred devices are pre-
sented in Appendix B. Meanwhile, below are some of the comments by survey partici-
pants as reasons why they enjoy using laptop/desktop at/for work:
• “Means I can be sat at my desk with two large monitor screens to view”
• “Because it is comfortable to use and the screen is very wide and better
for the eyes”
• “It provides the easiest access for the greatest range of information:
Larger screen than a mobile easier to use with finger presses a hard
drive to save research papers documents my work MATLAB etc.”
• “It’s practical. Tablets and Mobile devices could make difficult the pro-
cess of navigation and browsing.”

110 Chapter 6 Survey Data Analysis and Findings
A thematic analysis of nodes compared by number of coded references reveals portable,
easy, provides many functions, convenience and larger screen than a mobile as the most
prevalent themes that run across all participants’ free-text reasons for enjoying the device
they enjoy using most at/for work. The sunburst image in Figure 6.6 is NVivo’s way of
visualising the most prevalent themes that run across the entire coded nodes based on
their references. The only other alternative is a tabular grid, which is not aggregated
nor visually appealing.
Conven
ience
Larger
scree
nthanamobile
easyfunc6onal
portab
le
providesmanyfunc6ons
Figure 6.6: Prevalent Themes across Coded Nodes.
Meanwhile, Laptop and Desktop are mostly referenced by the above 5 prevalent themes
with 68 and 50 code references, respectively, while Tablet, Smartphone, Pen and Paper
are the least referenced with 6, 6, and 5 code references, respectively. The code reference
of the prevalent themes are presented in Appendix C. The prevalent themes represent
unique features inhenrent in laptops and desktops, making them more adaptible to/for
work purposes than mobile devices.
With mobile devices (smart-phones and tablet) not being used for/at work as much as
desktop/laptop, there is a need for new emphasis on the potential of mobile devices for
social transformation of the workplace.
6.4.4 Survey Question 4
How would you agree/disagree with the following statements regarding
the device you enjoy using most at work?
This is a closed question that serves to lend credence to the veracity of the open-ended
question that produced the results above. Survey participants were asked to agree/dis-
agree with the following statements:

Chapter 6 Survey Data Analysis and Findings 111
1. It helps me do my job most effectively
2. It saves me time and hassles
3. It enables me to perform multiple tasks at the same time
4. I do not have to be at a desk or an office
5. I just like fiddling with gadgets
6. I prefer pen, paper and traditional desktop computers
Each of the above statements is cross-tabulated with question number 2 above, which
asked participants to select which of the devices they enjoy using most, which is an
indication of how satisfied they are with the device. The entire analysis of each of the
participant’s level of agreement with statements above against participants’ preferred
device is presented in Appendix D.
Figure 6.7: Respondents level of agreement with Statement 3
Meanwhile, while some of the statements are nominal, this research focuses on findings
from statements number 3 and 4 as presented in Figure 6.7 and Figure 6.8, respectively.

112 Chapter 6 Survey Data Analysis and Findings
As can be seen in Figure 6.7, more respondents who chose the laptop and the desktop
device as their most enjoyed devices, do strongly agree that their chosen devices (Laptop
and/or desktops) enable them to perform multiple tasks at a time. It is not surprising
that multi-tasking can be more realistic on laptop/desktop than on mobile devices, as
evident in the prevalent themes that run across the reasons advanced for enjoying theses
devices more (see Figure 6.6. However, only laptop users — and a higher proportion of
tablet users — agree more than users of any other device that they do not have to be
at a desk or an office (Statement 4). Moreover, it should not be surprising that more
users of Desktop strongly disagree with the statement, as it would be necessary to be at
a desk and/or at an office, to use a desktop PC.
Figure 6.8: Respondents level of agreement with Statement 4
6.4.5 Survey Question 5
Device Ownership and Usage Satisfaction
In this subsection, we examined the effects of the ownership of devices — company
owned or employee owned — on the satisfaction that employees derive from the devices.

Chapter 6 Survey Data Analysis and Findings 113
Based on the question of which devices the survey participants enjoy using most at/for
work, we asked if these devices are company-owned or employee-owned. As indicated
in Table 6.4 and Figure 6.9, 38% of respondents say they use their own devices while
about 62% say they use the company’s devices
Table 6.4: Participants’ Use of their Own Device or Company’s Device
Own Device or Company’s Device?
Frequency PercentValidPercent
CumulativePercent
Valid Own Device 67 33.5 38.1 38.1
Company’s Device 109 54.5 61.9 100.0
Total 176 88.0 100.0
Missing System 24 12.0
Total 200 100.0
Figure 6.9: A Chart of Participants’ Responses to “Own or Company’s Device”?
How can we tell whether the 38% derive satisfaction from the use of their own devices or
the 62% from using the company’s devices? Having asked which device each participant
enjoy using most (see Figure 6.3), a cross examination of this question with the question
of ownership of the device, is presented in Table 6.5 and Figure 6.10
As indicated in Table 6.5 and Figure 6.10, Laptop and Desktop count higher than Pen
& Paper, Tablet & Smartphone as devices the survey participants enjoy using most

114 Chapter 6 Survey Data Analysis and Findings
Table 6.5: Device Ownership and Employee Usage Satisfaction
Which of them do you enjoy using most at/for work? *Own Device or Company’s Device? Crosstabulation
Own device orcompany’s device
OwnDevice
Company’sDevice
Total
Which of themdo you enjoyusing mostat/for work?
Pen & Paper 6 9 15
Tablet &Smartphone
12 6 18
Laptop 36 44 80Desktop 12 49 61
Total 66 108 174
Figure 6.10: Device Ownership and Usage Satisfaction

Chapter 6 Survey Data Analysis and Findings 115
at/for work; and, more of these devices (Laptop and Desktop) are company’s devices
(Green bar) as opposed to being employees’ own devices (Blue bar). Also, as can be
seen in Figure 6.10, not as many of the respondents enjoy using mobile devices (tablets
and smartphones) at/for work as do laptops and desktops. This indicates that tablets
and smartphones are the least enjoyed devices at/for work by employees, suggesting
that these devices are not as popular for work purposes as their laptop and desktop
counterparts.
But this notwithstanding, a good number of those who say they enjoy tablets and
smartphones at/for work, responded that they use their own devices as opposed to
company’s devices.
Given the above, we postulate therefore, that usage satisfaction with a device increases
with more employees using their own device. This is also in consonance with some
schools of thoughts that the BYOD policy increases employees’ satisfaction. However,
both Correlations and Chi-Square tests reveal a weak positive correlation, as indicated
by the p-value of .200 Asymptotic Significance value of .001 in Tables 6.7 and 6.6,
respectively. In essence, in as much as there is not a strong enough evidence to suggest
a linear relationship between the ownership of devices and the satisfaction that employees
derive from using those devices, there would be no need to explore a causal relationship
between them, albeit, the statistical significance of the weak positive correlations must
be acknowledged.
Table 6.6: Chi-Square Test Results based onDevice Ownership and Usage Satisfaction (Figure 6.10)
Chi-Square Tests
Value dfAsymptoticSignificance(2-sided)
Pearson Chi-Square 16.676a 3 .001
Likelihood Ratio 17.279 3 .001
Linear-by-Linear Association 8.771 1 .003
N of Valid Cases 174
a 0 cells (.0%) have expected count less than 5.The minimum expected count is 5.69.
Since more of the few participants who enjoy tablets and smartphones more, do use their
own devices (see Figure 6.10), we can assume that they enjoy using these devices at work
and not necessarily all for work. What uses if not for work? In the next survey question,
we explore further use cases for the company’s device and explore their convergence with
the use of employee’s own devices at work

116 Chapter 6 Survey Data Analysis and Findings
Table 6.7: Correlation Between Device and Usage Satisfaction
Correlations
Which of themyou enjoy usingmost at/for work?
Own Deviceor Company’sDevice?
Which of themyou enjoy usingmost at/for work?
Pearson Correlation 1 .200**
Sig. (2-tailed) .008N 183 174
Own Deviceor Company’sDevice?
Pearson Correlation .200** 1
Sig. (2-tailed) .008N 174 176
** Correlation is significant at the 0.01 level (2-tailed).
6.4.6 Survey Question 6
In addition to work related use, how often do you use the company’s device
for the following?:
1. To keep in touch with friends and family.
2. To keep in touch with work colleagues
3. For personal organisation/admin and time management
4. For games, entertainment and relaxation
5. To keep updated with general news and current affairs
6. To keep updated with work related news and gossip.
The analysis of responses for this question is presented in Appendix E. Meanwhile, it is
worth noting that a vast majority of participants responded that they rarely or never
(Not at all) use the company’s device to keep in touch with friends and family while
the reverse is the case for keeping in touch with work colleagues as, a higher number of
respondents say that they quite often or fairly often use the devices to keep in touch
with work colleagues, as shown in Figures 6.11 and 6.12.
The common denominator between keeping in touch with friends and family on one
hand, and/or keeping in touch with work colleagues on the other hand, is the company’s
device. Whether with friends and family or with work colleagues, social interaction is
an innate human need which, when satisfied, can lead to productivity (Wilcock, 1993).
It is not surprising therefore, that an approximately 44% of participants strongly agree

Chapter 6 Survey Data Analysis and Findings 117
Figure 6.11: Using Company’s Device to Keep in touch with Friends and Family
Figure 6.12: Using Company’s Device to Keep in touch with Work Colleagues
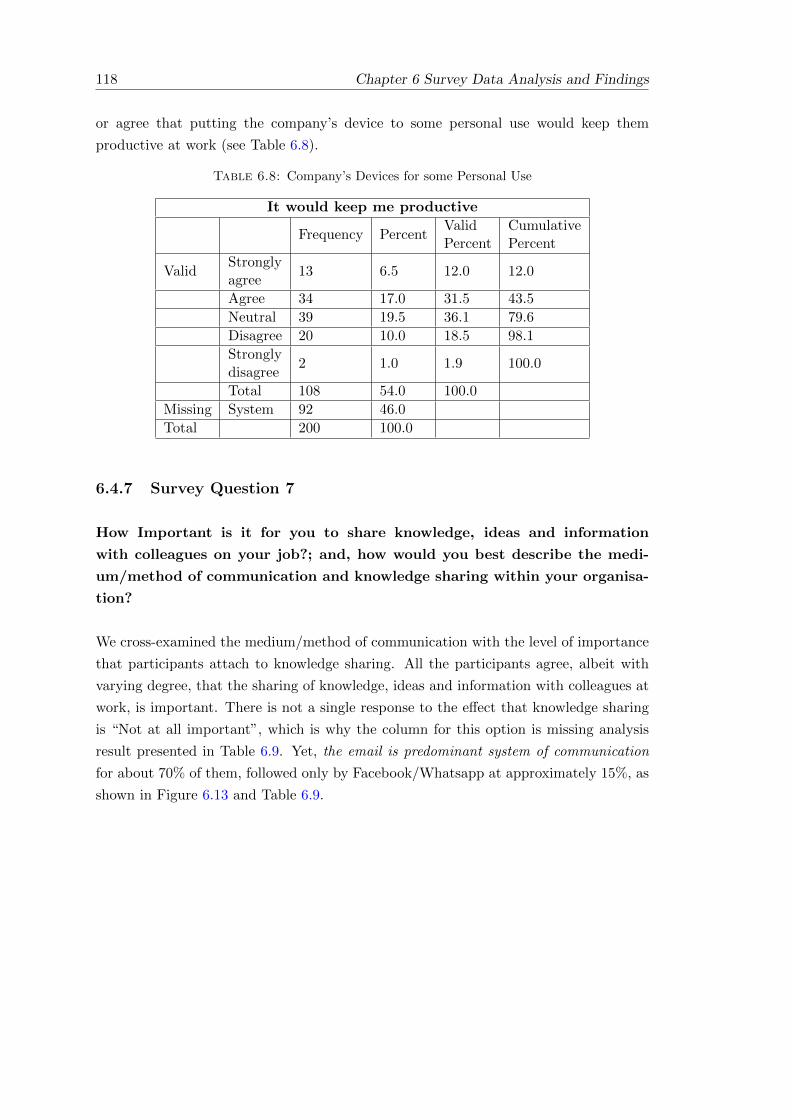
118 Chapter 6 Survey Data Analysis and Findings
or agree that putting the company’s device to some personal use would keep them
productive at work (see Table 6.8).
Table 6.8: Company’s Devices for some Personal Use
It would keep me productive
Frequency PercentValidPercent
CumulativePercent
ValidStronglyagree
13 6.5 12.0 12.0
Agree 34 17.0 31.5 43.5
Neutral 39 19.5 36.1 79.6
Disagree 20 10.0 18.5 98.1
Stronglydisagree
2 1.0 1.9 100.0
Total 108 54.0 100.0
Missing System 92 46.0
Total 200 100.0
6.4.7 Survey Question 7
How Important is it for you to share knowledge, ideas and information
with colleagues on your job?; and, how would you best describe the medi-
um/method of communication and knowledge sharing within your organisa-
tion?
We cross-examined the medium/method of communication with the level of importance
that participants attach to knowledge sharing. All the participants agree, albeit with
varying degree, that the sharing of knowledge, ideas and information with colleagues at
work, is important. There is not a single response to the effect that knowledge sharing
is “Not at all important”, which is why the column for this option is missing analysis
result presented in Table 6.9. Yet, the email is predominant system of communication
for about 70% of them, followed only by Facebook/Whatsapp at approximately 15%, as
shown in Figure 6.13 and Table 6.9.

Chapter 6 Survey Data Analysis and Findings 119
Figure 6.13: Level of Importance Attached to Knowledge Sharing

120
Chap
ter6Survey
Data
Analy
sisan
dFindings
Table 6.9: Level of importance attached to Knowledge sharing

Chapter 6 Survey Data Analysis and Findings 121
6.4.8 Survey Question 8
How often do you use or access each of the following applications from
a mobile device (Smartphone, tablet, etc.)
The charts in Figures 6.14 to 6.20 are based on the frequency table presented in Appendix
F. It is curious to find that a vast majority of participants have never used Twitter/Yam-
mer, Snapchat and Google+ from a mobile device. Snapchat is understandable as it is
not yet as popular as the other social applications. However, the Email is more often
used on mobile devices than the other applications, lending credence to the assertion
that the Email as still very important and the predominant system of communication,
as shown in Figure 6.13 and Table 6.9, respectively.
Meanwhile, a total of 102 out of 176 respondents (51%) claimed that they have never
or rarely used Twitter/Yammer from a mobile device; whereas, for approximately 96%
and 69% of respondents, Email and Facebook are used at least once a week (see Figures
6.14, 6.15 and 6.19, respectively; Appendix F).
Juxtaposed with the findings in Section 6.4.6, wherein, a higher number of respondents
say that they quite often or fairly often use the devices to keep in touch with work
colleagues than with friends and family, it can be inferred that the social application
most commonly used to keep in touch with work colleagues is Email and Facebook.
Also, as established in Section 6.4.5 that the linear relationship that exists between the
ownership of devices and the usage satisfaction is not strong enough to suggest a causal
relationship, keeping in touch with work colleagues is a constant factor, regardless of
whether employees bring their own devices or use the company-provided devices.
6.5 Key Findings from Survey Analysis
The third extended research question is aimed at studying the impact of mobile devices
and mobile (social) applications on employee engagement. The multifarious impact has
been extensively discussed in the preceding section and is hereby summarised as key
findings from the survey analysis:
1. Email and Facebook are the most commonly used social applications for keeping
in touch with work colleagues.
2. Electronic mailing (e-mail) is still the medium/method of communication mostly
used for work-related communication within the University of Southampton, as
indicated by the survey data.

122 Chapter 6 Survey Data Analysis and Findings
Figure 6.14: Usage Frequency for Twitter/Yammer
Figure 6.15: Usage Frequency for Facebook

Chapter 6 Survey Data Analysis and Findings 123
Figure 6.16: Usage Frequency for Whatsapp
Figure 6.17: Usage Frequency for Snapchat

124 Chapter 6 Survey Data Analysis and Findings
Figure 6.18: Usage Frequency for Skype
Figure 6.19: Usage Frequency for Email

Chapter 6 Survey Data Analysis and Findings 125
Figure 6.20: Usage Frequency for Google+
3. Employees are not always as happy about using their own devices at/for work as
they are about using the company-provided devices.
4. The laptop and desktop are still the most widely enjoyed devices at/for work than
mobile devices.
5. There is not a strong enough linear relationship to suggest causality between own-
ership of device (BYOD/COPE) and the satisfaction employees derive from using
them at/for work.
6.6 A Review of Key Findings from Survey
In spite of the disruptive impact of social media on the telephone, email, instant mes-
saging and event planning (Christensen, 1997), the email is still the most preferred and
mostly used method of communication within one corporate organisation, as indicated
by the survey data. In spite of the question of generalisability of a single case study,
which critics say may be lacking, a single critical case like this could be generalised since
the data and findings are replicable in similar organisation sharing the same characteris-
tics, as discussed in Chapter 3.2.5. Moreover, it is discussed in Section 6.3, how that the
broad selection of survey participants represents the University (of Southampton), and
how by virtue of being a well informed and educated target population, they represent

126 Chapter 6 Survey Data Analysis and Findings
the middle class by which the United Kingdom has been largely defined since the turn of
the century. Therefore, what is true for this study is very likely to be true if the survey
was administered across the United Kingdom.
In essence, social media, like Twitter and Facebook, have not been able to disruptively
displace the email, which is perhaps, the most persistent digital communication tech-
nology being utilised by corporate organisations. Rather, it can be observed that social
media have helped in strengthening and sustaining the use and relevance of email. This
is because, for example, an email address is required for signing up to virtually every
social media account, much as one is almost always used in the verification of indi-
vidual and/or corporate profiles. However, the ready availability and easy accessibility
of social media applications on mobile devices, like tablets and smart phones, provide
an added layer of engagement within corporate employees than the email alone could
have provided. This is a significant impact, and one that stretches the displacement of
letter-writing beyond the ordinary technological disruption of the postal and greeting
card industries (Christensen, 1997), occasioned by the advent of the email. The signifi-
cance of this impact is manifest in the one-stop integrated communication solutions —
for instant messaging, telephoning, event planning, emailing, group/forum discussion,
private messaging, etc — provided by platforms like Whatsapp, Facebook, etc.
Moreover, the realisation that the laptop and desktop are still the most widely enjoyed
devices at/for work than mobile devices is a corroboration of the assertion that the fa-
cilitation of employee engagement is not entirely brought about by mobile devices but
by the social applications enabled by them. Laptops and desktops facilitate employees’
operational efficiency much as several hand-held devices like the DIAD and FEDEX
Mobile Solutions (see Section 4.3.1.1). However, these devices did not facilitate social
interaction nor did they motivate employees to engage until the advent of the smart-
phones and tablets, which power social applications by which social interactions and
employee engagement are amplified.
Although it is a known downside of surveys that they can only report relationship be-
tween variables that are found and not able to claim cause and effect (Rumsey, 2010,
p.6), the lack of a strong enough linear relationship suggesting causality between own-
ership of device (BYOD/COPE) and the satisfaction employees derive from using them
at/for work, is an indication of something significant. That is, enterprise mobility is no
longer — and should no longer be seen — in terms of the ordinary ownership of mobile
technology devices but chiefly in terms of the mobile social applications powered by the
devices.
Chapter 6 Survey Data Analysis and Findings 127
6.7 Chapter Summary
This chapter has presented the frequency at which survey participants use the devices
in question. It also reveals which of the devices command the most satisfaction of
employees, with a thematic analysis of the reasons why survey participants enjoy their
preferred devices. The major questions from the survey questionnaire and their findings
and analysis have been extensively discussed in this chapter. Given that the overall
analysis indicates that the laptop and the desktop command the most satisfaction for
usage at/for work, employee engagement over mobile devices like tablets and smart
phones has an indication for social application upon which this assertion is based:
the facilitation of employee engagement is not as much a function of the
mobile devices as it is of the social applications powered by them, and by
which social interactions are facilitated.


Chapter 7
Conclusion and
Recommendations
7.1 Conclusion
This research is predicated upon the disruption to organisational structures and hierar-
chies brought about by the emergence of social media platforms like Twitter. This has
created perceived tension between knowledge management and social media (Ford and
Mason, 2013a). Owing to its lack of maturity and a general state of apathy (Griffiths
and Moon, 2011), KM has to reposition itself and deliver measurable values (Griffiths
et al., 2015, p.39), if it is to remain relevant in organisational strategic planning and
positioning.
Also, as hinted earlier in Chapter 2.3, page 14, the Global Knowledge Research Network
(GKRN) conducted a global study to identify future research need in Knowledge Man-
agement. The study received contributions from 222 Knowledge Management experts
from 38 countries comprising of diverse nationalities, industries, government, NGOs,
and academic disciplines. The overall results are, as reported in Advances in Knowledge
Management — A publication that celebrates 20 years of KM research and practice
(Bolisani & Handzic, 2015), that:
1. Future research in knowledge management needs to demonstrate the value contri-
bution of knowledge management.
2. Research should focus more on human and social factor and explore knowledge
management as an organisational capability.
3. The core concepts of knowledge should be revisited to improve the understanding.
4. More critical research approaches should be employed...
129

130 Chapter 7 Conclusion and Recommendations
Moreover, KMWorld — the world’s leading knowledge management event — holds in
Washington DC between 6th and 9th of November. The theme (People Power, thinking
and tech) is aimed at exploring how KM can deliver value to restore organisations’ hope
in KM. The theme also focuses on the fact that people are at the core of knowledge
sharing and key to high functioning organisations (Information Today, 2017).
In view of this corroborative need for the value proposition of knowledge management,
this research sought to explore how social media platforms can deliver knowledge man-
agement value to corporate organisations. In its exploration, the research specifically
sought to address the following questions:
1. What is an appropriate social framework for delivering KM values?
2. What are the intended outcomes from social media by which KM values can be
measured?
3. What are the impacts of mobile devices and social applications on employee en-
gagement?
Presented in this thesis is Enterprise Mobility and Social Data (EMSoD) — an ap-
propriate conceptual framework, which mediates between KM and social media, as well
as places KM value at its core. By considering social media data within a Managed
Platform through to the delivery of measurable KM value, this framework has helped
in answering the overarching formative research question of how social media platforms
like Twitter can deliver measurable values to corporate organisation. This social frame-
work is not only appropriate for delivering KM value, it also encompasses the intended
outcomes from social media by which KM values can be measured.
The intended outcomes from social media identified in this research are the two param-
eters that have also served as measures of the KM value delivered: (i) the discovery of
actionable knowledge from social data, as well as, (ii) the determination and facilitation
of employee engagement.
As the real essence of knowledge is its actionability, especially when it contributes to the
advancement of a proposed undertaking (Cross and Sproull, 2004), each of the knowl-
edge items discovered from the Twitter data used for the case study investigation in this
research, is capable of providing significant insights that informs decision making, which
impacts company’s proposed undertakings at one point or the other. Some significant
business decision by the case study organisation was informed by the insights gained
through this research. However, the main objective of this research is the delivery of
measurable KM value to corporate organisations, which the EMSoD social framework
helps to deliver. Therefore, this research has devised a mechanism for measuring action-
able knowledge as one parameter of KM value. The mechanism devised for measuring

Chapter 7 Conclusion and Recommendations 131
actionable knowledge in this research is ordinarily sufficient in itself as a measure of KM
value derived from such insights from social media data. Nevertheless, the EMSoD
social framework — and the KM value it delivers to corporate organisations — is fur-
ther strengthened by its second parameter of KM value, which is employee engagement.
The measure of KM value is made of both parameters, as depicted in Equation 5.1
(KMV = AK × EW ).
7.2 Research Thesis Contribution
The unique contribution of this research, with its EMSoD framework, is not only in its
capability for exploiting social media in delivering actionable knowledge and facilitating
employee engagement within a corporate organisation. It is also in the measurement
mechanisms devised for these deliverables as measures of Knowledge Management value.
Although, as hinted earlier, many organisations have turned to storytelling and anecdotal
success stories to show the value of their KM investments, there is an increasing need
for businesses to show the business value of KM, in terms of normalised quantitative
measures, in developing a case for Return on Investments (Vestal, 2002). This is what
business managers and accountants, whose perception of realities is largely in terms of
numbers, are looking for when they criticise KM for a want of measurable values.
In essence, the EMSoD social framework proposed in this research does not only deliver
KM value but also proffers a solution for the measurement. This is an important con-
tribution, and the first of its kind that seeks to satisfy both academic and management
concerns, given that the academic is more concerned with the validity and generalisabil-
ity of measures beyond the original context of a research question. The manager, on
the other hand, is more than willing to use a befitting measure if it can quickly provide
useful information (Melnyk et al., 2004).
7.3 Discussion and Recommendations
From an inductive point of view, a mixed method approach of triangulation was adopted
throughout the research, and in particular, a case study methodology was used in carry-
ing out an investigation that demonstrates the discovery of actionable knowledge from
social media data. From the literature as reviewed in Chapter 2, and extensively cited
in the conceptual framework in Chapter 4, as well as the findings from the Knowledge
Discovery from Social Media Data as presented in Section 5.2, there is evidence that
organisations are now paying more attention to using current and emerging mobile Infor-
mation Technologies for their operational efficiency and strategic sustainability. They
are also concerned about how to utilise both their own primary and secondary data,
coupled with other external data, for strategic competitive advantage. It is observed,
132 Chapter 7 Conclusion and Recommendations
however, that many organisational implementation of these technologies exists only at
the first-order state (automation) of organisational change, which offers operational ef-
ficiency but not competitive and strategic advantage. This is the state where the case
study organisation studied in this research exists. This also represents the current (2016)
Enterprise Mobility Exchange (2016) as highlighted in Section 4.3.1.1.
Meanwhile, merely automating with mobile devices does not warrant the business jus-
tification for an enterprise mobility investment. If organisations should stop at this
first-order level of organisational change, the return on investment on such technological
implementation, if any measurable returns, will sooner than later erode. This brings
Knowledge Management back to square one where senior management cast an aspersion
on KM for want of valuable Return on Investment, having been oversold by consultants
in the 1990s. For organisations to derive value from KM efforts again, this research
recommends that organisations should focus on the perceived knowledge satisfaction
(Becerra-Fernandez and Rajiv, 2001), which is offered by the intended outcomes of ac-
tionable knowledge and employee engagement. Wherever there is a need for businesses
to show the business value of KM in terms of normalised quantitative measures in de-
veloping a case for Return on Investments (Vestal, 2002), the measurement mechanism
(see Chapter 5.1) devised in this research is recommended.
Moreover, essentially, this research conclusively asserts that the EMSoD framework
and the measurement mechanism for KM value are possible solutions to the image
problems suffered by KM and its indictment for lack of measurable values. The above
recommendations are therefore, aimed at propelling and supporting the organisation
through the more collaborative, engaging and people-oriented level of organisational
change - Informate (Section 5.2.3, Item No. 2).
7.4 Assumptions and Limitations
It is generally assumed in this research that corporate organisations would use the public
micro-blogging platform, Twitter, as a tool for social interaction between their employ-
ees. Twitter is essentially a public platform, except where the user network is explicitly
declared private, precluding non-employees from joining or following the network. The
social network and knowledge discovery in this research is based on the assumptions
that any such case of Twitter being studied is based on a public Twitter network. Also,
a case study organisation is studied in demonstrating the discovery of actionable knowl-
edge from Twitter while the University of Southampton’s Twitter account is studied in
demonstrating how social network facilitates employee engagement. In the measurement
of KM value, this research operates with the assumption that both corporate entities are
one. Hence the multiplication of actionable knowledge by engaged workforce in deriving
KM value.

Chapter 7 Conclusion and Recommendations 133
Meanwhile, the above assumption that both corporate entities are one, arouse out of the
limitation of the research. The research is limited by the challenges of getting corporate
organisations to release their enterprise social data from enterprise social blogging plat-
forms like Yammer, for example. Coupled with this is the challenge of obtaining survey
respondents from corporate organisations. These are due to management bureaucracies
and reluctance borne out of concern for the privacy and security of their employee and
their corporate images. Moreover, the process of obtaining ethical approval for external
data is more stringent than the limited time scope of the PhD program. However, in
accordance with feedback and foresight from the course of supervision for this research,
these challenges were circumvented by taking to public Twitter and seeking to recruit
survey participants from within the University.
7.5 Twitter versus Email — A Caveat
It has been asserted how social media platforms like Twitter breaks the hierarchical
structure, creating a lateral flow of information, which enhances the ordinary social
interaction within the rank and file of the organisation.
However, one of the key findings of a survey conducted in this research is that Electronic
mailing (e-mail) is still the medium/method of communication mostly used for work-
related communication within the University of Southampton, as indicated by the survey
data (see Chapter 6.5). It is established in Chapter 3.2.5 that a proposition that is valid
for critical case study like this may be valid for many such cases. This means that
the email may as well be the mostly used medium/method of work-related (formal)
communication within many Universities and/or many organisations across the United
Kingdom.
Nonetheless, whereas conversations over Twitter may be likened to the water-cooler
moments that may be said to have no cost on employee productivity, the cost of email
on employee productivity in terms of the time spent in answering and recovering from
email interruptions, has been identified by Jackson et al. (2001), who conclude that
“majority of email users answer the email as quickly as they answer the telephone”.
The thesis in this research is not about the prevalent formal medium/method of com-
munication like the email, but about the ordinary social interaction facilitated by social
media platforms like Twitter. These are the interactions that create an engaging envi-
ronment for the sharing of tacit knowledge, which has been one of the major challenges of
knowledge management. This is because of the difficulty in formalising and articulating
tacit knowledge, being an intrinsic possession of the individuals.
Unlike explicit knowledge that could be transmitted around by the email, for example,
and can also be documented in organisational policies and procedures, process maps,

134 Chapter 7 Conclusion and Recommendations
manuals, etc., tacit knowledge exists in the subconscious of the employees, who may
intuitively apply such knowledge in enhancing their performance on the job. They may
also express their tacit knowledge informally at the spur of the moment during social
interactions with colleagues on social media like Twitter.
Capturing such employees’ — and/or customer’s — intuitiveness and innermost insights,
and converting them into explicitly storable, retrievable and actionable pieces of knowl-
edge that are of value and propel the organisation’s competitive advantage, is one of the
main thrusts of this research.
7.6 Future Work
7.6.1 Further Insights from additional Social Media Platforms
The research limitations identified in Section 7.4 provide an opportunity for further
research into the extent to which corporate organisations can derive further valuable
insights, in addition to actionable knowledge and employee engagement, from public
and/or private social data gathered over not only Twitter but also any or a combination
of Whatsapp, Facebook, emails etc. Such further insights could include:
1. Expertise location:
The microblogging, hashtagging and re-tweeting affordances of Twitter places its
contents in the public space, as opposed to emails or local files which are prone to
privacy concerns. Microblogs, blogs and social networks support the identification
of expertise (Miller et al., 2011), and according to Guy et al. (2013), “the diversity
of both the content type and the user associations with contents is an indication
that expertise information derived from social media data can be of great value”.
The authors further assert that social media that resides behind a firewall [e.g.,
Yammer1] is typically used by employees to discuss internal topics, and hence
reflects the organisation’s unique vocabulary and areas of interest. This enables
the organisation to find people (or, employees) who are knowledgeable in a given
topic.
2. Public Opinion and Sentiments
Public opinion about the organisation’s image, product or service can make the dif-
ference between success and failure for the organisation. Knowing the sentiments
of the public would help the organisation in responding in such a way that would
promote or maintain favourable public opinion. Businesses have made efforts to
find out customers’ sentiments and opinion, often expressed in free text, towards
1Yammer is a private Twitter where only those with the same e-mail domain (ie, @yourcompany.com)can join and post updates. (Source: http://tldr.me/6sq7s6w)

Chapter 7 Conclusion and Recommendations 135
company’s products and services (Lin and He, 2009). Twitter enables expressions
in free text, which is why the bulk of Twitter data is textual. Zikopoulos et al.
(2012) cited a real world example of a client who introduced a different kind of
environmentally friendly packaging for one of its staple brands. Customer senti-
ment was somewhat negative to the new packaging, and some months later, after
tracking customer’s feedback and comments, the company discovered an unnerv-
ing amount of discontent around the change and therefore moved to a different
kind of eco-friendly packaging. They therefore, hypothesise that, “if you dont
have some kind of micro-blog oriented customer sentiment pulse-taking going on
at your company, you’re likely losing customers to another company that does”.
7.6.2 Dis-benefits of Employee Engagement on Social Media
When does employee engagement become a negative outcome? What impact does fre-
quent engagement on social media have on employee productivity? Does it interrupt the
flow of thoughts and performance to the extent that productivity is hampered? Apart
from the benefit of knowledge sharing facilitated by the social interactions of an engaged
workforce, there is need for further studies on such impact of social media like Twitter
on employee productivity, similar to the research by Jackson et al. (2001) about email
interruption, as mentioned in Section 7.5.
7.6.3 A Single Case Study for both Parameters of KMV
As stated in Section 7.4, this research assumes that the two different case study or-
ganisations are one, in the computation of Knowledge Management Value (KMV) as a
product of its two parameters, actionable knowledge and employee engagement. Also,
the emergent model for a knowledge social machine emanating directly from this frame-
work is presented in Chapter 4.5. This is the model upon which the EMSoD framework
can be operationalised within a corporate software environment. Further studies for the
operationalisation of the EMSoD framework with the emergent model requires that a
single case of an organisation is studied for both parameters in order to be able to assess
the extent of the impact of the implementation (see Chapter 4.4) on a single corporate
organisation.
7.6.4 Privacy and Security
As hinted in Chapter 2.8.5, the privacy and security of corporate data can easily be
compromised through the liberalisation of organisational hierarchical structure to ac-
commodate the flow of tacit knowledge over an enterprise mobility agenda. What are
the actual privacy and security risks and issues involved in the adoption of enterprise

136 Chapter 7 Conclusion and Recommendations
mobility? To what extent have these risks constitute a threat to corporate organisations?
and, what are the mitigating factors against the risks?
Moreover, the new General Data Privacy Regulation (GDPR) of the European Union will
certainly have some implications on the way social media data can be captured, analysed
and exploited for organisations’ competitive advantage. This is because the new rule
— meant to take effect from May 2018 — empowers the individual above corporate
or business aims, regardless of the legitimacy or justification for such aims (Buttarelli,
2016). How will corporate organisations handle private and/or public social media data,
and what methods and research methodology will be appropriate for knowledge discovery
within the context of this new law? These are research questions that further studies
can seek to find answers to.
7.7 Concluding Remark
This chapter concludes the thesis by linking the entire research and drawing conclusion
from the answers proffered for the research questions. Although some assumptions and
limitations of the research were duly acknowledged, the chapter concludes the thesis on a
high and interesting note. This is with viable recommendations on how corporate organ-
isations can effectively apply the EMSoD framework propounded by this research as a
model for exploiting social media data as leverage for corporate knowledge management.
The researcher offers consultatory support to early adopters through the implementation
of this framework and/or its emergent model within a corporate environment. Mean-
while, this research has opened up some interesting research questions for further studies,
as highlighted in Section 7.6.

Appendices
137


Appendix A
Survey Questionnaire Sample
Please turn over for the sample survey questionnaire on Occupational Use of Mobile
Devices and Applications...
139

Appendix A Survey Questionnaire Sample 140

Appendix A Survey Questionnaire Sample 141

Appendix A Survey Questionnaire Sample 142

Appendix A Survey Questionnaire Sample 143

Appendix A Survey Questionnaire Sample 144

Appendix A Survey Questionnaire Sample 145

Appendix A Survey Questionnaire Sample 146

Appendix B
Reasons why respondents say they enjoy the device they say they enjoy
using most at/for work
Please turn over to see the reasons why survey respondents enjoy the device they say
they enjoy using most at/for work...
147

1. Reasons why Survey participants enjoy using the Laptop most at/for Work jjjj
Its capacity fits my needs and is portable.
Size Mobility Functions
I can use my PC in four different ways laptop Stand Tent and Tablet. It provides many functions that I need. very light and thin.
It is portable
Convenience..easily work with docs and typing
it's just so easy
It does lots of things and my handwriting is terrible.
Because it is more convenient to move around and work in different places and is more compact
Power of a computer with all the applications and internet access associated while still being mostly portable as you move between places (as long as you can keep it charged).
I use the Laptop for work.
It's also my personal machine so it's configured for my preferences
Full keyboard most responsive and storage
because of the nature of my research -> I need to write codes
It's easier to handle than a desktop computer and it is easy to travel with. It can perform all the tasks that the other devices can do
Desktop-level productivity. But portable.
With Internet access it means I can do everything I want from a realtively compact machine
I can take my work with me when I move around.
It is very versatile and can be used for a wide variety of tasks. Easy to share data with others and access large amounts of data at distant locations. Laptop can be used as a portable device.
Powerful and yet lightweight enough to carry around so that it is possible to work at different locations if needed.
Appendix B Reasons why respondents say they enjoy the device they say they enjoyusing most at/for work 148
Convenient to continue the work from home.
Having to write code I need a computer. I prefer a laptop mainly because it may be carried anywhere in contrast to a desktop computer.
easier to carry around
If I compare to other devices it is mobile. And it gives me an opportunity for example to sit down on a coach and write something. Also all applications work better. Iphone has some restrictions sometimes. I also like pen and paper especially if i am thinking but paper doesnt have ctrl+f :)
I can easily log into all my accounts share information with others and I can easily carry it around.
easy to use easy to carry light and with good battery
Promptness Flexibility Multitasking etc.
Flexibility - allows better access to calendars and email account than iPad
It provides the easiest access for the greatest range of information: Larger screen than a mobile easier to use with finger presses a hard drive to save research papers documents my work MATLAB etc.
It is easy to work with.
most important for my work
Portability
Portable but with sufficient memory to store all my data useable screen size (and better when plugged into docking station). God battery life.
is more comfortable
Convenience and speed
It's practical. Tablets and Mobile devices could make difficult the process of navigation and browsing.
Most versatile
easy and portable but with more functionality that a smartphone or tablet
I use a tablet/laptop hybrid... it does everything everywhere all the time.
you can work and alos be connected anywhere
Appendix B Reasons why respondents say they enjoy the device they say they enjoyusing most at/for work 149

Laptop is the only practice device for using at work besides a desktop and I haven't been issued with a desktop PC so I use a laptop
can use multiple applications simultaneously
easy of use and size of screen
Portable Powerful Convenient and Capable Personalisable
mobility performance
I can take it anywhere and do anything with it.
Most convenient
portable and personal
Screen large enough but still portable. I can do almost everything
functional and portable
Flexibility and easy to do all tasks required efficiently
Can carry easily anywhere mostly to conferences meetings and seminars at work. Or at least you can carry to any other location if you need change of space for work.
Because of the flexibility
Easy to use and lots of software on it that I need
It is flexible in terms of commuting and it also provides enough hardware resources to run/develop decent programmes. I.e. Android Studio might need considerable resources
It is the easiest to use for most aspects of my work whether in the lab or at home.
It helps with my work and keeps me connected.
I have all functionality I need as IT Power User.
I learnt to touch-type and prefer to write from a keyboard rather than a glass display (such as those found on tablet devices). However my laptop also has a pen-input device which I use daily to sketch or share ideas or to highlight typewritten information
It's a device that allows you to do all the work with one single device and is completely portable.
Appendix B Reasons why respondents say they enjoy the device they say they enjoyusing most at/for work 150

It is the most helpful for my line of work. Can run matlab send emails access the internet. I plug it into my docking station and marvel at the spectacle of its desktop projected accross two massive 24" screens
Although this is not the case at the university but I would prefer to have a laptop to use wherever I go. Also it can be used with a docking station in the office.
Its easypractical and functional
Practical and helpfull
I enjoy using laptop because of its ease of use for office work such as compiling reports with MS office suite.
For screen size comfort.
It makes my work easier
Portability
Portability and access from lots of different places. Good range of software.
Everything is on it
Most productive
This is the only computer I have for work use
Because I like it.
Easiest to type with and very fast boot up and can work in comfort where I like. However my chromebook lacks desktop functionality - so I generally work on my PC at my desk so significant tasks. Please note - in later questions I'm referring to my iPod as these questions don't appear appropriate to my laptop use.
I work in the office and at home so I can transport my laptop between places. I like the size of the screen is not too small compared with a tablet and I like having a keyboard to type instead of touchscreen.
use of office programmes.
Practicality. My laptop is connected to a docking station and I have two screens which facilitate speed and comparability when I work
It's new portable perfect size for using on the train or in a meeting or at my desk.
I'm used to it and it's easy to navigate and look at attachments
Appendix B Reasons why respondents say they enjoy the device they say they enjoyusing most at/for work 151

While the laptop does everything my tablet will do the file storage and file access are much more straightforward on the laptop. I also feel that security is easier to manage on the laptop.
I have all my work on my laptop - data teaching materials journal articles etc. It's light so I can carry it with me everywhere. It's more versatile than a tablet or a mobile and it's much more comfortable to write on it.
efficiency of action - for example completing this survey
my laptop allows me to access all my files wherever I am on campus
Its the only device that does everything. All of the others can do parts of my job but not all.
Portable work flexibly geographically and time wise. It's a Mac much prefer than PC
It enables me to keep working wherever I am. In addition the fact that it is my personal laptop means that I have in it more work-related materials than I store in my office desktop.
Best combination of portability functionality and screen size. I use with a docking station in the office.
Can do the most on it but still portable
I do most of my work on my laptop
Power and portability.
2. Reasons why Survey participants enjoy using the Desktop most at/for Work
more functional and wide screen which is most harmless screen for eyes
it has facilities to do my research
Balance
Big screen.
If I am using the desktop it means I am at my work desk and not working out of hours/weekends. I have plenty of space at my desk and all the other office equipment I need to hand. I have two screens and a full size keyboard and mouse to use too.
Larger screen more comfortable working at a desk
Comfortable convenient familiar
I don't have to install apps to get things done. My computer can run multiple things at the same time and it has a larger screen.
Appendix B Reasons why respondents say they enjoy the device they say they enjoyusing most at/for work 152

Mobile OS devices lack proper file system and sensitive data can't just be cloud based. Laptop on a desk I normally use 1-2 addition screens to the devices own so screen size (space!) is as important as CPU/RAM. Tablets are fine for selecting music web/mail browsing whilst watching TV but aren't useful for actual work.
It's more comfortable to work at.
Most of my work requires the use of a desktop
Means I can be sat at my desk with two large monitor screens to view.
It provides more convenient especially in wide screen. Also a large number of memory can possible process large data faster.
Because it is comfortable to use and the screen is very wide and better for the eyes.
Because of the large/multiple screens
Ergonomics large displays processing power working environment.
Difficult to say which I 'enjoy' using - it depends what for. Phone is handy when I need to be on the move but it can be frustrating as not everything works as well as on a desktop which is generally more comfortable and efficient for longer periods of use
easiest to use large screen screen space is the most important factor also just physical space around workstation generally
convenient and fast
Better experience. More powerful. More workspace. More comfortable seating position.
Best performance
more ergonomic
Because usually when I'm working at my desktop the tasks will be of a more routine and ordered nature and I have full access to local network and online resources.
Best user input infrastructure. Keyboard for precise input mouse for fast positioning good sound infrastructure (microphone and headphones) large and multiple screens. It is just the most efficient way of working if not moving.
A desktop computer is most efficient for doing work has keyboard and mouse which means work can be done more quickly there is more screen space so multitasking is easier and it is more ergonomically comfortable to use.
Quick to utilise for all tasks.
Most powerful and most convinient
Appendix B Reasons why respondents say they enjoy the device they say they enjoyusing most at/for work 153
More comfortable than a laptop or a phone. Big screen so that you can work on multiple documents simultaneously.
My productivity is maximised.
large screen several screens at once easier to read information quickly loads faster than iphone or ipad or laptop doesn't give me problems with wifi or eduroam like my laptop does prefer to use a mouse than a mousepad
efficient. Does what I want
I have better posture when using a desktop over laptop.
I have two desktop computers one running Windows to read documents and the other running Ubuntu to programme and run simulations. It's much efficient this way than on laptop which runs Mac and I do love doing emails on there though.
Easy to see and use physically and quick.
Bigger screen faster internet connection.
I love working with big screen. Makes work easier for me.
Powerful useful and convenient.
I am able to use two screens so I can do two things at once
Easiest to work on
Most convenient while working. Also operates faster than other devices.
its easy to use
Comfort and adaptability
More flexible than pen /paper
Ease of access and most suitable for admin work.
Desktop has dual monitor set-up for best productivity
I have two screens
Convenience: the desktop is set up properly with all of the software and data I need and it is ergonomic.
I use two screens with my desktop computer
My desktop computer comes with two big screens which are very useful in my work whereas the laptop has a tiny screen.
Appendix B Reasons why respondents say they enjoy the device they say they enjoyusing most at/for work 154

I prefer the desktop computer because it is ergonomically positioned. I find a laptop difficult to sit in front of/work at for long periods of time because it is hard to find the optimum work position.
Allows me to use two screens to increase productivity also allows me to maintain a good sitting position to reduce aches and pains.
Big monitor and reasonable keyboard.
It has all my software and files etc. Suitable screen keyboard mouse.
the desktop computer allows for two screens which enables you to have multiple documents open and view them properly.
multiple screens big screens best working position fastest network and widest range of software tools
Because I can access information quickly eg. from the internet or shared drives
Easier (more comfortable) to use has more functionality.
Easy access to internet have dual monitors so easy to look at larger or multiple documents.
bigger screen
convenience
Most compatible with systems needed in order to do my job.
physicle keyboard large screen can run all the application i need.
Has everything I want there.
Twin screens proper keyboard know where everything is. Can get Google stuff here as well as tablet.
Larger screen and easier input device. This makes it easier to see everything you want to do all at once.
I have two screens and am a touch typist. It's easy to use the screens. Pen and paper is my next favourite.
easiest to use
I find it is the easiest and most convenient device. I have 2 screens and this improves my ability to do dual tasks that are characteristic of my work.
I prefer a stand alone screen and keyboard as apposed to a laptop or tablet
Appendix B Reasons why respondents say they enjoy the device they say they enjoyusing most at/for work 155
It is all I can afford that provides the programming facilities on which I rely
More useful - everything (all documents) is in one place.
Easy to see and work with
Most comprehensive ability. Does not tend to go wrong. Straightforward use. Compatible with everything.
3. Reasons why Survey participants enjoy using Pen & Paper most at/for Work
Fast to write down my thoughts
It is more easy to take notes and you do not have the problem that you battery run dry.
I feel ultimate control over this device I can be as free-form as possible and can work where I like when I like.
The highest flexibility to write what's on your mind down.
becasue chicks like guys with pens mine is very cool and i like to sharpen it at least twice a day
It is the most fluid responsive and has no technology overheads. It does not run out of power it keeps a log of work and has no threat of viruses
I like to sketch things out on paper before testing them out on a device.
It is easiest to draw diagrams
comfortable
It's simple to use and doesn't require a power source.
I feel more organised and it is quite quick
It doesn't get hot it isn't distracting and it is familiar (this doesn't mean it is the best just most enjoyable)
I write in Arabic it's easier without the keyboard.
I can think as I write unlike if I have to use an electronic gadget
I am an old school mathematician and pen and paper is my first love for communication of ideas
I can do maths quickly and easily using pen and paper.
Appendix B Reasons why respondents say they enjoy the device they say they enjoyusing most at/for work 156

4. Reasons why Survey participants enjoy using the Smartphone most at/for Work
it is more accessible at any time
Some sense of freedom
It is really easy to use as if it is a mini computer that is always next to you when needed.
I can view emails on the go.
The pictures quality and the ability to do with it what laptop does
It can serve for a lot of purpose. I use my android phone to make calls surf the net watch movies.
.
Simplicity - and ease of access - portable
It doesnt crash like my desktop and I can use it away from my desk giving more autonomy
it is light easy to access and quick
I like using my smartphone as it has all the information I need in it. Contacts Emails Music Photos Videos and my calendar.
5. Reasons why Survey participants enjoy using the Tablet most at/for Work
I extract information fast on it.
Both portable and easy to see
It convinient it has access to everything. It one source with a lot of Info
Convenient and easy to carry around
The iPad is easy to use to access email from home and also useful to carry out professional social media activities
mobility flexibility and ease of use. (it fills my requirements and is easily portable)
In my role it makes it easier to talk through web pages with my contacts and more convenient as can do anywhere on campus. The Horizon app for virtual desktop means I can log in to my desktop easily. I could potentially also work from home if necessary so very good flexibility and convenience.
Appendix B Reasons why respondents say they enjoy the device they say they enjoyusing most at/for work 157

Appendix C
Code references of the 5 Prevalent Themes from coded nodes
Please turn over to see the Code References of the 5 Prevalent Themes that run across
reasons why survey respondents enjoy the device they say they enjoy using most at/for
work...
158

1. Internals\\iSurvey-Desktop-§50referencescoded[66.28%Coverage]
Reference1-1.19%Coverage
morefunctionalandwidescreenwhichismostharmlessscreenforeyes
Reference2-0.20%Coverage
Bigscreen.
Reference3-3.90%Coverage
IfIamusingthedesktopitmeansIamatmyworkdeskandnotworkingoutofhours/weekends.IhaveplentyofspaceatmydeskandalltheotherofficeequipmentIneedtohand.Ihavetwoscreensandafullsizekeyboardandmousetousetoo.
Reference4-0.84%Coverage
Largerscreenmorecomfortableworkingatadesk
Reference5-0.58%Coverage
Comfortableconvenientfamiliar
Reference6-2.09%Coverage
Idon’thavetoinstallappstogetthingsdone.Mycomputercanrunmultiplethingsatthesametimeandithasalargerscreen.
Reference7-5.35%Coverage
MobileOSdeviceslackproperfilesystemandsensitivedatacan’tjustbecloudbased.LaptoponadeskInormallyuse1-2additionscreenstothedevicesownsoscreensize(space!)isasimportantasCPU/RAM.Tabletsarefineforselectingmusicweb/mailbrowsingwhilstwatchingTVbutaren’tusefulforactualwork.
Reference8-1.11%Coverage
MeansIcanbesatatmydeskwithtwolargemonitorscreenstoview.
Reference9-2.11%Coverage
Itprovidesmoreconvenientespeciallyinwidescreen.Alsoalargenumberofmemorycanpossibleprocesslargedatafaster.
Reference10-1.41%Coverage
Becauseitiscomfortabletouseandthescreenisverywideandbetterfortheeyes.
Reference11-0.66%Coverage
Becauseofthelarge/multiplescreens
Reference12-1.15%Coverage
Ergonomicslargedisplaysprocessingpowerworkingenvironment.
Reference13-2.11%Coverage
easiesttouselargescreenscreenspaceisthemostimportantfactoralsojustphysicalspacearoundworkstationgenerally
Reference14-3.90%Coverage
Bestuserinputinfrastructure.Keyboardforpreciseinputmouseforfastpositioninggoodsoundinfrastructure(microphoneandheadphones)largeandmultiplescreens.Itisjustthemostefficientwayofworkingifnotmoving.
Reference15-0.52%Coverage
Quicktoutiliseforalltasks.
Reference16-0.58%Coverage
Mostpowerfulandmostconvinient
Reference17-1.89%Coverage
Morecomfortablethanalaptoporaphone.Bigscreensothatyoucanworkonmultipledocumentssimultaneously.
Reference18-3.62%Coverage
argescreenseveralscreensatonceeasiertoreadinformationquicklyloadsfasterthaniphoneoripadorlaptopdoesn’tgivemeproblemswithwifioreduroamlikemylaptopdoesprefertouseamousethanamousepad
Reference19-0.68%Coverage
Easytoseeandusephysicallyandquick.
Reference20-0.74%Coverage
Biggerscreenfasterinternetconnection.
Reference21-0.94%Coverage
Iloveworkingwithbigscreen.Makesworkeasierforme.
Reference22-0.56%Coverage
Powerfulusefulandconvenient.
Reference23-0.90%Coverage
Appendix C Code references of the 5 Prevalent Themes from coded nodes 159

IamabletousetwoscreenssoIcandotwothingsatonce
Reference24-0.30%Coverage
Easiesttoworkon
Reference25-1.25%Coverage
Mostconvenientwhileworking.Alsooperatesfasterthanotherdevices.
Reference26-0.26%Coverage
itseasytouse
Reference27-0.80%Coverage
Easeofaccessandmostsuitableforadminwork.
Reference28-0.92%Coverage
Desktophasdualmonitorset-upforbestproductivity
Reference29-0.30%Coverage
Ihavetwoscreens
Reference30-1.73%Coverage
Convenience:thedesktopissetupproperlywithallofthesoftwareanddataIneedanditisergonomic.
Reference31-0.70%Coverage
Iusetwoscreenswithmydesktopcomputer
Reference32-2.19%Coverage
Allowsmetousetwoscreenstoincreaseproductivityalsoallowsmetomaintainagoodsittingpositiontoreduceachesandpains.
Reference33-0.66%Coverage
Bigmonitorandreasonablekeyboard.
Reference34-1.17%Coverage
Ithasallmysoftwareandfilesetc.Suitablescreenkeyboardmouse.
Reference35-1.99%Coverage
thedesktopcomputerallowsfortwoscreenswhichenablesyoutohavemultipledocumentsopenandviewthemproperly.
Reference36-1.75%Coverage
multiplescreensbigscreensbestworkingpositionfastestnetworkandwidestrangeofsoftwaretools
Reference37-0.99%Coverage
Easier(morecomfortable)tousehasmorefunctionality.
Reference38-1.53%Coverage
Easyaccesstointernethavedualmonitorssoeasytolookatlargerormultipledocuments.
Reference39-0.24%Coverage
biggerscreen
Reference40-0.22%Coverage
convenience
Reference41-1.15%Coverage
physiclekeyboardlargescreencanrunalltheapplicationineed.
Reference42-0.48%Coverage
HaseverythingIwantthere.
Reference43-1.73%Coverage
Largerscreenandeasierinputdevice.Thismakesiteasiertoseeeverythingyouwanttodoallatonce.
Reference44-1.75%Coverage
Ihavetwoscreensandamatouchtypist.It’seasytousethescreens.Penandpaperismynextfavourite.
Reference45-0.24%Coverage
easiesttouse
Reference46-2.47%Coverage
Ifinditistheeasiestandmostconvenientdevice.Ihave2screensandthisimprovesmyabilitytododualtasksthatarecharacteristicofmywork.
Reference47-1.23%Coverage
Ipreferastandalonescreenandkeyboardasapposedtoalaptoportablet
Appendix C Code references of the 5 Prevalent Themes from coded nodes 160

Reference48-0.97%Coverage
Moreuseful-everything(alldocuments)isinoneplace.
Reference49-0.40%Coverage
Easytoseeandworkwith
Reference50-1.81%Coverage
Mostcomprehensiveability.Doesnottendtogowrong.Straightforwarduse.Compatiblewitheverything.
2. Internals\\iSurvey-Laptop-§68referencescoded[80.74%Coverage]
Reference1-0.60%Coverage
Itscapacityfitsmyneedsandisportable.
Reference2-1.76%Coverage
IcanusemyPCinfourdifferentwayslaptopStandTentandTablet.ItprovidesmanyfunctionsthatIneed.verylightandthin.
Reference3-0.20%Coverage
Itisportable
Reference4-0.67%Coverage
Convenience..easilyworkwithdocsandtyping
Reference5-0.23%Coverage
it’sjustsoeasy
Reference6-0.75%Coverage
Itdoeslotsofthingsandmyhandwritingisterrible.
Reference7-1.29%Coverage
Becauseitismoreconvenienttomovearoundandworkindifferentplacesandismorecompact
Reference8-2.44%Coverage
Powerofacomputerwithalltheapplicationsandinternetaccessassociatedwhilestillbeingmostlyportableasyoumovebetweenplaces(aslongasyoucankeepitcharged).
Reference9-1.82%Coverage
It’seasiertohandlethanadesktopcomputeranditiseasytotravelwith.Itcanperformallthetasksthattheotherdevicescando
Reference10-0.64%Coverage
Desktop-levelproductivity.Butportable.
Reference11-1.26%Coverage
WithInternetaccessitmeansIcandoeverythingIwantfromarealtivelycompactmachine
Reference12-0.62%Coverage
IcantakemyworkwithmewhenImovearound.
Reference13-2.59%Coverage
Itisveryversatileandcanbeusedforawidevarietyoftasks.Easytosharedatawithothersandaccesslargeamountsofdataatdistantlocations.Laptopcanbeusedasaportabledevice
Reference14-1.62%Coverage
Powerfulandyetlightweightenoughtocarryaroundsothatitispossibletoworkatdifferentlocationsifneeded.
Reference15-0.60%Coverage
Convenienttocontinuetheworkfromhome.
Reference16-1.84%Coverage
HavingtowritecodeIneedacomputer.Ipreferalaptopmainlybecauseitmaybecarriedanywhereincontrasttoadesktopcomputer.
Reference17-0.32%Coverage
easiertocarryaround
Reference18-4.02%Coverage
IfIcomparetootherdevicesitismobile.Anditgivesmeanopportunityforexampletositdownonacoachandwritesomething.Alsoallapplicationsworkbetter.Iphonehassomerestrictionssometimes.Ialsolikepenandpaperespeciallyifiamthinkingbutpaperdoesnthavectrl+f:)
Reference19-1.41%Coverage
IcaneasilylogintoallmyaccountsshareinformationwithothersandIcaneasilycarryitaround.
Reference20-0.72%Coverage
easytouseeasytocarrylightandwithgoodbattery
Appendix C Code references of the 5 Prevalent Themes from coded nodes 161

Reference21-0.38%Coverage
Largerscreenthanamobile
Reference22-0.32%Coverage
Itiseasytoworkwith.
Reference23-0.18%Coverage
Portability
Reference24-2.03%Coverage
Portablebutwithsufficientmemorytostoreallmydatauseablescreensize(andbetterwhenpluggedintodockingstation).Godbatterylife.
Reference25-1.04%Coverage
easyandportablebutwithmorefunctionalitythatasmartphoneortablet
Reference26-1.07%Coverage
Iuseatablet/laptophybrid...itdoeseverythingeverywhereallthetime.
Reference27-0.60%Coverage
youcanworkandalosbeconnectedanywhere
Reference28-0.67%Coverage
canusemultipleapplicationssimultaneously
Reference29-0.42%Coverage
easyofuseandsizeofscreen
Reference30-0.84%Coverage
PortablePowerfulConvenientandCapablePersonalisable
Reference31-0.64%Coverage
Icantakeitanywhereanddoanythingwithit.
Reference32-0.23%Coverage
Mostconvenient
Reference33-0.32%Coverage
portableandpersonal
Reference34-0.94%Coverage
Screenlargeenoughbutstillportable.Icandoalmosteverything
Reference35-0.35%Coverage
functionalandportable
Reference36-0.84%Coverage
Flexibilityandeasytodoalltasksrequiredefficiently
Reference37-2.26%Coverage
Cancarryeasilyanywheremostlytoconferencesmeetingsandseminarsatwork.Oratleastyoucancarrytoanyotherlocationifyouneedchangeofspaceforwork.
Reference38-0.65%Coverage
EasytouseandlotsofsoftwareonitthatIneed
Reference39-2.46%Coverage
Itisflexibleintermsofcommutinganditalsoprovidesenoughhardwareresourcestorun/developdecentprogrammes.I.e.AndroidStudiomightneedconsiderableresources
Reference40-1.10%Coverage
Itistheeasiesttouseformostaspectsofmyworkwhetherinthelaborathome.
Reference41-0.67%Coverage
IhaveallfunctionalityIneedasITPowerUser.
Reference42-3.55%Coverage
Ilearnttotouch-typeandprefertowritefromakeyboardratherthanaglassdisplay(suchasthosefoundontabletdevices).Howevermylaptopalsohasapen-inputdevicewhichIusedailytosketchorshareideasortohighlighttypewritteninformation
Reference43-1.36%Coverage
It’sadevicethatallowsyoutodoalltheworkwithonesingledeviceandiscompletelyportable.
Reference44-2.88%Coverage
Appendix C Code references of the 5 Prevalent Themes from coded nodes 162

Itisthemosthelpfulformylineofwork.Canrunmatlabsendemailsaccesstheinternet.Iplugitintomydockingstationandmarvelatthespectacleofitsdesktopprojectedaccrosstwomassive24"screens
Reference45-2.18%Coverage
AlthoughthisisnotthecaseattheuniversitybutIwouldprefertohavealaptoptousewhereverIgo.Alsoitcanbeusedwithadockingstationintheoffice.
Reference46-0.50%Coverage
Itseasypracticalandfunctional
Reference47-1.54%Coverage
IenjoyusinglaptopbecauseofitseaseofuseforofficeworksuchascompilingreportswithMSofficesuite.
Reference48-0.35%Coverage
Forscreensizecomfort.
Reference49-0.32%Coverage
Itmakesmyworkeasier
Reference50-0.18%Coverage
Portability
Reference51-1.10%Coverage
Portabilityandaccessfromlotsofdifferentplaces.Goodrangeofsoftware.
Reference52-0.27%Coverage
Everythingisonit
Reference53-1.81%Coverage
EasiesttotypewithandveryfastbootupandcanworkincomfortwhereIlike.Howevermychromebooklacksdesktopfunctionality
Reference54-2.79%Coverage
IworkintheofficeandathomesoIcantransportmylaptopbetweenplaces.IlikethesizeofthescreenisnottoosmallcomparedwithatabletandIlikehavingakeyboardtotypeinsteadoftouchscreen.
Reference55-0.38%Coverage
useofofficeprogrammes.
Reference56-1.87%Coverage
Practicality.MylaptopisconnectedtoadockingstationandIhavetwoscreenswhichfacilitatespeedandcomparabilitywhenIwork
Reference57-1.12%Coverage
It’snewportableperfectsizeforusingonthetrainorinameetingoratmydesk.
Reference58-0.87%Coverage
I’musedtoitandit’seasytonavigateandlookatattachments
Reference59-2.61%Coverage
Whilethelaptopdoeseverythingmytabletwilldothefilestorageandfileaccessaremuchmorestraightforwardonthelaptop.Ialsofeelthatsecurityiseasiertomanageonthelaptop.
Reference60-3.01%Coverage
Ihaveallmyworkonmylaptop-datateachingmaterialsjournalarticlesetc.It’slightsoIcancarryitwithmeeverywhere.It’smoreversatilethanatabletoramobileandit’smuchmorecomfortabletowriteonit.
Reference61-0.89%Coverage
mylaptopallowsmetoaccessallmyfileswhereverIamoncampus
Reference62-1.27%Coverage
Itstheonlydevicethatdoeseverything.Alloftheotherscandopartsofmyjobbutnotall.
Reference63-1.17%Coverage
Portableworkflexiblygeographicallyandtimewise.It’saMacmuchpreferthanPC
Reference64-2.48%Coverage
ItenablesmetokeepworkingwhereverIam.InadditionthefactthatitismypersonallaptopmeansthatIhaveinitmorework-relatedmaterialsthanIstoreinmyofficedesktop.
Reference65-1.52%Coverage
Bestcombinationofportabilityfunctionalityandscreensize.Iusewithadockingstationintheoffice.
Reference66-0.54%Coverage
Candothemostonitbutstillportable
Reference67-0.42%Coverage
Appendix C Code references of the 5 Prevalent Themes from coded nodes 163

Idomostofmyworkonmylaptop
Reference68-0.33%Coverage
Powerandportability
3. Internals\\iSurvey-Pen_and_Paper-§5referencescoded[29.25%Coverage]
Reference1-7.42%Coverage
Itismoreeasytotakenotesandyoudonothavetheproblemthatyoubatteryrundry.
Reference2-9.78%Coverage
IfeelultimatecontroloverthisdeviceIcanbeasfree-formaspossibleandcanworkwhereIlikewhenIlike.
Reference3-2.69%Coverage
Itiseasiesttodrawdiagrams
Reference4-4.62%Coverage
IwriteinArabicit’seasierwithoutthekeyboard.
Reference5-4.73%Coverage
Icandomathsquicklyandeasilyusingpenandpaper.
4. Internals\\iSurvey-Smartphones-§6referencescoded[65.07%Coverage]
Reference1-13.82%Coverage
Itisreallyeasytouseasifitisaminicomputerthatisalwaysnexttoyouwhenneeded.
Reference2-4.41%Coverage
Icanviewemailsonthego.
Reference3-15.16%Coverage
Itcanserveforalotofpurpose.Iusemyandroidphonetomakecallssurfthenetwatchmovies.
Reference4-6.72%Coverage
Simplicity-andeaseofaccess-portable
Reference5-5.57%Coverage
itislighteasytoaccessandquick
Reference6-19.39%Coverage
IlikeusingmysmartphoneasithasalltheinformationIneedinit.ContactsEmailsMusicPhotosVideosandmycalendar.
5. Internals\\iSurvey-Tablet-§6referencescoded[93.94%Coverage]
Reference1-4.28%Coverage
Bothportableandeasytosee
Reference2-10.87%Coverage
Itconvinientithasaccesstoeverything.ItonesourcewithalotofInfo
Reference3-5.53%Coverage
Convenientandeasytocarryaround
Reference4-17.11%Coverage
TheiPadiseasytousetoaccessemailfromhomeandalsousefultocarryoutprofessionalsocialmediaactivities
Reference5-13.19%Coverage
mobilityflexibilityandeaseofuse.(itfillsmyrequirementsandiseasilyportable)
Reference6-42.96%Coverage
Inmyroleitmakesiteasiertotalkthroughwebpageswithmycontactsandmoreconvenientascandoanywhereoncampus.TheHorizonappforvirtualdesktopmeansIcanlogintomydesktopeasily.Icouldpotentiallyalsoworkfromhomeifnecessarysoverygoodflexibilityandconvenience.
Appendix C Code references of the 5 Prevalent Themes from coded nodes 164

Appendix D
Participants’ level of agreement with statements meant to check the
veracity of the reasons why they enjoy the device they enjoy most
Please turn over to see respondents level of agreement with statements meant to check
the veracity of the reasons why they enjoy the device they enjoy most...
165

CROSSTABS
/TABLES=V20 V21 V22 V23 V24 V25 V26 BY V18
/FORMAT=AVALUE TABLES
/CELLS=COUNT TOTAL
/COUNT ROUND CELL
/BARCHART.
Crosstabs
Case Processing Summary
Cases
Valid Missing Total
N Percent N Percent N Percent
How would you agree/disagree with
the following statements regarding the
device you enjoy using most at work? *
Which of them you enjoy using most
at/for work?
183 91.5% 17 8.5% 200 100.0%
It helps me do my job most effectively
* Which of them you enjoy using most
at/for work?
173 86.5% 27 13.5% 200 100.0%
It saves me time and hassles * Which
of them you enjoy using most at/for
work?
183 91.5% 17 8.5% 200 100.0%
It enables me perform multiple tasks at
the same time * Which of them you
enjoy using most at/for work?
183 91.5% 17 8.5% 200 100.0%
I do not have to be at a desk or an
office * Which of them you enjoy using
most at/for work?
174 87.0% 26 13.0% 200 100.0%
I just like fiddling with gadgets * Which
of them you enjoy using most at/for
work?
173 86.5% 27 13.5% 200 100.0%
I prefer pen, paper and traditional
desktop computers * Which of them
you enjoy using most at/for work?
174 87.0% 26 13.0% 200 100.0%
Appendix D Participants’ level of agreement with statements meant to check theveracity of the reasons why they enjoy the device they enjoy most 166

How would you agree/disagree with the following statements regarding the device you enjoy using most at work? * Which
of them you enjoy using most at/for work? Crosstabulation
Which of them you enjoy using most at/for work?
Total Pen & Paper Tablets Smartphones Laptop Desktop
How would you agree/disagree
with the following statements
regarding the device you enjoy
using most at work?
Count 2 1 0 3 3 9
% of Total 1.1% 0.5% 0.0% 1.6% 1.6% 4.9%
5 Count 0 1 0 0 0 1
% of Total 0.0% 0.5% 0.0% 0.0% 0.0% 0.5%
MATRIX START Count 15 6 11 80 61 173
% of Total 8.2% 3.3% 6.0% 43.7% 33.3% 94.5%
Total Count 17 8 11 83 64 183
% of Total 9.3% 4.4% 6.0% 45.4% 35.0% 100.0%
Appendix D Participants’ level of agreement with statements meant to check theveracity of the reasons why they enjoy the device they enjoy most 167

It helps me do my job most effectively * Which of them you enjoy using most at/for work? Crosstabulation
Which of them you enjoy using most at/for work?
Total Pen & Paper Tablets Smartphones Laptop Desktop
It helps me do my job most
effectively
Strongly agree Count 6 4 3 44 46 103
% of Total 3.5% 2.3% 1.7% 25.4% 26.6% 59.5%
Agree Count 6 1 4 33 13 57
% of Total 3.5% 0.6% 2.3% 19.1% 7.5% 32.9%
Neutral Count 3 1 3 3 0 10
% of Total 1.7% 0.6% 1.7% 1.7% 0.0% 5.8%
Disagree Count 0 1 1 0 1 3
% of Total 0.0% 0.6% 0.6% 0.0% 0.6% 1.7%
Total Count 15 7 11 80 60 173
% of Total 8.7% 4.0% 6.4% 46.2% 34.7% 100.0%
Appendix D Participants’ level of agreement with statements meant to check theveracity of the reasons why they enjoy the device they enjoy most 168

It saves me time and hassles * Which of them you enjoy using most at/for work? Crosstabulation
Which of them you enjoy using most at/for work?
Total Pen & Paper Tablets Smartphones Laptop Desktop
It saves me time and hassles
Count 2 2 0 3 3 10
% of Total 1.1% 1.1% 0.0% 1.6% 1.6% 5.5%
Strongly agree Count 5 4 4 36 23 72
% of Total 2.7% 2.2% 2.2% 19.7% 12.6% 39.3%
Agree Count 5 2 5 33 25 70
% of Total 2.7% 1.1% 2.7% 18.0% 13.7% 38.3%
Neutral Count 4 0 2 10 7 23
% of Total 2.2% 0.0% 1.1% 5.5% 3.8% 12.6%
Disagree Count 1 0 0 1 4 6
% of Total 0.5% 0.0% 0.0% 0.5% 2.2% 3.3%
Strongly disagree Count 0 0 0 0 2 2
% of Total 0.0% 0.0% 0.0% 0.0% 1.1% 1.1%
Total Count 17 8 11 83 64 183
% of Total 9.3% 4.4% 6.0% 45.4% 35.0% 100.0%
Appendix D Participants’ level of agreement with statements meant to check theveracity of the reasons why they enjoy the device they enjoy most 169

It enables me perform multiple tasks at the same time * Which of them you enjoy using most at/for work? Crosstabulation
Which of them you enjoy using most at/for work?
Total Pen & Paper Tablets Smartphones Laptop Desktop
It enables me perform multiple
tasks at the same time
Count 2 1 0 3 3 9
% of Total 1.1% 0.5% 0.0% 1.6% 1.6% 4.9%
Strongly agree Count 1 3 5 48 40 97
% of Total 0.5% 1.6% 2.7% 26.2% 21.9% 53.0%
Agree Count 7 1 4 23 17 52
% of Total 3.8% 0.5% 2.2% 12.6% 9.3% 28.4%
Neutral Count 3 1 0 6 3 13
% of Total 1.6% 0.5% 0.0% 3.3% 1.6% 7.1%
Disagree Count 2 1 1 3 0 7
% of Total 1.1% 0.5% 0.5% 1.6% 0.0% 3.8%
Strongly disagree Count 2 0 1 0 1 4
% of Total 1.1% 0.0% 0.5% 0.0% 0.5% 2.2%
MATRIX START Count 0 1 0 0 0 1
% of Total 0.0% 0.5% 0.0% 0.0% 0.0% 0.5%
Total Count 17 8 11 83 64 183
% of Total 9.3% 4.4% 6.0% 45.4% 35.0% 100.0%
Appendix D Participants’ level of agreement with statements meant to check theveracity of the reasons why they enjoy the device they enjoy most 170

I do not have to be at a desk or an office * Which of them you enjoy using most at/for work? Crosstabulation
Which of them you enjoy using most at/for work?
Total Pen & Paper Tablets Smartphones Laptop Desktop
I do not have to be at a desk
or an office
Strongly agree Count 5 6 4 31 1 47
% of Total 2.9% 3.4% 2.3% 17.8% 0.6% 27.0%
Agree Count 4 0 5 32 6 47
% of Total 2.3% 0.0% 2.9% 18.4% 3.4% 27.0%
Neutral Count 4 1 1 10 10 26
% of Total 2.3% 0.6% 0.6% 5.7% 5.7% 14.9%
Disagree Count 1 0 1 5 17 24
% of Total 0.6% 0.0% 0.6% 2.9% 9.8% 13.8%
Strongly disagree Count 1 0 0 2 27 30
% of Total 0.6% 0.0% 0.0% 1.1% 15.5% 17.2%
Total Count 15 7 11 80 61 174
% of Total 8.6% 4.0% 6.3% 46.0% 35.1% 100.0%
Appendix D Participants’ level of agreement with statements meant to check theveracity of the reasons why they enjoy the device they enjoy most 171

I just like fiddling with gadgets * Which of them you enjoy using most at/for work? Crosstabulation
Which of them you enjoy using most at/for work?
Total Pen & Paper Tablets Smartphones Laptop Desktop
I just like fiddling with gadgets Strongly agree Count 0 2 1 8 2 13
% of Total 0.0% 1.2% 0.6% 4.6% 1.2% 7.5%
Agree Count 1 0 4 18 7 30
% of Total 0.6% 0.0% 2.3% 10.4% 4.0% 17.3%
Neutral Count 4 3 2 20 22 51
% of Total 2.3% 1.7% 1.2% 11.6% 12.7% 29.5%
Disagree Count 6 1 2 21 14 44
% of Total 3.5% 0.6% 1.2% 12.1% 8.1% 25.4%
Strongly disagree Count 4 1 2 13 15 35
% of Total 2.3% 0.6% 1.2% 7.5% 8.7% 20.2%
Total Count 15 7 11 80 60 173
% of Total 8.7% 4.0% 6.4% 46.2% 34.7% 100.0%
Appendix D Participants’ level of agreement with statements meant to check theveracity of the reasons why they enjoy the device they enjoy most 172

I prefer pen, paper and traditional desktop computers * Which of them you enjoy using most at/for work? Crosstabulation
Which of them you enjoy using most at/for work?
Total Pen & Paper Tablets Smartphones Laptop Desktop
I prefer pen, paper and traditional
desktop computers
Strongly agree Count 6 1 0 0 21 28
% of Total 3.4% 0.6% 0.0% 0.0% 12.1% 16.1%
Agree Count 6 0 0 11 19 36
% of Total 3.4% 0.0% 0.0% 6.3% 10.9% 20.7%
Neutral Count 2 4 7 35 13 61
% of Total 1.1% 2.3% 4.0% 20.1% 7.5% 35.1%
Disagree Count 1 2 2 23 5 33
% of Total 0.6% 1.1% 1.1% 13.2% 2.9% 19.0%
Strongly disagree Count 0 0 2 11 3 16
% of Total 0.0% 0.0% 1.1% 6.3% 1.7% 9.2%
Total Count 15 7 11 80 61 174
% of Total 8.6% 4.0% 6.3% 46.0% 35.1% 100.0%
Appendix D Participants’ level of agreement with statements meant to check theveracity of the reasons why they enjoy the device they enjoy most 173

Appendix E
Participants’ frequency of putting the company’s device into non-work
related use
Please turn over to see how often participants put the company’s device to the following
non work-relarted use:
1. To keep in touch with friends and family.
2. To keep in touch with work colleagues
3. For personal organisation/admin and time management
4. For games, entertainment and relaxation
5. To keep updated with general news and current affairs
6. To keep updated with work related news and gossip.
174

CROSSTABS /TABLES=V43 V44 V45 V46 V47 V48 V49 BY V27
/FORMAT=AVALUE TABLES
/STATISTICS=CHISQ
/CELLS=COUNT EXPECTED
/COUNT ROUND CELL
/BARCHART.
In addition to work related use, how often do you use the company's device for the following: * Own Device or Company's Device?
To keep in touch with friends and family . * Own Device or Company's Device ?
Crosstab
Own Device or Company's
Device?
TotalCompany's
Device
To keep in touch with friends and family.
Quite often Count
Expected Count
Fairly often Count
Expected Count
Often Count
Expected Count
Rarely Count
Expected Count
Not at all Count
Expected Count
Total Count
Expected Count
13 13
13.0 13.0
10 10
10.0 10.0
17 17
17.0 17.0
36 36
36.0 36.0
31 31
31.0 31.0
107 107
107.0 107.0
Appendix E Participants’ frequency of putting the company’s device into non-workrelated use 175

Not at allFairly often Often Rarely
To keep in touch with friends and family.
Quite often
Co
un
t
40
30
20
10
0
To keep in touch with work colleagues * Own Device or Company's Device?
Crosstab
Own Device or Company's Device?
TotalOwn DeviceCompany's
Device
To keep in touch with work colleagues
Quite often Count
Expected Count
Fairly often Count
Expected Count
Often Count
Expected Count
Rarely Count
Expected Count
Not at all Count
Expected Count
6 Count
Expected Count
Total Count
Expected Count
0 39 39
.4 38.6 39.0
0 27 27
.3 26.8 27.0
0 25 25
.2 24.8 25.0
0 14 14
.1 13.9 14.0
0 2 2
.0 2.0 2.0
1 0 1
.0 1.0 1.0
1 107 108
1.0 107.0 108.0
Appendix E Participants’ frequency of putting the company’s device into non-workrelated use 176

To keep in touch with work colleagues
6Not at allRarelyOftenFairly oftenQuite often
Co
un
t
40
30
20
10
0
Company's DeviceOwn Device
Own Device or Company's
Device?
For personal organisation/admin and time management * Own Device or Comp any's Device?
Crosstab
Own Device or Company's
Device?
TotalCompany's
Device
For personal organisation/admin and time management
Quite often Count
Expected Count
Fairly often Count
Expected Count
Often Count
Expected Count
Rarely Count
Expected Count
Not at all Count
Expected Count
Total Count
Expected Count
32 32
32.0 32.0
22 22
22.0 22.0
25 25
25.0 25.0
20 20
20.0 20.0
8 8
8.0 8.0
107 107
107.0 107.0
Appendix E Participants’ frequency of putting the company’s device into non-workrelated use 177

For personal organisation/admin and time management
Not at allRarelyOftenFairly oftenQuite often
Co
un
t
40
30
20
10
0
For games, entertainment and relaxation * Own Device or Company's Device?
Crosstab
Own Device or Company's Device?
TotalOwn DeviceCompany's
Device
For games, entertainment and relaxation
Quite often Count
Expected Count
Fairly often Count
Expected Count
Often Count
Expected Count
Rarely Count
Expected Count
Not at all Count
Expected Count
Total Count
Expected Count
1 5 6
.1 5.9 6.0
0 4 4
.0 4.0 4.0
0 7 7
.1 6.9 7.0
0 44 44
.4 43.6 44.0
0 46 46
.4 45.6 46.0
1 106 107
1.0 106.0 107.0
Appendix E Participants’ frequency of putting the company’s device into non-workrelated use 178

For games, entertainment and relaxation
Not at allRarelyOftenFairly oftenQuite often
Co
un
t
50
40
30
20
10
0
Company's DeviceOwn Device
Own Device or Company's
Device?
To keep updated with general news and current affairs * Own Device or Company's Device?
Crosstab
Own Device or Company's Device?
TotalOwn DeviceCompany's
Device
To keep updated with general news and current affairs
Quite often Count
Expected Count
Fairly often Count
Expected Count
Often Count
Expected Count
Rarely Count
Expected Count
Not at all Count
Expected Count
Total Count
Expected Count
1 16 17
.2 16.8 17.0
0 21 21
.2 20.8 21.0
0 30 30
.3 29.7 30.0
0 30 30
.3 29.7 30.0
0 10 10
.1 9.9 10.0
1 107 108
1.0 107.0 108.0
Appendix E Participants’ frequency of putting the company’s device into non-workrelated use 179

Quite often Fairly often Often Rarely Not at all
To keep updated with general news and current affairs
Co
un
t
30
20
10
0
Company's DeviceOwn Device
Own Device or Company's
Device?
To keep updated with work related news and gossip. * Own Device or Company's Device?
Crosstab
Own Device or Company's Device?
TotalOwn DeviceCompany's
Device
To keep updated with work related news and gossip.
Quite often Count
Expected Count
Fairly often Count
Expected Count
Often Count
Expected Count
Rarely Count
Expected Count
Not at all Count
Expected Count
Total Count
Expected Count
1 22 23
.2 22.8 23.0
0 17 17
.2 16.8 17.0
0 27 27
.3 26.7 27.0
0 30 30
.3 29.7 30.0
0 10 10
.1 9.9 10.0
1 106 107
1.0 106.0 107.0
Appendix E Participants’ frequency of putting the company’s device into non-workrelated use 180

To keep updated with work related news and gossipNot at allRarelyOftenFairly oftenQuite often
Co
un
t
30
20
10
0
Company's DeviceOwn Device
Own Device or Company's
Device?
Appendix E Participants’ frequency of putting the company’s device into non-workrelated use 181

Appendix F
How often do participants use or access each of the social application
presented to them from mobile devices (Smartphone, tablet, etc.)
Please turn over to see how often participants use or access each of the social applications
presented to them from mobile devices (Smartphone, tablet, etc.)...
182

How often do you use or access each of the following applications from a mobile device (Smartphone, tablets, etc)?
Frequency Percent Valid PercentCumulative
Percent
Valid
0
MATRIX START
Total
22 11.0 11.0 11.0
1 .5 .5 11.5
177 88.5 88.5 100.0
200 100.0 100.0
Twitter/Yammer
Frequency Percent Valid PercentCumulative
Percent
Valid 0
At least once a day
Several times a day
At least once a week
several times a week
Never
Rarely
Total
Missing System
Total
1 .5 .6 .6
25 12.5 14.2 14.8
22 11.0 12.5 27.3
17 8.5 9.7 36.9
9 4.5 5.1 42.0
79 39.5 44.9 86.9
23 11.5 13.1 100.0
176 88.0 100.0
24 12.0
200 100.0
Frequency Percent Valid PercentCumulative
Percent
Valid At least once a day
Several times a day
At least once a week
several times a week
Never
Rarely
Total
Missing System
Total
40 20.0 22.9 22.9
54 27.0 30.9 53.7
17 8.5 9.7 63.4
9 4.5 5.1 68.6
41 20.5 23.4 92.0
14 7.0 8.0 100.0
175 87.5 100.0
25 12.5
200 100.0
Appendix F How often do participants use or access each of the social applicationpresented to them from mobile devices (Smartphone, tablet, etc.) 183

Frequency Percent Valid PercentCumulative
Percent
Valid At least once a day
Several times a day
At least once a week
several times a week
Never
Rarely
Total
Missing System
Total
30 15.0 17.0 17.0
54 27.0 30.7 47.7
15 7.5 8.5 56.3
9 4.5 5.1 61.4
57 28.5 32.4 93.8
11 5.5 6.3 100.0
176 88.0 100.0
24 12.0
200 100.0
Snapchat
Frequency Percent Valid PercentCumulative
Percent
Valid At least once a day
Several times a day
At least once a week
several times a week
Never
Rarely
Total
Missing System
Total
6 3.0 3.4 3.4
14 7.0 7.9 11.3
5 2.5 2.8 14.1
3 1.5 1.7 15.8
131 65.5 74.0 89.8
18 9.0 10.2 100.0
177 88.5 100.0
23 11.5
200 100.0
Skype
Frequency Percent Valid PercentCumulative
Percent
Valid At least once a day
Several times a day
At least once a week
several times a week
Never
Rarely
Total
Missing System
Total
14 7.0 7.9 7.9
14 7.0 7.9 15.8
38 19.0 21.5 37.3
10 5.0 5.6 42.9
41 20.5 23.2 66.1
60 30.0 33.9 100.0
177 88.5 100.0
23 11.5
200 100.0
Appendix F How often do participants use or access each of the social applicationpresented to them from mobile devices (Smartphone, tablet, etc.) 184

Frequency Percent Valid PercentCumulative
Percent
Valid At least once a day
Several times a day
At least once a week
several times a week
Never
Rarely
Total
Missing System
Total
48 24.0 27.1 27.1
110 55.0 62.1 89.3
8 4.0 4.5 93.8
4 2.0 2.3 96.0
6 3.0 3.4 99.4
1 .5 .6 100.0
177 88.5 100.0
23 11.5
200 100.0
Google+
Frequency Percent Valid PercentCumulative
Percent
Valid At least once a day
Several times a day
At least once a week
several times a week
Never
Rarely
Total
Missing System
Total
12 6.0 6.8 6.8
21 10.5 11.9 18.6
11 5.5 6.2 24.9
8 4.0 4.5 29.4
86 43.0 48.6 78.0
39 19.5 22.0 100.0
177 88.5 100.0
23 11.5
200 100.0
Appendix F How often do participants use or access each of the social applicationpresented to them from mobile devices (Smartphone, tablet, etc.) 185

Appendix G
A Sample of the Survey recruitment email
Please turn over to see a sample of the Survey recruitment email...
186

To: Mayne‐Reed B.
You forwarded this message on 16/08/2016 10:56.
Reply Reply All Forward
Please Help Complete Survey
Adetunji C.
02 June 2016 11:45
Hello,
I'm wondering if you could kindly help complete the following survey questionnaire please:
https://www.isurvey.soton.ac.uk/18380
The study is part of a PhD research into the use of mobile devices and applications for work purposes and yourresponses will contribute to an understanding of the impact of mobile devices and social applications onemployee engagement and knowledge sharing. This may in turn help organisations in optimising theirenterprise mobility and knowledge management strategies. The survey would take approximately 10 minutesand your responses are, by default, anonymous and confidential.
Thanking you for your kind help.
Regards,
Chris Adetunji@Christunji
XXXXXXXXXXXXXXXXXXXXX
Appendix G A Sample of the Survey recruitment email 187

Appendix H
A Copyright permission obtained from Emerald Insight
Please turn over to see a sample of the copyright permission obtained from Emerald
Insight...
188

FW: Keenan and Shiri (2009) Request for PermissionChris Tutill [[email protected]]Sent:01 March 2016 10:47To: Adetunji C.
Dear Chris,
Thank you for your email.
Please allow me to introduce myself, my name is Chris Tutill and I am the RightsExecutive here at Emerald.
With regards to your request, providing that the content is fully referenced and givescredit to the original publication, Emerald is happy for you to include it in yourdissertation.
Please note that should you wish to republish the content elsewhere (i.e. forcommercial purposes/in a journal, etc.), you will need to clear permission once more.
I wish you the best of luck with your dissertation.
Kind Regards, Chris Tutill Rights Executive | Emerald Group Publishing Limited Tel: +44 (0) 1274 785173 | Fax: +44 (0)1274 785200 [email protected]| www.emeraldinsight.com
Please consider the environment before printing this email
-----Original Message----- From: Adetunji C. [mailto:[email protected]] Sent: 27 February 2016 09:38 To: Permissions Cc: Leslie Carr Subject: Re: Keenan and Shiri (2009) - Request for Permission
Dear Sir/Madama,
I have found the best definition of some terms in (Keenan and Shiri, 2009)1 forsociability, social network theory, social network sites, and social websites.
As I found the author's definitions aptly and succinctly conveyed the meanings evenwithout resorting to the secondary sources, I would like to obtain your permission touse their definitions, with full and
appropriate attribution, in my ongoing PhD research thesis please.
Thanking you for your kind consideration.
Regards,
Chris Adetunji Web & Internet Science Research Group Building 32/4068 Electronics and Computer Science University of Southampton SO17 1BJ
Appendix H A Copyright permission obtained from Emerald Insight 189

1. Keenan, A., & Shiri, A. (2009). Sociability and social interaction on socialnetworking websites. Library Review, 58(6), 438–450. doi:10.1108/00242530910969794
Emerald Group Publishing Limited, Registered Office: Howard House, Wagon Lane, Bingley,BD16 1WA United Kingdom. Registered in England No. 3080506, VAT No. GB 665 3593 06
Appendix H A Copyright permission obtained from Emerald Insight 190
Bibliography
Ackoff, R. L. (1999), Wiley: Ackoff’s Best: His Classic Writings on Man-
agement - Russell L. Ackoff. Wiley, ISBN 978-0-471-31634-3, URL http:
//eu.wiley.com/WileyCDA/WileyTitle/productCd-0471316342.htmlhttp:
//faculty.ung.edu/kmelton/Documents/DataWisdom.pdf.
Adetunji, C. and Carr, L. (2016a), EMSoD — A conceptual social framework that
delivers KM values to corporate organizations. International Journal on Advances in
Software vol. 9, 3&4, p. 19, URL http://eprints.soton.ac.uk/404219/.
Adetunji, C. and Carr, L. (2016b), Knowledge Discovery from Social Media Data : A
Case of Public Twitter Data for SMEs. In 8th International Conference on Informa-
tion, Process and Knowledge Management (eKnow), pp. 119–125, IARIA XPS Press,
Venice, ISBN 9781612084725.
AKT Project (2006), Advanced Knowledge Technology. URL http://projects.kmi.
open.ac.uk/akt/about.html. (Last Accessed 05 May 2016).
Alavi, M. (1999), Knowledge Management Systems: Issues, Chanllenges and Ben-
efits. Communications of the Association for Information Systems vol. 1, pp. 1–
37, doi:10.1002/jhrm.20064, URL http://blog.ub.ac.id/izuaf/files/2013/11/
Knowledge-Management-Systems-ISSUES-CHALLENGES-AND-BENEFITS.pdf.
Alotaibi, H., Crowder, R. and Wills, G. (2013), Investigating Factors for Knowledge
Sharing Using Web Technologies. Proceedings of the 13th International Conference
on Knowledge Management and Knowledge Technologies - i-Know ’13 pp. 1–4, doi:
10.1145/2494188.2494230, URL http://dl.acm.org/citation.cfm?doid=2494188.
2494230.
Argyris, C. (1987), Seeking truth and actionable knowledge: How the scientific method
inhibits both. Philosophica vol. 40, pp. 5–21.
Argyris, C. (1993), Knowledge for action: a guide to overcoming barriers to organiza-
tional change. Jossey-Bass, ISBN 1555425194.
Argyris, C. (2005), Actionable Knowledge. Oxford University Press, doi:10.1093/
oxfordhb/9780199275250.003.0016, URL http://www.oxfordhandbooks.com/view/
10.1093/oxfordhb/9780199275250.001.0001/oxfordhb-9780199275250-e-16.
191

192 BIBLIOGRAPHY
Arling, P. a. and Chun, M. W. (2011), Facilitating new knowledge creation and obtaining
KM maturity. Journal of Knowledge Management vol. 15, 2, pp. 231–250, ISSN 1367-
3270, doi:10.1108/13673271111119673.
Armando, A., Costa, G. and Merlo, A. (2013), Bring your own device, securely. In
Proceedings of the 28th Annual ACM Symposium on Applied Computing - SAC ’13,
p. 1852, ISBN 9781450316569, ISSN 1746-5702, doi:10.1145/2480362.2480707, URL
http://dl.acm.org/citation.cfm?doid=2480362.2480707.
Arnett, G. (2016), UK became more middle class than working class in
2000, data shows. URL https://www.theguardian.com/news/datablog/2016/
feb/26/uk-more-middle-class-than-working-class-2000-data. [Last accessed
26/12/2017].
Avenue, H. (2004), Information Intelligence : Content Classification and the Enterprise
Taxonomy Practice. Delphi Group, Boston, ISBN 6172471511.
Ayyagari, M., Beck, T. and Demirguc-Kunt, A. (2007), Small and Medium Enterprises
Across the Globe. Small Business Economics vol. 29, 4, pp. 415–434, ISSN 0921-898X,
doi:10.1007/s11187-006-9002-5.
Baesens, B. (2004), ANALYTICS in a BIG DATA WORLD - The ESSENTIAL GUIDE
to DATA SCIENCE and its APPLICATIONS. John Wiley & Sons, Hoboken, ISBN
978-1-118-89270-1.
Bain, B. (2015), Top 10 Tools through the Years. URL http://www.bain.
com/publications/business-insights/management-tools-and-trends.
aspx%0Ahttp://www.bain.com/management_tools/BainTopTenTools/
default.asp. [Last Accessed 22/05/2017].
Baldock, J. (2015), World Autism Awareness Day 2015: 16
autism myths debunked. URL http://metro.co.uk/2015/04/02/
autism-sixteen-myths-debunked-5123051/. [Last Accessed 03 March 2016].
Banafa, A. (2014), Challenges and Trends in Enterprise Mobility Manage-
ment — Ahmed Banafa — LinkedIn. URL https://www.linkedin.com/
pulse/20140624054123-246665791-challenges-and-trends-in-enterprise-\
mobility-management. [Last Accessed 22/05/2017].
Becerra-Fernandez, I. and Rajiv, S. (2001), Organizational Knowledge Management:
A Contingency Perspective. JOURNAL OF MANAGEMENT INFORMATION SYS-
TEMS vol. 18, June, pp. 23–55, doi:10.1080/07421222.2001.11045676.
Beglar, D. and Nemoto, T. (2014), Developing Likert-scale questionnaires. JALT2013
Conference Proceedings pp. 1–8.

BIBLIOGRAPHY 193
Bellinger, G., Castro, D. and Mills, A. (2004), Data, Information, Knowledge, &
Wisdom. URL http://www.systems-thinking.org/dikw/dikw.htm. [Last Accessed
14/06/2016].
Berners-Lee, T. (2014), “internetlivestats.com/watch/websites/ recently passed a
billion websites by their count....” [Embedded Tweet]. URL http://www.
internetlivestats.com/. [Last accessed 29 Oct., 2017].
Berners-Lee, T. and Fischetti, M. (2000), Weaving the Web: The Original Design and
Ultimate Destiny of the World Wide Web. Harper Business, New York, 1st pbk ed
edn., ISBN 006251587X.
Bohringer, M. and Richter, A. (2009), Adopting social software to the in-
tranet: a case study on enterprise microblogging. In Proceedings of the 9th
Mensch & . . . , pp. 1–10, URL http://kooperationssysteme.de/docs/pubs/
BoehringerRichter2009-M&C-EnterpriseMicroblogging.pdf.
Bolisani, E. and Handzic, M., eds. (2015), Advances in Knowledge Management -
Celebrating Twenty Years of Research and Practice. Springer International Pub-
lishing, ISBN ISBN 978-3-319-09501-1, doi:10.1007/978-3-319-09501-1\ 7, URL
http://www.springer.com/business+&+management/business+information+
systems/book/978-3-319-09500-4.
Bowen, G. A. (2009), Document Analysis as a Qualitative Research Method. Qualitative
Research Journal vol. 9, 2, pp. 27–40, ISSN 1443-9883, doi:10.3316/QRJ0902027, URL
http://www.emeraldinsight.com/doi/10.3316/QRJ0902027.
Bradley, A. J. and McDonald, M. P. (2011), Social Media versus Knowledge Management
- HBR. URL https://hbr.org/2011/10/social-media-versus-knowledge.
Braun, V. and Clarke, V. (2006), Using thematic analysis in psychology. Qualita-
tive Research in Psychology vol. 3, 2, pp. 77–101, ISSN 1478-0887, doi:10.1191/
1478088706qp063oa, URL http://eprints.uwe.ac.uk/11735.
Bueno, E., Salmador, M. P. and Longo-Somoza, M. (2014), Advances in the identification
and measurement of Intellectual Capital and future developments in the Intellectual
Capital research agenda: experience of the Intellectus Model and proposal of a syn-
thetic index. Knowledge Management Research & Practice vol. 12, 3, pp. 339–349,
ISSN 1477-8238, doi:10.1057/kmrp.2014.11, URL http://www.palgrave-journals.
com/doifinder/10.1057/kmrp.2014.11.
Bulearca, M. and Bulearca, S. (2010), Twitter: a Viable Marketing Tool for SMEs?
Global Business and Management Research: An International Journal vol. 2,
4, URL http://www.gbmr.ioksp.com/pdf/BulearcaandBulearca,2010.pdf. [Last
Accessed 02 March 2016].

194 BIBLIOGRAPHY
Buregio, V., Meira, S. and Rosa, N. (2013), Social Machines : A Unified Paradigm to
Describe Social Web-Oriented Systems. International World Wide Web Conference
Committee (IW3C2) pp. 1–5.
Burnard, P. (1996), Teaching the analysis of textual data: An experiential ap-
proach. Nurse Education Today vol. 16, 4, pp. 278–281, ISSN 02606917, doi:
10.1016/S0260-6917(96)80115-8.
Business Dictionary (), Social Welfare. URL http://www.businessdictionary.com/
definition/social-welfare.html. [Accessed 15/10/2017.
Buttarelli, G. (2016), The EU GDPR as a clarion call for a
new global digital gold standard. International Data Privacy Law
vol. 6, 2, pp. 77–78, ISSN 2044-3994, doi:10.1093/idpl/ipw006,
URL https://watermark.silverchair.com/ipw006.pdf?token=
AQECAHi208BE49Ooan9kkhW_Ercy7Dm3ZL_9Cf3qfKAc485ysgAAAaAwggGcBgkqhkiG9w0BBwagggGNMIIBiQIBADCCAYIGCSqGSIb3DQEHATAeBglghkgBZQMEAS4wEQQMUvuBqpPH-Oqxkm9fAgEQgIIBU0691CIRLGeEVK3f_4SqjAv6dvbCIZp63RN3pXloc9Cb2lwi.
Cabiddu, F., Carlo, M. D. and Piccoli, G. (2014), Social media affordances: En-
abling customer engagement. Annals of Tourism Research vol. 48, pp. 175–192, ISSN
01607383, doi:10.1016/j.annals.2014.06.003, URL http://dx.doi.org/10.1016/j.
annals.2014.06.003.
Cameron, R. (2011), Mixed methods research: The five Ps framework. Electronic
Journal of Business Research Methods vol. 9, 2, pp. 96–108, ISSN 14777029, doi:
ISSN1477-7029.
Carr, L. and Harnad, S. (2011), Offloading cognition onto the Web. doi:10.1109/MIS.
2011.19〈http://dx.doi.org/10.1109/MIS.2011.19〉)., URL http://eprints.soton.
ac.uk/271030/1/lesdoc2.pdf.
Carr, L., Pope, C. and Halford, S. (2010), Could the Web be a temporary glitch? URL
http://eprints.soton.ac.uk/271032/5/glitch5.docx.
Chang, C.-C., Cheng-Chieh, W. and Chen, S.-C. (2014), The Influence of Bring Your
Own Device on the Psychological Climate at Workplace. Proceedings of the Six-
teenth International Conference on Electronic Commerce - ICEC ’14 pp. 9–16, doi:
10.1145/2617848.2617850, URL http://dl.acm.org/citation.cfm?doid=2617848.
2617850.
Chen, D. C. and Huang, H.-L. (2012), Knowledge creating theory in retrospect and
prospect. Knowledge Management Research & Practice vol. 11, 4, pp. 405–409, ISSN
1477-8238, doi:10.1057/kmrp.2012.37, URL http://www.palgrave-journals.com/
doifinder/10.1057/kmrp.2012.37.
Choices, N. (2015), Autism spectrum disorder - NHS Choices. URL http://www.nhs.
uk/Conditions/Autistic-spectrum-disorder/Pages/Introduction.aspx. [Last
Accessed 03 March 2016].

BIBLIOGRAPHY 195
Chou, T.-C. (2005), Internal learning climate, knowledge management process and per-
ceived knowledge management satisfaction. Journal of Information Science vol. 31,
4, pp. 283–296, ISSN 0165-5515, doi:10.1177/0165551505054171.
Christensen, C. M. (1997), The Innovator’s Dilemma - When New Technologies Cause
Great Firms to Fail. Harvard Business School Press, Boston, ISBN 0060521996,
doi:10.1515/9783110215519.82, URL https://finbuzzactu.files.wordpress.
com/2015/08/the-innovator-dilemma.pdfhttp://www.amazon.ca/exec/obidos/
redirect?tag=citeulike09-20&path=ASIN/0060521996.
Comm, J. (2010), Twitter Power 2.0: How to Dominate Your Market One Tweet at a
Time. John Wiley & Sons, Inc., Hoboken, ISBN 9780470563366.
Connelly, C. E., Ford, D. P., Turel, O., Gallupe, B. and Zweig, D. (2013), Im
busy (and competitive)! Antecedents of knowledge sharing under pressure. Knowl-
edge Management Research & Practice vol. 12, 1, pp. 74–85, ISSN 1477-8238, doi:
10.1057/kmrp.2012.61, URL http://www.palgrave-journals.com/doifinder/10.
1057/kmrp.2012.61.
Coviello, N. E. (2005), Integrating qualitative and quantitative techniques in net-
work analysis. Qualitative Market Research: An International Journal vol. 8,
1, pp. 39–60, doi:10.1108/13522750510575435, URL https://doi.org/10.1108/
13522750510575435.
Cross, R. and Sproull, L. (2004), More Than an Answer: Information Relationships for
Actionable Knowledge. Organization Science vol. 15, 4, pp. 446–462, ISSN 1047-7039,
doi:10.1287/orsc.1040.0075.
Cuzzocrea, A. (2014), Privacy and Security of Big Data. In Proceedings of the First
International Workshop on Privacy and Secuirty of Big Data - PSBD ’14, pp. 45–47,
ACM Press, New York, New York, USA, ISBN 9781450315838, doi:10.1145/2663715.
2669614, URL http://dl.acm.org/citation.cfm?id=2663715.2669614.
Dalmeyer, D. and Tsipis, K. (1997), Heaven and Earth:Vol. 16, USAS:Civilian Uses of
Near-Earth Space. Kluwer Law International, ISBN 9041102620.
Davenport, T. (2008), Enterprise 2.0: The New, New Knowledge Management? URL
https://hbr.org/2008/02/enterprise-20-the-new-new-know/.
Davenport, T. H. (1994), Saving IT’s Soul:Human-Centered
Information Management. URL https://hbr.org/1994/03/
saving-its-soul-human-centered-information-management. [Last Accessed
17/11/2017].
Davenport, T. H. and Prusak, L. (1998), Working Knowledge: How Organizations Man-
age what They Know, Part 247. Harvard Business Press, Boston, ISBN 0875846556,
URL http://books.google.com/books?hl=en&lr=&id=-4-7vmCVG5cC&pgis=1.

196 BIBLIOGRAPHY
Davenport, T. H. and Prusak, L. (2000), Working knowledge: How organizations manage
what they know. Ubiquity vol. 2000, August, ISSN 1530-2180, doi:10.1145/347634.
348775, URL http://doi.acm.org/10.1145/347634.348775.
Delic, K. A. and Riley, J. A. (2009), Enterprise Knowledge Clouds: Next Generation KM
Systems? 2009 International Conference on Information, Process, and Knowledge
Management pp. 49–53, doi:10.1109/eKNOW.2009.28, URL http://ieeexplore.
ieee.org/lpdocs/epic03/wrapper.htm?arnumber=4782564.
Drucker, P. F. (1969), The Knowledge Economy. In The Age of Discontinuity, chap. 12,
pp. 247–268, Elsevier Ltd., ISBN 978-0-434-90395-5, doi:10.1016/B978-0-434-90395-5.
50016-X, URL http://www.sciencedirect.com/science/book/9780434903955.
Drucker, P. F. (1994), Post-capitalist Society. Routledge, ISBN 0750620250, URL http:
//books.google.com/books?hl=en&lr=&id=IYVBmM5z69cC&pgis=1.
Dunne, C. and Shneiderman, B. (2013), Motif Simplification: Improving Network Vi-
sualization Readability with Fan, Connector, and Clique Glyphs. CHI ’13: Proc.
2013 international conference on Human Factors in Computing Systems pp. 3247–
3256, doi:10.1145/2470654.2466444, URL http://dl.acm.org/citation.cfm?id=
2466444&CFID=327519032&CFTOKEN=28595388.
Edvinsson, L. and Malone, M. (1997), Intellectual Capital: Realizing Your Company’s
True Value by Finding Its Hidden Brainpower. Collins, ISBN 0887308414.
Elsabbagh, M. et al. (2012), Global prevalence of autism and other pervasive develop-
mental disorders. Autism research : official journal of the International Society for
Autism Research vol. 5, 3, pp. 160–79, ISSN 1939-3806, doi:10.1002/aur.239.
Enterprise Mobility Exchange (2015), Global State of Enterprise Mobility
2015. Tech. rep., Enterprise Mobility Exchange, London, URL http://
www.enterprisemobilityexchange.com/downloadContent.cfm?ID=2879. [Last Ac-
cessed 07 Novembre 2015].
Enterprise Mobility Exchange (2016), Global State of Enterprise Mobility
2016. Tech. rep., Enterprise Mobility Exchange, London, URL http://eu.
enterprisemobilityexchange.com/media/1001912/59471.pdf. [last Accessed 13
March 2016].
Falls, J. (2012), Why Forums May Be the Most Powerful Social Media Channel for
Brands. URL http://www.entrepreneur.com/article/223493.
Fang, X. S. (2015), Generating Actionable Knowledge from Big Data. In Proceedings
of the 2015 ACM SIGMOD on PhD Symposium - SIGMOD ’15 PhD Symposium,
pp. 3–8, ACM Press, New York, New York, USA, ISBN 9781450335294, doi:10.1145/
2744680.2744687, URL http://dl.acm.org/citation.cfm?id=2744680.2744687.

BIBLIOGRAPHY 197
Fayyad, U., Piatetsky-Shapiro, G. and Smyth, P. (1996), From Data Mining to Knowl-
edge Discovery in Databases. AI Magazine vol. 17, 3, p. 37, ISSN 0738-4602, doi:
10.1609/aimag.v17i3.1230.
Fereday, J. and Muir-Cochrane, E. (2006), Demonstrating Rigor Using Thematic Analy-
sis: A Hybrid Approach of Inductive and Deductive Coding and Theme Development.
International Journal of Qualitative Methods vol. 5, 1, pp. 80–92, ISSN 1609-4069, doi:
10.1177/160940690600500107, URL http://journals.sagepub.com/doi/10.1177/
160940690600500107.
Financial Times (n.d.), Conceptual Framework Definition from Financial Times Lex-
icon. URL http://lexicon.ft.com/Term?term=conceptual-framework. [Last ac-
cessed 17/12/2017].
Fischer, E. and Reuber, A. R. (2011), Social interaction via new social media:
(How) can interactions on Twitter affect effectual thinking and behavior? Jour-
nal of Business Venturing vol. 26, 1, pp. 1–18, ISSN 08839026, doi:10.1016/
j.jbusvent.2010.09.002, URL http://www.sciencedirect.com/science/article/
pii/S0883902610000856.
Fleck, R., Cox, A. L. and Robison, R. A. V. (2015), Balancing Boundaries: Using
Multiple Devices to Manage Work-Life Balance. Proceedings of the ACM CHI’15
Conference on Human Factors in Computing Systems vol. 1, pp. 3985–3988, doi:
10.1145/2702123.2702386, URL http://dx.doi.org/10.1145/2702123.2702386.
Flyvbjerg, B. (2006), Five misunderstandings about case-study research. Qualitative
Inquiry vol. 12, 2, pp. 219–245, ISSN 10778004, doi:10.1177/1077800405284363.
Ford, D. P. and Mason, R. M. (2013a), A Multilevel Perspective of Tensions Be-
tween Knowledge Management and Social Media. Journal of Organizational Com-
puting and Electronic Commerce vol. 23, 1-2, pp. 7–33, ISSN 1091-9392, doi:
10.1080/10919392.2013.748604, URL http://www.tandfonline.com/doi/abs/10.
1080/10919392.2013.748604.
Ford, D. P. and Mason, R. M. (2013b), Knowledge Management and Social Media:
The Challenges and Benefits. Journal of Organizational Computing and Electronic
Commerce vol. 23, 1-2, pp. 1–6, ISSN 1091-9392, doi:10.1080/10919392.2013.748603,
URL http://www.tandfonline.com/doi/abs/10.1080/10919392.2013.748603.
Frawley, W. J., Piatetsky-shapiro, G. and Matheus, C. J. (1992), Knowledge Discovery
in Databases : An Overview. AI Magazine vol. 13, 3, pp. 57–70, ISSN 07384602,
doi:10.1609/aimag.v13i3.1011.
Freeman, L. C. (1977), A Set of Measures of Centrality Based on Betweenness. So-
ciometry vol. 40, 1, pp. 35–41, ISSN 00380431, doi:10.2307/3033543, URL http:
//www.jstor.org/stable/3033543?origin=crossref.

198 BIBLIOGRAPHY
Gaines, B. R. (2013), Knowledge acquisition: Past, present and future. International
Journal of Human-Computer Studies vol. 71, 2, pp. 135–156, ISSN 10715819, doi:10.
1016/j.ijhcs.2012.10.010, URL http://www.sciencedirect.com/science/article/
pii/S1071581912001620.
Gartner, W. B. (1985), A Conceptual Framework for Describing the Phenomenon of New
Venture Creation. Academy of Management Review vol. 10, 4, pp. 696–706, ISSN
0363-7425, doi:10.5465/AMR.1985.4279094, URL http://connection.ebscohost.
com/an/4279094.
Geer, J. G. (1991), Do Open-Ended Questions Measure “Salient” Issues? Public Opinion
Quarterly vol. 55, 3, p. 360, doi:10.1086/269268, URL https://academic.oup.com/
poq/article-lookup/doi/10.1086/269268.
Gettier, E. (1963), Edmund Gettier , Is Justified True Belief Knowledge ?. Analysis
vol. 23, c, pp. 444–446, ISSN 00032638, doi:10.2307/3326922.
Given, L. (2008), The Sage Encyclopedia of Qualitative Research Methods. Sage Ency-
clopedia p. 1072, ISSN 9781412941631, doi:10.4135/9781412963909.
Golbeck, J. (2015), Introduction to Social Media Investigation - A Hands-On Approach.
Elsevier Inc. (Syngress), Waltham, ISBN 9780128016565.
Griffiths, D., Jenkins, A. and Kingston-Griffiths, Z. (2015), The
2015 Global Knowledge Management Observatory Report. Tech.
rep., Juran Benchmarking, URL https://juranbenchmarking.com/
the-2015-global-knowledge-management-observatory-report/.
Griffiths, D. and Moon, B. (2011), The state of knowledge management A survey sug-
gests ways to attain more satisfied users. URL http://goo.gl/2bqHLB.
Gruman, G. (2007), IT Value Metrics: How to Communicate ROI to the Busi-
ness — CIO. URL http://www.cio.com/article/2437929/it-organization/
it-value-metrics--how-to-communicate-roi-to-the-business.html.
Gruzd, A. and Haythornthwaite, C. (2013), Enabling Community Through Social Media.
Journal of Medical Internet Research vol. 15, 10, ISSN 14388871, doi:10.2196/jmir.
2796, URL http://www.jmir.org/2013/10/e248/.
Guy, I., Avraham, U., Carmel, D., Ur, S., Jacovi, M. and Ronen, I. (2013), Mining
Expertise and Interests from Social Media. Proceedings of the 22nd international con-
ference on World Wide Web pp. 515–525.
Haefliger, S., Monteiro, E., Foray, D. and von Krogh, G. (2011), Social Software and
Strategy. Long Range Planning vol. 44, 5-6, pp. 297–316, ISSN 00246301, doi:10.
1016/j.lrp.2011.08.001, URL http://www.sciencedirect.com/science/article/
pii/S0024630111000410.
BIBLIOGRAPHY 199
Hall, W., Hendler, J., Shadbolt, N., Weitzner, D. J., Area, G. and Mountain, M. (2006),
This is the first report of time-dependent of these has changed when changes in only
track to realizing technological capabilities seismic tomography applied to an erupting
two quantities (V. Computer vol. 313, August, pp. 769–771.
Hansen, D., Shneiderman, B. and Smith, M. A. (2010), Analyzing Social Media Net-
works with NodeXL: Insights from a Connected World, vol. 8. Morgan Kaufmann,
Burlington, ISBN 9780123822291, URL http://www.amazon.com/dp/0123822297.
Hansen, D. L., Rotman, D., Bonsignore, E., Milic-Frayling, N., Rodrigues, E. M., Smith,
M. and Shneiderman, B. (2013), Do you know the way to SNA’: A process model for
analyzing and visualizing social media network data. In Proceedings of the 2012 ASE
International Conference on Social Informatics, SocialInformatics 2012, pp. 304–313,
IEEE Explore Digital Library, doi:10.1109/SocialInformatics.2012.26.
Haslinda, a. and Sarinah, a. (2009), A Review of Knowledge Management Models. The
Journal of International Social Research vol. 2, 9, pp. 187–198, ISSN 13079581.
Hemsley, J. and Mason, R. M. (2013), Knowledge and Knowledge Management in the
Social Media Age. Journal of Organizational Computing and Electronic Commerce
vol. 23, 1-2, pp. 138–167, ISSN 10919392, doi:10.1080/10919392.2013.748614.
Hendler, J. and Berners-Lee, T. (2010), From the Semantic Web to social machines:
A research challenge for AI on the World Wide Web. Artificial Intelligence vol. 174,
pp. 156–161, ISSN 00043702, doi:10.1016/j.artint.2009.11.010, URL http://dx.doi.
org/10.1016/j.artint.2009.11.010.
Hijikata, Y., Takenaka, T., Kusumura, Y. and Nishida, S. (2007), Interactive knowl-
edge externalization and combination for SECI model. In Proceedings of the 4th
international conference on Knowledge capture - K-CAP ’07, p. 151, ACM Press,
New York, New York, USA, ISBN 9781595936431, doi:10.1145/1298406.1298434, URL
http://dl.acm.org/citation.cfm?id=1298406.1298434.
Hitchcock, G. (2012), NHS warns staff over tablet security risks. URL
http://www.theguardian.com/government-computing-network/2012/jan/
13/nhs-tablet-security-warning.
Information Today (2017), KMWorld-2017 Conference Schedule. URL http://www.
kmworld.com/Conference/2017/Schedule.aspx. [Last accessed 20/09/2017].
Itai Himelboim, Marc A. Smith, Lee Rainie, Ben Shneiderman and Camila Espina
(2017), Classifying Twitter Topic-Networks Using Social Network Analysis. Social
Media + Society pp. 1–13, ISSN 2056-3051, doi:10.1177/2056305117691545, URL
https://doi.org/10.1177/2056305117691545.

200 BIBLIOGRAPHY
Jackson, T., Dawson, R. and Wilson, D. (2001), The cost of email interruption.
Journal of Systems and Information Technology vol. 5, 1, pp. 81–92, ISSN 1328-
7265, doi:10.1108/13287260180000760, URL http://www.emeraldinsight.com/doi/
10.1108/13287260180000760.
James Hendler, Nigel Shadbolt, W. H., Tim Berners-Lee and Weitzner, D. (2008), Web
science : an interdisciplinary approach to understanding. Communications of the Acm
vol. 51, 7, pp. 60–69, ISSN 00010782, doi:10.1145/1364782.1364798.
Jarrahi, M. H. and Sawyer, S. (2013), Social Technologies, Informal Knowledge Practices,
and the Enterprise. Journal of Organizational Computing and Electronic Commerce
vol. 23, 1-2, pp. 110–137, ISSN 1091-9392, doi:10.1080/10919392.2013.748613, URL
http://www.tandfonline.com/doi/abs/10.1080/10919392.2013.748613.
Jick, T. D. (1979), Mixing Qualitative and Quantitative Methods: Triangulation in
Action. Source: Administrative Science Quarterly Qualitative Methodology vol. 24, 4,
pp. 602–611, URL http://www.jstor.org/stable/2392366http://about.jstor.
org/terms.
Johnson, R. B. and Onwuegbuzie, A. J. (2004), Mixed Methods Research: A Research
Paradigm Whose Time Has Come. Educational Researcher vol. 33, 7, pp. 14–26,
ISSN 0013-189X, doi:10.3102/0013189X033007014, URL http://edr.sagepub.com/
cgi/doi/10.3102/0013189X033007014.
Kalsnes, B., Krumsvik, A. H. and Storsul, T. (2014), Social media as a political
backchannel. Aslib Journal of Information Management vol. 66, 3, pp. 313–328, ISSN
2050-3806, doi:10.1108/AJIM-09-2013-0093, URL http://www.emeraldinsight.
com/doi/abs/10.1108/AJIM-09-2013-0093http://www.emeraldinsight.com.
proxy.uba.uva.nl:2048/doi/abs/10.1108/AJIM-09-2013-0093.
Kaplan, Bonnie and Duchon, D. (1988), Combining Qualitative and Quantitative Meth-
ods in Information Systems A Case Study1. MIS quarterly vol. 12, 4, pp. 571–586,
URL http://www.jstor.org/stable/249133http://about.jstor.org/terms.
Kaplan, A. M. and Haenlein, M. (2010), Users of the world, unite! The challenges
and opportunities of Social Media. Business Horizons vol. 53, 1, pp. 59–68, ISSN
00076813, doi:10.1016/j.bushor.2009.09.003.
Keenan, A. and Shiri, A. (2009), Sociability and social interaction on social network-
ing websites. Library Review vol. 58, 6, pp. 438–450, ISSN 0024-2535, doi:10.1108/
00242530910969794, URL http://www.emeraldinsight.com/doi/full/10.1108/
00242530910969794.
Kelley, K., Clark, B., Brown, V. and Sitzia, J. (2016), Good practice in the conduct and
reporting of survey research. International Journal for Quality in Health Care vol. 15,
March, pp. 261–266.

BIBLIOGRAPHY 201
Kietzmann, J., Plangger, K., Eaton, B., Heilgenberg, K., Pitt, L. and Berthon, P.
(2013), Mobility at work. The Journal of Strategic Information Systems vol. 22,
4, pp. 282–297, ISSN 09638687, doi:10.1016/j.jsis.2013.03.003, URL http://www.
sciencedirect.com/science/article/pii/S0963868713000395.
King, W., Jr, P. M. and McCoy, S. (2002), The most important issues in knowledge
management. Communications of the ACM vol. 45, 9, pp. 93–97, URL http://dl.
acm.org/citation.cfm?id=567505.
Kirsimarja, B. and Aino, K. (2004), Knowledge-Based View of the Firm Theoretical
Notions and Implications for Management. Tech. Rep. 1996, Lappeenranta University
of Technology.
Kleek, M. and O’Hara, K. (2013), The Future of Social is Personal: The Potential of
the Personal Data Store. URL http://eprints.soton.ac.uk/363518/1/pds.pdf.
Koenig, M. E. D. (2012), What is KM? Knowledge Management Ex-
plained. URL http://www.kmworld.com/Articles/Editorial/What-Is-...
/What-is-KM-Knowledge-Management-Explained-82405.aspx.
Koller, T. (1994), What is value-based management? The McKinsey Quarterly
pp. 87–102, ISSN 00475394, URL http://go.galegroup.com/ps/i.do?id=
GALE%7CA16474462&sid=googleScholar&v=2.1&it=r&linkaccess=
fulltext&issn=00475394&p=AONE&sw=w.
Koren, Y., North, S. C. and Volinsky, C. (2007), Measuring and extracting proximity
graphs in networks. ACM Transactions on Knowledge Discovery from Data vol. 1, 3,
pp. 12–es, ISSN 15564681, doi:10.1145/1297332.1297336, URL http://dl.acm.org/
citation.cfm?id=1297332.1297336.
Kothari, C. R. (2004), Research Methodology: Methods & Techniques. New Age Inter-
national (P) Ltd, ISBN 9788122424881, doi:10.1017/CBO9781107415324.004.
Kumar, K. S., Arasu, R. and Nagarajan, S. (2014), The Impact of Employee Engagement
on Employee Empowerment. Tech. Rep. May, Harvard Business Review, doi:10.15373/
2249555X/MAR2014/72.
Kwak, S. G. and Kim, J. H. (2017), Central limit theorem: The cornerstone of
modern statistics. Korean Journal of Anesthesiology vol. 70, 2, pp. 144–156, ISSN
20057563, doi:10.4097/kjae.2017.70.2.144, URL https://synapse.koreamed.org/
Synapse/Data/PDFData/0011KJAE/kjae-70-144.pdf.
Labuschagne, A. (2003), The Qualitative Report Qualitative Research -Airy Fairy
or Fundamental? The Qualitative Report vol. 8, 1, pp. 100–103, ISSN 1052-
0147, URL http://nsuworks.nova.edu/tqr%5Cnhttp://nsuworks.nova.edu/
tqr/vol8/iss1/7.

202 BIBLIOGRAPHY
Lamont, J. (2012), Big data has big implications for knowledge management. KM-
World vol. 21, 4, URL http://www.kmworld.com/Articles/Editorial/Features/
Big-data-has-big-implications-for-knowledge-management-81440.aspx.
Langefors, B. (1987), Distinction between data and information/knowledge. Inf. Age
vol. 9, 2, pp. 89–91, ISSN 0261-4103, URL http://dl.acm.org/citation.cfm?id=
29518.29523.
Langville, A. N. and Meyer, C. D. (2006), Google’s PageRank and Beyond: The Science
of Search Engine Rankings. (eBook and Paperback). Princeton University Press, ISBN
9780691152660, URL http://press.princeton.edu/titles/8216.html.
Liao, T. W. and Triantaphyllou, E. (2008), Recent Advances in Data Mining of Enter-
prise Data: Algorithms and Applications. World Scientific, ISBN 9812779868, URL
https://books.google.com/books?id=2VA-AROSAsoC&pgis=1.
Lim, K. W. and Buntine, W. (2014), Twitter Opinion Topic Model. In Proceed-
ings of the 23rd ACM International Conference on Conference on Information and
Knowledge Management - CIKM ’14, pp. 1319–1328, ACM Press, New York, New
York, USA, ISBN 9781450325981, doi:10.1145/2661829.2662005, URL http://dl.
acm.org/citation.cfm?id=2661829.2662005.
Lin, C. and He, Y. (2009), Joint sentiment/topic model for sentiment analysis.
In Proceeding of the 18th ACM conference on Information and knowledge man-
agement - CIKM ’09, p. 375, ACM Press, New York, New York, USA, ISBN
9781605585123, doi:10.1145/1645953.1646003, URL http://dl.acm.org/citation.
cfm?id=1645953.1646003.
Littlejohn, A. and Margaryan, A., eds. (2013), Technology-enhanced Professional Learn-
ing: Processes, Practices, and Tools. Routledge, ISBN 1135011133, URL http:
//books.google.com/books?hl=en&lr=&id=2SnjAQAAQBAJ&pgis=1.
Lorentzen, D. G. (2014), Polarisation in political Twitter conversations. Aslib
Journal of Information Management vol. 66, 3, pp. 329–341, ISSN 2050-3806, doi:
10.1108/AJIM-09-2013-0086, URL http://www.emeraldinsight.com/doi/abs/10.
1108/AJIM-09-2013-0086http://www.emeraldinsight.com.proxy.uba.uva.nl:
2048/doi/abs/10.1108/AJIM-09-2013-0086.
Loughborough University (2013), Inaugural Lecture: Professor Ray Dawson.
URL https://www.youtube.com/watch?v=OapJPKL2UvY&t=1531s. [Last accessed
23/12/2017].
Mackenzie, N. and Knipe, S. (2006), Research Dilemmas: Paradigms, methods and
methodology. Issues in Educational Research vol. 16, URL http://www.iier.org.
au/iier16/mackenzie.html.

BIBLIOGRAPHY 203
Mallis, L. (2009), Birth of the DIAD — Upside Blog. URL http://blog.ups.com/
2009/12/07/birth-of-the-diad/. [Last Accessed 15 March 2016].
Marr, B. (2014), Employee Engagement Level. In 25 Need-to-Know Key Performance
Indicators, chap. 22, pp. 151 – 157, Pearson Education Ltd., Harlow, 1st edn., ISBN
978-1-292-01647-4.
Martın-de Castro, G. (2014), Intellectual capital and the firm: some remaining questions
and prospects. Knowledge Management Research & Practice vol. 12, 3, pp. 239–245,
ISSN 1477-8238, doi:10.1057/kmrp.2014.13, URL http://www.palgrave-journals.
com/doifinder/10.1057/kmrp.2014.13.
McAfee, A. P. (2006), Enterprise 2 . 0 : The Dawn of Emergent Collaboration. MIT
Sloan Management Review vol. 47, 3, pp. 21–28, ISSN 0360-8581, doi:10.1109/EMR.
2006.261380.
McDermott, R. (1999), Why Information Technology Inspired But Cannot Deliver
Knowledge Management. California Management Review vol. 41, 4, pp. 103–117,
ISSN 00081256, doi:10.2307/41166012, URL http://cmr.ucpress.edu/content/41/
4/103.abstract.
McIver, D. and Wang, X. (2016), Measuring knowledge in organizations: a knowledge-
in-practice approach. Journal of Knowledge Management vol. 20, 4.
Melnyk, S. A., Stewart, D. M. and Swink, M. (2004), Metrics and performance measure-
ment in operations management: dealing with the metrics maze. Journal of Operations
Management vol. 22, 3, pp. 209–218, ISSN 02726963, doi:10.1016/j.jom.2004.01.004.
Mertens, D. M. and Hesse-Biber, S. (2012), Editorial: Triangulation and Mixed Methods
Research Provocative Positions. Journal of Mixed Methods Research vol. 6, 2, pp. 75–
79, ISSN 1558-6898, doi:10.1177/1558689812437100.
Michael Treacy and Fred Wiersema (1993), Customer Intimacy
and Other Value Disciplines. URL https://hbr.org/1993/01/
customer-intimacy-and-other-value-disciplines. [Last Accessed 26/11/2017].
Michaelidou, N., Siamagka, N. T. and Christodoulides, G. (2011), Usage, barri-
ers and measurement of social media marketing: An exploratory investigation of
small and medium B2B brands. Industrial Marketing Management vol. 40, 7, pp.
1153–1159, ISSN 00198501, doi:10.1016/j.indmarman.2011.09.009, URL http://www.
sciencedirect.com/science/article/pii/S0019850111001374. [Last Accessed 01
March 2016].
Microsoft, E. M. T. (2015), Looking Back and Moving Forward with Enterprise Mobility
Suite - Beyond the BYOD Scenario - Enterprise Mobility - Site Home - TechNet Blogs.
URL http://goo.gl/TOX3EQ. [Last Accessed 07 March 2016].

204 BIBLIOGRAPHY
Miles, M. B. and Huberman, A. M. (1994), Qualitative Data Analysis - An Expanded
Sourcebook. Sage Publications Inc., London, 2nd ed. edn., ISBN 0803946538.
Miller, M., Marks, A., DeCoulode, M., Hagel, J., Brown, J. S. and Kula-
sooriya, D. (2011), Social software for business performance The missing link
in social software: Measurable business performance improvements. Deloitte Cen-
ter for the Edge ISSN 08976007, URL http://www.edgeperspectives.com/
socialsoftwareperformance.pdf.
Milliken, G. (2014), The Paperless Office: 30-Year Old Pipe-
Dream? URL https://www.wired.com/insights/2014/01/
paperless-office-30-year-old-pipe-dream/. [Last Accessed 14-01-2017].
Moore, G. E. (1998), Cramming more components onto integrated circuits. Proceedings
of the IEEE vol. 86, 1, pp. 82–85, ISSN 00189219, doi:10.1109/JPROC.1998.658762.
Morgan, D. L. (2014), Pragmatism as a Paradigm for Social Research. Qualitative In-
quiry vol. 20, 8, pp. 1045–1053, ISSN 1077-8004, doi:10.1177/1077800413513733, URL
http://journals.sagepub.com/doi/10.1177/1077800413513733.
Murthy, D. (2013), Twitter: Social Communication in the Twitter Age. Polity Press,
Cambridge, ISBN 978-0-7456-6510-8.
Nam, T. (2013), Technology Use and Work-Life Balance. Applied Research in Quality
of Life vol. 9, 4, pp. 1017–1040, ISSN 18712576, doi:10.1007/s11482-013-9283-1.
National Audit Office (2010), Analytical framework for assessing Value for
Money. Tech. Rep. Step 6, National Audit Office, URL http://www.
bond.org.uk/data/files/National_Audit_Office__Analytical\
_framework_for_assessing_Value_for_Money.pdf. [Last Accessed
07 March 2016].
Nonaka, I. and Takeuchi, H. (1995), The Knowledge-creating Company: How Japanese
Companies Create the Dynamics of Innovation. Oxford University Press, ISBN
0195092694, URL http://books.google.com/books?id=B-qxrPaU1-MC&pgis=1.
Noor, K. B. M. (2008), Case study: A strategic research methodology. American Journal
of Applied Sciences vol. 5, 11, pp. 1602–1604, ISSN 15469239, doi:10.3844/ajassp.2008.
1602.1604.
Notify Technology (2015), Enterprise Mobility Management. Tech. rep.,
Notify Technology, URL http://www.notifycorp.com/solutions/
enterprise-mobility-management. [Last Accessed 22/05/2017].
Olsen, W. (2004), Triangulation in Social Research: Qualitative and Quantitative Meth-
ods Can Really Be Mixed. In Developments in Sociology, pp. 1–30, Causeway Press,
Ormskirk, ISBN 1902796829, doi:10.1002/jhbs.20022.

BIBLIOGRAPHY 205
Omitola, T., Davies, J., Duke, A., Glaser, H. and Shadbolt, N. (2014), Linking So-
cial, Open, and Enterprise Data. In Proceedings of the 4th International Conference
on Web Intelligence, Mining and Semantics (WIMS14) - WIMS ’14, pp. 1–8, ISBN
9781450325387, doi:10.1145/2611040.2611086, URL http://dl.acm.org/citation.
cfm?id=2611040.2611086.
O’Reilly, T. (2005), What Is Web 2.0 -. URL http://www.oreilly.com/pub/a/web2/
archive/what-is-web-20.html.
Peinl, R. (2011), Knowledge management instruments. Proceedings of the 11th Inter-
national Conference on Knowledge Management and Knowledge Technologies - i-
KNOW ’11 p. 1, doi:10.1145/2024288.2024333, URL http://dl.acm.org/citation.
cfm?doid=2024288.2024333.
Perreault, W. D. and Jr. (1975), Controlling Order-Effect Bias. The Public Opinion
Quarterly vol. 39, pp. 544–551, doi:10.2307/2748507, URL http://www.jstor.org/
stable/2748507.
Piccoli, G. (2008), Information Systems for Managers: Texts & Cases. John Wiley
& Sons, Hoboken, ISBN 9780470087039, URL http://www.goodreads.com/book/
show/2673840-information-systems-for-managers.
Polanyi, M. (2009), The Tacit Dimension. University of Chicago Press, ISBN
0226672980.
Porter, M. E. (2010), What Is Value in Health Care? New England Journal of Medicine
pp. 2477–2481, ISSN 15334406, doi:10.1056/NEJMp1002530.
Porterfield, A. (2011), 9 Companies Doing Social Media
Right and Why. URL http://www.socialmediaexaminer.com/
9-companies-doing-social-media-right-and-why/. [Last Accessed 02 March
2016].
Posner, L. (2009), Actionable Knowledge. URL http://www.idra.
org/idra_newsletter/august_2009_actionable_knowledge/
actionable_knowledge/. [Last Accessed 07 March 20167].
Powell, W. W. and Snellman, K. (2004), The Knowledge Economy. Annual Review of
Sociology vol. 30, 1, pp. 199–220, ISSN 0360-0572, doi:10.1146/annurev.soc.29.010202.
100037.
Pritchard, D. (2009), KNOWLEDGE. In Central Issues of Philosophy, edited by Shand,
J., pp. 1–16, Wiley - Blackwell, Oxford, ISBN 1405162708.
QSR International (n.d.), What is NVivo? URL http://www.qsrinternational.com/
what-is-nvivo. (Last Accessed 23/04/2017).

206 BIBLIOGRAPHY
Razmerita, L., Kirchner, K. and Nabeth, T. (2014), Social Media in Organiza-
tions: Leveraging Personal and Collective Knowledge Processes. Journal of Orga-
nizational Computing and Electronic Commerce vol. 24, 1, pp. 74–93, ISSN 1091-
9392, doi:10.1080/10919392.2014.866504, URL http://www.tandfonline.com/doi/
abs/10.1080/10919392.2014.866504.
Rossi, L. and Magnani, M. (2012), Conversation practices and network structure in
Twitter. Proceedings of the Sixth International AAAI Conference on Weblogs and
Social Media p. 4.
Rowley, J. (2007), The wisdom hierarchy: representations of the DIKW hier-
archy. Journal of Information Science vol. 33, 2, pp. 163–180, ISSN 0165-
5515, doi:10.1177/0165551506070706, URL http://journals.sagepub.com/doi/
10.1177/0165551506070706.
Royal Literary Fund (n.d.), What is a literature review? URL https://www.rlf.org.
uk/resources/what-is-a-literature-review/. [Last Accessed 17/12/2017].
Ruhnau, B. (2000), Eigenvector-centrality a node-centrality? Social Networks vol. 22,
pp. 357–365, ISSN 03788733, doi:10.1016/S0378-8733(00)00031-9, URL http://www.
sciencedirect.com/science/article/pii/S0378873300000319#.
Rumsey, D. (2010), Statistics Essentials for Dummies. Wiley Publishing, Inc., Hoboken,
ISBN 13: 9780470618394.
Russell, M. A. (2013), Mining the Social Web, 2nd Edition - O’Reilly Media. O’Reilly
Media, ISBN 978-1-4493-6761-9.
Sankar, K. and Bouchard, S. A. (2009), Enterprise Web 2.0 Fundamentals.
Cisco Press, ISBN 1587058987, URL https://books.google.com/books?id=4_
wzVwQYSQMC&pgis=1.
Schreiber, G. (2013), Knowledge acquisition and the web. International Journal of
Human-Computer Studies vol. 71, 2, pp. 206–210, ISSN 10715819, doi:10.1016/
j.ijhcs.2012.10.001, URL http://www.sciencedirect.com/science/article/pii/
S107158191200153X.
Schumaker, R. (2011), From Data to Wisdom: The Progression of Computational
Learning in Text Mining. Communications of the IIMA vol. 11, 1, pp. 1–14, URL
http://robschumaker.com/publications/IIMA-FromDatatoWisdom.pdf.
Scott, J. (2013), Companies more comfortable with choose your own
device’. URL http://www.computerweekly.com/news/2240206442/
Companies-feel-comfort-with-choose-your-own-device. (Last Accessed 12
May 2016).

BIBLIOGRAPHY 207
Seuring, S. and Muller, M. (2008), From a literature review to a conceptual framework
for sustainable supply chain management. Journal of Cleaner Production vol. 16, 15,
pp. 1699–1710, ISSN 09596526, doi:10.1016/j.jclepro.2008.04.020.
Shadbolt, N. (2013), Knowledge acquisition and the rise of social machines. International
Journal of Human-Computer Studies vol. 71, 2, pp. 200–205, ISSN 10715819, doi:10.
1016/j.ijhcs.2012.10.008, URL http://www.sciencedirect.com/science/article/
pii/S1071581912001607.
Shadbolt, N. and Smart, P. (2015), Knowledge elicitation: Methods, tools and tech-
niques. In Evaluation of Human Work, Fourth Edition, edited by Wilson, J. R. and
Sharples, S., p. 43, CRC Press, ISBN 1466559616, URL http://eprints.soton.ac.
uk/359638/1/KnowledgeElicitationv7.pdf.
Shadbolt, N., Smith, D., Simperl, E., Kleek, M. V., Yang, Y. and Hall, W. (2013),
Towards a classification framework for social machines. Proceedings of the . . . pp.
905–911, URL http://dl.acm.org/citation.cfm?id=2488078.
Shields, P. M. and Rangarajan, N. (2013), A Playbook for Research Methods: Inte-
grating Conceptual Frameworks and Project Management. New Forums Press, ISBN
1581072473, URL http://books.google.com/books?id=tVYbAgAAQBAJ&pgis=1.
Simuforosa, M. and Wiseman, M. (2015), A Guide to Conducting Research. Strategic
Book Publishing & Rights Agency, LLC, ISBN 9781681810874, URL https://books.
google.co.uk/books?id=GFyoCwAAQBAJ.
Smart, P. R. and Shadbolt, N. R. (2014), Social Machines. In Encyclopedia of Informa-
tion Science and Technology, edited by Khosrow-Pour, M., IGI Global, Pennsylvania,
URL http://eprints.soton.ac.uk/361399/1/SocialMachinesv8.pdf.
Smart, P. R., Simperl, E. and Shadbolt, N. (2014), A Taxonomic Frame-
work for Social Machines. URL http://eprints.soton.ac.uk/362359/1/
SOCIAMClassificationv2.pdf.
Smart Survey (2017), Advantages of Using Likert Scale Ques-
tions - SmartSurvey Blog. URL https://blog.smartsurvey.co.uk/
advantages-of-using-likert-scale-questions/.
Smith, M. A., Raine, L., Shneiderman, B. and Himelboim, I. (2014), How we analyzed
Twitter social media networks with NodeXL. Tech. rep., Pew Research Center, URL
www.pewresearch.org.
Sorensen, C. (2011), Enterprise Mobility. Work and Globalization Se-
ries, Palgrave URL http://digitalinfrastructures.org/publications/
Sorensen2012-CS-ChapterPreprint.pdfhttp://www.digitalinfrastructures.
org/Publications.html.

208 BIBLIOGRAPHY
Sørensen, C., Al-Taitoon, A., Kietzmann, J., Pica, D., Wiredu, G., Elaluf-Calderwood,
S., Boateng, K., Kakihara, M. and Gibson, D. (2008), Exploring enterprise mobil-
ity: Lessons from the field - Information, Knowledge, Systems Management - Vol-
ume 7, Number 1-2 / 2008 - IOS Press. Information, Knowledge, Systems Man-
agement vol. 7, 1-2, pp. 243–271, URL http://iospress.metapress.com/content/
8w600387r5160m80/.
Soto-Acosta, P., Colomo-Palacios, R. and Popa, S. (2013), Web knowledge shar-
ing and its effect on innovation: an empirical investigation in SMEs. Knowledge
Management Research & Practice vol. 12, 1, pp. 103–113, ISSN 1477-8238, doi:
10.1057/kmrp.2013.31, URL http://www.palgrave-journals.com/doifinder/10.
1057/kmrp.2013.31.
Sousa, F., Aparicio, M. and Costa, C. J. (2010), Organizational wiki as a knowledge man-
agement tool. In Proceedings of the 28th ACM International Conference on Design of
Communication - SIGDOC ’10, p. 33, ACM Press, New York, New York, USA, ISBN
9781450304030, doi:10.1145/1878450.1878457, URL http://dl.acm.org/citation.
cfm?id=1878450.1878457.
Sousa, N., Costa, C. J. and Aparicio, M. (2013), IO-SECI. In Proceedings of the
Workshop on Open Source and Design of Communication - OSDOC ’13, pp. 9–17,
ACM Press, New York, New York, USA, ISBN 9781450322553, doi:10.1145/2503848.
2503850, URL http://dl.acm.org/citation.cfm?id=2503848.2503850.
Stavert, B. (2013), Bring your own device (BYOD) in schools. Tech. rep.,
State of NSW, Dept. of Education and Communities, URL https:
//www.det.nsw.edu.au/policies/technology/computers/mobile-device/
BYOD_2013_Literature_Review.pdf.
Tardanico, S. (2012), Is Social Media Sabotaging Real Communication? -
Forbes. URL http://www.forbes.com/sites/susantardanico/2012/04/30/
is-social-media-sabotaging-real-communication/#3ce39f254fd8.
Tax Credits Row (2015), Tax Credits Row: What Will Happen
Now After Government Defeat? URL https://uk.news.yahoo.com/
tax-credits-row-happen-now-100031983.html. [Last Accessed 29 February
2016].
Terra, J. and Angeloni, T. (2003), Understanding the difference between in-
formation management and knowledge management. KM Advantage pp.
1–9, URL http://biblioteca.terraforum.com.br/BibliotecaArtigo/
libdoc00000013v002Understandingthedifferencebetweeninfom.pdf.

BIBLIOGRAPHY 209
Tinati, R. and Carr, L. (2012), Understanding Social Machines. In 2012 Interna-
tional Conference on Privacy, Security, Risk and Trust and 2012 International Con-
fernece on Social Computing, pp. 975–976, IEEE, ISBN 978-1-4673-5638-1, doi:
10.1109/SocialCom-PASSAT.2012.25, URL http://www.mendeley.com/research/
understanding-social-machines/.
Tiropanis, T., Hall, W., Crowcroft, J., Contractor, N. and Tassiulas, L. (2015), Network
science, web science, and internet science. Communications of the ACM vol. 58, 8, pp.
76–82, ISSN 00010782, doi:10.1145/2699416, URL http://dl.acm.org/ft_gateway.
cfm?id=2699416&type=html.
Trant, J. (2009), Studying social tagging and folksonomy: A review and framework.
Journal of Digital Information vol. 10, 1, pp. 1–44, ISSN 13687506.
Turban, E., Bolloju, N. and Liang, T.-P. (2011a), Enterprise Social Networking:
Opportunities, Adoption, and Risk Mitigation. Journal of Organizational Com-
puting and Electronic Commerce vol. 21, 3, pp. 202–220, ISSN 1091-9392, doi:
10.1080/10919392.2011.590109, URL http://www.tandfonline.com/doi/abs/10.
1080/10919392.2011.590109.
Turban, E., Sharda, R. and Delen, D. (2011b), Decision Support and Business Intelli-
gence Systems. Dorling Kindersly (India) Pvt, Ltd., 9th ed. edn., ISBN 978-81-317-
6109-0.
University of Southampton (2016), Our staff — University of Southampton. URL http:
//www.southampton.ac.uk/about/our-people/staff.page. (Last Accessed 31 Jan
2017).
Vanini, U. and Bochert, S. (2014), ISSUU - An empirical Investigation of Matu-
rity Levels in Knowledge Management by Academic Conferences International.
Electronic Journal of Knowledge Mangement vol. 12, 4, URL http://issuu.
com/academic-conferences.org/docs/ejkm-volume12-issue4-article576?e=
1257060/11330928.
Vayrynen, K., Hekkala, R. and Liias, T. (2013), Knowledge Protection Challenges
of Social Media Encountered by Organizations. Journal of Organizational Com-
puting and Electronic Commerce vol. 23, 1-2, pp. 34–55, ISSN 1091-9392, doi:
10.1080/10919392.2013.748607, URL http://www.tandfonline.com/doi/abs/10.
1080/10919392.2013.748607.
Vestal, W. (2002), Measuring Knowledge Management. In Symposium: A Quarterly
Journal In Modern Foreign Literatures, pp. 1–6, APQC.
Vorakulpipat, C. (2014), Managing Mobile Device Security in Critical Infrastructure
Sectors. Proceedings of the 7th International Conference on Security of Information
and Networks p. 65, doi:10.1145/2659651.2659742.

210 BIBLIOGRAPHY
Wal, T. V. (2007), Folksonomy Coinage and Definition. URL http://vanderwal.
net/folksonomy.htmlhttps://web.archive.org/web/20040828035712/http://
atomiq.org/archives/2004/08/folksonomy_social_classification.html.
Wasserman, S. and Faust, K. (2012), Social Network Analysis: Methods and Applica-
tions. Cambridge University Press, ISBN 9780511251764.
Web Science Institute — University of Southampton (), What is Web Science?
URL https://www.southampton.ac.uk/wsi/about/what_is_web_science.
page?
Webster, J. and Watson, R. T. (2002), Analyzing the Past to Prepare for the Future:
Writing a Literature Review. MIS Quarterly vol. 26, 2, URL https://www.rlf.org.
uk/resources/what-is-a-literature-review/.
Weisstein, E. W. (2017), Turing machine. URL http://mathworld.wolfram.com/
TuringMachine.html. (Last Accessed 30/03/2017).
White, T. (2013), Why Social Media Isn’t Social. URL http://www.huffingtonpost.
com/thomas-white/why-social-media-isnt-social_b_3858576.html.
Whittemore, R. and Knafl, K. (2005), The integrative review: Updated methodology.
Journal of Advanced Nursing vol. 52, 5, pp. 546–553, ISSN 03092402, doi:10.1111/j.
1365-2648.2005.03621.x.
Wiig, K. M. (1997), Knowledge management: Where did it come from and where will
it go? Expert Systems with Applications vol. 13, 1, pp. 1–14, ISSN 09574174, doi:
10.1016/S0957-4174(97)00018-3, URL http://www.sciencedirect.com/science/
article/pii/S0957417497000183.
Wilcock, A. (1993), A theory of the human need for occupation. Journal of Occupational
Science vol. 1, 1, pp. 17–24, doi:10.1080/14427591.1993.9686375, URL http://dx.
doi.org/10.1080/14427591.1993.9686375.
Wimmer, H., Yoon, V. and Rada, R. (2013), Integrating Knowledge Sources: An On-
tological Approach. International Journal of Knowledge Management vol. 9, 1, pp.
60–75, ISSN 1548-0666, doi:10.4018/jkm.2013010104.
Yin, R. K. (2006), Case Study Reserach - Design and Methods. Clinical Research vol. 2,
pp. 8–13, ISSN 0002-8223, doi:10.1016/j.jada.2010.09.005.
Zafar Iqbal, M., Irum, S. and Yousaf, M. S. (2017), MULTIPLE CHOICE QUES-
TIONS; DEVELOPED BY THE FACULTY OF A PUBLIC SECTOR MEDICAL
COLLEGE. Professional Med J MULTIPLE CHOICE QUESTIONS The Profes-
sional Medical Journal vol. 24, 9, pp. 1409–1414, doi:10.17957/TPMJ/17.3989, URL
www.theprofesional.com.

BIBLIOGRAPHY 211
Zaidah, Z. and Zainal, Z. (2007), Case study as a research method. Jurnal Kemanusiaan
vol. 9, Journal Article, pp. 1–6, ISSN 1545-9632, doi:10.1177/15222302004003007.
Zeng, M. a. (2014), The Contribution of Different Online Communities in Open Inno-
vation Projects. Proceedings of The International Symposium on Open Collaboration
- OpenSym ’14 pp. 1–9, doi:10.1145/2641580.2641593, URL http://dl.acm.org/
citation.cfm?doid=2641580.2641593.
Zikopoulos, P., Eaton, C., DeRoos, D., Deutsch, T. and Lapis, G. (2012), Understanding
Big Data: Analytics for Enterprise Class Hadoop and Streaming Data. McGraw Hill,
New York, ISBN 9780071790536.
Zubiaga, A. (2012), “Harnessing folksonomies for resource classification” by Arkaitz
Zubiag with Danielle H. Lee as coordinator. ACM SIGWEB Newsletter pp. 1–2, ISSN
19311745, doi:10.1145/2246063.2246067, URL http://dl.acm.org/citation.cfm?
id=2246063.2246067.


![[Anvil Christopher] Anvil, Christopher - Interstel(BookFi)](https://static.fdocuments.net/doc/165x107/577c7f1a1a28abe054a33ed5/anvil-christopher-anvil-christopher-interstelbookfi.jpg)