![INDEX [cornerstone.ac.za]€¦ · Bachelor of Arts Honours in Community Development 158 Bachelor of Arts Honours in Psychology (Academic) 163 Bachelor of Arts Honours in Psychology](https://static.fdocuments.net/doc/165x107/5fc6aa834c59c236646cfc46/index-bachelor-of-arts-honours-in-community-development-158-bachelor-of-arts.jpg)
by Bachelor of Science Psychology and Criminology 2015
71
The Effects of Exaggerated Social Comparison Feedback on Work Performance by Michael Patrick Cusick Bachelor of Science Psychology and Criminology Florida State University 2015 A thesis submitted to the School of Behavior Analysis of Florida Institute of Technology in partial fulfillment of the requirements for the degree of Master of Science in Applied Behavior Analysis and Organizational Behavior Management Melbourne, Florida August 2020
Transcript of by Bachelor of Science Psychology and Criminology 2015

The Effects of Exaggerated Social Comparison Feedback on Work Performance
by
Michael Patrick Cusick
Bachelor of Science
Psychology and Criminology
Florida State University
2015
A thesis submitted to the School of Behavior Analysis of
Florida Institute of Technology
in partial fulfillment of the requirements
for the degree of
Master of Science
in
Applied Behavior Analysis and Organizational Behavior Management
Melbourne, Florida
August 2020
We the undersigned committee
hereby approve the attached thesis,
“The Effects of Exaggerated Social Comparison Feedback on Work Performance”
by
Michael Patrick Cusick
___________________________________________
David A. Wilder, Ph.D.
Professor and On-Campus ABA Program Chair
School of Behavior Analysis
Thesis Advisor
___________________________________________
Nicholas L. Weatherly, Ph.D.
Associate Professor
School of Behavior Analysis
___________________________________________
Gary Burns, Ph.D.
I/O Chair and Professor
School of Psychology
___________________________________________
Lisa Steelman, Ph.D.
Professor and Dean
College of Psychology and Liberal Arts

iii
Abstract
Title: The Effects of Exaggerated Social Comparison Feedback on Work
Performance
Author: Michael Patrick Cusick
Major Advisor: David A. Wilder, Ph.D., BCBA-D
The purpose of this study was to examine the effects of exaggerated social
comparison feedback on work performance in an analogue setting. Following their
first 15-minute session working on a simulated money transfer task, participants in
the two experimental conditions received objective feedback, but one group
received rank feedback understating their performance, while the other group
received overstated rank feedback. Participants then performed the task again to
evaluate potential changes in performance based on this feedback. One-way
analyses of variance (ANOVAs) were conducted to measure differences in the
number of correctly completed money transfers, percent of correctly completed
money transfers, and number of errors. No significant differences were found
between the groups in the second session. A discussion of limitations and
suggestions for future research on social comparison feedback are provided.

iv
Table of Contents
List of Keywords ...................................................................................................... v
List of Tables .......................................................................................................... vi
List of Figures ........................................................................................................ vii
Chapter 1: Introduction .......................................................................................... 1 Feedback Accuracy ......................................................................................................... 3 Rank Information Given to Employees ......................................................................... 9
Social Comparison Literature in Psychology .............................................................. 12 Evaluation in Behavior Analysis .................................................................................. 14
Social Comparison in OBM .......................................................................................... 17
Chapter 2: Method ................................................................................................. 20 Participants and Setting ................................................................................................ 20
Work Task and Dependent Variable ........................................................................... 20
Independent Variable and Experimental Design ....................................................... 21
Procedure ....................................................................................................................... 22
Treatment Integrity ....................................................................................................... 23
Social Validity ................................................................................................................ 24
Chapter 3: Results .................................................................................................. 25
Chapter 4: Discussion ............................................................................................ 29 Limitations ..................................................................................................................... 41
Future Research ............................................................................................................ 43
References ............................................................................................................... 46

v
List of Keywords
Feedback
Objective Feedback
Ranking
Social Comparison

vi
List of Tables
Table 1 — Results of a one-way ANOVA to determine statistical differences in
second session for percent of money transfers completed correctly. ............... 50 Table 2 — Results of an ANOVA to determine statistical differences between
Session 1 and Session 2 for percent of money transfers completed
correctly............................................................................................................ 51
Table 3 — Results of a one-way ANOVA to determine statistical differences in
second session for number of money transfers completed correctly. .............. 52 Table 4 — Results of an ANOVA to determine statistical differences between
Session 1 and Session 2 for number of money transfers completed
correctly............................................................................................................ 53 Table 5 — Results of an ANOVA to determine statistical difference between
Session 1 and Session 2 for number of money transfers completed correctly in
the high-rank feedback condition. ................................................................... 54
Table 6 — Results of an ANOVA to determine statistical difference between
Session 1 and Session 2 for number of money transfers completed correctly in
the low-rank feedback condition. ..................................................................... 55 Table 7 — Results of an ANOVA to determine statistical difference between
Session 1 and Session 2 for number of money transfers completed correctly in
the control condition. ....................................................................................... 56
Table 8 — Results of a one-way ANOVA to determine statistical differences in
second session for number of errors................................................................. 57 Table 9 — Results of an ANOVA to determine statistical differences between
Session 1 and Session 2 for number of errors. ................................................. 58
Table 10 — Mean answers to social validity questions divided by high-rank
feedback and low-rank feedback conditions. ................................................... 59

vii
List of Figures
Figure 1 — Example of the experimental task as seen on desktop computer. ........ 60
Figure 2 — Example of worksheet used to complete experimental task. ................ 61
Figure 3 — Graph displaying the average percent of money transfers correctly
completed per group. ........................................................................................ 62 Figure 4 — Graph displaying the average number of money transfers correctly
completed per group. ........................................................................................ 63 Figure 5 — Graph displaying the average number of errors emitted per group. ..... 64

1
Chapter 1: Introduction
Performance feedback is one of the most well-known interventions in the
field of organizational behavior management. It has been used in various
organizations to improve the performance of workers and remains a popular topic
for researchers in the field. Feedback has been defined by Daniels and Bailey
(2014) as “information about behavior or performance that allows a person to
change his/her behavior” (p. 325). Two comprehensive literature reviews analyzing
the various aspects of feedback have been published.
Balcazar, Hopkins, and Suarez (1985) first reviewed four separate journals
looking for publications in which feedback was listed as the independent variable
in the abstract. Sixty-nine articles in total were selected for the review, which
included a total of 126 experiments. These were then categorized by their
consistency of effects, characteristics of feedback, and combination of feedback.
Important findings from this article include that feedback alone had the lowest
levels of consistent effects, despite being the most common feedback intervention
used by researchers. Feedback delivered along with behavioral consequences or
goal setting yielded more consistent effects compared to feedback alone. In
addition, more frequent feedback (daily feedback for example) was more
consistently effective than other feedback. Also, graphic feedback was the most
frequently used mode of feedback delivery, as well as the most effective (Balcazar
et al., 1985). Important overall findings include that feedback is not “uniformly
effective” (1985, p. 75), positive reinforcement from feedback can be improved

2
with the inclusion of rewards and goal setting, and that several variables can
improve the effectiveness of feedback.
Alvero, Bucklin, and Austin (1998) continued reviewing the literature on
feedback for the years 1985 to 1998, continuing with the same four journals used in
the previous study. This search of literature, despite covering a longer period of
time, yielded only forty-three articles, and sixty-eight feedback applications. The
results of this review largely confirmed some of the findings from Balcazar et al.
(1985), such as group feedback having the most consistent effects.
There have been several theories regarding the behavioral functions of
feedback. Duncan & Beuwelheide (1985) sought to categorize the different
behavioral functions of feedback. The authors first explain that feedback has
discriminative stimulus (SD) properties, wherein the delivery of feedback has been
paired with a history of reinforcement or punishment. If feedback serves as an SD,
then feedback would signal the availability for reinforcement through a specific
behavior. If feedback leads to escape or avoidance behaviors, however, due to the
content being negative, than feedback would function as an S-delta, meaning that
the behavior leading to such feedback would not be reinforced, leading to
extinction. The authors also discuss that many publications have also suggested that
feedback serves as reinforcement, meaning that performance improves or increases
because of the consequence of feedback delivery following the behavior (Michael,
1982). One argument against this idea, however, is that reinforcement is more
effective when delivered more immediately (Duncan & Beuwelheide, 1985), and

3
feedback is commonly delivered long after the behavior occurs. The authors
conclude that feedback as a discriminative stimulus may provide a better
explanation than as reinforcement. Finally the authors also discuss the possibility of
feedback as an establishing operation (Michael, 1982) or what is better known
today as a motivating operation. This is a stimulus that changes the value of a
reinforcer or punisher. As an example of feedback as an establishing operation,
positive feedback from a supervisor may increase the value of continued
exceptional performance and will also evoke a higher level of performance.
Feedback remains a popular research area in the field of organizational
behavior management. Recent research applications of feedback include examining
its implementation before and after a subject’s performance (Aljadeff-Abergel et
al., 2017), combining feedback and task clarification to increase customer service
behaviors at a restaurant (Reetz et al., 2016) and using task clarification and
feedback to decrease early clock-in times (Palmer & Johnson, 2013). A common
trend in recent research is examining whether the accuracy of feedback alters the
effectiveness of its delivery.
Feedback Accuracy
Johnson, Rocheleau, and Tilka (2015) manipulated the accuracy of
feedback as well as the tone of feedback in an analogue setting to evaluate changes
in participants’ performance. For this study, the number of computerized checks
completed correctly was the dependent variable. There were two independent
variables, with the first being whether feedback was contingent or independent of

4
performance, and the second being whether the tone of feedback was supportive or
critical. This study utilized a 2 x 2 factorial design with four groups: contingent and
supportive feedback, contingent and critical feedback, independent and supportive
feedback, and finally, independent and critical feedback. Results indicated that the
independent, or inaccurate feedback was not as effective at increasing performance
as feedback that was contingent on performance, which continued to increase
performance across experimental sessions. The findings of this study suggest that
supervisors should give feedback that is tied to one’s actual performance rather
than perhaps making quick statements on one’s performance without evaluating
what is truly being accomplished.
Another article from the same year examined whether numerical accuracy
was needed for the effectiveness of feedback (Palmer et al., 2015). The first
experiment utilized a single-subject design with three university students in a lab
setting, and the dependent variable was the number of latency calculations inputted
into an Excel spreadsheet. One participant was assigned to be the control
participant, meaning they did not receive feedback throughout the study. The other
two participants received numerically accurate feedback, as well as feedback in
which the number of completed calculations was doubled when administered, and
feedback that was “yoked”, meaning the participant received feedback based on the
number that the control participant completed. The results of this experiment
revealed that performance increased after the baseline session regardless of the
accuracy of feedback, or the lack of feedback. Results from a social validity survey

5
revealed that the two experimental participants did not believe that any of the
feedback they received was inaccurate. This study, when examined alone, suggests
that numerical accuracy of feedback is not necessary to improve performance.
Numerical accuracy of feedback was examined once again in a second
study in the same publication. For this second experiment, the authors utilized a
group design to isolate the treatments given to each participant, rather than having
participants receive multiple treatments (Komaki & Goltz, 2001), or manipulations
of feedback accuracy. This study used sixty student participants, and the
experimental task was changed to that of a check processor. The authors measured
the number of correctly completed checks, in contrast with the previous experiment
where the dependent variable did not consider whether the task was completed
correctly. The participants were randomly assigned to four conditions: a control
condition with no feedback, and three experimental conditions including accurate
feedback, feedback in which participants’ actual scores were tripled, and feedback
in which participants’ received scores were reduced to one-third of their actual
score. The results of this study show that the average number of checks completed
correctly did not change much for the control group receiving no feedback.
Average performance for those receiving low feedback showed high levels of
variability throughout the sessions. Accurate feedback and exaggerated feedback
yielded the highest increases in performance, suggesting that these are the best two
routes to take when delivering feedback to workers.

6
Feedback accuracy was investigated further in a doctoral dissertation that
sought to examine the effects of feedback accuracy on not only performance, but
also rumor statements made by those receiving feedback (Lipschultz, 2017). This
study involved two experiments. The first experiment involved three dyads of
participants completing an analogue money transfer task and receiving feedback
that represented either the accurate number of money transfers, or an inaccurate
number, with the participants being given information that they were either
completing three times more than they actually completed, or one third of what
they completed, similar to the previously discussed study by Palmer et al. (2015).
Participants were exposed to all conditions in this first experiment, with three
sessions for each condition. Each member of the three dyads was to complete the
first two sessions in separate rooms before working in the same room during the
third session. Subjects had a joint goal of collectively completing 48 money
transfers correctly over the course of all three sessions to receive the most amount
of money possible at the end of the experiment. During the third session,
participants were encouraged to talk about the experimental task before, during,
and after session in order for the experimenter to collect data on rumor statements
regarding the task and the supposed accuracy of feedback. Following the exposure
to each condition, each participant was to train a supposed future participant
(actually a confederate) on the task, in order to create scripts for the following
experiment.
7
In the second experiment, participants were only exposed to one of the three
conditions. They were also trained on the money transfer task by confederates who
were trained to explain the task with similar verbal behavior to the participants
training confederates in the first experiment. This created a 3x2 factorial design;
participants were exposed to either accurate feedback or the one third or tripled
condition of inaccurate feedback, while also being exposed to a trainer who
supposedly received tripled feedback or feedback that was one third of their actual
performance. Each participant was run for 4 sessions of the same condition, and
completed a social validity survey. Twelve participants were then asked to train a
confederate, similar to the first experiment.
This dissertation looked at both performance as well as the verbal behavior
of those exposed to both accurate and inaccurate feedback. The results of
Experiment 1 revealed that rumor statements were more likely to occur when
inaccurate feedback was delivered compared to the accurate feedback conditions
(2017). Results also showed that such statements were more negative in nature,
potentially revealing the detrimental effects of receiving inaccurate feedback on
workplace morale.
Experiment 2 yielded results showing that those in the accurate feedback
condition completed more money transfers than those in the two inaccurate
feedback conditions (2017). These findings are at odds with the previous study by
Palmer et al. (2015), which yielded results showing that the performance of those in
the tripled feedback condition performed very similarly to those participants

8
receiving accurate feedback. Lipschultz offers an explanation for this difference,
noting that the money transfer task used in his experiment is more difficult than
inputting latency data as seen in the previous study (2017). This would suggest that
inaccuracy of feedback may be more detrimental for work tasks requiring more
response effort, but not for simpler work tasks, where overstating one’s
performance may be beneficial and could even increase performance. In summary,
this more recent study further establishes the importance of feedback accuracy
when attempting to increase performance, and provides more social validity than
previous studies by looking at the verbal behavior of those affected by negative
feedback.
It should be noted that in these experiments, the inaccurate feedback
statements are not evaluative in nature, but rather delivered as false objective
feedback. In other words, these inaccurate statements involve lying to the
participants, rather than providing an evaluative statement intended to strengthen
the effectiveness of feedback. Perhaps the lack of evaluative characteristics of this
feedback coupled with the lack of believability led to these inaccurate statements
being less effective compared to accurate statements. Accuracy of feedback
continues to be a topic of interest for researchers in the field of organizational
behavior management. Few studies in the current literature, however, have
examined the effects of a performer receiving information on their rank compared
to other performers.

9
Rank Information Given to Employees
Daniels and Bailey (2014) discuss rank briefly in their Performance
Management textbook. The authors first define judgement as “the process of
forming an opinion or evaluation by discerning and comparing” (2014, p. 81) and
describe four techniques for making judgements: opinion-based rating or ranking,
or criteria-based rating or ranking. The text further goes into a discussion of
whether one should rank or rate performers, and defines the process of ranking as
“comparing the performances of individuals against each other” (2014, p. 83).
Ultimately, the authors do not recommend ranking employees, as the one ranking
the performers is lining up their employees from best to worst, providing
reinforcement to one or a few top performers, and lowering the overall performance
in the organization. Daniels and Bailey ultimately suggest using a rating system
rather than ranking employees (2014).
One type of program adopted by many organizations that involves ranking
employees is employee of the month (EOM) programs. Daniels and Bailey touch
on these as well, and caution managers against using EOM programs as they only
provide reinforcement to the top performer of the group (2014). The authors
continue with their argument, saying that management will sometimes try to
combat this issue by allowing multiple winners, but argue that this method is even
more punishing, as seeing multiple people in the top echelon of performers, but not
oneself, can be very discouraging.

10
Johnson and Dickinson (2010) ran two experiments in an analogue setting
to examine whether an employee of the month type program would have a
reinforcing effect on performance. For the introduction to their study, the authors
discuss an absence of empirical studies on employee of the month programs, but
that the economics literature refers to a concept known as “rank order tournaments”
in which multiple employees compete for a single prize, and a reward is given to
the worker with the greatest perceived performance (Johnson & Dickinson, 2010).
Important findings from the economics literature include that an increase in the
prizes delivered also tends to increase the productivity of employees (Harbring &
Irlenbusch, 2003, 2008), and that rank order tournaments have been shown to
produce more varied performance than other incentive programs (Harbring, 2006).
For the first experiment on EOM programs run by Johnson and Dickinson
(2010), the author used six college students as participants, and had them work on a
check processing application in both experiments to measure performance. A
multiple baseline design was used for the study, and participants were told they
were “Check Processor of the Week” two at a time (Johnson & Dickinson, 2010).
Similar to many employee of the month programs, the criteria to actually receive
this title was kept vague with phrases such as “going the extra mile” and “making
an outstanding contribution to the team” (2010). Receiving this recognition was not
contingent on any type of performance in this experiment but was dictated by the
experimental design. The results of this study showed that being labeled check
processor of the week did not consistently improve performance for the

11
participants, and even decreased performance for the two participants that were
given the intervention last.
A second, similar experiment was conducted to examine the effect that
many employee of the month programs have, in which employees perform well,
but are not the top performers and do not receive employee of the month (Johnson
& Dickinson, 2010). To create such a scenario, six new participants were put
through the same check processing application as the previous experiment, but the
intervention consisted of participants being told that the experiment changed, in
which they could be rewarded $50 if they were the top performer. Participants were
given falsified information at the beginning of each session during the intervention
phase that listed their team members, and their rank compared to the other team
members, but they were always ranked between second and fifth place. The data
showed that most participants increased their performance in this experiment, but
that performance gains were not maintained by all students. Perhaps the presence of
a $50 dollar incentive, and participants being ranked highly may have temporally
functioned as reinforcement, but the effect did not last, suggesting that an E.O.M.
type program cannot provide reinforcement for multiple members in an
organization.
This second study demonstrates not only a potential effect of employee of
the month programs, but also how social comparisons can affect behavior, as
participants were shown their rank in comparison to the supposed top performer of
the group (2010). The authors administered a social validity survey at the end of

12
Experiment 2 to examine the effects of seeing the top performer and competing
with them for the $50 reward. All but one participant stated that at the beginning of
the intervention, they were competing with their team members to earn the reward.
By the end of the study, however, only two of those participants stated that they
were still competing for the $50 (2010). While this experiment shows some social
comparison effects, very few studies within behavior analysis have examined the
effects of social comparison on human performance. Despite this gap in the
research, social comparison has been theorized and examined often in the field of
psychology.
Social Comparison Literature in Psychology
Festinger wrote A Theory of Social Comparison Processes (1954) offering
hypotheses regarding the variables that contribute to the social comparison of
people’s opinions and abilities, and summarizing studies prior which support these
hypotheses. The author’s first suggested theory is broad, stating that it is human
nature to evaluate one’s abilities and opinions, and follows this with a second
hypothesis: that when there is no presence of a non-social, objective means of
evaluating one’s abilities, people will compare to the abilities of others (Festinger,
1954). Festinger goes on to argue that the evaluation of one’s opinion is unstable
without a physical or social comparison (1954), meaning that one’s opinion of their
performance will fluctuate depending on how well they perform without anything
to compare themselves to. Much of the article stresses the idea that people will
make social comparisons to those more like themselves, suggesting that if one’s

13
performance is too divergent from another’s, they will be less likely to engage in
comparison.
When there is a discrepancy between an individual’s ability in comparison
to the group’s there is a drive within humans to decrease this discrepancy. Festinger
states that regarding one’s ability, there is “unidirectional drive upward” for an
individual to improve their performance, which works in tandem with one’s need to
reduce the discrepancy (1954). Therefore, an individual whose performance is
lower than one in the group will try to improve to be more in line with that group.
For the case of an individual performing at a much higher level than their peers,
Festinger says that the other members of the group will not serve as a proper
evaluation of the high performer’s abilities. This high performer may attempt to fix
the issue by helping the other members of the group improve their performance.
Interestingly, another phenomena can occur where the performance of a top
performer may decrease, becoming more similar to other members of the group
(1954). Once a discrepancy like this is resolved within the group, competitive
behavior will once again occur between members of the group.
Other principles that Festinger addresses in this paper are the pressures
toward uniformity within a group, such as how much an individual is attracted to
the group, as well as how important the ability is to the person that is being
compared with the group. One major point that Festinger makes is that groups are
created due to people’s need to self-evaluate (1954), and that people will ultimately
move into groups of people with those of similar abilities and opinions, while

14
moving away from those different from themselves. Festinger suggests that these
creations of groups perhaps allow for differing abilities and opinions in society, and
may explain different statuses in society, as people generally compare themselves
to those belonging to the same status group. Those of a minority group will not
bother comparing themselves to those of a majority group, and instead compare
themselves to more similar people. Festinger’s initial research on social comparison
theory opened a long line of research regarding social comparison that continues to
grow in the field of psychology.
Evaluation in Behavior Analysis
While there have been a wide range of studies examining social comparison
in psychology, there has been very little exploration of social comparison in
behavior analysis. As a natural science, behavior analysis has adopted very
different philosophies compared to psychology. For example, when discussing the
human need for self-evaluation via social comparison, Festinger refers to this as a
“drive” (1954) referring to an internal feeling. Behavior analysts, in contrast, tend
to favor the external environment when determining a cause for behavior (Pierce &
Cheney, 2013).
Behavior analysis does not reject the existence of feelings. In fact, behavior
is defined as “everything (an organism) does, including private and covert actions
like thinking and feeling” (2013, p. 1). Feelings, like overt behavior, are believed to
be dictated by our external environment rather than anything internal. Despite the
inclusion of feeling as a behavior, behavior analysis tends to favor overt behavior

15
when choosing a response to measure. This is because overt behavior is observable
and therefore a more reliable measure. A feeling is a private event, which is
inaccessible to those surrounding the individual. Pierce and Cheney state that
people are taught to talk about their feelings, but that there is no way for one to
measure the feelings that are going on inside another individual (2013).
As described earlier, Festinger stated in his original theory that social
comparisons allow people to evaluate their own opinions and abilities (1954). In
relation to this, recent literature in organizational behavior management has
acknowledged that feedback is usually delivered with an evaluative component
(Johnson et al., 2008). The evaluative component of feedback has been described as
a statement praise or criticism delivered by the individual giving feedback to the
employee (2008) and is subjective information that is intended to strengthen the
effectiveness of feedback. Similarly, the term ‘general feedback’ has been used in
the literature to describe statements that do not offer specific information on one’s
performance (Henley & DiGennaro Reed, 2015). Despite differences in language
used by researchers in the field, these two terms essentially define the same
component that can be found in most deliveries of feedback.
Johnson conducted a component analysis of feedback to determine the
effectiveness of objective and evaluative feedback in isolation, as well as together
(Johnson, 2013). The dependent variable in this study was the number of checks
completed correctly on a computer in an analogue setting. In this study, when
participants received objective feedback, they were told the number of checks they

16
completed correctly in the previous session. When receiving evaluative feedback,
participants were categorized by scores labeled as excellent, good, average, and
poor. For example, when one would receive a score of excellent in the evaluative
feedback condition, they may be told that their performance was “really
impressive”. If a participant received a score labeled poor, they may be told by the
experimenter that they completed a low number of checks (2013).
The results of this study showed an overall decrease in performance for the
control group not receiving feedback. Participants that either received objective
feedback alone or evaluative feedback alone had similar levels of increases in
performance. For the group receiving both evaluative and objective feedback,
however, the level of improvement was much higher. This study suggests that
evaluative and objective statements within feedback are beneficial when combined,
particularly when a manager is attempting to increase the performance of
employees. Daniels and Bailey have emphasized the importance of being specific
and objective when delivering feedback (2014), but the inclusion of praise or
criticism along with this objectivity may be worth the extra effort.
One suggested explanation for this phenomenon is that evaluative feedback
can serve as an antecedent for rule-governed performance based on a past history of
positive or negative evaluation received about performance (Johnson et al., 2010),
meaning that past feedback serves as a template for how one should perform.
Johnson offers an example where one receiving evaluative feedback can create a
verbal statement of either predicting criticism contingent on poor performance, or

17
predicting praise contingent on good performance (2013). This verbal statement is
analogous to the self-evaluation Festinger wrote about in his original theory of
social comparison.
Social Comparison in OBM
Despite the lack of literature in the field of organizational behavior
management on social comparison, one recent study has evaluated this topic.
Moon, Lee, Lee & Oah (2016) used a 2 x 2 factorial design to evaluate the potential
effects of being compared to other performers. This study examined two
independent variables: the performance level of the participants that were either
ranked as high performers or low performers, and the type of feedback delivered,
which included objective feedback, or social comparison feedback in the form of
one’s rank. The authors initially recruited 150 participants, but only the top sixty
and bottom sixty performers were carried over following a pre-session to create the
two groups. Participants were then randomly assigned to the two feedback groups.
The experimental task performed by the participants was to complete money
transfers in an analogue setting, and the dependent variable was the amount of
money transfers completed correctly.
The results of this study revealed that for high performers, social
comparison feedback was more effective at increasing the number of correctly
completed money transfers. For the low performers, however, objective feedback
increased performance more quickly per session than the social comparison
feedback group (2016). While the majority of low performers receiving social
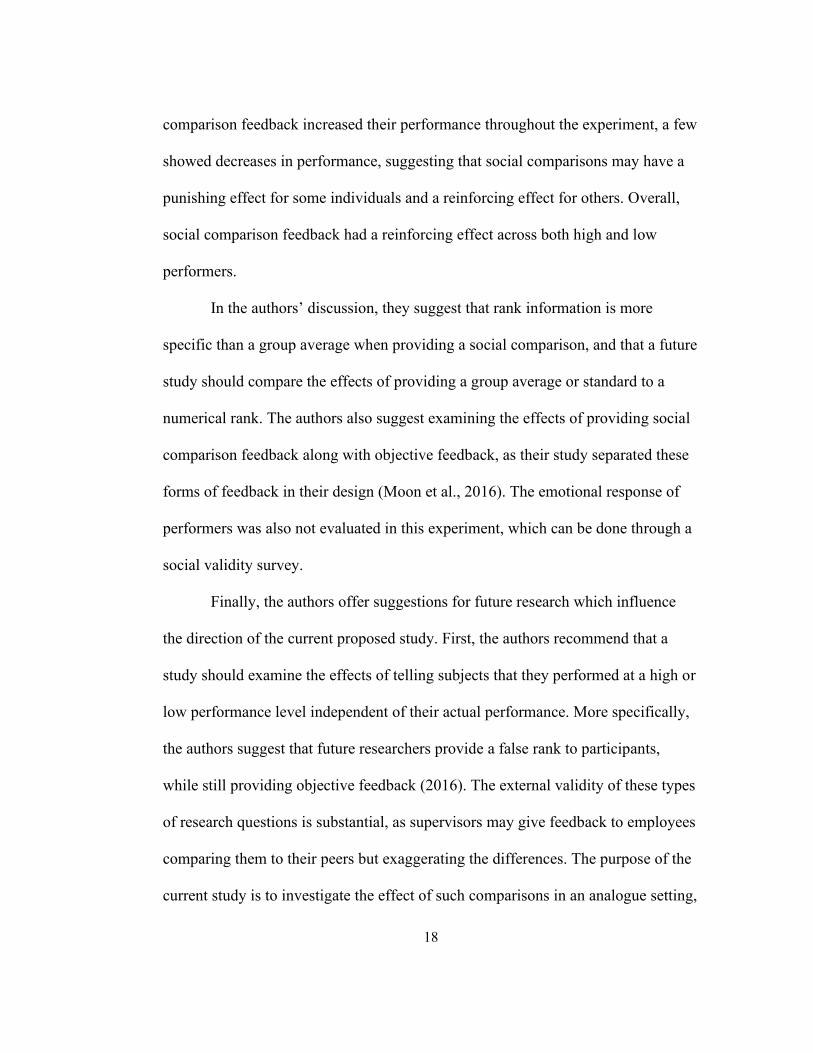
18
comparison feedback increased their performance throughout the experiment, a few
showed decreases in performance, suggesting that social comparisons may have a
punishing effect for some individuals and a reinforcing effect for others. Overall,
social comparison feedback had a reinforcing effect across both high and low
performers.
In the authors’ discussion, they suggest that rank information is more
specific than a group average when providing a social comparison, and that a future
study should compare the effects of providing a group average or standard to a
numerical rank. The authors also suggest examining the effects of providing social
comparison feedback along with objective feedback, as their study separated these
forms of feedback in their design (Moon et al., 2016). The emotional response of
performers was also not evaluated in this experiment, which can be done through a
social validity survey.
Finally, the authors offer suggestions for future research which influence
the direction of the current proposed study. First, the authors recommend that a
study should examine the effects of telling subjects that they performed at a high or
low performance level independent of their actual performance. More specifically,
the authors suggest that future researchers provide a false rank to participants,
while still providing objective feedback (2016). The external validity of these types
of research questions is substantial, as supervisors may give feedback to employees
comparing them to their peers but exaggerating the differences. The purpose of the
current study is to investigate the effect of such comparisons in an analogue setting,
19
while simultaneously further investigating the effects of inaccurate feedback on
performers as well as the effects of ranking performers.

20
Chapter 2: Method
Participants and Setting
Forty-eight participants (16 in each of the three conditions) were recruited
in total. Twenty-eight students from a southeastern private university were
recruited through the campus Sona system, which was developed to allow
undergraduates to participate in campus research for class credit. Due to the
COVID-19 pandemic that occurred during the spring and summer of 2020, twenty
participants were recruited via word of mouth. If recruited outside of the campus
Sona system, student participants were offered a $5 incentive. Participant ages
ranged from 18 to 66 years. The experiment was conducted in a lab room
containing a desk, chair, and desktop computer. The experimenter delivered a
simulated work task on the computer, which is described below.
Work Task and Dependent Variable
The work task used in this study simulated an online bank money transfer
system, as described by Moon, Lee, Lee, and Oah (2016). On the computer screen,
participants were given a corporation name at the top of the screen as well as an
amount of money to transfer (Figure 1). Below this top line are areas in which to
type in the respective bank name and account number, as well as a row to re-type
the amount of money to be transferred. Participants were given a sheet with 4 tables
(Figure 2), with the first three having corporation names, bank names, and account
numbers. The participant was to type in the bank and account number associated
with the same number as the given corporation name on the computer screen. At

21
the bottom of the computer screen were two security codes with missing letters.
The fourth table on the handout contained the full security codes, and the
participant was expected to fill in the missing characters on the computer screen.
With all the information input into the computer, the participant clicked “Transfer”
and the next money transfer task began. The primary dependent variable of this
study was the percentage of correctly money transfers out of each participant’s total
money transfers completed. The secondary dependent variable was the number of
correctly completed money transfers, not including errors. The third dependent
variable was the number of errors emitted during sessions.
Independent Variable and Experimental Design
The independent variable of this study was the understated or overstated
social comparison feedback received in the two experimental conditions. A control
condition did not receive any feedback between the two experimental sessions. The
two experimental conditions included a high-rank inaccurate feedback condition
and a low-rank inaccurate feedback condition. Both conditions received accurate
objective feedback on how many money transfers were completed, as well as how
many money transfers were completed correctly. This feedback was received
verbally prior to the participants’ second session. The script for the feedback read:
“The total number of money transfers you completed was ___. Of these, the
number of correctly completed money transfers was ___.” The two experimental
conditions differed regarding their rank feedback. Participants in the high-rank
feedback condition received a false rank stating that they ranked number 3 of 102

22
participants included in the study. Those in the low-rank feedback condition also
received a false rank, stating that they ranked number 99 out of 102 participants.
This rank feedback was also delivered verbally. The script read: “Out of 102
participants, your performance rank was 3 or 99”. This study utilized a between-
subjects group design. One-way analyses of variance (ANOVAs) were used to
evaluate statistical significance between the three group averages of the second
session following delivery of feedback for each dependent variable: percentage of
money transfers correctly completed, number of money transfers correctly
completed, and number of errors. ANOVAs were also used to evaluate the
differences within groups (i.e., from session 1 to session 2) for each dependent
variable.
Procedure
Each participant was individually brought into the lab room, where the
experimenter explained the money transfer system and assured that the participant
could perform at least 2 successful money transfers; one as a walkthrough with the
experimenter, and a following money transfer to ensure the participant was
comfortable with the task with no instruction from the experimenter. Following this
brief training, the experimenter gave the participant a new worksheet with some of
the items scrambled in different locations, and participants were given instructions
for the two sessions. Participants were told that they would be working on the
experimental task for 15 minutes, followed by a 5-minute break, and would then
complete a second 15-minute session. They were then told that their objective was

23
to complete as many correct money transfers as they could within these 15-minute
sessions. Participants were then informed that the computer program would
automatically stop once the 15-minute session had ended and that they were to
retrieve the experimenter from outside of the lab room, and switch places for their
5-minute break. The experimenter asked the participants if they had any final
questions, and following this, left the room quietly as the participant began.
During the 5-minute break following the first session, the experimenter
went into the lab room as the participant stepped outside and collected the data on
money transfers completed. The experimenter also completed the script to deliver
feedback for those in the experimental condition. The participant then returned for
a final 15-minute session. Prior to this second session, participants in the two
experimental conditions were given objective feedback as well as their respective
rank feedback. The experimenter then switched out the worksheet once more and
exited the room while the participant began their second session. Those in the
control condition were not given any feedback, but had their worksheets switched
out and were instructed to complete the second session. Following these sessions,
the experimenter debriefed and administered the social validity survey to those in
the experimental conditions, and then dismissed the participants.
Treatment Integrity
Treatment integrity data were collected by an independent observer for
43.75% of experimental sessions via a voice recording of the experimenter
delivering feedback in accordance with the script (7 sessions in each experimental

24
condition). Small grammatical differences or sentence structure differences were
excused, however, and sessions were scored as correct if all necessary information
was delivered to the participant. For example, if the experimenter delivered rank
feedback saying, “Your rank was 3 out of 102 participants”, this would be
considered correct even though it did not follow the script exactly. During all
sessions, the experimenter followed the script verbatim; treatment integrity was
100%.
Social Validity
Following the second session, a social validity survey was administered to
participants in the two experimental conditions. The questionnaire consisted of
questions on a 5-point Likert scale, with 5 being strongly agree, and 1 being
strongly disagree. Questions asked participants if they enjoyed receiving social
comparison feedback, whether they believed this feedback was effective, whether
they perceived the feedback as true, whether they find it important to study social
comparison feedback, and whether the feedback made the participant perform
better. Also included were questions on the emotional effects of receiving social
comparison feedback, including whether it made the participant feel more
competitive or more anxious. Finally, the survey asked participants if they would
like to receive such feedback in the workplace.

25
Chapter 3: Results
Figure 3 displays the mean percentage of money transfers correctly
completed between groups. For the high-rank feedback condition, the average
percent of money transfers correctly completed was 84.41% in session 1, and
decreased to 81.69% in session 2. For the low-rank feedback condition, the mean
percentage of money transfers correctly completed was 81.30% in session 1, and
increased to 86.63% in session 2. For the control condition, the mean percentage of
money transfers completed correctly was 78.48% in session 1, and increased to
88.25% in session 2. The results of a one-way ANOVA showed that differences
between groups in the second session were not statistically significant F(2, 45) =
1.061, p = .355 (see Table 1.). The results of a second ANOVA with this data set
revealed that there was no significant difference between sessions (i.e., from
session one to session two) for average percent of money transfers completed
correctly F(1, 45) = 3.440, p = .070 (see first row of Table 2).
Figure 4 displays the mean number of money transfers correctly completed
between groups, not including errors. For the high-rank feedback condition, the
mean number of correct money transfers were 7.31 in session 1, and increased to
8.06 in session 2. In the low-rank feedback condition, the mean number of correct
money transfers was 6.94 in session 1, and increased to 8.06 in session 2. In the
control condition the mean number of correct money transfers was 6.63 in session
1, and increased to 8.31 in session 2. The results of a one-way ANOVA showed
that differences between groups in the second session were not statistically
26
significant F(2, 45) = .055, p = .946 (see Table 3.) The results of a second ANOVA
with this data set revealed that there was a significant difference between sessions
(i.e., from session 1 to session 2) for average number of money transfers completed
correctly F(1, 45) = 26.675, p < .001 (see first row of Table 4).
Following the finding of a significant difference between session 1 and
session 2 for average number of correctly completed money transfers, individual
follow-up ANOVAs were conducted to determine which specific conditions were
significant for this dependent variable. The results of the first follow-up ANOVA
revealed that there was no significant difference between session 1 and session 2
for the high-rank feedback condition F(1, 15) = 2.547, p = .131 (see Table 5). The
results of a second follow-up ANOVA revealed a significant difference between
session 1 and session 2 for the low-rank feedback condition F(1, 15) = 13.966, p =
.002 (see Table 6). The results of a third follow-up ANOVA revealed a significant
difference between session 1 and session 2 for the control condition F(1, 15) =
17.330, p = .001 (see Table 7).
Figure 5 displays the mean number of errors, or incorrect money transfers
emitted between groups in the first and second session. For the high-rank feedback
condition, the mean number of errors was 1.38 in session 1, and increased to 1.69
in session 2. For the low-rank feedback condition, the average number of errors
was 1.5 in session 1, and decreased to 1.25 in session 2. For the control condition,
the average number of errors emitted was 1.56 in session 1, and decreased to an
average of 1 error in session 2. Results of a one-way ANOVA showed that

27
differences between groups in the second session for errors were not statistically
significant F(2, 45) = 1.443, p = .247 (see Table 8). The results of a second
ANOVA with this data set revealed that there was no significant difference
between sessions (i.e., from session 1 to session 2) for average number of errors
F(1, 45) = .711, p = .404 (see first row of Table 9).
Table 10 displays the mean score per group for each Likert scale question
asked on the social validity survey (5 being strongly agree, and 1 being strongly
disagree). Question 1 suggests that those in the low-rank feedback condition (4.25)
enjoyed their social comparison feedback slightly more than those in the high-rank
feedback condition (3.88). For Question 2, both groups showed a similar mean
score when asked how effective they believed the social comparison feedback to be
(3.81 for high-rank feedback and 3.94 for low-rank feedback). Both groups were
relatively neutral with regard to believing their feedback to be true (3.94 for high-
rank feedback and 3.56 for low-rank feedback). With regard to Question 4, those in
the low-rank condition mostly agreed that it is important to study social comparison
feedback (4.06), while those in the high-rank condition answered slightly more
neutrally (3.69). With regard to the feedback making each participant more
competitive (Question 5), the mean score for the high-rank condition was 4, while
the low rank was 3.88. The answers to Question 6 suggest that those in the high-
rank condition did not feel anxious from receiving social comparison feedback,
(2.69) while those in the low rank condition answered more neutrally (3.13). On
average, both groups answered neutrally to Question 7, which asked whether they

28
believed they performed better than they would have performed otherwise (3 for
the high-rank condition and 3.38 for the low rank condition). Finally, Question 8
asked participants whether they would want to receive social comparison feedback
in the workplace. Those in the high-rank condition answered more neutrally on
average (3.13), while those in the low-rank condition answered slightly higher
(3.88).
29
Chapter 4: Discussion
The primary dependent variable of this study was the percent of money
transfers correctly completed by participants. The results of session 2 revealed that
those in the high-rank feedback condition had the lowest accuracy of the three
conditions, despite having the highest accuracy in session 1. The low-rank feedback
condition experienced an increase in accuracy in session 2 compared to session 1,
and was 5% higher than the high-feedback condition in session 2. The control
condition had the highest accuracy in session 2, along with the largest difference in
percent complete from session 1, with an increase of almost ten percent. Despite
differences in accuracy that can be seen through visual inspection, these differences
in session 2 failed to achieve statistical significance.
While one might be surprised by these results regarding accuracy of work
tasks completed, a possible explanation for the effect seen in the high-rank
feedback condition could be that being given a false high rank may decrease the
value for accuracy of future performance: that is, false high-rank feedback may act
as an abolishing operation. For those in the low-rank feedback condition, receiving
such a low rank may have served as negative reinforcement for those exposed to
this condition, leading them to improve their performance to increase their
supposed rank. Surprisingly, those in the control condition increased their mean
accuracy to be the highest in session 2 despite having the lowest accuracy in
session 1. This effect was unforeseen, but perhaps the lack of intervention allowed
for those assigned to this condition to improve their performance naturally through

30
a practice effect. Statistical differences between sessions 1 and 2 for the percent of
money transfers complete were found to be insignificant.
Regarding the secondary dependent variable, the number of correct money
transfers completed, the mean performance for both the high-rank and low-rank
feedback conditions for session 2 were exactly the same with an average of 8.06
correct money transfers completed. The control condition performed slightly
higher, with an average score of 8.31. Differences between the three conditions in
session 2 were statistically insignificant.
Similar to the primary dependent variable, the control condition had the
lowest group average in session 1 for the secondary dependent variable, but the
highest group average in session 2. On average both experimental groups increased
their performance across sessions as well, but these differences were not as
dramatic as those in the control condition. For this dependent variable, when a
second ANOVA was conducted to determine statistical significance between the
two sessions, there was in fact statistical significance.
Following this finding, three more follow-up ANOVAs were conducted for
this dependent variable to determine which individual conditions demonstrated
statistical significance between session 1 and session 2. The high-rank feedback
condition did not show statistical significance, while the low-rank feedback
condition and control condition revealed significant differences between sessions.
These findings reveal that, in this experiment, receiving feedback suggesting a low
rank was significantly more effective at increasing correct money transfers than

31
receiving feedback suggesting a high rank. The establishing operation for those in
the high-rank feedback condition may not have been sufficient to increase scores.
Receiving low-rank feedback, on the other hand, may have established improved
performance as a reinforcer. Participants’ performance in the control group
increased most dramatically, and this was likely due to practice effects.
For the study’s third dependent variable, number of errors emitted per
session, the high-rank feedback condition had the highest amount of errors on
average in session 2 (1.69). Those in the low-rank feedback condition made less
errors on average following feedback (1.25), while those in the control condition
only emitted one error on average in the second session. These differences in
performance in the second session were found to be statistically insignificant.
The number of incorrect responses between each group show a similar
pattern to the other dependent variables in terms of each group’s performance. On
average, those in the high-rank feedback condition slightly increased the number of
errors emitted between the two sessions, while those in the low-rank feedback
condition and control condition decreased their average number of errors. For the
high-rank condition, the results may once again suggest that, for those in the high-
rank condition, being told that they were ranked number 3 out of 102 participants
functioned as an abolishing operation. Those in the low-rank feedback condition
had a slight decrease in errors, which may once again imply that negative
reinforcement may have been responsible for this change. Those in the control
condition showed a more substantial decrease in errors than those in the low-rank

32
feedback condition. Differences between session 1 and session 2, however, were
found to be statistically insignificant.
The data from these three dependent variables suggest that, on average,
those in the control condition performed better than those in the two ranked
feedback conditions. Daniels and Bailey (2014) caution readers from ranking
performers, stating that ranking provides reinforcement to a small number of
performers, but decreases the overall performance of the organization. In terms of
correct responses, which was our secondary dependent variable, all groups on
average improved their performance from session 1 to session 2, with the control
condition being the highest. This individual finding may be in line with the Daniels
and Bailey’s suggestion, since those that did not receive a ranking correctly
completed the most work tasks.
Although it may be surprising that the control condition had the highest
average of correctly completed work tasks in session 2, one explanation for this
finding could be related to the level of tedium of the experimental task. For this
specific work task, one single response involves looking at information between
both a computer screen and worksheet, and inputting information into multiple
areas of the computer program. With the work task being so involved, it may be
possible that the most salient effect on performance was a practice effect.
Participants in each experimental condition were delivered feedback that had an
objective component, as well as a performance rank which may have misled or
confused some participants, especially if their objective feedback didn’t seem to
33
coincide with their rank. Perhaps the rank feedback delivered may have prevented
those in the experimental condition from a simpler exposure to the practice effect
that was received by the control condition.
In terms of accuracy (percent of responses correctly completed), the
primary dependent variable of the study, those in the control and low-rank feedback
conditions increased their accuracy on average, while those in the high-rank
feedback condition decreased in mean accuracy between sessions. This particular
finding regarding the accuracy results shows the opposite effect of Daniels and
Bailey’s (2014) claim that ranking provides reinforcement for a few top performers.
As suggested previously, perhaps the most salient effect in this experiment
was the practice effect, which was not accompanied by any feedback for the control
condition. In terms of accuracy, it may be that participants to whom feedback was
delivered may have led to effects that may have diminished the practice effect. In
terms of the high-rank feedback, one may have received a rank of 3 out of 102, and
perhaps attempted to increase their number of work tasks completed without paying
attention to details such as spelling and case sensitivity, leading to errors, and a
decrease in accuracy. On the contrary, a participant in the low-rank feedback
condition may have received their ranking, and took more time to ensure each work
task was implemented correctly before clicking “Transfer”. This additional
attention may have led to an increase in accuracy on average for the low-rank
feedback condition, but was not as effective as the practice effect alone that was
experienced by the control condition.

34
A possibility exists as well that those in the control condition may have
performed better than the two experimental conditions due to having the most
correspondence with the expectations given prior to session 1. This correspondence
may be a way of defining the participant trusting the experimenter. Participants
were simply told they were to correctly complete as many money transfers as they
could within the two sessions, and were not told they would receive feedback. The
delivery of feedback may have come as a surprise to those in the experimental
conditions, leading to a lack of trust of the experimenter. This lack of
correspondence with the expectations of participation may have led to participants
exposed to feedback not performing as highly on average as those in the control
condition.
The results of the social validity survey did not reveal much difference in
reporting between the high-rank and low-rank feedback conditions. The answers to
Question 1 suggest that, surprisingly, those in the low-rank feedback condition
enjoyed receiving feedback slightly more than those in the high-rank feedback
condition. Perhaps those in the low-rank condition took the feedback as
constructive, and improved their performance as such, while those in the high-rank
condition may have experienced a ceiling effect, which may have kept them from
increasing their performance much more. The two experimental groups answered
similarly when asked if social comparison feedback was effective, with a score of
3.81 for the high-rank condition and 3.94 for the low-rank condition, suggesting
mostly neutral answers of 3, to answers of 4 (agree). Those in the high-rank
35
feedback condition seemed to agree more in believing their feedback to be true
(3.94) compared with the low-rank feedback group (3.56). The reason for this
might be because most participants performed the task with little error. Because
objective feedback was delivered before the false ranking, participants might have
been predetermined to believe that they performed positively. A high rank may
have validated the objective scores of most participants in one condition, while a
low rank may have been confusing for most participants in the opposite condition.
This question is particularly noteworthy, as it relates to trust in terms of participants
believing the feedback of the experimenter. The result for this specific question
may reveal that those in the high-rank feedback condition on average may have
trusted the feedback more than those in the low-rank feedback condition, especially
for those that may have performed highly and still received a low rank.
Interestingly, participants in the low-rank condition agreed more often that it was
important to study feedback (4.06) compared to that of the high-rank condition
(3.69). Perhaps the low-ranking made the importance of studying social
comparison feedback more salient.
On average, participants generally agreed that the feedback they received
made them more competitive, with those in the high-rank condition answering
slightly higher, with an average of 4 compared to 3.88 in the low-rank condition. It
is quite possible that those in the high-rank condition felt more competitive because
they were supposedly close to being the top performer. The difference between
groups, however, was not substantial. In general, those in the high-rank feedback

36
condition on average disagreed with the notion that feedback made them feel
anxious (2.69) compared to those in the low-rank feedback condition that answered
more neutrally (3.13). This might have been expected, as being told you are a top
performer would probably not cause as much discomfort. It might be expected that
one might be more anxious in the low-feedback condition than what participants
reported, but considering that participation in this experiment was a one-time
experience and participants didn’t personally know those to whom they were being
compared, it may make sense for them to answer more neutrally than to report that
the feedback made them anxious. Both groups answered neutrally with regard to
believing that the feedback made them perform better. Considering that they didn’t
receive feedback following their second session, participants did not know whether
they actually performed better, and may not have been able to tell due to the time it
takes to complete one money transfer. Surprisingly, for the final Likert scale
question asking whether participants would like to receive social comparison
feedback in the workplace, those in the low-rank feedback condition answered with
more agreement (3.88) than those in the high-rank feedback condition who
answered more neutrally (3.13). Perhaps being told they were a low rank allowed
them to see room for improvement.
The ninth question was a free response, and asked participants what would
make receiving social comparison feedback better for them. The tenth question
asked participants about their emotional response. For the high-rank feedback
condition, some noteworthy responses included one participant suggesting that

37
social comparison would be more effective if the individual is invested in the
workplace or the people they are being compared to. Surprisingly, one participant
stated that he would rather not receive comparison feedback, despite being in the
high-rank condition. This response is consistent with Daniels and Bailey’s (2014)
comments cautioning against ranking employees. Other participants wrote about
being competitive and motivated to do better than others, as well as not being
satisfied with being ranked third, but wanting to be first. Daniels and Bailey (2014)
also warn against competition in the workplace in their Performance Management
textbook. Three participants in the high-rank condition stated they were more
concerned about their personal performance rather than their rank, which may
suggest that some people may only care about their personal performance
regardless of others. Two participants also discussed the use of an incentive along
with social comparison feedback, which could lead into an interesting future study,
as incentives are highly discussed in the field of OBM.
Regarding the free response answers for the low-rank feedback condition,
four participants suggested that knowing their peers would have made social
comparison better for them. This could hint to a limitation of this study, which is
that the participants were given a simple rank rather than a comparison to another
worker they may know and on which they can base their performance. Other
suggestions for making social comparison feedback better included the use of a
chart or graph, as well as constructive criticism, which may also suggest future
research. Regarding emotional responses to low-rank feedback, participants

38
reported a plethora of responses. Several participants said they felt pressure and
anxiety from the score, and motivation to improve their rank, while some stated
they felt neutrally toward the ranking. One participant stated that the low rank was
a setback, while another stated that it made them more competitive. These mixed
responses suggest that a low-ranking social comparison can produce many different
effects based on the individual, who may have various histories with the workplace
and social comparison feedback.
The current study has somewhat unique characteristics related to past
studies that covered related topics. In Johnson, Rocheleau, and Tilka’s study
(2015), results showed that accurate, or contingent feedback was more effective at
increasing performance than inaccurate, or noncontingent feedback. The current
study was unique in that the experimenter delivered accurate feedback, in terms of
work tasks completed total and completed correctly, but inaccurate feedback in
terms of ranking. Perhaps in the current study, when examining the average number
of correct responses for each group, the inaccurate rank prevented the experimental
conditions from improving their performance as much as the control condition,
which received no feedback whatsoever, and may have simply improved their
performance between sessions from uninterrupted exposure to the experimental
task.
Palmer, Johnson, & Johnson (2015) examined the necessity of numerical
accuracy when delivering feedback. For the first experiment conducted by Palmer
et al., performance increased for all groups compared to the baseline phase, which

39
is similar to the results of the current study’s secondary dependent variable, average
number of correct responses. Regarding average percent of correct responses,
however, all but the high-rank condition increased their performance in the current
study. For the authors’ second experiment, which utilized a group design, those in
the control condition scored the lowest, in contrast to the current experiment in
which the control condition on average scored lowest in baseline for both correctly
completed responses and accuracy, but increased for both dependent variables in
session 2. Results of the Palmer et al. (2015) study also differed from the current
study in that those receiving overstated feedback increased their performance the
most, while those receiving understated feedback showed high variability in their
performance. Perhaps delivering false feedback of one’s numerical performance
served a different function than giving a false rank, while providing truthful
numerical feedback of work tasks completed.
In the current study, the high-rank feedback condition was the only
condition to decrease their mean performance with regard to accuracy (percent of
money transfers correctly completed). Similarly, Johnson & Dickinson (2010) ran a
study that addressed ranking in the form of an employee of the month program,
where in the first experiment, those labeled as “Check Processor of the Week” did
not consistently show the reinforcing effect of improving performance, with
performance decreasing for some. These two findings combined suggest that
perhaps giving someone a high rank will not always lead to increased performance,
and one should caution from ranking someone highly. In experiment 2, participants

40
were not only given a false rank near the top (fifth or sixth place), but also a $50
incentive. While most subjects increased their performance with these
contingencies, some participants did not maintain a higher performance, further
suggesting that ranking somebody close to first place, even with an incentive in
place, may not be enough to maintain performance.
Moon, Lee, Lee and Oah (2016) differed from the current study in the sense
that there were two separate groups of high performers and low performers, and
those within each group were randomly assigned to either an objective feedback or
social comparison feedback condition. In the current study, participants were
exposed to both objective feedback, as well as social comparison feedback, and it is
uncertain which aspect of feedback was more salient to the participants, while the
previous study controlled for this. However, most participants in the study
performed high in terms of accuracy (percentage of responses correct) and may
have been most likely satisfied with their scores without any rank feedback.
The Moon et al. study (2016) also differed with respect to the delivery of
feedback, which gave written feedback in contrast with the verbal feedback
delivered in the current study. Perhaps written feedback may be more effective for
some participants and is a difference worth noting between studies. The results of
the previous study showed social comparison feedback as more effective for high
performers, and objective feedback as more effective for low performers than social
comparison feedback. With the current study not separating high from low
performers, there was not a way to discern the effect on the specific levels of
41
performers. Similar to the results of this study, however, all groups in both studies
improved in terms of mean number of work tasks correctly completed over time,
suggesting that exposure to the work task may have played a role in performance
improvement as well as feedback.
Limitations
While the results of this study are unique, it is important to consider the
limitations of this experiment. Perhaps the most important limitation is the small
sample size of 48 participants (16 in each group). Initially, 102 participants were
planned, following an a priori power analysis with an estimated higher effect size
of 0.40. This, however, may have been be difficult to complete within the time
constraints of an academic year. Therefore, we decided to use a minimum of 60
participants (20 in each group). A stay at home order as a result of the COVID-19
pandemic also led to the postponement of data collection for a period of time.
Because of this, 48 participants with 16 in each group were selected. Individual
differences in performance can have a large impact on group means, and the small
number of participants likely highlighted these differences. In fact, one participant
was an outlier which substantially impacted that particular group mean. Future
research is necessary to determine whether there may be significant differences
between groups by increasing the sample size as well as the effect size (powers
ranging from .058 to .308).
Due to the nature of running participants in an analogue setting rather than
in their actual work environment, it is possible that participants may not have been

42
invested in their performance, and therefore, feedback may not have served as
reinforcement or punishment. To help control for this potential limitation,
participants in the two experimental groups were given highly exaggerated ranks,
being told that they were either the third highest performer for the high-rank
feedback condition, or the third lowest performer for the low-rank feedback
condition. An analogue work setting, however, probably cannot compare to the
potential effects obtained if this study had been done in participants’ actual work
setting.
A possibility also exists that participants may have received their
exaggerated or understated feedback and did not believe their ranking. If
participants received their objective feedback, and are satisfied with their score,
they may be unlikely to believe they are ranked number 99 of all participants. On
the contrary, a participant that perceives their objective performance as low may
not believe that they are the third highest performer. A limitation may also exist
from the experimenter reading feedback directly from a script rather than the
feedback being either spoken naturally or memorized. Having feedback read from a
script may make the feedback seem less natural than a person delivering feedback
without a script, which could potentially increase the believability of such social
comparisons.
Limitations also existed within the experimental task. Each time the work
task was started, the corporation and amount of money needing to be transferred at
the top of the screen were always in the same order. This was partially controlled

43
for by switching out worksheets between training, session 1, and session 2. Some
of the items were scrambled between worksheets, but other items, however,
remained in the same place. There were a few participants that, when asked if they
noticed anything that helped them complete the work task, said that they noticed
the corporations on the computer screen were in the same order, or that the papers
seemed similar, and one participant thought the papers might have been the same.
Other participants that were asked, however, did not notice these issues. It is also
important to note that despite the same order of corporations on the screen, and
some items on the worksheets being in the same locations, the partial security
codes that were presented on the computer screen were always random, somewhat
controlling for these issues.
Future Research
While differences between groups in session 2 were insignificant for all
dependent variables, there is still much research within the area that is needed. One
suggestion is to run the experiment again but using written feedback as done
originally in Moon et al. (2016). Although verbal feedback may be more similar to
an actual work environment with the delivery coming from a manager, it may be
interesting to see the effect of one delivering a false rank in written form using the
same script. Other variations of delivering feedback on paper may also be
considered by future researchers. For example, Johnson & Dickinson (2010) added
participants to a list of false names in their second experiment on the effects of
employee of the month programs. Perhaps a researcher can add a participant to a

44
list of names to visually show where one may rank compared to others. One
participant in the current study suggested using a chart or graph to show where one
might place in a group, which may also be considered by a future researcher
interested in social comparisons.
Future researchers may also consider manipulations that combine delivering
a rank with an evaluative statement to determine its effect on performance.
Potentially, in a future study, ranks could be given to all participants, but some will
receive their rank along with statements such as great, good, fair and poor, similar
to what was done in Johnson’s (2013) component analysis of evaluative feedback.
Receiving such a statement may allow for a more substantial increase or decrease
in performance.
A future study may also further examine the changes in speed of work tasks
completed and correctly completed following the delivery of social comparison
feedback. As discussed earlier, the mean number of errors for the high-rank
feedback condition increased following delivery of feedback. This could have
possibly been due to an increase in speed, as well as not paying close attention to
the finer details in the experimental task, such as the correct spelling and
capitalization necessary to have a work task completed correctly. On the contrary,
the mean number of errors in the low-rank feedback condition decreased following
the delivery of feedback. It is suggested earlier that those in this condition may
have taken the time to ensure correctness in completed work tasks following
delivery of feedback, which may coincide with an overall reduction in speed. While

45
it may be beneficial to accelerate performance in many work settings, an increase in
speed may be at the cost of not performing in the desired manner. A future study
can further examine effects that receiving high or low-rank feedback may have,
specifically on the latency of completing each work task correctly.
As mentioned earlier, participants were not told they would receive a score
or any feedback and may not have anticipated feedback. A future feedback study
could examine changes in performance when participants are either told they are
working for a score, or not given any information on whether they will receive
feedback. Such a study can further examine matters of trust in the workplace.
While this study was unable to find significant differences between groups,
questions on social comparison feedback in the workplace still has a high level of
importance, as social comparisons occur across different work settings in a variety
of ways. Behavior analysis and organizational behavior management should
continue research into the topic to determine the behavioral effect of such
comparisons and make evidence-based suggestions to other researchers and
managers.

46
References
Aljadeff-Abergel, E., Peterson, S. M., Wiskirchen, R. R., Hagen, K. K., & Cole, M.
L. (2017). Evaluating the Temporal Location of Feedback: Providing
Feedback Following Performance vs. Prior to Performance. Journal of
Organizational Behavior Management, 37(2), 171-195.
https://doi.org/10.1080/01608061.2017.1309332
Alvero, A. M., Bucklin, B., & Austin J. (2001). An Objective Review of the
Effectiveness and Essential Characteristics of Performance Feedback in
Organizational Settings (1985-1998). Journal of Organizational Behavior
Management, 21(1), 3-29. https://doi.org/10.1300/j075v21n01_02
Balcazar, F. E., Hopkins, B. L., & Suarez, Y. (1985-1986). A Critical, Objective
Review of Performance Feedback. Journal of Organizational Behavior
Management, 7(3-4), 65-89. https://doi.org/10.1300/J075v07n03_05
Daniels, A. C., & Bailey, J. S., (2014). Performance Management: Changing
Behavior that Drives Organizational Effectiveness. Aubrey Daniels
International, Inc.
Duncan, P. K., & Bruwelheide, L. R. (1985-1986). Feedback: Use and Possible
Behavioral Functions. Journal of Organizational Behavior Management,
7(3-4), 91-114. https://doi.org/10.1300/j075v07n03_06
Festinger, L. (1954). A Theory of Social Comparison Processes. Human Relations,
7, 117-140. https://doi.org/10.1177/001872675400700202

47
Harbring, C. (2006). The Effect of Communication in Incentive Systems: An
Experimental Study. Managerial and Decision Economics, 27(5), 333-353.
https://doi.org/10.1002/mde.1266
Harbring, C., & Irlenbusch, B. (2003). An Experimental Study on Tournament
Design. Labour Economics, 10(4), 443-464. https://doi.org/10.1016/S0927-
5371(03)00034-4
Harbring, C., & Irlenbusch, B. (2008). How Many Winners are Good to Have? On
Tournaments with Sabotage. Journal of Economic Behavior &
Organization, 65(3-4), 682-702. https://doi.org/10.1016/j.jebo.2006.03.004
Henley, A. J., & Digennaro Reed, F. D., (2015). Should You Order the Feedback
Sandwich? Efficacy of Feedback Sequence and Timing. Journal of
Organizational Behavior Management, 35(3-4), 321-335.
https://doi.org/10.1080/01608061.2015.1093057
Johnson, D. A. (2013). A Component Analysis of the Impact of Evaluative and
Objective Feedback on Performance. Journal of Organizational Behavior
Management, 33(2), 89-103.
https://doi.org/10.1080/01608061.2013.785879
Johnson, D. A., & Dickinson, A. M. (2010). Employee-of-the-Month Programs: Do
they Really Work? Journal of Organizational Behavior Management,
30(4), 308-324. https://doi.org/10.1080/01608061.2010.520144

48
Johnson, D. A., & Dickinson, A. M., & Huitema, B. E. (2008). The Effects of
Objective Feedback on Performance when Individuals Receive Fixed and
Individual Incentive Pay. Performance Improvement Quarterly, 20(3-4),
53-74. https://doi.org/10.1002/piq.20003
Johnson, D. A., Rocheleau, J. M., & Tilka, R. E. (2015). Considerations in
Feedback Delivery: The Role of Accuracy and Type of Evaluation. Journal
of Organizational Behavior Management, 35(3-4) 240-258.
https://doi.org/10.1080/01608061.2015.1093055
Johnson R. A., Houmanfar, R., & Smith, G. S. (2010). The Effect of Implicit and
Explicit Rules on Customer Greeting and Productivity in a Retail
Organization. Journal of Organizational Behavior Management, 30(1), 38-
48. https://doi.org/10.1080/01608060903529731
Komaki, J., & Goltz, S. M. (2001). Within-Group Research Designs: Going
Beyond Program Evaluation Questions. In C. M. Johnson, W. K. Redmon,
& T. C. Mawhinney (Eds.), Handbook of Organizational Performance:
Behavior Analysis and Management. Haworth Press.
Lipschultz, J. L. (2017) The Effects of Feedback Accuracy on Rumor and
Performance During an Analogue Task. (Unpublished doctoral
dissertation). Florida Institute of Technology, Melbourne, FL.
Michael, J., (1982). Distinguishing between Discriminative and Motivational
Functions of Stimuli. Journal of the Experimental Analysis of Behavior,
37(1), 149-155. https://doi.org/10.1901/jeab.1982.37-149

49
Moon, K., Lee, K., Lee, K., & Oah, S. (2016) The Effects of Social Comparison
and Objective Feedback on Work Performance Across Different
Performance Levels. Journal of Organizational Behavior Management,
37(1), 63-74. https://doi.org/10.1080/01608061.2016.1236059
Palmer, M. G., & Johnson, C. M. (2013). The Effects of Task Clarification and
Group Graphic Feedback on Early Punch-In Times. Journal of
Organizational Behavior Management, 33(4), 265-275.
https://doi.org/10.1080/01608061.2013.843492
Palmer, M. G., & Johnson, C. M., & Johnson, D. A. (2015). Objective Performance
Feedback: Is Numerical Accuracy Necessary? Journal of Organizational
Behavior Management, 35(3-4), 206-239.
https://doi.org/10.1080/01608061.2015.1093059
Pierce, W. D., & Cheney, C. D., (2013). Behavior Analysis and Learning.
Psychology Press.
Reetz, N. K., Whiting, S. W., & Dixon, M. R., (2016). The Impact of a Task
Clarification and Feedback Intervention of Restaurant Service Quality.
Journal of Organizational Behavior Management, 36(4) 322-331.
https://doi.org/10.1080/01608061.2016.1201035

50
Table 1.
Results of a one-way ANOVA to determine statistical differences in second session
for percent of money transfers completed correctly.
Sum of
Squares
df Mean
Square
F Sig.
Between
Groups
373.751 2 186.876 1.061 .355
Within
Groups
7929.368 45 176.208
Total 8303.119 47

51
Table 2.
Results of an ANOVA to determine statistical differences between Session 1 and
Session 2 for percent of money transfers completed correctly (see first row).
Type III
Sum of
Squares
df Mean
Square
F. Sig.
Session 1
vs. Session
2
408.803 1 408.803 3.440 .070
Session 1
vs Session
2 Across
Groups
640.653 2 320.327 2.695 .078
Error
(Session 1
vs. Session
2)
5347.889 45 118.842
Across
Groups
13.947 2 6.973 .022 .978
Error 14431.122 45 320.692

52
Table 3.
Results of a one-way ANOVA to determine statistical differences in second session
for number of money transfers completed correctly.
Sum of
Squares
df Mean
Square
F Sig.
Between
Groups
.667 2 .333 .055 .946
Within
Groups
271.313 45 6.029
Total 271.979 47

53
Table 4.
Results of an ANOVA to determine statistical differences between Session 1 and
Session 2 for number of money transfers completed correctly (see first row).
Type III
Sum of
Squares
df Mean
Square
F Sig.
Session 1
vs. Session
2
33.844 1 33.844 26.675 .000
Session 1 vs
Session 2
Across
Groups
3.562 2 1.781 1.404 .256
Error
(Session 1
vs. Session
2)
57.094 45 1.269
Across
Groups
.896 2 .448 .044 .957
Error 458.344 45 10.185
54
Table 5.
Results of an ANOVA to determine statistical difference between Session 1 and
Session 2 for number of money transfers completed correctly in the high-rank
feedback condition.
Type III
Sum of
Squares
df Mean
Square
F Sig.
Session 1
vs. Session
2
4.500 1 4.500 2.547 .131
Error
(Session 1
vs. Session
2)
26.500 15 1.767
55
Table 6.
Results of an ANOVA to determine statistical difference between Session 1 and
Session 2 for number of money transfers completed correctly in the low-rank
feedback condition.
Type III
Sum of
Squares
df Mean
Square
F Sig.
Session 1
vs. Session
2
10.125 1 0.125 13.966 .002
Error
(Session 1
vs. Session
2)
10.875 15 .725
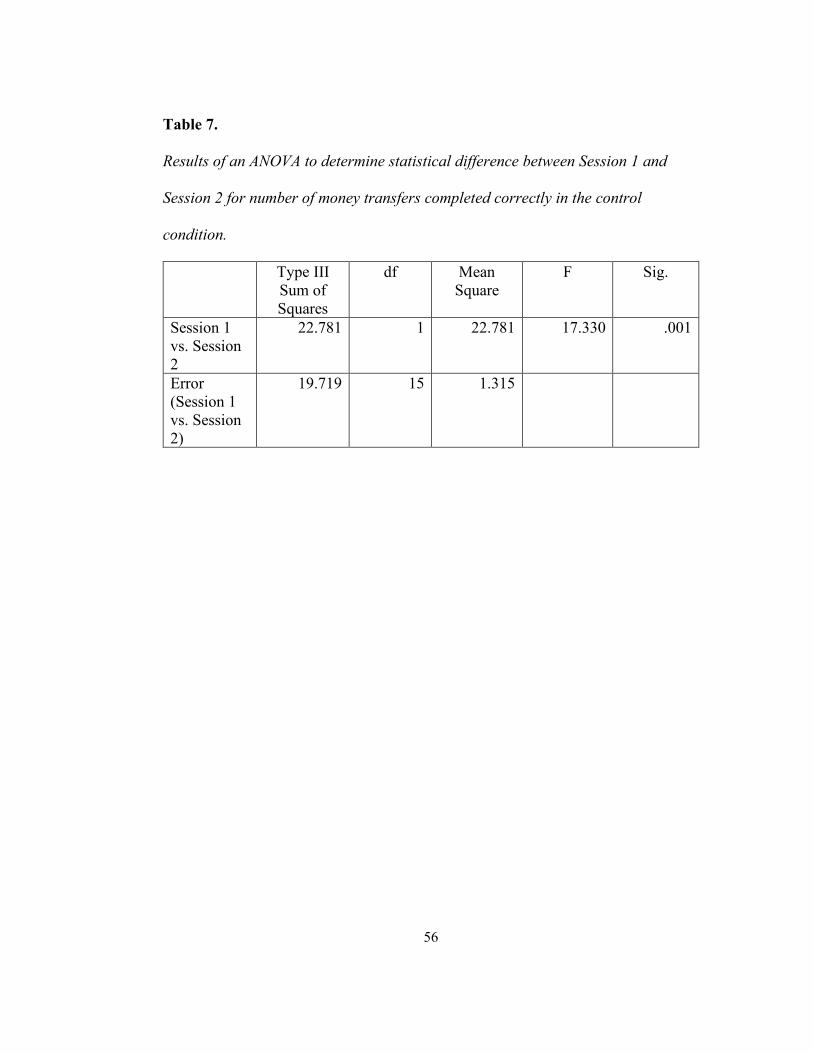
56
Table 7.
Results of an ANOVA to determine statistical difference between Session 1 and
Session 2 for number of money transfers completed correctly in the control
condition.
Type III
Sum of
Squares
df Mean
Square
F Sig.
Session 1
vs. Session
2
22.781 1 22.781 17.330 .001
Error
(Session 1
vs. Session
2)
19.719 15 1.315
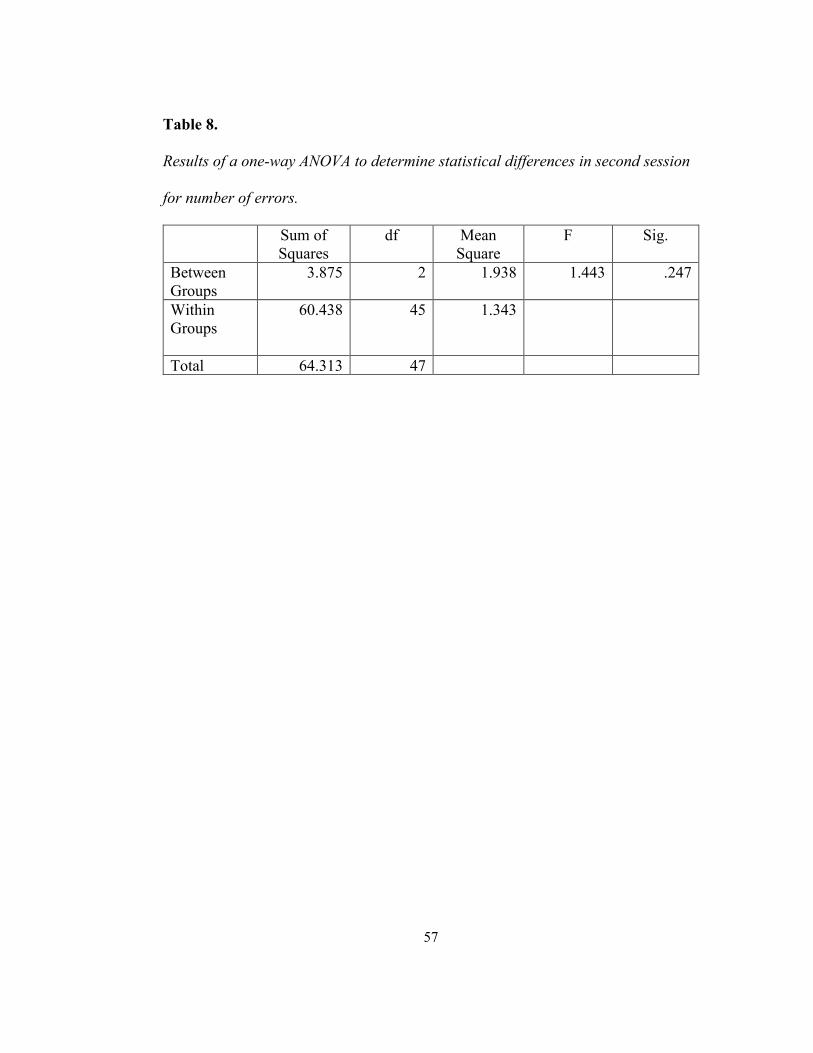
57
Table 8.
Results of a one-way ANOVA to determine statistical differences in second session
for number of errors.
Sum of
Squares
df Mean
Square
F Sig.
Between
Groups
3.875 2 1.938 1.443 .247
Within
Groups
60.438 45 1.343
Total 64.313 47
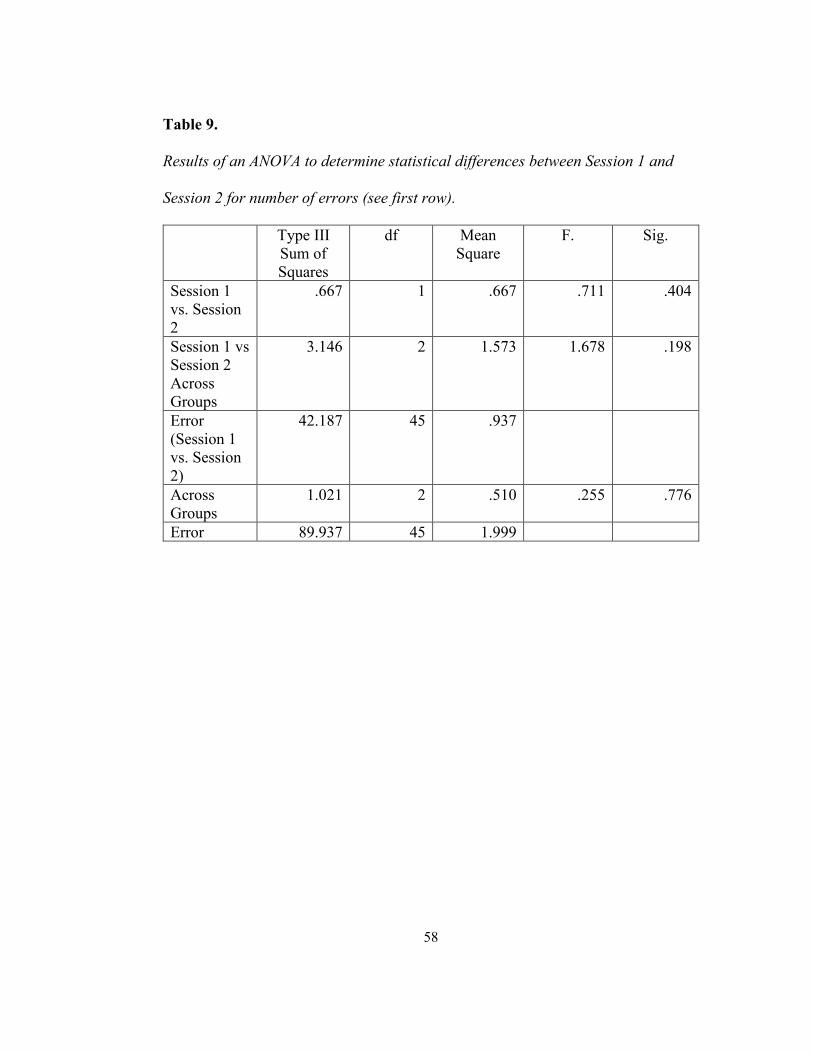
58
Table 9.
Results of an ANOVA to determine statistical differences between Session 1 and
Session 2 for number of errors (see first row).
Type III
Sum of
Squares
df Mean
Square
F. Sig.
Session 1
vs. Session
2
.667 1 .667 .711 .404
Session 1 vs
Session 2
Across
Groups
3.146 2 1.573 1.678 .198
Error
(Session 1
vs. Session
2)
42.187 45 .937
Across
Groups
1.021 2 .510 .255 .776
Error 89.937 45 1.999

59
Table 10.
Mean answers to social validity questions divided by high-rank feedback and low-
rank feedback conditions.
Question High-Rank Feedback
Condition
Low-Rank Feedback
Condition
1.) I enjoyed receiving
feedback comparing my
performance to other
participants.
3.88 4.25
2.) I believe the social
comparison feedback I
received was effective.
3.81 3.94
3.) At the time of
delivery, I believed the
feedback given to me
about my performance
was true.
3.94 3.56
4.) I believe it is
important to study
feedback that compares
one’s performance to
others.
3.69 4.06
5.) The social comparison
feedback I received made
me feel more competitive
4.00 3.88
6.) The social comparison
feedback I received made
me feel anxious, and that
I had to perform well just
to match my peers
2.69 3.13
7.) The social comparison
feedback I received made
me perform better than I
otherwise would have
performed.
3.00 3.38
8.) I would like to receive
social comparison
feedback in the
workplace
3.13 3.88
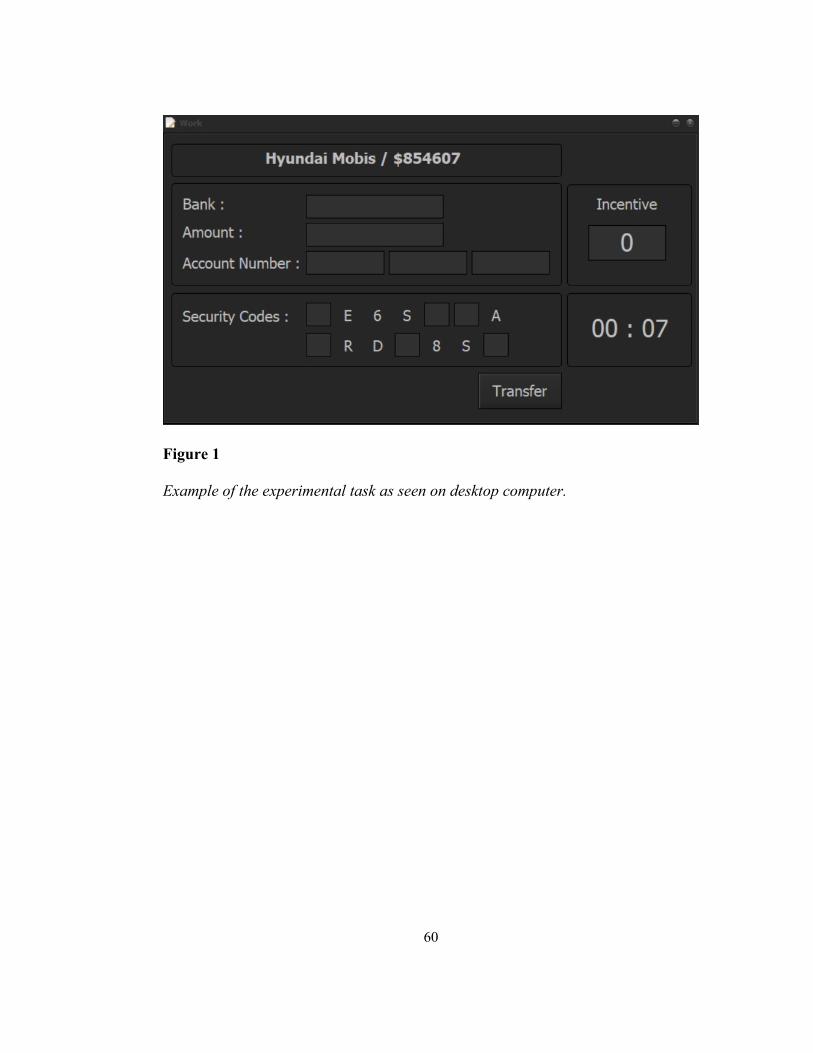
60
Figure 1
Example of the experimental task as seen on desktop computer.

61
Figure 2.
Example of worksheet used to complete experimental task.
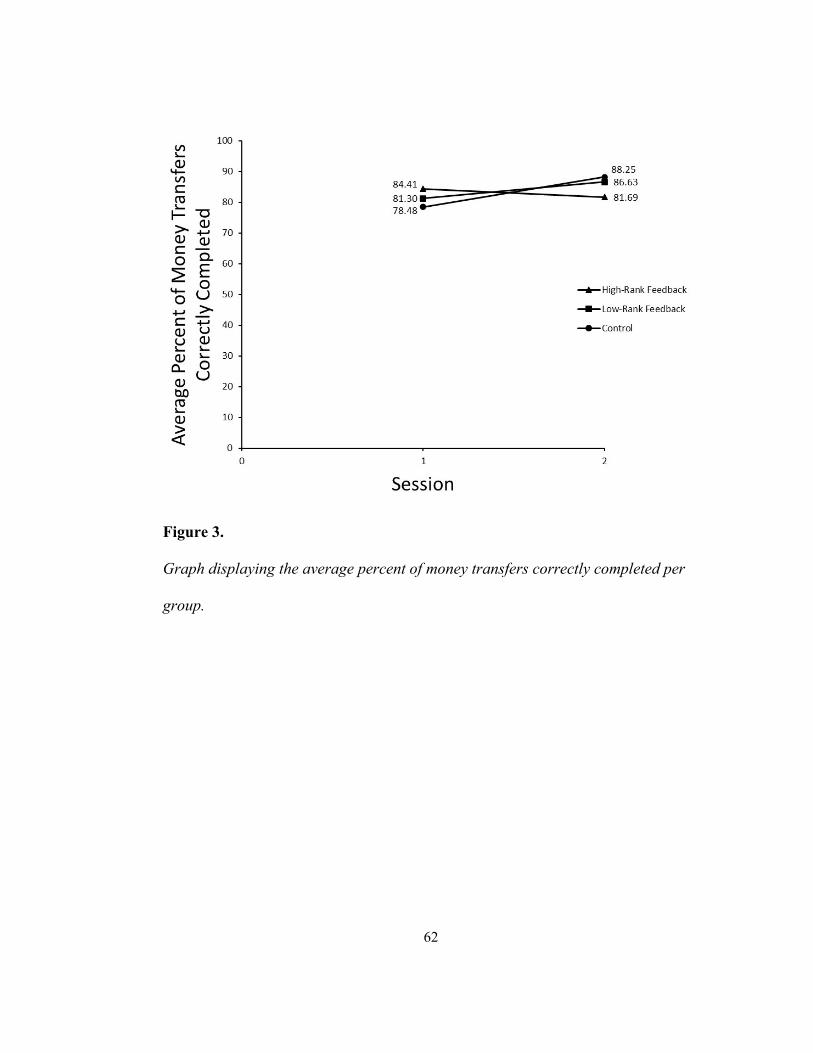
62
Figure 3.
Graph displaying the average percent of money transfers correctly completed per
group.

63
Figure 4.
Graph displaying the average number of money transfers correctly completed per
group.

64
Figure 5.
Graph displaying the average number of errors emitted per group.