Butanol Production from Clostridia Fermentation David L. Hanson Chem 4101 December 9, 2011.
12
Butanol Production from Clostridia Fermentation David L. Hanson Chem 4101 December 9, 2011
-
date post
21-Dec-2015 -
Category
Documents
-
view
218 -
download
0
Transcript of Butanol Production from Clostridia Fermentation David L. Hanson Chem 4101 December 9, 2011.

Butanol Production from Clostridia Fermentation
David L. HansonChem 4101
December 9, 2011

Background Information
Acetic AcidMW: 60.05bp: 117-118 °C
Butyric AcidMW: 88.11bp: 162 °C
ButanolMW: 74.12bp: 116 – 118 °C
-For over 40 years, the world’s butanol supply has been produced industrially via microbial fermentation. Butanol is produced as a fermentation product by bacteria; known as, solventogenic Clostridia, when cultured on glucose-rich media containing acetic acid and butyric acid.
-Recently, butanol has been gaining attention as a possible alternative to petroleum-based gasoline. Much effort is currently being made to reduce production costs to make butanol an economically viable option.

Problem: Currently, butanol production is a discontinuous process. The acetic acid and butyric acid
are added at the start of fermentation. Butanol is produced until the supply of carboxylic acids have been
exhausted. The carboxylic acids are then reintroduced to restart the process. This discontinuity adds to the high
cost of production.
Hypothesis: By determining the individual rates at which the carboxylic acids are utilized by the Clostridia, and continuously adding the acids at these determined rates butanol production can be made to be a continuous process.

Studies Needed to Test Hypothesis
1. Determine the specific ratio of acetic acid/butyric acid that will yield the highest concentration of butanol produced.
2. During fermentation take samples of the media at different time points and measure the concentration of acetic and butyric acid present to determine the rates at which they are utilized
3. Continuously pump acetic/butyric acid into media at determined rate and measure butanol concentration over time to determine if production is stable and continuous.

Requirements for Analytical Method
1) Must be able to separate multiple analytes. - High Selectivity
- High Resolution2) Must be able to detect small changes in amounts of
analyte.- High Sensitivity
3) Must be able to detect broad ranges in analyte amount.- Large Linear Response Range
4) Must be able to quantitate reproducibly.- High Precision-High Accuracy

Possible Separation TechniquesMethod Type Advantages Disadvantages
Reverse Phase HPLC • Limited sample processing required.• Separate wide variety of compounds.• Existing technology/expertise.
• Only separation method is retention.• May require complicated mobile phase buffers.• To improve resolution analysis time must be increased (minutes).
Capillary Zone Electrophoresis
•Very fast analysis times (seconds).
• Analytes will need to be modified to carry charge.• Developing technology/expertise.
Gas Chromatography • High selectivity due to separate by boiling point and retention.• Analysis time fast (seconds to minutes) .• Existing technology/expertise
• Require processing of sample to remove non-volatilizable matrix components

Possible Detection TechniquesMethod Type Advantages Disadvantages
UV-Vis Absorbance • Ease of use.•Non-destructive.
• Need instrumentation capable of measuring multiple wavelengths.• Difficulty detecting low concentrations.•Affected by flow rate.
Mass Spectrometry • Unlimited list of compounds capable of detecting.
• Quantitation difficult, requires radio-labeled isotopes.• Destructive.
Flame Ionization •Very good for hydrocarbon detection.•Ease of use.•High sensitivity(pg/sec).• Large linear response range (~107)
• Limited list of compounds capable of detecting.•Non-selective.• Destructive.

GC-FID
Diagram of GC. Courtesy: Manzi, A.
Diagram of FID. Courtesy: University of Adelaide
Selectivity: GC increases by separating based on retention and boiling pointResolution: Can be controlled in GC controlling the oven temperature.
Precision and Accuracy: FID is mass sensitive and not affected by changes in flow rate. Giving good reproducibility.

Experiment – Sample Prep1. Filtration: Solids and cellular debris
will be removed by using a vacuum filter with a (0.2μm pore size) SFCA membrane (Cat No. 161-0020, NALGENE Lab ware).
2. Evaporation: Glucose and residual salts will be removed from filtered solution by evaporation/condensation using a rotary evaporator (Cat No. 8024701, IKA). Heating temperature ~165°C.
3. Storage: Solution collected in the condensation vessel will be transferred to 50mL centrifuge tubes (Cat No. 89039-656, VWR) and stored at room temperature until analysis.

Experiment – GC Method
Method ParametersInjection Temperature: 212 °COven Temperature Gradient: 110-175 °CCarrier Gas: Helium
Column ParametersType: HP-INNOwax column (Agilent Technologies Part#29091N-133LTM) Stationary Phase: bonded polyethylene glycol (high polarity)Particle Size: 0.25µmLength: 30mDiameter: 0.25mmStability: >1800°C
ControlsAcetic Acid: Sigma-Aldrich Cat# 320099 - ACS reagent, ≥99.7%Butyric Acid: Sigma Aldrich Cat# B103500 - ≥99%Butanol: Sigma Aldrich Cat# 360465 - ACS reagent, ≥99.4%
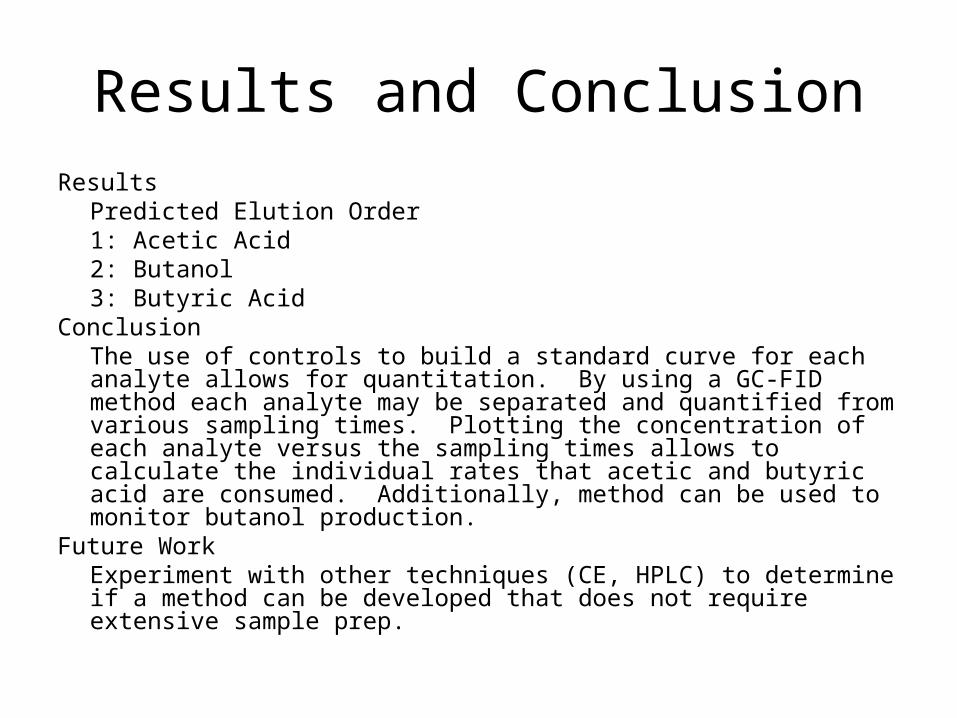
Results and ConclusionResults
Predicted Elution Order1: Acetic Acid 2: Butanol3: Butyric Acid
ConclusionThe use of controls to build a standard curve for each analyte allows for quantitation. By using a GC-FID method each analyte may be separated and quantified from various sampling times. Plotting the concentration of each analyte versus the sampling times allows to calculate the individual rates that acetic and butyric acid are consumed. Additionally, method can be used to monitor butanol production.
Future WorkExperiment with other techniques (CE, HPLC) to determine if a method can be developed that does not require extensive sample prep.

References1. Agilent Technology. HP-INNOwax Columns.
http://www.chem.agilent.com/en-US/products/columns-supplies/gc-gc-mscolumns/jwhp-innowax/Pages/default.aspx (accessed Nov 10, 2011)
2. IKA Technology. http://www.ika.com/ (accessed Nov 3, 2011)3. Lee, S., Cho, M., Park, C., Chung, Y., Kim, J., Sang, B., et al. (2008). Continuous butanol
production using suspended and immobilized Clostridium beijerinckii NCIMB 8052 with supplementary butyrate. Energy & Fuels, 22(5), 3459-3464.
4. Manzi, A. (2001). Total Compositional Analysis by High Performance Liquid ‐Chromatography or Gas Liquid Chromatography‐ . Current Protocols in Molecular Biology, [http://www.currentprotocols.com/protocol/mb1719a]
5. NALGENE Labware. http://www.nalgenelabware.com/ (accessed Nov 3, 2011)6. Schmid, R.D., Pocket Guide to Biotechnology and Genetic Engineering; Wiley-VCH:
Weinheim, Germany, 2003.7. Sigma-Aldrich. http://www.sigmaaldrich.com/united-states.html (accessed Nov 3, 2011)8. Skoog , D, et al. Principles of Instrumental Analysis, 6th ed.; Brooks/Cole: Belmont, CA,
2007.9. University of Adelaide: Department of Chemistry. Flame Ionization Detector (FID).
http://www.chemistry.adelaide.edu.au/external/soc-rel/content/fid.htm (accessed Dec 6,2011)
10. VWR. https://www.vwrsp.com/index.cgi (accessed Nov 3, 2011)