Business Valuation Report Writer - Home - ValuSource€¦ · Business Valuation Report Writer ......
189
Business Valuation Report Writer Sample Report 800.825.8763 • 719.548.4900 Fax: 719.548.4479 [email protected] www.valusource.com
Transcript of Business Valuation Report Writer - Home - ValuSource€¦ · Business Valuation Report Writer ......

Business Valuation
Report Writer Sample Report
800.825.8763 • 719.548.4900
Fax: 719.548.4479
www.valusource.com

HELPER TEXT
Template Overview
This template provides a thorough starting point for an excellent business valuation
report based on IRS Revenue Ruling 59-60. The finished report must explain how the
author arrived at the conclusion of value, and all of the assumptions must bedocumented. Each business valuation report must be unique to the fact pattern at
the valuation date. Because every fact pattern is different, many items in this reportare not complete. Again, the text provided is intended as only a starting point. You
must edit the document into a report that fits the fact pattern. The template maps
many of the needed schedules and reference points to increase the efficiency andeffectiveness of the time that you spend writing reports.
VALUATION OF THE COMMON STOCK OF:
«Child's Clothing Store»
«12345 Street Name»
Valuation Date: «December 31, 2006»
Report Dated: «March 15, 2007»

OPINION LETTER
HELPER TEXT
The paragraphs below provide a basis for the opinion letter. Almost all of the cell
references for the opinion letter come from Pro’s general data schedules, such asReport Writer Data, Appraiser Data, Business Profile, and Owner Info.
«March 15, 2007»
«Mr. Attorney»«1234 Street Address»«New York, NY 100001»
Dear «Mr. Attorney»,
The enclosed valuation report has been developed for the exclusive and confidential useof «Mr. Attorney». The report has been prepared by «Joe Appraiser CPA» dated «March15, 2007» and was made by and/or under the direct supervision of the undersigned. Thepurpose of the valuation is to render an opinion as to the fair market value of the«common stock interest», as of «December 31, 2006».
HELPER TEXT
In the next paragraph, replace the highlighted phrase with the source of the
information.
In preparing «my» business valuation report, «I» have relied upon historical financialinformation provided to «me» by management and derived from [enter the appropriatesource of the information, such as tax return, audit report issued by another auditor, etc.].This financial information has not been audited, reviewed, or compiled by «me» andaccordingly «I» do not express an opinion or any form of assurance on this financialinformation.
«My» report is based on historical and prospective financial information provided to«me» by management and other third parties. Users of this valuation report should beaware that business valuations are based on future earnings potential that may or may notmaterialize. Therefore, the actual results achieved during the projection period will varyfrom the projections used in this valuation, and the variations may be material. Theaccompanying report discusses all the assumptions and limiting conditions that apply tothis opinion of value and are integral to the understanding of the opinion.
Based upon «my» study and analytical review procedures, «I» have concluded that areasonable estimate of the fair market value of a «80%» «common stock interest» of«Child's Clothing Store» as of «December 31, 2006» is $«285,900».
HELPER TEXT
You may want to add a statement about the per share value if it is appropriate.
This engagement was not contingent upon developing or reporting predetermined results.«My» compensation for completing this assignment is not contingent upon thedevelopment or reporting of a predetermined value or direction in value that favors the

cause of the client, the amount of the value opinion, the attainment of a stipulated result,or the occurrence of a subsequent event directly related to the intended use of thisappraisal. «My» analyses, opinions, and conclusions were developed, and this report hasbeen prepared, in conformity with the Uniform Standards of Professional Appraisal
Practice. No one provided significant business appraisal assistance to the person signingthis certification.
HELPER TEXT
If there are exceptions to the last sentence in the preceding paragraph, then deletethe sentence, and list each entity and the significant business appraisal assistance
that they provided.
Sincerely yours,
«Joe Appraiser»«Joe Appraiser CPA»
HELPER TEXT
You may want to include the title of the appraiser.

Table of Contents i
TABLE OF CONTENTS
HELPER TEXT
To update the following Table of Contents, select it, then press F9.
EXECUTIVE SUMMARY ......................................................................................1
INTRODUCTION ...............................................................................................2
Specifics .............................................................................................................2
Definitions ..........................................................................................................2
Standard of Value.................................................................................................2
Premise of Value ..................................................................................................3
SOURCES OF INFORMATION..............................................................................4
APPROACH ......................................................................................................5
Assumptions........................................................................................................6
Scope Limitation ..................................................................................................6
COMPANY........................................................................................................7
History ...............................................................................................................7
Nature of the Business ..........................................................................................7
Products or Services .............................................................................................7
Operating and Investment Assets............................................................................7
Capital Structure..................................................................................................7
Sales Records and Management..............................................................................7
Expectations........................................................................................................7
APPRAISAL OF ECONOMIC CONDITIONS .............................................................8
National Economy.................................................................................................8
Industry Outlook ..................................................................................................9
COMPANY BALANCE SHEETS............................................................................10
RMA Peer Comparisons........................................................................................ 12
IRS Peer Comparisons......................................................................................... 15
Other Peer Comparisons...................................................................................... 16
COMPANY PROFIT AND LOSS...........................................................................19
NORMALIZATION ADJUSTMENTS......................................................................22
Balance Sheet Adjustments.................................................................................. 22
Income Statement Adjustments............................................................................ 22
ESTIMATE OF VALUE ......................................................................................23
Methodologies Considered But Rejected ................................................................. 23
Determination of Fair Market Value ....................................................................... 25
CONCLUSION OF VALUE................................................................................ 164
OPINION..................................................................................................... 165

Table of Contents ii
APPENDIX A: VALUATION CERTIFICATION AND SIGNATURE OF THE ANALYST..... 166
APPENDIX B: LIMITING CONDITIONS ............................................................. 167
APPENDIX C: QUALIFICATIONS OF APPRAISER ................................................ 171
APPENDIX D: SOURCES OF INFORMATION ...................................................... 172
APPENDIX E: MARKETABILITY DISCOUNT ....................................................... 173
Empirical Studies.............................................................................................. 174
Court Decisions................................................................................................ 175
APPENDIX F: GLOSSARY ............................................................................... 177
EXHIBITS.................................................................................................... 183

Executive Summary Page 1 of 188
EXECUTIVE SUMMARY
HELPER TEXT
The table below provides a quick snapshot of the key assumptions and information.
The author may want to add rows to this table and add the control premium/minoritydiscount, marketability discount, excess assets and per share values if they apply by
using the Insert Link from Excel command.
Governing Standard: Revenue Ruling 59-60
Purpose: Estate or Gift Tax
Standard of Value: Fair Market Value
Premise of Value: «value as a going concern»
Client Name: «Mr. Attorney»
Business Name: «Child's Clothing Store»
Type of Entity: «corporation»
Business Interest Valued: «80%»
Valuation Date: «December 31, 2006»
Report Date: «March 15, 2007»
Appraiser Name: «Joe Appraiser»
Appraiser Firm: «Joe Appraiser CPA»
Conclusion of Value: $«357,400»

Introduction Page 2 of 188
INTRODUCTION
HELPER TEXT
The purpose of the Introduction is to provide a theoretical background for the fact
pattern. The specifics of the engagement must be discussed. The scope and limitingconditions can be referenced to this area or to the appendixes or both.
Specifics«Joe Appraiser CPA» has been retained by «Mr. Attorney» to estimate the fair marketvalue of «Child's Clothing Store». «Child's Clothing Store» is a «corporation» located at«12345 Street Name» in «CO». Furthermore, an interest of «80%» is being valued as of«December 31, 2006».
HELPER TEXT
In the following paragraph, replace the highlighted text with the purpose of the
valuation report. Since this is a 59-60 report, the purpose is either settlement of anestate or gift tax.
The appraisal will be used by «Mr. Attorney» for the sole purpose of the settlement of the[estate / gift tax]. The distribution of this report is restricted to the «Mr. Attorney», legaland tax professionals advising «Mr. Attorney» and any regulatory agencies wherebyreporting is required. Any other use of this report is unauthorized and the informationincluded in the report should not be relied upon.
DefinitionsAppendix F has a glossary of terms that is applicable to this engagement. In addition tothose definitions the following are pertinent:
HELPER TEXT
Either delete the last sentence in the preceding paragraph, or insert the pertinentdefinitions here.
Standard of ValueRevenue Ruling 59-60 defines fair market value as:
The amount at which property would change hands between a willing sellerand a willing buyer when neither is under compulsion and when both havereasonable knowledge of the relevant facts.
In addition, the hypothetical seller and the hypothetical buyer must be in a pool that hasthe ability to exercise the right.

Introduction Page 3 of 188
Premise of ValueHELPER TEXT
This paragraph defines the most common premise of value. Either modify it or
change it to describe the specific fact pattern.
This report is prepared using the premise that the subject company is a going concern..This means that it is presumed that in the future the assemblage of assets, resources andincome producing items will continue in use to produce income and cash flow. Thesubject company is a going concern business enterprise.

Sources of Information Page 4 of 188
SOURCES OF INFORMATION
HELPER TEXT
The sources of information should be disclosed. The primary reason is so that a
different analyst could derive the same conclusion as the author if the sameinformation was interpreted the same way and if the same assumptions were used.
This is not to say that a different analyst would reach the same conclusion becauseof honest differences in opinion and interpretation, but that the conclusion in this
report could be substantiated. The sources of information can be discussed in this
section, in the appendix, or both.
The primary sources of information were research on the economy, industry andcompany, analysis of financial statement and interviews with key people. Please seeAppendix D for a complete listing.
Approach Page 5 of 188
APPROACH
Revenue Ruling 59-60 states:
.01 It is advisable to emphasize that in the valuation of the stock of closelyheld corporations or the stock of corporations where market quotations areeither lacking or too scarce to be recognized, all available financial data, aswell as all relevant factors affecting the fair market value, should beconsidered. The following factors, although not all- inclusive are fundamentaland require careful analysis in each case:
(a) The nature of the business and the history of the enterprise from itsinception.
(b) The economic outlook in general and the condition and outlook of thespecific industry in particular.
(c) The book value of the stock and the financial condition of the business.
(d) The earning capacity of the company.
(e) The dividend-paying capacity.
(f) Whether or not the enterprise has goodwill or other intangible value.
(g) Sales of the stock and the size of the block of stock to be valued.
(h) The market price of stocks of corporations engaged in the same or asimilar line of business having their stocks actively traded in a free andopen market, either on an exchange or over-the-counter.
«My» approach gives careful consideration to all these factors.
There are three basic approaches to value.
Asset Based Approach: A general way of determining a value indication of a business’sassets and/or equity using one or more methods based directly on the value of the assetsof the business less liabilities.
Income Approach: A general way of determining a value indication of a business’sassets and/or equity using one or more methods wherein a value is determined byconverting anticipated benefits.
Market Approach: A general way of determining a value indication of a business’s assetsand/or equity using one or more methods that compare the subject to similar investmentsthat have been sold.
The various methods of valuation that appraisers use in practice are typically consideredas subdivisions of these broad approaches. Valuation methods under the Market andIncome approaches generally contain common characteristics such as measures ofearning power, discount rates and/or capitalization rates and multiples.
Approach Page 6 of 188
AssumptionsHELPER TEXT
Explain the key assumptions. These assumptions can include such things as a major
contract being signed, key personnel not leaving the operations of the company, orthe opposite (major contract will not be signed, key personnel will leave).
There are several key assumptions that this report relies on.
HELPER TEXT
In the following paragraph, replace the highlighted text with the name of the
valuation standards that were followed in preparing the report.
This valuation report has been prepared in accordance with the [state which standardswere used, such as the Uniform Standards of Professional Appraisal Practice]. Inaccordance with these standards, a Statement of Contingent and Limiting Conditions isprovided as Appendix B. and a Statement of Appraiser Qualifications is included inAppendix C.
Scope LimitationHELPER TEXT
This section explains any limitations to the scope of the report. If the scope was not
limited, then that should be stated here as well. It strongly recommended that thissection be edited for fact pattern.
The scope of this valuation engagement report was limited. «I was» engaged to perform avaluation for «Child's Clothing Store» with the intent of ascertaining an opinion of value.However, «I was» limited to the information that was provided as of «December 31,2006» regarding [The author must list the deficiency in the data relied on to develop avalue. If there are no scope limitations then this section should be changed to reflect thatas well.]. If more information were available to «me», matters may have come to «my»attention that could have a material impact on the opinion of value contained in thisreport.
Accordingly, «my» level of assurance on the estimate of value is reduced. This report isnot intended to serve as a basis for expert testimony in a court of law or othergovernmental agency without further analysis and resulting documentation.

Company Page 7 of 188
COMPANY
HELPER TEXT
Revenue Ruling 59-60 requires the analysis of the company. The following headings
are just suggestions. Any headings that make sense should be used. In this sectionyou must demonstrate sufficient knowledge of the subject company to substantiate
your conclusion of value. The subject company has risks associated with it thatdirectly affect its value. This section is where you explain those risks.
History
Nature of the Business
Products or Services
Operating and Investment Assets
Capital Structure
Sales Records and Management
Expectations

Appraisal of Economic Conditions Page 8 of 188
APPRAISAL OF ECONOMIC CONDITIONS
HELPER TEXT
Revenue Ruling 59-60 states:
[…] (b) A sound appraisal of a closely held stock must consider currentand prospective economic conditions as of the date of appraisal, both
in the national economy and in the industry or industries with whichthe corporation is allied. It is important to know that the company is
more or less successful than its competitors in the same industry, or
that it is maintaining a stable position with respect to competitors.Equal or even greater significance may attach to the ability of the
industry with which the company is allied to compete with other
industries. Prospective competition which has not been a factor in prioryears should be given careful attention. For example, high profits due
to the novelty of its product and the lack of competition often lead to
increasing competition. The public's appraisal of the future prospectsof competitive industries or of competitors within an industry may be
indicated by price trends in the markets for commodities and forsecurities. The loss of the manager of a so-called “one-man” business
may have a depressing effect upon the value of the stock of such
business, particularly if there is a lack of trained personnel capable ofsucceeding to the management of the enterprise. In valuing the stock
of this type of business, therefore, the effect of the loss of the
manager on the future expectancy of the business, and the absence ofmanagement-succession potentialities are pertinent factors to be taken
into consideration. On the other hand, there may be factors which
offset, in whole or in part, the loss of the manager's services. Forinstance, the nature of the business and of its assets may be such that
they will not be impaired by the loss of the manager. Furthermore, the
loss may be adequately covered by life insurance, or competentmanagement might be employed on the basis of the consideration paid
for the former manager's services. These, or other offsetting factors, iffound to exist, should be carefully weighed against the loss of the
manager's services in valuing the stock of the enterprise.
The paragraphs below explain how the economy and the industry will affect theprospects of the subject company. The author must demonstrate a knowledge of the
environment in which the subject company operates because of the risks associated
with it, and hence its value. The headings are just suggestions and need to bemodified for the specific fact pattern.
National EconomyHELPER TEXT
For report text and analysis on the national economy by quarter that you can “drop”
into your report, call ValuSource at 1-800-825-8763 and ask about the NationalEconomic Review.
Appraisal of Economic Conditions Page 9 of 188
General Overview
Specific Areas – Consumer Spending
Specific Areas – Real Estate and Construction
Specific Areas – Inflation
Summary
Industry Outlook
General Overview
Specific Areas – Consumer Spending
Specific Areas – Real Estate and Construction
Specific Areas – Inflation
Summary

Company Balance Sheets Page 10 of 188
COMPANY BALANCE SHEETS
HELPER TEXT
Revenue Ruling 59-60 states:
[…] (c) Balance sheets should be obtained, preferably in the form ofcomparative annual statements for two or more years immediately
preceding the date of appraisal, together with a balance sheet at theend of the month preceding that date, if corporate accounting will
permit. Any balance sheet descriptions that are not self-explanatory,
and balance sheet items comprehending diverse assets or liabilities,should be clarified in essential detail by supporting supplemental
schedules. These statements usually will disclose to the appraiser (1)
liquid position (ratio of current assets to current liabilities); (2) grossand net book value of principle classes of fixed assets; (3) working
capital; (4) long-term indebtedness; (5) capital structure; and (6) net
worth. Consideration also should be given to any assets not essentialto the operation of the business, such as investments in securities, real
estate, etc. In general, such nonoperating assets will command alower rate of return than do the operating assets, although in
exceptional cases the reverse may be true. In computing the book
value per share of stock, assets of the investment type should berevalued on the basis of their market price and the book value
adjusted accordingly. Comparison of the company's balance sheets
over several years may reveal, among other facts, such developmentsas the acquisition of additional production facilities or subsidiary
companies, improvement in financial position, and details as to
recapitalizations and other changes in the capital structure of thecorporation. If the corporation has more than one class of stock
outstanding, the charter or certificate of incorporation should be
examined to ascertain the explicit rights and privileges of the variousstock issues including: (1) voting powers, (2) preference as to
dividends, and (3) preference as to assets in the event of liquidation.The paragraphs below explain how the above was made and why the
assumptions made were adequate in this engagement.
This section should discuss the balance sheets of the company, including pertinentfinancial ratios and comparisons to a peer group. Additional headings may be
required. The peer group discussions in this section can be referenced in subsequent
sections of the report.
The summary balance sheets from your Pro project follow. Feel free to delete them if
they are not suitable for this report.

Com
pany B
ala
nce S
heets
Page
11
of
188
Su
mm
ary
Bala
nce
Sh
eets
«
Ye
ar
En
de
d
Ye
ar
En
de
d
Ye
ar
En
de
d
Ye
ar
En
de
d
Ye
ar
En
de
dD
ece
mb
er
31
,
20
02
De
ce
mb
er
31
,
20
03
De
ce
mb
er
31
,
20
04
De
ce
mb
er
31
,
20
05
De
ce
mb
er
31
,
20
06
AS
SE
TS
Cash
229,0
00
356,0
00
465,0
00
387,0
00
549,0
00
Acc
ounts
Rece
ivable
40,0
00
50,0
00
66,0
00
55,0
00
140,0
00
Invento
ry270,0
00
373,0
00
440,0
00
490,0
00
840,0
00
Oth
er
Curr
ent
Ass
ets
40,0
00
38,0
00
52,0
00
75,0
00
80,0
00
Tota
lCurr
ent
Ass
ets
579,0
00
817,0
00
1,0
23,0
00
1,0
07,0
00
1,6
09,0
00
Fix
ed A
ssets
886,0
00
979,0
00
1,0
31,0
00
1,3
49,0
00
1,3
38,0
00
Net
Inta
ngib
le0
095,0
00
85,0
00
75,0
00
Oth
er
Non-C
urr
ent
85,0
00
90,0
00
70,0
00
159,0
00
73,0
00
To
tal
Asse
ts1,5
50,0
00
1,8
86,0
00
2,2
19,0
00
2,6
00,0
00
3,0
95,0
00
LIA
BIL
ITIE
S&
EQ
UIT
Y
Acc
ounts
Payable
45,0
00
55,0
00
60,0
00
75,0
00
74,0
00
Short
Term
Note
s Payable
25,0
00
25,0
00
18,0
00
27,0
00
33,0
00
Curr
ent
Port
ion o
f LT
Debt
12,0
00
14,0
00
16,0
00
26,0
00
28,0
00
Oth
er
Curr
ent
Lia
bili
ties
44,0
00
45,0
00
57,0
00
77,0
00
74,0
00
Tota
lCurr
ent
Lia
bili
ties
126,0
00
139,0
00
151,0
00
205,0
00
209,0
00
Long
Term
Debt
750,0
00
980,0
00
1,1
10,0
00
1,2
00,0
00
1,3
70,0
00
Oth
er
Non-C
urr
ent
Lia
bili
ties
59,0
00
62,0
00
53,0
00
70,0
00
71,0
00
Tota
l Lia
bili
ties
935,0
00
1,1
81,0
00
1,3
14,0
00
1,4
75,0
00
1,6
50,0
00
Tota
lEquity
615,0
00
705,0
00
905,0
00
1,1
25,0
00
1,4
45,0
00
To
tal
Lia
bil
itie
s&
Eq
uit
y1,5
50,0
00
1,8
86,0
00
2,2
19,0
00
2,6
00,0
00
3,0
95,0
00
»

Company Balance Sheets Page 12 of 188
HELPER TEXT
In Pro, you select the RMA data from the following schedules: Comparative BalanceSheets, Comparative Income Statements, and Comparative Financial Ratios.
RMA Peer ComparisonsHELPER TEXT
In the following paragraph the SIC code is from the subject company and may notmatch the RMA SIC number.
For purposes of comparison with industry financial measures available from non-publiccompany sources, «I» reviewed the Annual Statement Studies, published by The RiskManagement Association (RMA). RMA compiled average percentage income statementand balance sheets and key financial ratios of companies classified under StandardIndustrial Classification (SIC) # «5461». «I» believe the RMA data provide limitedcomparative perspective and strict comparisons should be made with caution.
The following liquidity ratios are compared to the subject company.

Company Balance Sheets Page 13 of 188
«RMA RMA RMA RMA RMA
2002 2003 2004 2005 2006
Child's Child's Child's Child's Child's
Based On Historical Statements 2002 2003 2004 2005 2006
LIQUIDITY RATIOS:
Upper Current Ratio 2.60 3.00 3.00 3.30 3.80
Median Current Ratio 1.80 1.70 1.70 1.70 1.80
Lower Current Ratio 1.40 1.30 1.30 1.30 1.30
Subject Current Ratio 4.60 5.88 6.77 4.91 7.70
Upper Quick (Acid-Test) Ratio 1.80 1.90 1.70 1.80 2.00
Median Quick (Acid-Test) Ratio 0.90 0.80 0.80 0.90 1.00
Lower Quick (Acid-Test) Ratio 0.40 0.40 0.50 0.50 0.50
Subject Quick (Acid-Test) Ratio 2.13 2.92 3.52 2.16 3.30
Upper Revenues/Receivable 16.60 18.50 16.40 24.10 17.00
Median Revenues/Receivable 9.60 8.50 8.20 10.10 8.80
Lower Revenues/Receivable 7.10 5.90 6.20 6.80 5.80
Subject Revenues/Receivable 52.50 58.70 60.15 94.44 42.61
Upper Days' Receivables 22 20 22 15 21
Median Days' Receivables 38 43 45 36 41
Lower Days' Receivables 51 62 59 54 63
Subject Days' Receivables 7 6 6 4 9
Upper Cost of Sales to Inventory 13.00 11.20 9.90 9.20 12.90
Median Cost of Sales to Inventory 5.00 5.50 4.90 4.40 5.20
Lower Cost of Sales to Inventory 2.90 2.70 2.90 2.60 2.60
Subject Cost of Sales to Inventory 2.22 2.35 2.50 3.16 2.24
Upper Days' Inventory 28 33 37 40 28
Median Days' Inventory 73 66 74 83 70
Lower Days' Inventory 126 135 126 140 140
Subject Days' Inventory 164 156 146 115 163
Upper Cost of Sales to Payables 40.50 22.80 32.70 40.80 60.10
Median Cost of Sales to Payables 20.10 11.90 15.70 14.50 16.30
Lower Cost of Sales to Payables 8.90 6.20 8.40 7.10 8.50
Subject Cost of Sales to Payables 13.33 15.91 18.33 20.67 25.41
Upper Days' Payables 9 16 11 9 6
Median Days' Payables 18 31 23 25 22
Lower Days' Payables 41 59 43 51 43
Subject days' Payables 27 23 20 18 14
Upper Sales to Working Capital 4.60 4.60 3.80 3.90 4.10
Median Sales to Working Capital 7.30 8.10 7.20 7.70 7.80
Lower Sales to Working Capital 13.50 13.80 19.80 17.20 17.40
Subject Sales to Working Capital 4.64 4.33 4.55 6.48 4.26
»
The following coverage and leverage ratios are compared to the subject Company.
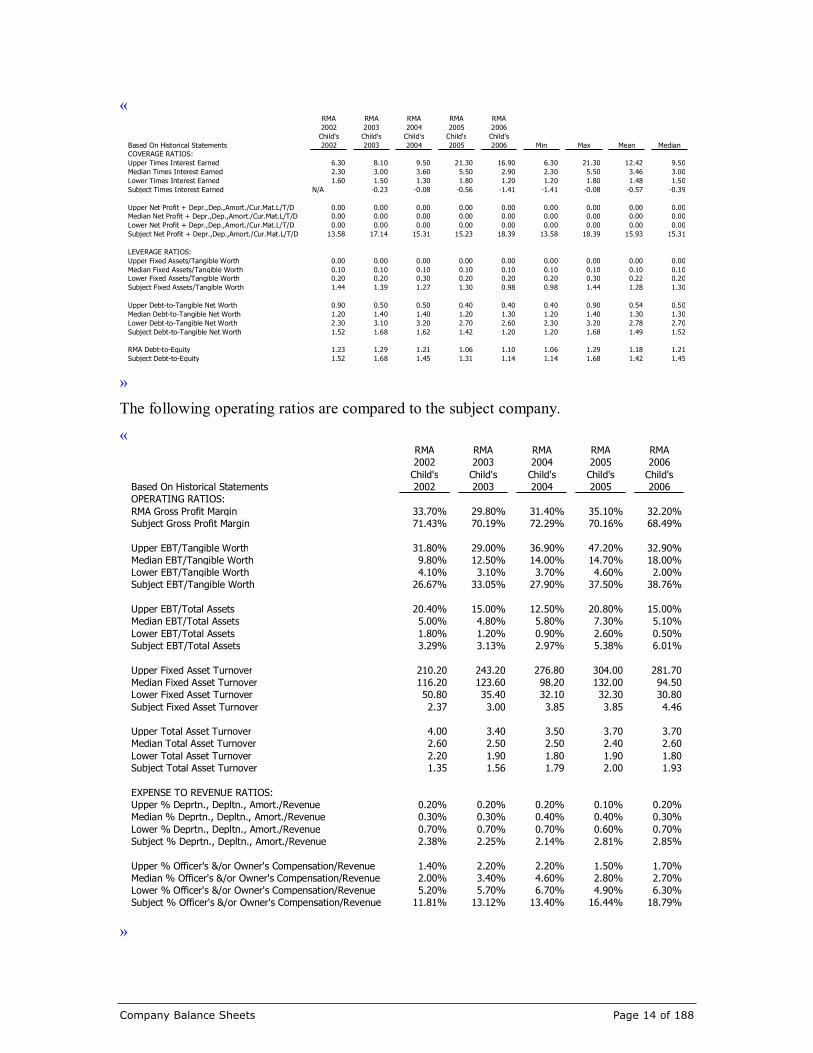
Company Balance Sheets Page 14 of 188
«RMA RMA RMA RMA RMA
2002 2003 2004 2005 2006
Child's Child's Child's Child's Child's
Based On Historical Statements 2002 2003 2004 2005 2006 Min Max Mean Median
COVERAGE RATIOS:
Upper Times Interest Earned 6.30 8.10 9.50 21.30 16.90 6.30 21.30 12.42 9.50
Median Times Interest Earned 2.30 3.00 3.60 5.50 2.90 2.30 5.50 3.46 3.00
Lower Times Interest Earned 1.60 1.50 1.30 1.80 1.20 1.20 1.80 1.48 1.50
Subject Times Interest Earned N/A -0.23 -0.08 -0.56 -1.41 -1.41 -0.08 -0.57 -0.39
Upper Net Profit + Depr.,Dep.,Amort./Cur.Mat.L/T/D 0.00 0.00 0.00 0.00 0.00 0.00 0.00 0.00 0.00
Median Net Profit + Depr.,Dep.,Amort./Cur.Mat.L/T/D 0.00 0.00 0.00 0.00 0.00 0.00 0.00 0.00 0.00
Lower Net Profit + Depr.,Dep.,Amort./Cur.Mat.L/T/D 0.00 0.00 0.00 0.00 0.00 0.00 0.00 0.00 0.00
Subject Net Profit + Depr.,Dep.,Amort./Cur.Mat.L/T/D 13.58 17.14 15.31 15.23 18.39 13.58 18.39 15.93 15.31
LEVERAGE RATIOS:
Upper Fixed Assets/Tangible Worth 0.00 0.00 0.00 0.00 0.00 0.00 0.00 0.00 0.00
Median Fixed Assets/Tangible Worth 0.10 0.10 0.10 0.10 0.10 0.10 0.10 0.10 0.10
Lower Fixed Assets/Tangible Worth 0.20 0.20 0.30 0.20 0.20 0.20 0.30 0.22 0.20
Subject Fixed Assets/Tangible Worth 1.44 1.39 1.27 1.30 0.98 0.98 1.44 1.28 1.30
Upper Debt-to-Tangible Net Worth 0.90 0.50 0.50 0.40 0.40 0.40 0.90 0.54 0.50
Median Debt-to-Tangible Net Worth 1.20 1.40 1.40 1.20 1.30 1.20 1.40 1.30 1.30
Lower Debt-to-Tangible Net Worth 2.30 3.10 3.20 2.70 2.60 2.30 3.20 2.78 2.70
Subject Debt-to-Tangible Net Worth 1.52 1.68 1.62 1.42 1.20 1.20 1.68 1.49 1.52
RMA Debt-to-Equity 1.23 1.29 1.21 1.06 1.10 1.06 1.29 1.18 1.21
Subject Debt-to-Equity 1.52 1.68 1.45 1.31 1.14 1.14 1.68 1.42 1.45
»
The following operating ratios are compared to the subject company.
«RMA RMA RMA RMA RMA
2002 2003 2004 2005 2006
Child's Child's Child's Child's Child's
Based On Historical Statements 2002 2003 2004 2005 2006
OPERATING RATIOS:
RMA Gross Profit Margin 33.70% 29.80% 31.40% 35.10% 32.20%
Subject Gross Profit Margin 71.43% 70.19% 72.29% 70.16% 68.49%
Upper EBT/Tangible Worth 31.80% 29.00% 36.90% 47.20% 32.90%
Median EBT/Tangible Worth 9.80% 12.50% 14.00% 14.70% 18.00%
Lower EBT/Tangible Worth 4.10% 3.10% 3.70% 4.60% 2.00%
Subject EBT/Tangible Worth 26.67% 33.05% 27.90% 37.50% 38.76%
Upper EBT/Total Assets 20.40% 15.00% 12.50% 20.80% 15.00%
Median EBT/Total Assets 5.00% 4.80% 5.80% 7.30% 5.10%
Lower EBT/Total Assets 1.80% 1.20% 0.90% 2.60% 0.50%
Subject EBT/Total Assets 3.29% 3.13% 2.97% 5.38% 6.01%
Upper Fixed Asset Turnover 210.20 243.20 276.80 304.00 281.70
Median Fixed Asset Turnover 116.20 123.60 98.20 132.00 94.50
Lower Fixed Asset Turnover 50.80 35.40 32.10 32.30 30.80
Subject Fixed Asset Turnover 2.37 3.00 3.85 3.85 4.46
Upper Total Asset Turnover 4.00 3.40 3.50 3.70 3.70
Median Total Asset Turnover 2.60 2.50 2.50 2.40 2.60
Lower Total Asset Turnover 2.20 1.90 1.80 1.90 1.80
Subject Total Asset Turnover 1.35 1.56 1.79 2.00 1.93
EXPENSE TO REVENUE RATIOS:
Upper % Deprtn., Depltn., Amort./Revenue 0.20% 0.20% 0.20% 0.10% 0.20%
Median % Deprtn., Depltn., Amort./Revenue 0.30% 0.30% 0.40% 0.40% 0.30%
Lower % Deprtn., Depltn., Amort./Revenue 0.70% 0.70% 0.70% 0.60% 0.70%
Subject % Deprtn., Depltn., Amort./Revenue 2.38% 2.25% 2.14% 2.81% 2.85%
Upper % Officer's &/or Owner's Compensation/Revenue 1.40% 2.20% 2.20% 1.50% 1.70%
Median % Officer's &/or Owner's Compensation/Revenue 2.00% 3.40% 4.60% 2.80% 2.70%
Lower % Officer's &/or Owner's Compensation/Revenue 5.20% 5.70% 6.70% 4.90% 6.30%
Subject % Officer's &/or Owner's Compensation/Revenue 11.81% 13.12% 13.40% 16.44% 18.79%
»

Company Balance Sheets Page 15 of 188
HELPER TEXT
In Pro, you select the IRS data from IRS section under Financial Analysis.
IRS Peer ComparisonsHELPER TEXT
In the following paragraph the industry code is from the IRS data and does not
match the subject company SIC code.
For purposes of comparison with industry financial measures available from non-publiccompany sources, «I» reviewed the IRS Corporate Records, published by the InternalRevenue Service (IRS). The IRS compiled average percentage income statements andbalance sheets and key financial ratios of companies classified under the industry code #«5461». The selected IRS group includes [number of companies] companies. «I» believethe IRS data provides limited comparative perspective and strict comparisons should bemade with caution.
The following liquidity ratios were compared to the subject company.
«IRS IRS IRS IRS IRS
2000 2001 2002 2003 2004
Child's Child's Child's Child's Child's
Based On Historical Statements 2002 2003 2004 2005 2006
LIQUIDITY RATIOS:
IRS Current Ratio 1.93 1.81 1.90 1.61 1.56
Subject Current Ratio 4.60 5.88 6.77 4.91 7.70
IRS Quick Ratio 0.64 0.69 0.67 0.63 0.65
Subject Quick Ratio 2.13 2.92 3.52 2.16 3.30
IRS Revenue/Accounts Receivable (Net) 16.00 12.88 12.69 10.61 8.21
Subject Revenue/Accounts Receivable (Net) 5.20 7.91 8.16 5.03 7.42
IRS Collection Period (days) 23.00 28.00 29.00 34.00 44.00
Subject Collection Period (days) 70 46 45 73 49
IRS Inventory Turnover 3.33 3.36 2.94 2.94 2.88
Subject Inventory Turnover 2.22 2.35 2.50 3.16 2.24
IRS Days' Inventory 110.00 109.00 124.00 124.00 127.00
Subject Days' Inventory Turnover 164 156 146 115 163
IRS COGS / Payables 8.46 6.63 6.99 6.12 5.57
Subject COGS / Payables 13.33 15.91 18.33 20.67 25.41
IRS Days' Payables 43.00 55.00 52.00 60.00 66.00
Subject Days' Payables 27 23 20 18 14
IRS Revenue/Working Capital 6.20 6.86 5.78 7.38 7.20
Subject Revenue/Working Capital 4.64 4.33 4.55 6.48 4.26
»
Company Balance Sheets Page 16 of 188
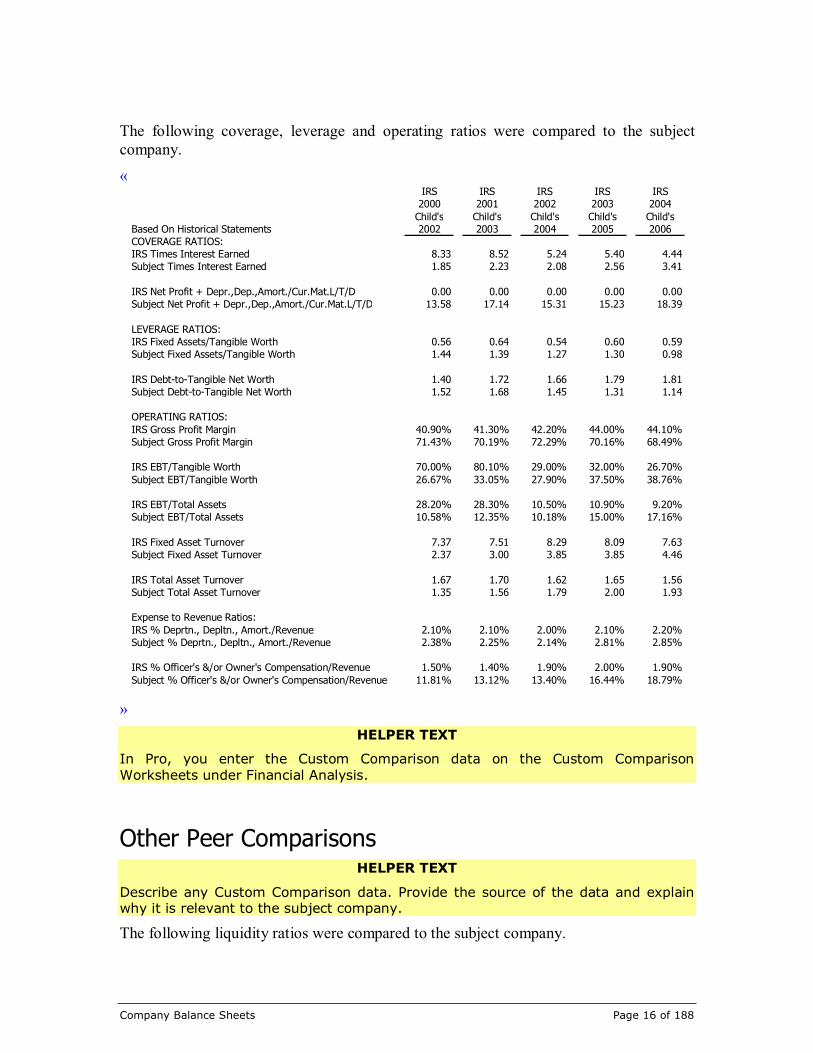
The following coverage, leverage and operating ratios were compared to the subjectcompany.
«IRS IRS IRS IRS IRS
2000 2001 2002 2003 2004
Child's Child's Child's Child's Child's
Based On Historical Statements 2002 2003 2004 2005 2006
COVERAGE RATIOS:
IRS Times Interest Earned 8.33 8.52 5.24 5.40 4.44
Subject Times Interest Earned 1.85 2.23 2.08 2.56 3.41
IRS Net Profit + Depr.,Dep.,Amort./Cur.Mat.L/T/D 0.00 0.00 0.00 0.00 0.00
Subject Net Profit + Depr.,Dep.,Amort./Cur.Mat.L/T/D 13.58 17.14 15.31 15.23 18.39
LEVERAGE RATIOS:
IRS Fixed Assets/Tangible Worth 0.56 0.64 0.54 0.60 0.59
Subject Fixed Assets/Tangible Worth 1.44 1.39 1.27 1.30 0.98
IRS Debt-to-Tangible Net Worth 1.40 1.72 1.66 1.79 1.81
Subject Debt-to-Tangible Net Worth 1.52 1.68 1.45 1.31 1.14
OPERATING RATIOS:
IRS Gross Profit Margin 40.90% 41.30% 42.20% 44.00% 44.10%
Subject Gross Profit Margin 71.43% 70.19% 72.29% 70.16% 68.49%
IRS EBT/Tangible Worth 70.00% 80.10% 29.00% 32.00% 26.70%
Subject EBT/Tangible Worth 26.67% 33.05% 27.90% 37.50% 38.76%
IRS EBT/Total Assets 28.20% 28.30% 10.50% 10.90% 9.20%
Subject EBT/Total Assets 10.58% 12.35% 10.18% 15.00% 17.16%
IRS Fixed Asset Turnover 7.37 7.51 8.29 8.09 7.63
Subject Fixed Asset Turnover 2.37 3.00 3.85 3.85 4.46
IRS Total Asset Turnover 1.67 1.70 1.62 1.65 1.56
Subject Total Asset Turnover 1.35 1.56 1.79 2.00 1.93
Expense to Revenue Ratios:
IRS % Deprtn., Depltn., Amort./Revenue 2.10% 2.10% 2.00% 2.10% 2.20%
Subject % Deprtn., Depltn., Amort./Revenue 2.38% 2.25% 2.14% 2.81% 2.85%
IRS % Officer's &/or Owner's Compensation/Revenue 1.50% 1.40% 1.90% 2.00% 1.90%
Subject % Officer's &/or Owner's Compensation/Revenue 11.81% 13.12% 13.40% 16.44% 18.79%
»
HELPER TEXT
In Pro, you enter the Custom Comparison data on the Custom Comparison
Worksheets under Financial Analysis.
Other Peer ComparisonsHELPER TEXT
Describe any Custom Comparison data. Provide the source of the data and explainwhy it is relevant to the subject company.
The following liquidity ratios were compared to the subject company.

Company Balance Sheets Page 17 of 188
«Source Source Source Source Source
2002 2003 2004 2005 2006
Child's Child's Child's Child's Child's
Based On Historical Statements 2002 2003 2004 2005 2006
LIQUIDITY RATIOS:
Source Current Ratio
Subject Current Ratio 4.60 5.88 6.77 4.91 7.70
Source Quick Ratio
Subject Quick Ratio 2.13 2.92 3.52 2.16 3.30
Source Revenue/Accounts Receivable (Net)
Subject Revenue/Accounts Receivable (Net) 5.20 7.91 8.16 5.03 7.42
Source Collection Period (days)
Subject Collection Period (days) 70 46 45 73 49
Source Inventory Turnover
Subject Inventory Turnover 2.22 2.35 2.50 3.16 2.24
Source Days' Inventory
Subject Days' Inventory Turnover 164 156 146 115 163
Source COGS / Payables
Subject COGS / Payables 13.33 15.91 18.33 20.67 25.41
Source Days' Payables
Subject Days' Payables 27 23 20 18 14
Source Revenue/Working Capital
Subject Revenue/Working Capital 4.64 4.33 4.55 6.48 4.26
»
The following coverage, leverage and operating ratios were compared to the subjectcompany.

Company Balance Sheets Page 18 of 188
«Source Source Source Source Source
2002 2003 2004 2005 2006
Child's Child's Child's Child's Child's
Based On Historical Statements 2002 2003 2004 2005 2006
COVERAGE RATIOS:
Source Times Interest Earned
Subject Times Interest Earned 1.85 2.23 2.08 2.56 3.41
Source Net Profit + Depr.,Dep.,Amort./Cur.Mat.L/T/D
Subject Net Profit + Depr.,Dep.,Amort./Cur.Mat.L/T/D 13.58 17.14 15.31 15.23 18.39
LEVERAGE RATIOS:
Source Fixed Assets/Tangible Worth
Subject Fixed Assets/Tangible Worth 1.44 1.39 1.27 1.30 0.98
Source Debt-to-Tangible Net Worth
Subject Debt-to-Tangible Net Worth 1.52 1.68 1.45 1.31 1.14
OPERATING RATIOS:
Source Gross Profit Margin
Subject Gross Profit Margin 71.43% 70.19% 72.29% 70.16% 68.49%
Source EBT/Tangible Worth
Subject EBT/Tangible Worth 26.67% 33.05% 27.90% 37.50% 38.76%
Source EBT/Total Assets
Subject EBT/Total Assets 3.29% 3.13% 2.97% 5.38% 6.01%
Source Fixed Asset Turnover
Subject Fixed Asset Turnover 2.37 3.00 3.85 3.85 4.46
Source Total Asset Turnover
Subject Total Asset Turnover 1.35 1.56 1.79 2.00 1.93
Expense to Revenue Ratios:
Source % Deprtn., Depltn., Amort./Revenue
Subject % Deprtn., Depltn., Amort./Revenue 2.38% 2.25% 2.14% 2.81% 2.85%
Source % Officer's &/or Owner's Compensation/Revenue
Subject % Officer's &/or Owner's Compensation/Revenue 11.81% 13.12% 13.40% 16.44% 18.79%
»
Company Profit and Loss Page 19 of 188
COMPANY PROFIT AND LOSS
HELPER TEXT
Revenue Ruling 59-60 states:
[…] (d) Detailed profit-and-loss statements should be obtained andconsidered for a representative period immediately prior to the
required date of appraisal, preferably five or more years. Suchstatements should show (1) gross income by principle items; (2)
principle deductions from gross income including major prior items of
operating expenses, interest and other expense on each item of long-term debt, depreciation and depletion if such deductions are made,
officers' salaries, in total if they appear to be reasonable or in detail if
they seem to be excessive, contributions (whether or not deductiblefor tax purposes) that the nature of its business and its community
position require the corporation to make, and taxes by principle items,
including income and excess profits taxes; (3) net income available fordividends; (4) rates and amounts of dividends paid on each class of
stock; (5) remaining amount carried to surplus; and (6) adjustmentsto, and reconciliation with, surplus as stated on the balance sheet.
With profit and loss statements of this character available, the
appraiser should be able to separate recurrent from nonrecurrentitems of income and expense, to distinguish between operating income
and investment income, and to ascertain whether or not any line of
business in which the company is engaged is operated consistently ata loss and might be abandoned with benefit to the company. The
percentage of earnings retained for business expansion should be
noted when dividend-paying capacity is considered. Potential futureincome is a major factor in many valuations of closely-held stocks, and
all information concerning past income which will be helpful in
predicting the future should be secured. Prior earnings records usuallyare the most reliable guide as to the future expectancy, but resort to
arbitrary five-or-ten-year averages without regard to current trends orfuture prospects will not produce a realistic valuation. If, for instance,
a record of progressively increasing or decreasing net income is found,
then greater weight may be accorded the most recent years' profits inestimating earning power. It will be helpful, in judging risk and the
extent to which a business is a marginal operator, to consider
deductions from income and net income in terms of percentage ofsales. Major categories of cost and expense to be so analyzed include
the consumption of raw materials and supplies in the case of
manufacturers, processors and fabricators; the cost of purchasedmerchandise in the case of merchants; utility services; insurance;
taxes; depletion or depreciation; and interest
This section should discuss the company’s profit and loss statements, including
pertinent financial ratios and comparisons to a peer group. Additional headings may
be required. The peer group discussions in the Company Balance Sheets section canbe referenced here. Cross-references to those discussions follow. You can edit these
cross-references to suit your report.

Company Profit and Loss Page 20 of 188
The summary profit and loss statements from your Pro project follow. Feel free to
delete them if they are not suitable for this report.

Com
pany
Pro
fit
and
Loss
Page
21
of
188
Su
mm
ary
Pro
fit
an
dLo
ss
Sta
tem
en
ts
«
Ye
ar
En
din
g
Ye
ar
En
din
g
Ye
ar
En
din
g
Ye
ar
En
din
g
Ye
ar
En
din
g
De
ce
mb
er
31
,
20
02
De
ce
mb
er
31
,
20
03
De
ce
mb
er
31
,
20
04
De
ce
mb
er
31
,
20
05
De
ce
mb
er
31
,
20
06
Revenue
2,1
00,0
00
2,9
35,0
00
3,9
70,0
00
5,1
94,0
00
5,9
66,0
00
Cost
of G
oods
Sold
600,0
00
875,0
00
1,1
00,0
00
1,5
50,0
00
1,8
80,0
00
Gro
ss P
rofit
1,5
00,0
00
2,0
60,0
00
2,8
70,0
00
3,6
44,0
00
4,0
86,0
00
Opera
ting
Expense
s1,1
36,0
00
1,6
73,0
00
2,4
47,0
00
2,9
90,0
00
3,3
19,0
00
Opera
ting P
rofit
364,0
00
387,0
00
423,0
00
654,0
00
767,0
00
Oth
er
Inco
me/(
Expense
)-2
00,0
00
-154,0
00
-197,0
00
-264,0
00
-236,0
00
Inco
me
Befo
reTaxes
164,0
00
233,0
00
226,0
00
390,0
00
531,0
00
Inco
me
Taxes
51,0
00
59,0
00
66,0
00
140,0
00
186,0
00
Net
Inco
me
113,0
00
174,0
00
160,0
00
250,0
00
345,0
00
»

Normalization Adjustments Page 22 of 188
NORMALIZATION ADJUSTMENTS
HELPER TEXT
Almost every valuation engagement requires normalization adjustments. The
adjustments themselves are discussed in the sub-sections below. You should alsoexplain the net effect.
Normalization adjustments are required to adjust the historical financial statements sothat they are representative of a normal condition as of the valuation date.
Balance Sheet Adjustments
Book Value (Going Concern)
The Company’s reported book value at the date of valuation was $«589,000». Listedbelow, «I» have identified adjustments that are required to restate shareholders’ equityand reflect the net asset value of the Company.
HELPER TEXT
List the going concern normalization adjustments and the reasons for them.
Liquidation Value
The Company’s reported liquidation value at the date of the valuation was $«-18,000».Listed below, «I» have identified adjustments that are required to restate shareholders’equity and reflect the liquidation asset value of the Company.
HELPER TEXT
List the liquidation value normalization adjustments and the reasons for them.
Income Statement AdjustmentsThe Company’s reported profit and loss statement was adjusted for one time charges andabnormalities as listed below.
HELPER TEXT
List the normalization adjustments and the reasons for them.
Estimate of Value Page 23 of 188
ESTIMATE OF VALUE
HELPER TEXT
The purpose of the Estimate of Value section is to: (1) describe the valuation
methods that were rejected and explain why they were rejected; and (2) describethe method that was accepted and explain why it was accepted.
The Conclusions of Value schedule in Pro has a column for setting the status of thevaluation methods:
1 = Considered and Used. Note that since this is a 59-60 report, only one
method should have this setting.
2 = Considered and Rejected. These methods appear in the report as rejected
models.
3 = Not Considered. These methods do not appear in the report.
Methodologies Considered But RejectedWhile there are many methods that can be used to determine the fair market value of acompany, the fact pattern in the specific case of «Child's Clothing Store» dictates thatcertain methodologies are inappropriate. The following lists those methods and thereasons why they are not used.
Dividend Paying Capacity
HELPER TEXT
This model is specifically mentioned in Revenue Ruling 59-60. You must address the
following statement and list the reasons why dividend capacity in itself is not used.
Revenue Ruling 59-60 states:
(e) Primary consideration should be given to the dividend-paying capacity ofthe company rather than to dividends actually paid in the past. Recognitionmust be given to the necessity of retaining a reasonable portion of profits in acompany to meet competition. Dividend-paying capacity is a factor that mustbe considered in an appraisal, but dividends actually paid in the past may nothave any relation to dividend-paying capacity. Specifically, the dividends paidby a closely held family company may be measured by the income needs ofthe stockholders or by their desire to avoid taxes on dividend receipts, insteadof by the ability of the company to pay dividends. Where an actual or effectivecontrolling interest in a corporation is to be valued, the dividend factor is not amaterial element, since the payment of such dividends is discretionary withthe controlling stockholders. The individual or group in control can substitutesalaries and bonuses for dividends, thus reducing net income and understatingthe dividend-paying capacity of the company. It follows, therefore, thatdividends are less reliable criteria of fair market value than other applicablefactors.

Estimate of Value Page 24 of 188
Book Value Method
HELPER TEXT
The book value is generated from the Summary Balance Sheets. To have the Book
Value Method appear as considered but rejected, enter a 2 for its status on theConclusions of Value schedule in Pro.
The book value method is an accounting based value that is calculated by subtracting thebook value of total liabilities from the book value of total assets. This method takes asfact that the underlying assets are the driving factor in the valuation of the company andthat the fair market value is approximated by the book value.
The book value methodology was rejected for determining the value of «Child's ClothingStore» because «my» review indicates that the value of the enterprise is driven by theability of the collection of assets in place to generate a benefit stream that is moreimportant in terms of valuation than the value in the underlying assets themselves. Inother words, the value of the individual assets and their associated liabilities are lessimportant than the manner in which management has utilized them.
Additionally, «my» review indicates that the fair market value of the underlying assetsless the fair market value of the liabilities is different than the book value of the assets.This is primarily due to the fact that the accounting standards do not allow therecognition of appreciation in value.
Market Approach Methods
HELPER TEXT
To have the Market Approach Methods appear as considered but rejected, enter a 2
for the status of each of the Market Data Method and Industry Data Method multiples
in Pro’s Conclusions of Value schedule.
The market approach develops a value using the principle of substitution. This simplymeans that if one thing is similar to another and could be used (our case invested in) forthe other, then they must be equal. Furthermore, the price of two like and similar itemsshould approximate one another. For the market approach to be used, there must be asufficient number of comparable companies to make comparisons, or, alternatively, theindustry composition must be such that meaningful comparisons can be made. «My»search of the various transaction databases under the enterprise’s SIC (NAICS) «5461»,«Childrens Clothing» did not provide an adequate number of companies with which tocompare the enterprise. The companies found showed such a wide variance of data that ameaningful comparison with the enterprise could not be made. Similarly, «my» search ofcomparable public companies did not provide meaningful data with which to draw aconclusion. This method was rejected in the valuation of «Child's Clothing Store»because «I» did not satisfy «myself» as to the ability to substitute the comparablecompany(s)for «Child's Clothing Store».

Estimate of Value Page 25 of 188
Determination of Fair Market ValueHELPER TEXT
Revenue Ruling 59-60 says that one valuation method should be chosen above all
others. The Conclusions of Value schedule in Pro has a column for setting the statusof the valuation methods:
1 = Considered and Used. Since this is a 59-60 report, only one method
should have this setting.
2 = Considered and Rejected. These methods appear in the report as rejected
models.
3 = Not Considered. These methods do not appear in the report.
Book Value Method
HELPER TEXT
The book value is generated from the Historic Balance Sheets. To have the Book
Value Method appear as considered and used, enter a 1 for its status on the
Conclusions of Value schedule in Pro.
The book value of «Child's Clothing Store» as of «December 31, 2006» was $«589,000».The book value method is an accounting based value that is calculated by subtracting thebook value of total liabilities from the book value of total assets. This method takes asfact that the underlying assets are the driving factor in the valuation of the company andthat the «fair market value» is approximated by the book value.
«My» review indicates that the value of the enterprise is driven by the collection of theassets’ ability to generate a benefit stream that is not more important in terms of valuationthan the value of the underlying assets themselves. In other words, the value of theindividual assets and their associated liabilities are more important than the manner inwhich management has utilized them.
Additionally, «my» review indicates that the «fair market value» of the underlying assetsless the «fair market value» of the liabilities approximates the book value of the assets.
Adjusted Book Value Method – Going Concern
HELPER TEXT
The asset methods have the adjusted book value under a going concern assumption.The data is being mapped to those schedules. To have the Adjusted Book Value
Method – Going Concern appear as considered and used, enter a 1 for its status on
the Conclusions of Value schedule in Pro.
The adjusted value of «Child's Clothing Store» as of «December 31, 2006» was$«344,000». The adjusted book value - going concern method develops a valuation

Estimate of Value Page 26 of 188
indication by adjusting the reported book values of a subject company’s assets to theiractual or estimated «fair market value»s and subtracting its liabilities (adjusted to «fairmarket value», if appropriate). The specific adjustments were described in the analysis ofthe balance sheet. The indicated value should not be interpreted as an estimate ofliquidation value. Neither an orderly nor a forced liquidation is contemplated.
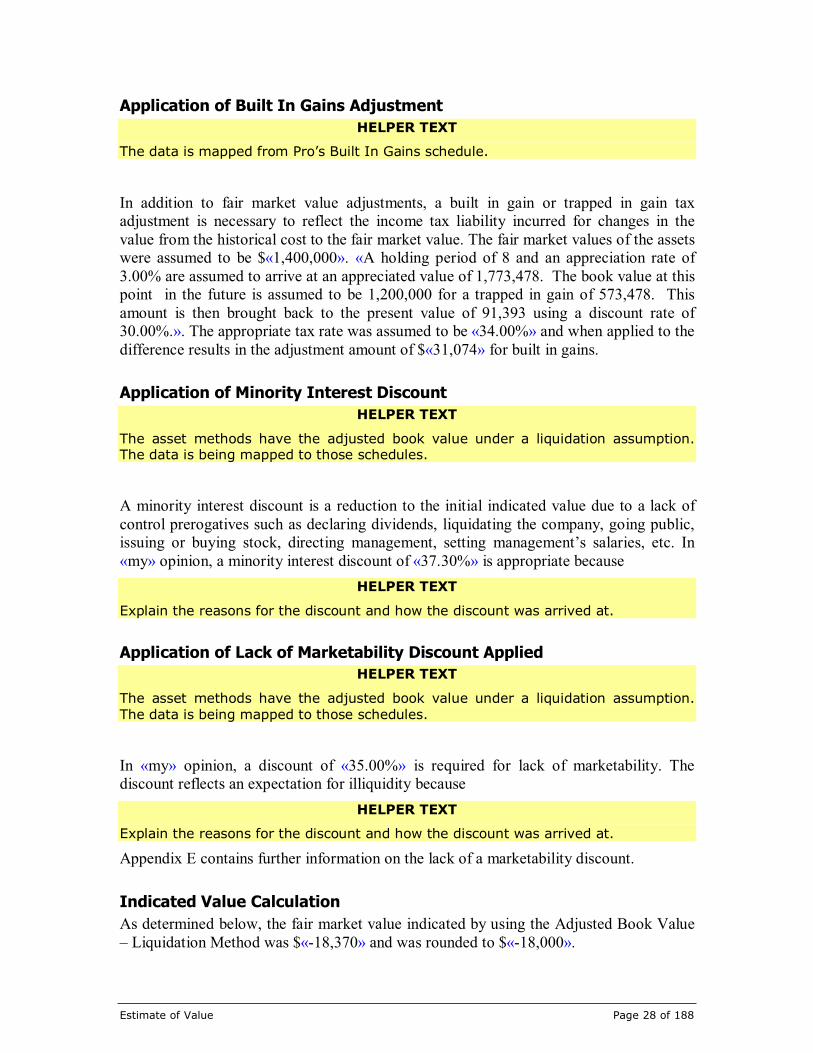
Application of Built In Gains Adjustment
HELPER TEXT
The schedule in Pro where the data is being mapped from is the Built In Gain
schedule.
In addition to «fair market value» adjustments, a built in gain or trapped in gain taxadjustment is necessary to reflect the income tax liability incurred for changes in thevalue from the historical cost to the fair market value. The fair market values of the assetsare assumed to be $«1,400,000». «A holding period of 8 and an appreciation rate of3.00% are assumed to arrive at an appreciated value of 1,773,478. The book value at thispoint in the future is assumed to be 1,200,000 for a trapped in gain of 573,478. Thisamount is then brought back to the present value of 91,393 using a discount rate of30.00%.». The appropriate tax rate was assumed to be «34.00%» and when applied to thedifference, results in the adjustment amount of $«31,074» for built in gains.
Application of Minority Interest Discount
HELPER TEXT
The asset methods have the adjusted book value under a going concern assumption.The data is being mapped to those schedules.
A minority interest discount is a reduction in the initial indicated value due to a lack ofcontrol prerogatives such as declaring dividends, liquidating the company, going public,issuing or buying stock, directing management, setting management’s salaries, etc. In«my» opinion, a minority interest discount of «37.30%» is appropriate because
HELPER TEXT
Explain the reasons for the discount and how the discount was calculated.
Application of Lack of Marketability Discount
HELPER TEXT
The asset methods have the adjusted book value under a going concern assumption.
The data is being mapped to those schedules.
In «my» opinion, a discount of «35.00%» is required for lack of marketability. Thediscount reflects an expectation for illiquidity because

Estimate of Value Page 27 of 188
HELPER TEXT
Explain the reasons for the discount and how the discount was calculated.
Appendix E contains further information on the lack of a marketability discount.
Indicated Value Calculation
As determined below, the «fair market value» indicated by using the Adjusted BookValue as a Going Concern method was $«343,942» and was rounded to $«344,000».
«
Year
EndedDecember
31, 2006
Adjusted Equity 875,000
Tax Effect of Built In Gain -31,074
Less Minority Interest Discount 37.30%
Subtotal 529,142
Less Marketability Discount 35.00%Indicated Value 343,942
»
Adjusted Book Value Method – Liquidation Value
HELPER TEXT
The asset methods have the adjusted book value under a liquidation assumption.
The data is being mapped to those schedules. To have the Adjusted Book Value
Method – Liquidation Value appear as considered and used, enter a 1 for its statuson the Conclusions of Value schedule in Pro.
The adjusted book value in an orderly liquidation of «Child's Clothing Store» as of«December 31, 2006» was $«1,400,000». The adjusted book value - liquidation methoddevelops a valuation indication by adjusting the reported book values of a subjectcompany’s assets to their actual or estimated price as if they were sold in a piecemeal andorderly fashion. It is assumed that the assets are given an adequate level of exposure intheir normal secondary market. This premise does not contemplate any contributory valuefrom the company’s intangible assets. The specific adjustments were described in theanalysis of the balance sheet.
Estimate of Value Page 28 of 188
Application of Built In Gains Adjustment
HELPER TEXT
The data is mapped from Pro’s Built In Gains schedule.
In addition to fair market value adjustments, a built in gain or trapped in gain taxadjustment is necessary to reflect the income tax liability incurred for changes in thevalue from the historical cost to the fair market value. The fair market values of the assetswere assumed to be $«1,400,000». «A holding period of 8 and an appreciation rate of3.00% are assumed to arrive at an appreciated value of 1,773,478. The book value at thispoint in the future is assumed to be 1,200,000 for a trapped in gain of 573,478. Thisamount is then brought back to the present value of 91,393 using a discount rate of30.00%.». The appropriate tax rate was assumed to be «34.00%» and when applied to thedifference results in the adjustment amount of $«31,074» for built in gains.
Application of Minority Interest Discount
HELPER TEXT
The asset methods have the adjusted book value under a liquidation assumption.The data is being mapped to those schedules.
A minority interest discount is a reduction to the initial indicated value due to a lack ofcontrol prerogatives such as declaring dividends, liquidating the company, going public,issuing or buying stock, directing management, setting management’s salaries, etc. In«my» opinion, a minority interest discount of «37.30%» is appropriate because
HELPER TEXT
Explain the reasons for the discount and how the discount was arrived at.
Application of Lack of Marketability Discount Applied
HELPER TEXT
The asset methods have the adjusted book value under a liquidation assumption.
The data is being mapped to those schedules.
In «my» opinion, a discount of «35.00%» is required for lack of marketability. Thediscount reflects an expectation for illiquidity because
HELPER TEXT
Explain the reasons for the discount and how the discount was arrived at.
Appendix E contains further information on the lack of a marketability discount.
Indicated Value Calculation
As determined below, the fair market value indicated by using the Adjusted Book Value– Liquidation Method was $«-18,370» and was rounded to $«-18,000».

Estimate of Value Page 29 of 188
«
Year
EndedDecember
31, 2006
Adjusted Equity -14,000
Tax Effect of Built In Gain -31,074
Less Minority Interest Discount 37.30%
Subtotal -28,261
Less Marketability Discount 35.00%Indicated Value -18,370
SELECTED LIQUIDATION VALUE -18,000
»
Capitalization of «Cash Flow» Method
HELPER TEXT
The income methods have the Capitalization of Earnings method with severalschedules in it. The data is being mapped from these schedules. To have this method
appear as considered and used, enter a 1 for its status on the Conclusions of Value
schedule in Pro.
Capitalization of «cash flow» requires an estimate of an ongoing benefit stream and acapitalization «multiple». The capitalization «multiple» represents the required rate ofreturn minus the sustainable growth rate. Capitalization of «cash flow» effectivelydetermines the present value of the Company’s ongoing economic benefit streamgrowing perpetually at a fixed rate and discounted at the required rate of return. Thepresent value is representative of the amount a willing buyer and a willing seller wouldexchange for the business.
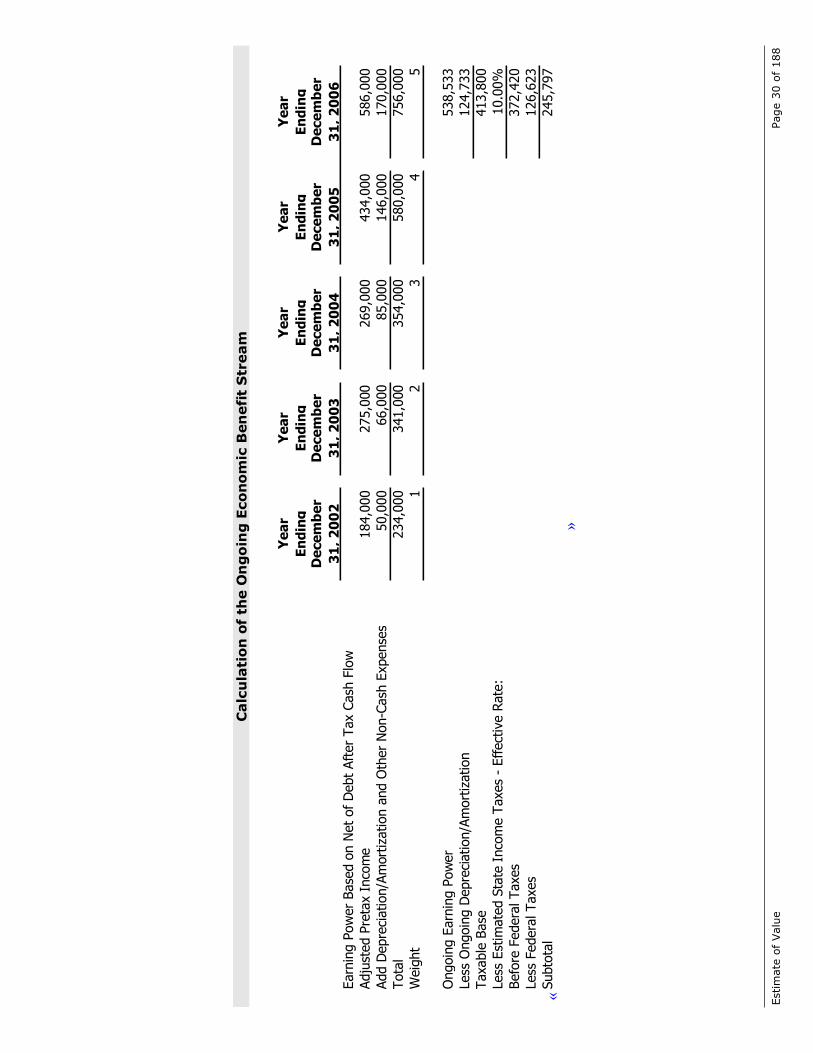
Estimate of Ongoing Benefit Stream
HELPER TEXT
The schedule that develops the benefit stream is the Earnings/Cash Flow BaseSchedule.
The analysis presented below represents the calculation of the ongoing economic benefitstream. It depicts the calculation of the «after tax cash flow» benefit stream.
Estim
ate
of
Valu
ePage
30
of
188
Calc
ula
tio
nof
the
On
go
ing
Eco
no
mic
Ben
efi
tS
tream
«
Ye
ar
En
din
g
Ye
ar
En
din
g
Ye
ar
En
din
g
Ye
ar
En
din
g
Ye
ar
En
din
gD
ece
mb
er
31
,2
00
2
De
ce
mb
er
31
,2
00
3
De
ce
mb
er
31
,2
00
4
De
ce
mb
er
31
,2
00
5
De
ce
mb
er
31
,2
00
6Earn
ing P
ow
er
Base
don N
et
ofD
ebt
Aft
er
Tax
Cash
Flo
w
Adju
sted P
reta
xIn
com
e184,0
00
275,0
00
269,0
00
434,0
00
586,0
00
Add
Depre
ciation/A
mort
ization a
nd
Oth
er
Non-C
ash
Expense
s50,0
00
66,0
00
85,0
00
146,0
00
170,0
00
Tota
l234,0
00
341,0
00
354,0
00
580,0
00
756,0
00
Weig
ht
12
34
5
Ongoin
gEarn
ing P
ow
er
538,5
33
Less
Ongoin
gD
epre
ciation/A
mort
ization
124,7
33
Taxable
Base
413,8
00
Less
Est
imate
dSta
teIn
com
eTaxes
-Effect
ive R
ate
:10.0
0%
Befo
re F
edera
lTaxes
372,4
20
Less
Federa
lTaxes
126,6
23
Subto
tal
245,7
97
»

Estimate of Value Page 31 of 188
The weighting above was performed because list the reasons.
HELPER TEXT
Taxes show up in the report if the benefit stream is an after tax benefit stream on
the Earnings/Cash Flow Base Schedule.
Taxes
Taxes were calculated as $«41,380» for the state and $«126,623» for federal. Theongoing benefit stream was reduced by these outflows.
HELPER TEXT
Cash Flow items show up in the report if a cash flow base is chosen on the
Earnings/Cash Flow Base Schedule.
Cash Flow
A cash flow stream needs to define the changes in working capital, capital expendituresand long term debt. The ongoing increase/decrease in working capital is $«-25,000». Theongoing increase/decrease in capital expenditures is $«-50,000». The change in long termdebt amounts to $«-54,000».
Capitalization «Rate»
Capitalization Rates
HELPER TEXT
Revenue Ruling 59-60 says Sec 6 In the application of certain fundamental valuationfactors, such as earnings and dividends, it is necessary to capitalize the average or
current results at some appropriate rate. A determination of the proper capitalization
rate presents one of the most difficult problems in valuation. That there is no readyor simple solution will become apparent by a cursory check of the rates of return and
dividend yields in terms of the selling prices of corporate shares listed on the major
exchanges of the country. Wide variations will be found even for companies in thesame industry. Moreover, the ratio will fluctuate from year to year depending upon
economic conditions. Thus, no standard tables of capitalization rates applicable toclosely held corporations can be formulated. Among the more important factors to be
taken into consideration in deciding upon a capitalization rate in a particular case
are: (1) the nature of the business; (2) the risk involved; and (3) the stability orirregularity of earnings.
These items are mapped from Pro’s Capitalization Rate Schedule.
The discount rate represents the risk an investor is willing to accept for the potentialreward an investment in the subject company will return. Different rates apply to types ofbusinesses. It can also be considered the rate of return that an investor requires on anongoing basis. This risk is not calculated in a vacuum or a sterile environment but ratherit is calculated based on the factors that can be contrasted against the investment in othervehicles that are available and in the specific environment as of the valuation date.
Estimate of Value Page 32 of 188
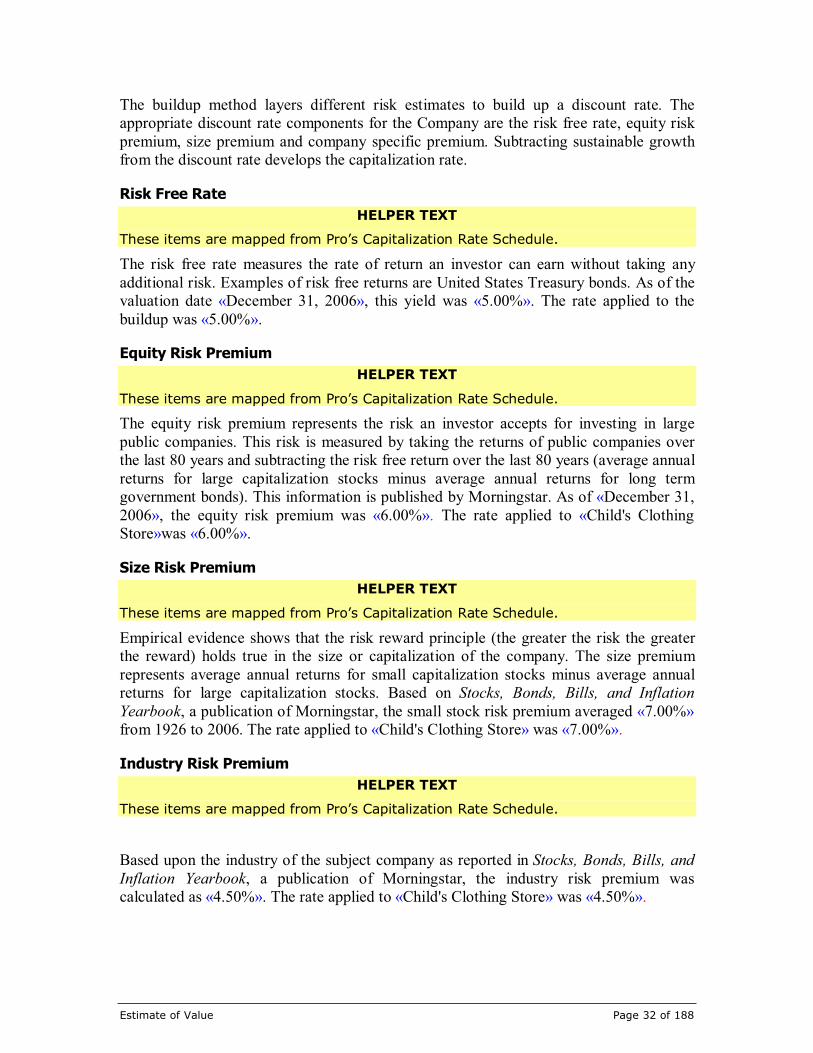
The buildup method layers different risk estimates to build up a discount rate. Theappropriate discount rate components for the Company are the risk free rate, equity riskpremium, size premium and company specific premium. Subtracting sustainable growthfrom the discount rate develops the capitalization rate.
Risk Free Rate
HELPER TEXT
These items are mapped from Pro’s Capitalization Rate Schedule.
The risk free rate measures the rate of return an investor can earn without taking anyadditional risk. Examples of risk free returns are United States Treasury bonds. As of thevaluation date «December 31, 2006», this yield was «5.00%». The rate applied to thebuildup was «5.00%».
Equity Risk Premium
HELPER TEXT
These items are mapped from Pro’s Capitalization Rate Schedule.
The equity risk premium represents the risk an investor accepts for investing in largepublic companies. This risk is measured by taking the returns of public companies overthe last 80 years and subtracting the risk free return over the last 80 years (average annualreturns for large capitalization stocks minus average annual returns for long termgovernment bonds). This information is published by Morningstar. As of «December 31,2006», the equity risk premium was «6.00%». The rate applied to «Child's ClothingStore»was «6.00%».
Size Risk Premium
HELPER TEXT
These items are mapped from Pro’s Capitalization Rate Schedule.
Empirical evidence shows that the risk reward principle (the greater the risk the greaterthe reward) holds true in the size or capitalization of the company. The size premiumrepresents average annual returns for small capitalization stocks minus average annualreturns for large capitalization stocks. Based on Stocks, Bonds, Bills, and InflationYearbook, a publication of Morningstar, the small stock risk premium averaged «7.00%»from 1926 to 2006. The rate applied to «Child's Clothing Store» was «7.00%».
Industry Risk Premium
HELPER TEXT
These items are mapped from Pro’s Capitalization Rate Schedule.
Based upon the industry of the subject company as reported in Stocks, Bonds, Bills, andInflation Yearbook, a publication of Morningstar, the industry risk premium wascalculated as «4.50%». The rate applied to «Child's Clothing Store» was «4.50%».

Estimate of Value Page 33 of 188
Specific Company Risk Premium
HELPER TEXT
These items are mapped from Pro’s Capitalization Rate Schedule.
Based upon Company specific factors - cyclical risk, risks of competitive encroachment,size and various operating concentrations (key executive dependency, customerconcentration, for example) - the summation requires an additional risk premium of«7.50%».
HELPER TEXT
Detail the specific risks of the subject company.
Expected Sustainable Growth Rate
HELPER TEXT
The Capitalization Rate Schedule has a subschedule for Sustainable Growth. Theseitems are mapped from the Sustainable Growth subschedule.
We estimate «4.00%» long term compound annual growth. This «cash flow» growthestimate is based upon «my» assessment of the Company’s prospects for sustainedgrowth in relationship to the estimate of ongoing «cash flow» power developed above.
Rate to Factor Conversion
HELPER TEXT
These items are mapped from Pro’s Capitalization Rate Schedule.
The capitalization rate developed using the buildup method is «26.00%». The reciprocalof this measure (1/«26.00%») provides a capitalization multiple of «4».
Calculation of the «Rate»
The schedule below shows how the «multiple» was calculated
«
BUILDUP CAPITALIZATION RATE
Risk-Free Rate of Return 5.00%
Equity Risk Premium 6.00%
Small Stock Risk Premium 7.00%
Plus/Minus Industry Risk Premium 4.50%
Company Specific Premium 7.50%
Net Cash Flow Discount Rate 30.00%
Discount Rate 30.00%
Sustainable Growth 4.00%Capitalization Rate To Apply To Next Year Stream 26.00%
Selected Rate 26.00%
»

Estimate of Value Page 34 of 188
Indicated Value
HELPER TEXT
These items are mapped from Pro’s Indicated Value Schedule.
To calculate an indicated value for «Child's Clothing Store», the first step is to use the«after tax cash flow» benefit steam and «multiply» it by the «multiple». «In order tomatch the appropriate period to the rate, the rate is divided by one plus the growth rate.»
The next step is to apply adjustments to value for «Child's Clothing Store».
Application of Minority Interest Discount
HELPER TEXT
These items are mapped from Pro’s Indicated Value Schedule.
A minority interest discount is a reduction to the initial indicated value due to a lack ofcontrol prerogatives such as declaring dividends, liquidating the company, going public,issuing or buying stock, directing management, setting management’s salaries, etc. In«my» opinion, a minority interest discount of «37.30%» is appropriate because
HELPER TEXT
Explain the rationale for the applied minority interest discount.
Application of Marketability Discount
HELPER TEXT
These items are mapped from Pro’s Indicated Value Schedule.
In «my» opinion, a discount of «35.00%» is required for lack of marketability. Thediscount reflects an expectation for the lack of a secondary market in which to negotiate aquick sale.
HELPER TEXT
Expand on other factors involved in the determination of the marketability discount.
Appendix E contains further information on the lack of a marketability discount.
Application of Excess or Non-Operating Assets
HELPER TEXT
These items are mapped from Pro’s Indicated Value Schedule.
Be aware that percentages of discounts and premiums may be applied to the excess
assets. If this is the case then explanatory text must be added.
Excess or Non-operating assets represent the value of resources the company has controlof but are not required to operate the business. Examples are excess cash on hand, realestate or other securities not used in the production of goods or services. In «my»

Estimate of Value Page 35 of 188
judgment, excess and non-operating assets that need to be added back and are a part ofthe business’s value total $«18,000».
HELPER TEXT
Explain why the assets are not required in the day to day activities of the businessand how the total value of those assets was determined.
Indicated Value Calculation
The following schedule presents the indicated value using the capitalization of earningsmethod. As calculated, the indicated «fair market value» is $«411,693» which has beenrounded to $«412,000».
«
Net of Debt After Tax Cash Flow 241,500
Sustainable Growth Rate 4.00%
Net of Debt After Tax Cash Flow 251,160
Capitalization Rate 26.00%
Subtotal 966,000
Minority Interest Discount 37.30%
Subtotal 605,682
Marketability Discount 35.00%
Subtotal 393,693
Excess/Non-Operating Assets 18,000Indicated Equity Value 411,693
SELECTED EQUITY VALUE 412,000 »
Discounted Multi-Growth Model
HELPER TEXT
The income methods have the Summary Discounted Cash Flows method with several
schedules and sub-schedules in it. The data is being mapped from these schedules.To have this method appear as considered and used, enter a 1 for its status on the
Conclusions of Value schedule in Pro.
The discounted future «cash flow» method was applied and the resulting «fair marketvalue» of «Child's Clothing Store» as of «December 31, 2006» was $«507,000». Thisincome method is the most appropriate method to use. The method focuses on the presentvalue of the forecasted future benefits. These would accrue to the hypothetical owner ofthe company. They vary greatly in the short run and are still estimable in the long run.This method requires an explicit forecast of the future benefit streams over a reasonablyforeseeable short term and an estimate of a long term benefit stream that is stable andsustainable, i.e. not varying from period to period. In addition, the benefit stream isdetermined to continue into the future without compromise. An appropriate discount rateand an estimate of long term growth beyond the forecast period allow discrete present

Estimate of Value Page 36 of 188
values to be calculated and summed for all the benefit streams and determine the entityvalue.
Estimate of Ongoing Benefit Stream
HELPER TEXT
The schedule that develops the benefit stream is the Earnings/Cash Flow Base
Schedule.
The analysis presented below represents the ongoing economic benefit stream. It depictsthe calculation of the «after tax cash flow» benefit stream.
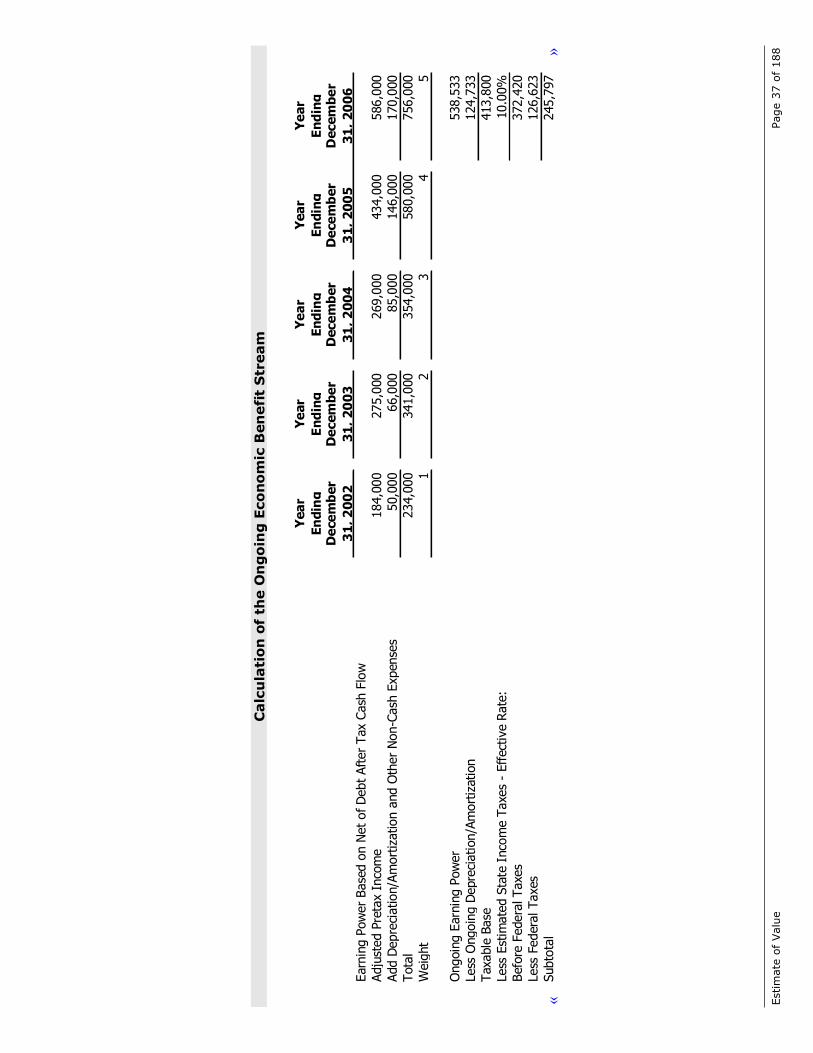
Estim
ate
of
Valu
ePage
37
of
188
Calc
ula
tio
nof
the
On
go
ing
Eco
no
mic
Ben
efi
tS
tream
«
Yea
r
En
din
g
Ye
ar
En
din
g
Ye
ar
En
din
g
Yea
r
En
din
g
Ye
ar
En
din
gD
ece
mb
er
31
,2
00
2
De
cem
be
r
31
,2
00
3
Dece
mb
er
31
,2
00
4
De
ce
mb
er
31
,2
00
5
Decem
be
r
31
,2
00
6Earn
ing
Pow
er
Base
don
Net
ofD
ebt
After
Tax
Cash
Flo
w
Adju
sted
Pre
tax
Inco
me
184,0
00
275,0
00
269,0
00
434,0
00
586,0
00
Add
Depre
ciation/A
mort
ization
and O
ther
Non-C
ash
Expense
s50,0
00
66,0
00
85,0
00
146,0
00
170,0
00
Tota
l234,0
00
341,0
00
354,0
00
580,0
00
756,0
00
Weig
ht
12
34
5
Ongoin
gEarn
ing
Pow
er
538,5
33
Less
Ongoin
gD
epre
ciation/A
mort
ization
124,7
33
Taxable
Base
413,8
00
Less
Est
imate
dSta
teIn
com
eTaxe
s -
Effect
ive
Rate
:10.0
0%
Befo
reFedera
lTaxe
s372,4
20
Less
Federa
lTaxes
126,6
23
Subto
tal
245,7
97
»

Estimate of Value Page 38 of 188
The weighting above was performed because list the reasons.
HELPER TEXT
Taxes show up in the report if the benefit stream is an after tax benefit stream on
the Earnings/Cash Flow Base Schedule.
Taxes were calculated as $«41,380» for the state and $«126,623» for the federal. Thebenefit stream was reduced by these outflows.
HELPER TEXT
Cash Flow items show up in the report if a cash flow base is chosen on theEarnings/Cash Flow Base Schedule.
A cash flow stream needs to define the changes in working capital, capital expendituresand long term debt. The ongoing change in working capital is $«-25,000». The ongoingchange in capital expenditures is $«-50,000». The change in long term debt amounts to$«-54,000».
Benefit Stream Forecast Assumptions
HELPER TEXT
These items are mapped from Pro’s Projection Assumptions Schedule.
Certain assumptions must be made in this model. Primarily, what is the reasonablyforeseeable short term? The benefit stream should have different characteristics than thesustainable long term benefit stream. The fact set for «Child's Clothing Store» as of«December 31, 2006» dictates that the reasonable foreseeable short term is «10» yearsbecause
HELPER TEXT
Explain why the period was chosen.
The method of forecast was «manual percentage growth». This method was chosenbecause
HELPER TEXT
Explain why the forecast methodology was used.
Given these assumptions, the benefit stream was forecasted «10» years using the «manualpercentage growth». The next step is to determine a discount rate.
Discount Rate
HELPER TEXT
Revenue Ruling 59-60 says Sec 6 In the application of certain fundamental valuation
factors, such as earnings and dividends, it is necessary to capitalize the average orcurrent results at some appropriate rate. A determination of the proper capitalization
rate presents one of the most difficult problems in valuation. That there is no readyor simple solution will become apparent by a cursory check of the rates of return and

Estimate of Value Page 39 of 188
dividend yields in terms of the selling prices of corporate shares listed on the major
exchanges of the country. Wide variations will be found even for companies in thesame industry. Moreover, the ratio will fluctuate from year to year depending upon
economic conditions. Thus, no standard tables of capitalization rates applicable to
closely held corporations can be formulated. Among the more important factors to betaken into consideration in deciding upon a capitalization rate in a particular case
are: (1) the nature of the business; (2) the risk involved; and (3) the stability orirregularity of earnings.
These items are mapped from Pro’s Discount Rate Schedule.
The discount rate represents the risk an investor is willing to accept for the potentialreward an investment in the subject company will return. Different rates apply to types ofbusinesses. It is also known as the return that an investor requires by generating theinvestment. This risk is not calculated in a vacuum or a sterile environment but rather it iscalculated based on the factors that can be contrasted against investing in other vehiclesthat are available and in the specific environment as of the valuation date.
The buildup method layers different risk estimates to build up a discount rate. Theappropriate discount rate components for the Company are the risk free rate, equity riskpremium, size premium and company specific premium.
Risk Free Rate
HELPER TEXT
These items are mapped from Pro’s Discount Rate Schedule.
The risk free rate measures the rate of return an investor can earn without taking anyadditional risk. Examples of risk free returns are the United States Treasury bonds. As ofthe valuation date, «December 31, 2006», this yield was «5.00%». The rate applied to thebuildup was «5.00%».
Equity Risk Premium
HELPER TEXT
These items are mapped from Pro’s Discount Rate Schedule.
The equity risk premium represents the risk an investor takes on for investing in largepublic companies. This risk is measured by taking the returns over the last 78 years andsubtracting the risk free return over the last 78 years (average annual returns for largecapitalization stocks minus average annual returns for long term government bonds). Theinformation is published by Morningstar. As of «December 31, 2006», the equity riskpremium was «6.00%». The rate applied to «Child's Clothing Store» was «6.00%».
Beta
HELPER TEXT
These items are mapped from Pro’s Discount Rate Schedule.

Estimate of Value Page 40 of 188
HELPER TEXT
In the following paragraph, replace the highlighted phrase with the source of thebeta.
The beta is a measure of volatility. Beta is the systemic risk of a security which cannot beeliminated through diversification. It is the risk that all stocks face. Beta measures therelative volatility of returns on a specific stock compared to the returns on an underlyingindex of stocks, typically the S&P500 or the NYSE Composite Index. Greater volatilitymeans greater variability of returns which means greater risk. «I» applied a beta of«0.00». The source of the beta used is [enter the source of the beta]. By multiplying thecommon stock equity premium by the above beta, a beta-adjusted common stock equitypremium of «0.00%» is derived. The rate applied to «Child's Clothing Store» was«0.00%».
Small Capitalization Equity Risk Premium
HELPER TEXT
These items are mapped from Pro’s Discount Rate Schedule.
Empirical evidence shows that the risk reward principle (the greater the risk the greaterthe reward) holds true in the size or capitalization of the company. The size premiumrepresents average annual returns for small capitalization stocks minus average annualreturns for large capitalization stocks. Based on Stocks, Bonds, Bills, and InflationYearbook, a publication of Morningstar, the small stock risk premium averaged «7.00%»from 1926 to 2006. The rate applied to «Child's Clothing Store» was «7.00%».
Specific Company Risk Premium
HELPER TEXT
These items are mapped from Pro’s Discount Rate Schedule.
Based upon Company specific factors - cyclical risk, risks of competitive encroachment,size and various operating concentrations (key executive dependency, customerconcentration, for example) - the summation requires an additional risk premium of«7.50%».
HELPER TEXT
Explain the specific risks of the subject company.
Discount Rate Calculation
The schedule below shows how the discount rate was calculated. The discount rateselected for «Child's Clothing Store» is «30.00%».
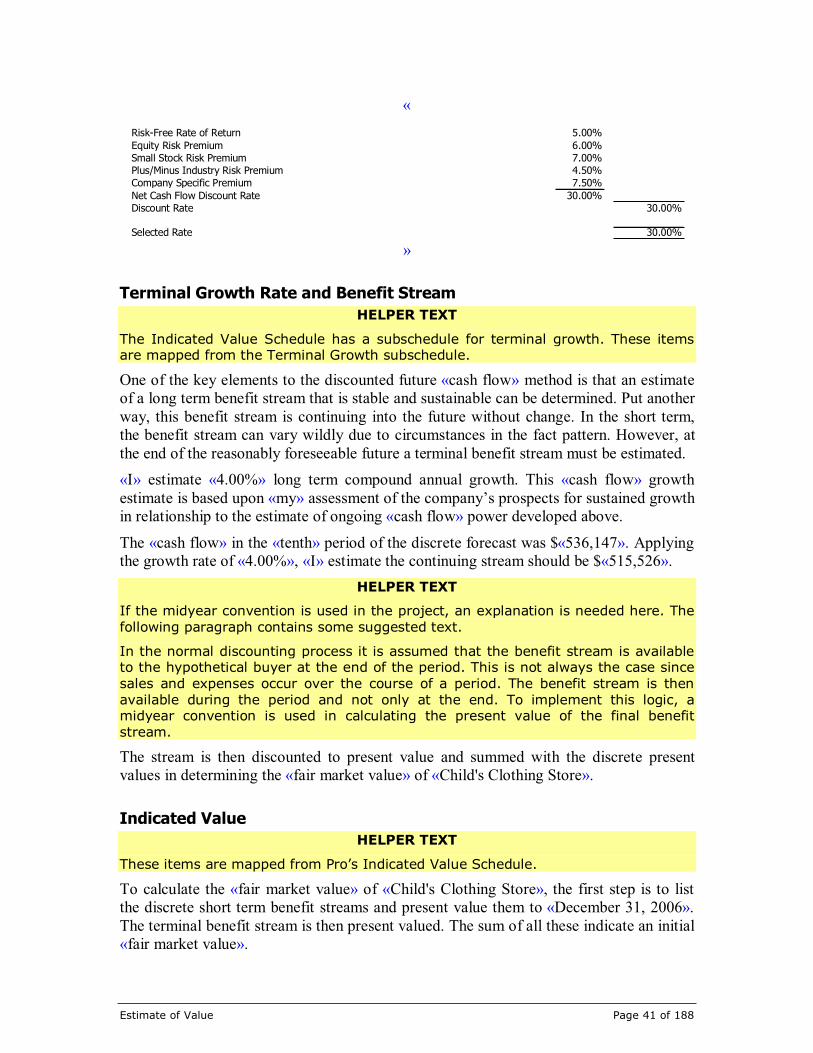
Estimate of Value Page 41 of 188
«
Risk-Free Rate of Return 5.00%
Equity Risk Premium 6.00%
Small Stock Risk Premium 7.00%
Plus/Minus Industry Risk Premium 4.50%
Company Specific Premium 7.50%
Net Cash Flow Discount Rate 30.00%
Discount Rate 30.00%
Selected Rate 30.00%
»
Terminal Growth Rate and Benefit Stream
HELPER TEXT
The Indicated Value Schedule has a subschedule for terminal growth. These itemsare mapped from the Terminal Growth subschedule.
One of the key elements to the discounted future «cash flow» method is that an estimateof a long term benefit stream that is stable and sustainable can be determined. Put anotherway, this benefit stream is continuing into the future without change. In the short term,the benefit stream can vary wildly due to circumstances in the fact pattern. However, atthe end of the reasonably foreseeable future a terminal benefit stream must be estimated.
«I» estimate «4.00%» long term compound annual growth. This «cash flow» growthestimate is based upon «my» assessment of the company’s prospects for sustained growthin relationship to the estimate of ongoing «cash flow» power developed above.
The «cash flow» in the «tenth» period of the discrete forecast was $«536,147». Applyingthe growth rate of «4.00%», «I» estimate the continuing stream should be $«515,526».
HELPER TEXT
If the midyear convention is used in the project, an explanation is needed here. The
following paragraph contains some suggested text.
In the normal discounting process it is assumed that the benefit stream is availableto the hypothetical buyer at the end of the period. This is not always the case since
sales and expenses occur over the course of a period. The benefit stream is then
available during the period and not only at the end. To implement this logic, amidyear convention is used in calculating the present value of the final benefit
stream.
The stream is then discounted to present value and summed with the discrete presentvalues in determining the «fair market value» of «Child's Clothing Store».
Indicated Value
HELPER TEXT
These items are mapped from Pro’s Indicated Value Schedule.
To calculate the «fair market value» of «Child's Clothing Store», the first step is to listthe discrete short term benefit streams and present value them to «December 31, 2006».The terminal benefit stream is then present valued. The sum of all these indicate an initial«fair market value».
Estimate of Value Page 42 of 188
Application of Minority Interest Discount
HELPER TEXT
These items are mapped from Pro’s Indicated Value Schedule.
A minority interest discount is a reduction to the initially indicated value due to a lack ofcontrol prerogatives such as declaring dividends, liquidating the company, going public,issuing or buying stock, directing management and setting management’s salaries, etc. In«my» opinion, a minority interest discount of «37.30%» is appropriate because
HELPER TEXT
Explain why you applied a minority interest discount and how you arrived at the
amount of the discount.
Application of Marketability Discount
HELPER TEXT
These items are mapped from Pro’s Indicated Value Schedule.
In «my» opinion, a discount of «35.00%» is required for lack of marketability. Thediscount reflects an expectation for the lack of a secondary market in which to negotiate aquick sale.
HELPER TEXT
Expand on other factors involved in the determination of the marketability discount.
Appendix E contains further information on the lack of a marketability discount.
Application of Excess or Non-Operating Assets
HELPER TEXT
These items are mapped from Pro’s Indicated Value Schedule.
Be aware that percentages of discounts and premiums may be applied to the excess
assets. If this is the case then explanatory text must be added.
Excess or Non-operating assets represent the value of resources the company has controlof but are not required to operate the business. Examples are excess cash on hand, realestate or other securities. In «my» judgment, excess and non-operating assets that need tobe added back and are part of the value total «18,000».
HELPER TEXT
Explain why the assets are not required in the day to day activities of the businessand how the total value of those assets was determined.
Indicated Value Calculation
The following schedule presents the indicated value using the discounted future «cashflow» method. As calculated, the indicated «fair market value» of «Child's ClothingStore» is $«507,046» which has been rounded to $«507,000».

Estimate of Value Page 43 of 188
«
P.V. Using
Forecast After Tax Growth 30.00% Discounted
Period Cash Flow Rate Discount Rate Cash Flow
241,500
2007 265,650 10.00% 0.76923 204,346
2008 292,215 10.00% 0.59172 172,908
2009 321,437 10.00% 0.45517 146,307
2010 353,580 10.00% 0.35013 123,798
2011 385,402 9.00% 0.26933 103,800
2012 416,235 8.00% 0.20718 86,234
2013 445,371 7.00% 0.15937 70,977
2014 472,093 6.00% 0.12259 57,874
2015 495,698 5.00% 0.09430 46,744
2016 515,526 4.00% 0.07254 37,395
Present Value of Terminal Value 149,581
Subtotal 1,199,965
Minority Interest Discount 37.30%
Subtotal 752,378
Marketability Discount 35.00%
Subtotal 489,046
Excess/Non-Operating Assets 18,000Indicated Equity Value 507,046
SELECTED EQUITY VALUE 507,000
»
Discounted Future «Future Earnings» Summary
HELPER TEXT
The income methods have the Summary Discounted Cash Flows method with severalschedules and sub-schedules in it. The data is being mapped from these schedules.
To have this method appear as considered and used, enter a 1 for its status on theConclusions of Value schedule in Pro.
The discounted future «Cash Flow» method was applied and the «fair market value» of«Child's Clothing Store» as of «December 31, 2006» was «2,271,000». This incomemethod is the most appropriate method to use because the method focuses on the presentvalue of the forecasted future benefits that would accrue to the hypothetical owner of thecompany. They vary greatly in the short run, but are still estimable in the long run. Thismethod requires an explicit forecast of the future benefit streams over a reasonablyforeseeable short term and an estimate of a long term benefit stream that is stable andsustainable (i.e. not varying from period to period and determined to continue into thefuture without compromise). An appropriate discount rate and an estimate of long termgrowth beyond the forecast period allow discrete present values to be calculated andsummed for all of the benefit streams to determine the entity’s value.
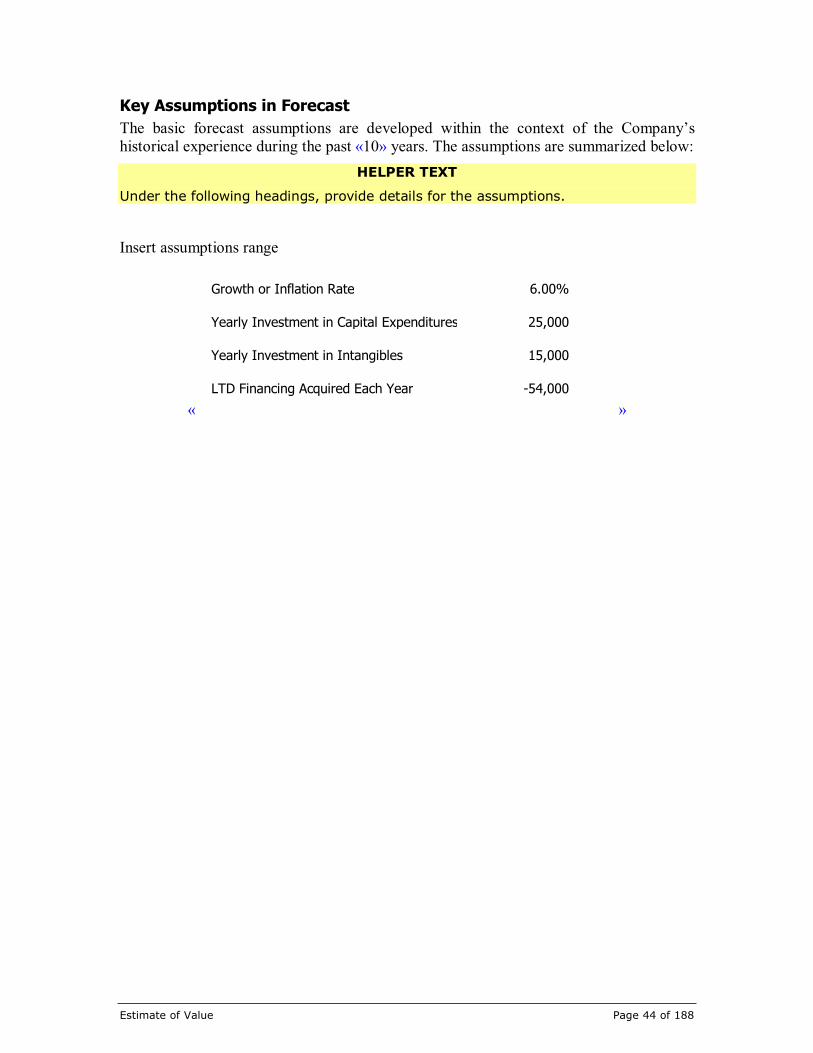
Estimate of Value Page 44 of 188
Key Assumptions in Forecast
The basic forecast assumptions are developed within the context of the Company’shistorical experience during the past «10» years. The assumptions are summarized below:
HELPER TEXT
Under the following headings, provide details for the assumptions.
Insert assumptions range
«
Growth or Inflation Rate 6.00%
Yearly Investment in Capital Expenditures 25,000
Yearly Investment in Intangibles 15,000
LTD Financing Acquired Each Year -54,000
»
Estimate of Value Page 45 of 188
Calculation of the Ongoing Economic Benefit Stream
Estimate of Ongoing Benefit Stream
HELPER TEXT
The schedule that develops the benefit stream is the Earnings/Cash Flow Base
Schedule.
The analysis presented below represents the calculation of the ongoing economic benefitstream. It depicts the calculation of the «after tax cash flow» benefit stream.
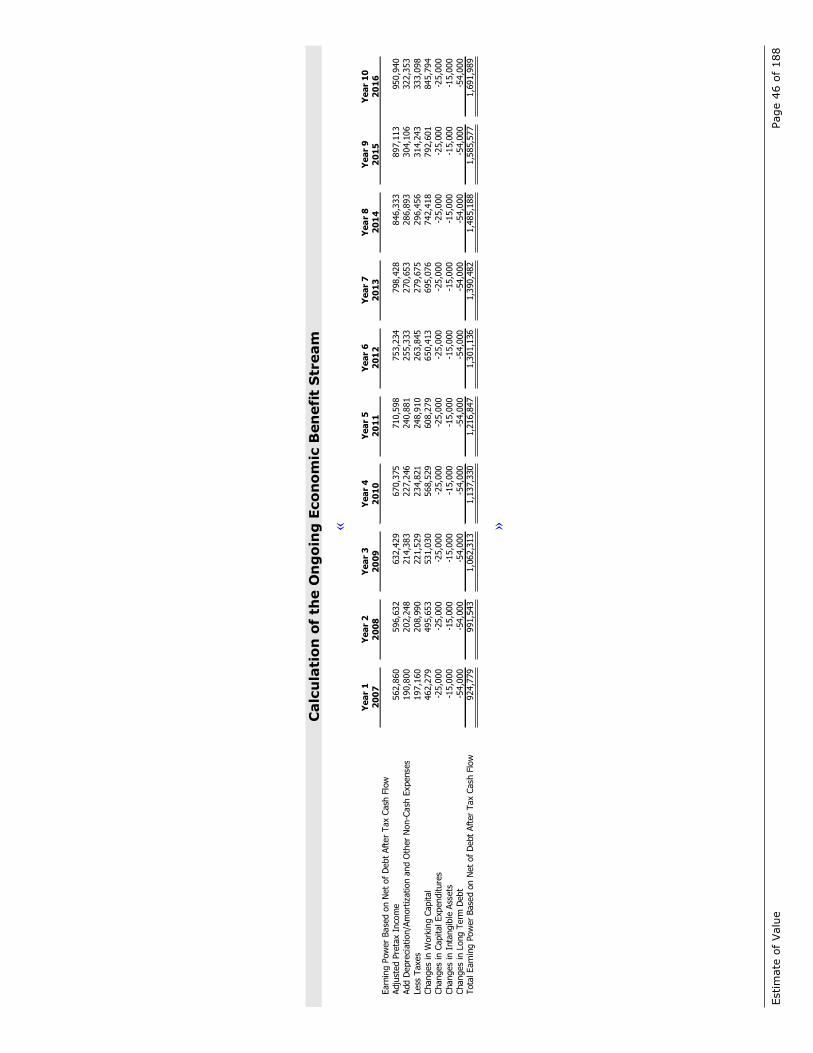
Estim
ate
of
Valu
ePage
46
of
188
Calc
ula
tio
nof
the
On
go
ing
Eco
no
mic
Ben
efi
tS
tream
«
Ye
ar
1Y
ea
r 2
Ye
ar
3Y
ea
r 4
Ye
ar
5Y
ea
r 6
Ye
ar
7Y
ea
r 8
Ye
ar
9Y
ea
r 1
0
20
07
20
08
20
09
20
10
20
11
20
12
20
13
20
14
20
15
20
16
Earn
ing
Pow
er
Base
don
Net
of
Debt
Aft
er
Tax
Cash
Flo
w
Adju
sted
Pre
tax
Inco
me
562,8
60
596,6
32
632,4
29
670,3
75
710,5
98
753,2
34
798,4
28
846,3
33
897,1
13
950,9
40
Add D
epre
ciation/A
mort
ization
and
Oth
er
Non-C
ash
Expense
s190,8
00
202,2
48
214,3
83
227,2
46
240,8
81
255,3
33
270,6
53
286,8
93
304,1
06
322,3
53
Less
Taxes
197,1
60
208,9
90
221,5
29
234,8
21
248,9
10
263,8
45
279,6
75
296,4
56
314,2
43
333,0
98
Changes
inW
ork
ing
Capital
462,2
79
495,6
53
531,0
30
568,5
29
608,2
79
650,4
13
695,0
76
742,4
18
792,6
01
845,7
94
Changes
inCapitalExp
enditure
s-2
5,0
00
-25,0
00
-25,0
00
-25,0
00
-25,0
00
-25,0
00
-25,0
00
-25,0
00
-25,0
00
-25,0
00
Changes
inIn
tangib
leAss
ets
-15,0
00
-15,0
00
-15,0
00
-15,0
00
-15,0
00
-15,0
00
-15,0
00
-15,0
00
-15,0
00
-15,0
00
Changes
inLong
Term
Debt
-54,0
00
-54,0
00
-54,0
00
-54,0
00
-54,0
00
-54,0
00
-54,0
00
-54,0
00
-54,0
00
-54,0
00
Tota
lEarn
ing
Pow
er
Base
don
Net
of
Debt
Aft
er
Tax
Cash
Flo
w924,7
79
991,5
43
1,0
62,3
13
1,1
37,3
30
1,2
16,8
47
1,3
01,1
36
1,3
90,4
82
1,4
85,1
88
1,5
85,5
77
1,6
91,9
89
»

Estimate of Value Page 47 of 188
Discount Rate
HELPER TEXT
Revenue Ruling 59-60 says Sec 6 In the application of certain fundamental valuation
factors, such as earnings and dividends, it is necessary to capitalize the average or
current results at some appropriate rate. A determination of the proper capitalizationrate presents one of the most difficult problems in valuation. That there is no ready
or simple solution will become apparent by a cursory check of the rates of return and
dividend yields in terms of the selling prices of corporate shares listed on the majorexchanges of the country. Wide variations will be found even for companies in the
same industry. Moreover, the ratio will fluctuate from year to year depending upon
economic conditions. Thus, no standard tables of capitalization rates applicable toclosely held corporations can be formulated. Among the more important factors to be
taken into consideration in deciding upon a capitalization rate in a particular case
are: (1) the nature of the business; (2) the risk involved; and (3) the stability orirregularity of earnings.
These items are mapped from Pro’s Discount Rate Schedule.
The discount rate represents the risk an investor is willing to accept for the potentialreward an investment in the subject company will return. Different rates apply to types ofbusinesses. It is also known as the return that an investor requires by generating theinvestment. This risk is not calculated in a vacuum or a sterile environment but rather it iscalculated based on the factors that can be contrasted against investing in other vehiclesthat are available and in the specific environment as of the valuation date.
The buildup method layers different risk estimates to build up a discount rate. Theappropriate discount rate components for the Company are the risk free rate, equity riskpremium, size premium and company specific premium.
Risk Free Rate
HELPER TEXT
These items are mapped from Pro’s Discount Rate Schedule.
The risk free rate measures the rate of return an investor can earn without taking anyadditional risk. Examples of risk free returns are United States Treasury bonds. As of thevaluation date, «December 31, 2006», this yield was «5.00%». The rate applied to thebuildup was «5.00%».
Equity Risk Premium
HELPER TEXT
These items are mapped from the Discount Rate Schedule.
The equity risk premium represents the risk an investor takes on for investing in largepublic companies. This risk is measured by taking the returns over the last 78 years andsubtracting the risk free return over the last 78 years (average annual returns for largecapitalization stocks minus average annual returns for long term government bonds). Thisinformation is published by Morningstar. As of «December 31, 2006», the equity riskpremium was «6.00%». The rate applied to «Child's Clothing Store»was «6.00%».

Estimate of Value Page 48 of 188
Beta
HELPER TEXT
These items are mapped from the Discount Rate Schedule.
HELPER TEXT
In the following paragraph, replace the highlighted phrase with the source of the
beta.
The beta is a measure of volatility. Beta is the systemic risk of a security which cannot beeliminated through diversification. It is the risk that all stocks face. Beta measures therelative volatility of returns on a specific stock compared to the returns on an underlyingindex of stocks, typically the S&P500 or the NYSE Composite Index. Greater volatilitymeans greater variability of returns which means greater risk.
«I» apply a beta of «0.00». The source of the beta used is [enter the source of the beta]By multiplying the common stock equity premium by the above beta, a beta-adjustedcommon stock equity premium of «0.00%» is derived. The rate applied to «Child'sClothing Store» was «0.00%».
Small Capitalization Equity Risk Premium
HELPER TEXT
These items are mapped from the Discount Rate Schedule.
Empirical evidence shows that the risk reward principle (the greater the risk the greaterthe reward) holds true in the size or capitalization of the company. The size premiumrepresents average annual returns for small capitalization stocks minus average annualreturns for large capitalization stocks. Based on Stocks, Bonds, Bills, and InflationYearbook, a publication of Morningstar, the small stock risk premium averaged «7.00%»from 1926 to 2006. The rate applied to «Child's Clothing Store» was «7.00%».
Specific Company Risk Premium
HELPER TEXT
These items are mapped from Pro’s Discount Rate Schedule.
Based upon Company specific factors - cyclical risk, risks of competitive encroachment,size and various operating concentrations (key executive dependency, customerconcentration, for example) - the summation requires an additional risk premium of«7.50%».
HELPER TEXT
Explain the specific risks of the subject company.
Discount Rate Calculation
The schedule below shows how the discount rate was calculated. The discount ratechosen for «Child's Clothing Store» is «30.00%».
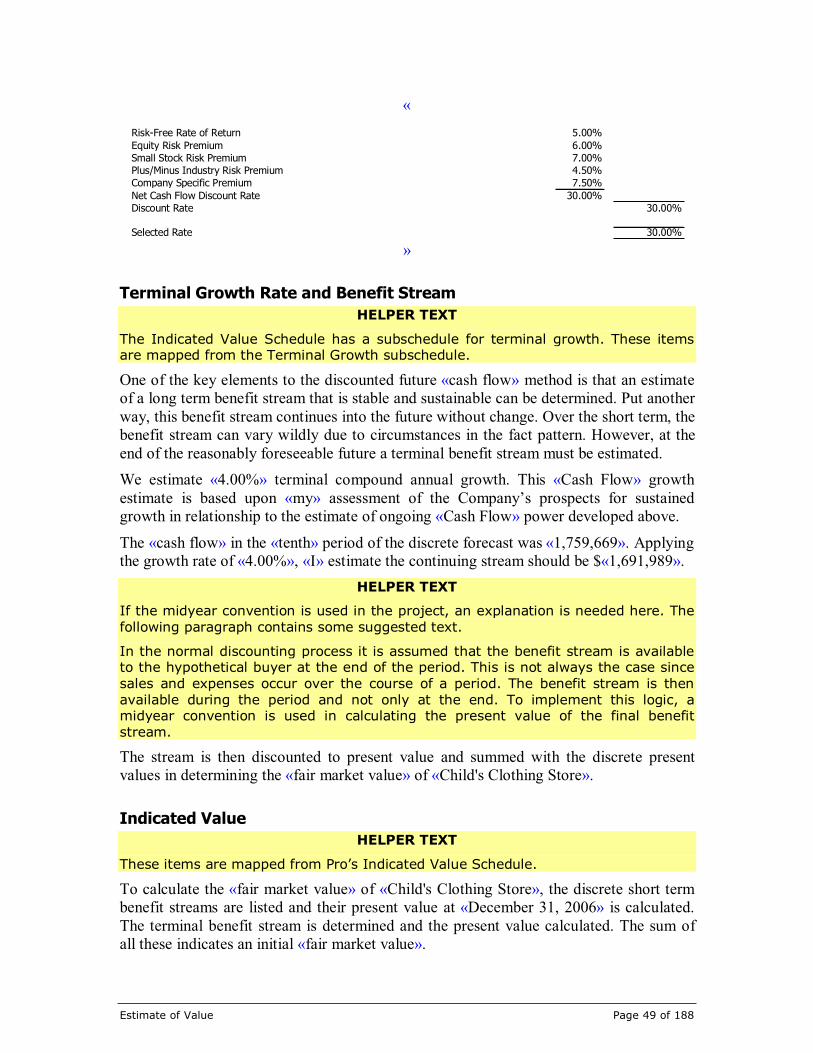
Estimate of Value Page 49 of 188
«
Risk-Free Rate of Return 5.00%
Equity Risk Premium 6.00%
Small Stock Risk Premium 7.00%
Plus/Minus Industry Risk Premium 4.50%
Company Specific Premium 7.50%
Net Cash Flow Discount Rate 30.00%
Discount Rate 30.00%
Selected Rate 30.00%
»
Terminal Growth Rate and Benefit Stream
HELPER TEXT
The Indicated Value Schedule has a subschedule for terminal growth. These itemsare mapped from the Terminal Growth subschedule.
One of the key elements to the discounted future «cash flow» method is that an estimateof a long term benefit stream that is stable and sustainable can be determined. Put anotherway, this benefit stream continues into the future without change. Over the short term, thebenefit stream can vary wildly due to circumstances in the fact pattern. However, at theend of the reasonably foreseeable future a terminal benefit stream must be estimated.
We estimate «4.00%» terminal compound annual growth. This «Cash Flow» growthestimate is based upon «my» assessment of the Company’s prospects for sustainedgrowth in relationship to the estimate of ongoing «Cash Flow» power developed above.
The «cash flow» in the «tenth» period of the discrete forecast was «1,759,669». Applyingthe growth rate of «4.00%», «I» estimate the continuing stream should be $«1,691,989».
HELPER TEXT
If the midyear convention is used in the project, an explanation is needed here. The
following paragraph contains some suggested text.
In the normal discounting process it is assumed that the benefit stream is availableto the hypothetical buyer at the end of the period. This is not always the case since
sales and expenses occur over the course of a period. The benefit stream is then
available during the period and not only at the end. To implement this logic, amidyear convention is used in calculating the present value of the final benefit
stream.
The stream is then discounted to present value and summed with the discrete presentvalues in determining the «fair market value» of «Child's Clothing Store».
Indicated Value
HELPER TEXT
These items are mapped from Pro’s Indicated Value Schedule.
To calculate the «fair market value» of «Child's Clothing Store», the discrete short termbenefit streams are listed and their present value at «December 31, 2006» is calculated.The terminal benefit stream is determined and the present value calculated. The sum ofall these indicates an initial «fair market value».

Estimate of Value Page 50 of 188
Application of Minority Interest Discount
HELPER TEXT
These items are mapped from Pro’s Indicated Value Schedule.
A minority interest discount is a reduction to the initial indicated value due to a lack ofcontrol prerogatives such as declaring dividends, liquidating the company, going public,issuing or buying stock, directing management and setting management’s salaries, etc. In«my» opinion, a minority interest discount of «37.30%» is appropriate because
HELPER TEXT
Explain why you applied a minority interest discount and how you arrived at the
amount of the discount.
Application of Marketability Discount
HELPER TEXT
These items are mapped from Pro’s Indicated Value Schedule.
In «my» opinion, a discount of «35.00%» is required for lack of marketability. Thediscount reflects an expectation for the lack of a secondary market in which to negotiate aquick sale.
HELPER TEXT
Expand on other factors involved in the determination of the marketability discount.
Appendix E contains further information on the lack of a marketability discount.
Excess or Non-Operating Assets
HELPER TEXT
These items are mapped from Pro’s Indicated Value Schedule.
Be aware that percentages of discounts and premiums may be applied to the excess
assets. If this is the case then explanatory text must be added.
Excess or Non-operating assets represent the value of resources the company has controlof but are not required to operate the business. Examples are excess cash on hand, realestate or other securities. In «my» judgment, excess and non-operating assets that need tobe added back and are part of the entity’s value total «18,000».
HELPER TEXT
Explain why the assets are not required in the day to day activities of the businessand how the total value of those assets was determined.
Indicated Value Calculation
The following schedule presents the indicated value using the discounted future «cashflow» method. As calculated, the indicated «fair market value» is $«1,625,365» is whichhas been rounded to $«1,625,000».

Estimate of Value Page 51 of 188
«
P.V. Using
Forecast After Tax Growth 30.00% Discounted
Period Cash Flow Rate Discount Rate Cash Flow
2007 924,779 7.22% 0.76923 711,368
2008 991,543 7.22% 0.59172 586,712
2009 1,062,313 7.14% 0.45517 483,529
2010 1,137,330 7.06% 0.35013 398,211
2011 1,216,847 6.99% 0.26933 327,732
2012 1,301,136 6.93% 0.20718 269,564
2013 1,390,482 6.87% 0.15937 221,596
2014 1,485,188 6.81% 0.12259 182,068
2015 1,585,577 6.76% 0.09430 149,519
2016 1,691,989 6.71% 0.07254 122,734
Present Value of Terminal Value 490,935
Subtotal 3,943,969
Minority Interest Discount 37.30%
Subtotal 2,472,869
Marketability Discount 35.00%
Subtotal 1,607,365
Excess/Non-Operating Assets 18,000
Indicated Equity Value 1,625,365
SELECTED EQUITY VALUE 1,625,000
»
Discounted Future «Future Earnings» Detail
HELPER TEXT
The income methods have the Detailed Discounted Cash Flows method with several
schedules and sub-schedules in it. The data is being mapped from these schedules.To have this method appear as considered and used, enter a 1 for its status on the
Conclusions of Value schedule in Pro.
The discounted future «future earnings» method was applied and the «fair market value»of «Child's Clothing Store» as of «December 31, 2006» was «2,271,000». This incomemethod is the most appropriate method to use because the method focuses on the presentvalue of the forecasted future benefits that would accrue to the hypothetical owner of thecompany that vary greatly in the short run and are still estimable in the long run. Thismethod requires an explicit forecast of the future benefit streams over a reasonablyforeseeable short term and an estimate of a long term benefit stream that is stable andsustainable, i.e. not varying from period to period and determined to continue into thefuture without compromise. An appropriate discount rate and an estimate of long term

Estimate of Value Page 52 of 188
growth beyond the forecast period allow discrete present values to be calculated andsummed for all the benefit streams to determine the entity value.
Key Assumptions in Forecast
The basic forecast assumptions are developed within the context of the Company’shistorical experience during the past «5» years. The assumptions are summarized below:
HELPER TEXT
Under the following headings, provide details for the assumptions.
Sales Growth Assumptions
Gross Profit Margin Assumptions
Operating Expenses Assumptions
Officers’ Compensation Assumptions
Other Income and Expense Assumptions
Depreciation and Amortization Assumptions
Depreciation and amortization is a function of the company’s adjusted balance of fixedassets and intangible assets along with projected acquisitions.
Interest Expense Assumptions
Interest expense is a function of the amount of the company’s interest-bearing debt andthe terms therein.
Income Tax Rate(s) Assumptions
Working Capital Assumptions
Capital Expenditures Assumptions
Long-Term Debt Assumptions
The change in the long-term debt is the net of additional borrowings and the reduction ofoutstanding debt. The assumptions for new debt are

Estimate of Value Page 53 of 188
Estimate of the Ongoing Benefit Stream
The analysis presented below represents the ongoing economic benefit stream. It depictsthe calculation of the «invested capital EBITDA earnings» benefit stream using theassumptions described above. The forecast is for «10» years.

Estim
ate
of
Valu
ePage
54
of
188
Calc
ula
tio
nof
the
On
go
ing
Eco
no
mic
Ben
efi
tS
tream
HE
LP
ER
TEX
T
The
assum
ptions
schedule
has
an
option
tochoose
whic
hbenefit
str
eam
should
be
used.The
range
ischosen
based
on
that
schedule
option.
«
Pro
jecte
d
Ye
ar
20
07
Pro
jecte
d
Ye
ar
20
08
Pro
jecte
d
Ye
ar
20
09
Pro
jecte
d
Ye
ar
20
10
Pro
jecte
d
Ye
ar
20
11
Pro
jecte
d
Ye
ar
20
12
Pro
jecte
d
Ye
ar
20
13
Pro
jecte
d
Ye
ar
20
14
Pro
jecte
d
Yea
r 2
01
5
Pro
jecte
d
Ye
ar
20
16
Pro
ject
ed
Pre
tax
Earn
ings
1,1
20,4
39
1,3
75,8
14
1,6
48,7
82
1,9
67,3
80
2,3
23,6
04
2,7
21,4
87
3,1
65,4
81
3,6
60,4
93
4,2
11,9
31
4,8
25,7
58
Inco
me
Taxes
-277,8
81
-340,0
69
-406,5
69
-484,1
18
-570,8
07
-667,6
13
-775,6
17
-896,0
10
-1,0
30,1
04
-1,1
79,3
47
Depre
ciation
and
Am
ort
ization
143,8
00
143,8
00
193,8
00
193,8
00
193,8
00
193,8
00
193,8
00
193,8
00
193,8
00
193,8
00
Com
mon
Sto
ckD
ivid
end
Adju
stm
ent
00
00
00
00
00
Oth
erN
on-C
ash
Ite
ms
00
00
00
00
00
Decr
ease
/ (I
ncr
ease
)in
Work
ing
Capital
39,7
12
-82,3
73
-90,7
26
-99,9
17
-110,0
29
-121,1
55
-133,3
96
-146,8
64
-161,6
81
-179,6
79
Decr
ease
/ (I
ncr
ease
)in
Invest
ments
656,0
00
0-5
00,0
00
00
00
00
0
Decr
ease
/ (I
ncr
ease
)in
Oth
erAss
ets
00
00
00
00
00
(Decr
ease
) /
Incr
ease
inO
therLia
bili
ties
10,4
50
10,9
73
11,5
21
12,0
97
12,7
02
13,3
37
14,0
04
14,7
04
15,4
39
16,2
11
(Decr
ease
) /
Incr
ease
inLong T
erm
Debt
-19,2
00
-83,1
17
160,0
58
-112,8
15
-125,2
66
-139,1
23
-154,5
51
-171,7
32
-190,8
72
-439,6
98
Less
Pre
ferr
ed
Sto
ck D
ivid
ends
00
00
00
00
00
NetCash
Flo
w1,6
73,3
20
1,0
25,0
28
1,0
16,8
66
1,4
76,4
27
1,7
24,0
03
2,0
00,7
33
2,3
09,7
21
2,6
54,3
92
3,0
38,5
14
3,2
37,0
46
Plu
sBegin
nin
gCash
Bala
nce
50,0
00
50,0
00
50,0
00
50,0
00
50,0
00
50,0
00
50,0
00
50,0
00
50,0
00
50,0
00
Pre
limin
ary
Cash
Availa
ble
1,7
23,3
20
1,0
75,0
28
1,0
66,8
66
1,5
26,4
27
1,7
74,0
03
2,0
50,7
33
2,3
59,7
21
2,7
04,3
92
3,0
88,5
14
3,2
87,0
46
Less
Min
imum
Required
Cash
Bala
nce
-50,0
00
-50,0
00
-50,0
00
-50,0
00
-50,0
00
-50,0
00
-50,0
00
-50,0
00
-50,0
00
-50,0
00
Available
for
Div
idend
-N
etFre
eCash
Flo
w1,6
73,3
20
1,0
25,0
28
1,0
16,8
66
1,4
76,4
27
1,7
24,0
03
2,0
00,7
33
2,3
09,7
21
2,6
54,3
92
3,0
38,5
14
3,2
37,0
46
»

Estimate of Value Page 55 of 188
Discount Rate
HELPER TEXT
Revenue Ruling 59-60 says Sec 6 In the application of certain fundamental valuation
factors, such as earnings and dividends, it is necessary to capitalize the average or
current results at some appropriate rate. A determination of the proper capitalizationrate presents one of the most difficult problems in valuation. That there is no ready
or simple solution will become apparent by a cursory check of the rates of return and
dividend yields in terms of the selling prices of corporate shares listed on the majorexchanges of the country. Wide variations will be found even for companies in the
same industry. Moreover, the ratio will fluctuate from year to year depending upon
economic conditions. Thus, no standard tables of capitalization rates applicable toclosely held corporations can be formulated. Among the more important factors to be
taken into consideration in deciding upon a capitalization rate in a particular case
are: (1) the nature of the business; (2) the risk involved; and (3) the stability orirregularity of earnings.
These items are mapped from Pro’s Discount Rate Schedule.
The discount rate represents the risk an investor is willing to accept for the potentialreward an investment in the subject company will return. Different rates apply to types ofbusinesses. It is also known as the return that an investor requires by generating theinvestment. This risk is not calculated in a vacuum or a sterile environment but rather it iscalculated based on the factors that can be contrasted against investing in other vehiclesthat are available and in the specific environment as of the valuation date.
The buildup method layers different risk estimates to build up a discount rate. Theappropriate discount rate components for the Company are the risk free rate, equity riskpremium, size premium and company specific premium.
Risk Free Rate
HELPER TEXT
These items are mapped from Pro’s Discount Rate Schedule.
The risk free rate measures the rate of return an investor can earn without taking anyadditional risk. Examples of risk free returns are the United States Treasury bonds. As ofthe valuation date, «December 31, 2006», this yield was «5.00%». The rate applied to thebuildup was «5.00%».
Equity Risk Premium
HELPER TEXT
These items are mapped from the Discount Rate Schedule.
The equity risk premium represents the risk an investor takes on for investing in largepublic companies. This risk is measured by taking the returns over the last 78 years andsubtracting the risk free return over the last 81 years (average annual returns for largecapitalization stocks minus average annual returns for long term government bonds). Thisinformation is published by Morningstar. As of «December 31, 2006», the equity riskpremium was «6.00%». The rate applied to «Child's Clothing Store»was «6.00%».
Estimate of Value Page 56 of 188
Beta
HELPER TEXT
These items are mapped from the Discount Rate Schedule.
HELPER TEXT
In the following paragraph, replace the highlighted phrase with the source of the
beta.
The beta is a measure of volatility. Beta is the systemic risk of a security which cannot beeliminated through diversification. It is the risk that all stocks face. Beta measures therelative volatility of returns on a specific stock compared to the returns on an underlyingindex of stocks, typically the S&P500 or the NYSE Composite Index. Greater volatilitymeans greater variability of returns which means greater risk.
«I» applied a beta of «1.00». The source of the beta used is [enter the source of the beta]By multiplying the common stock equity premium by the above beta, a beta-adjustedcommon stock equity premium of «6.00%» is derived. The rate applied to «Child'sClothing Store» was «6.00%».
Small Capitalization Equity Risk Premium
HELPER TEXT
These items are mapped from the Discount Rate Schedule.
Empirical evidence shows that the risk reward principle (the greater the risk the greaterthe reward) holds true in the size or capitalization of the company. The size premiumrepresents average annual returns for small capitalization stocks minus average annualreturns for large capitalization stocks. Based on Stocks, Bonds, Bills, and InflationYearbook, a publication of Morningstar, the small stock risk premium averaged«13.00%» from 1926 to 2006. The rate applied to «Child's Clothing Store» was«13.00%».
Industry Risk Premium
HELPER TEXT
These items are mapped from Pro’s Discount Rate Schedule.
Based upon the industry of the subject company as reported in Stocks, Bonds, Bills, andInflation Yearbook, a publication of Morningstar, the industry risk premium wascalculated as «4.50%». The rate applied to «Child's Clothing Store» was «invested capitalEBITDA earnings».
Specific Company Risk Premium
HELPER TEXT
These items are mapped from Pro’s Discount Rate Schedule.
Based upon Company specific factors - cyclical risk, risks of competitive encroachment,size and various operating concentrations (key executive dependency, customer
Estimate of Value Page 57 of 188
concentration, for example) - the summation requires an additional risk premium of«7.50%».
HELPER TEXT
Explain the specific risks of the subject company.
Cash Flow to Earnings Conversion Adjustment
HELPER TEXT
These items are mapped from Pro’s Discount Rate Schedule.
Because the Morningstar data is based on cash flows, the foregoing factors total to a cashflow discount rate. Because the benefit stream being capitalized is not cash flow based,an additional adjustment is required to convert the discount rate to an earnings baseddiscount rate. An additional «0.00%» is added to the summation to account for theestimated difference between the Company’s cash flows and earnings.
Tax Conversion Adjustment
HELPER TEXT
These items are mapped from Pro’s Discount Rate Schedule.
Because the Morningstar data is based on after tax to the entity benefit streams, theforegoing factors total to an after tax discount rate. Because the benefit stream beingcapitalized is not on an after tax basis, an additional «0.00%» is added to the summationto account for the estimated tax difference.
EBIT Conversion Adjustment
HELPER TEXT
These items are mapped from Pro’s Discount Rate Schedule.
Because the benefit stream is not synchronized with an earnings before interest and taxesbase, an additional «0.00%» is added to the summation to account for the estimateddifference between the Company’s EBIT base and rate calculated.
Discount Rate Calculation
The schedule below shows how the discount rate was calculated. The discount ratechosen for «Child's Clothing Store» is «31.50%».

Estimate of Value Page 58 of 188
«
BUILDUP CAPITALIZATION RATE
Risk-Free Rate of Return 5.00%
Equity Risk Premium 6.00%
X Company Beta 1
Beta Adjusted Common Stock Premium 6.00%
Risk Adjustment For Size 13.00%
Equity Risk Premium 19.00%
Company Specific Premium 7.50%
Net Cash Flow Discount Rate 31.50%
Discount Rate 31.50%
Selected Rate 31.50%
»
Terminal Growth Rate and Benefit Stream
HELPER TEXT
The Indicated Value Schedule has a subschedule for terminal growth. These itemsare mapped from the Terminal Growth subschedule.
One of the key elements to the discounted future «future earnings» method is that anestimate of a long term benefit stream that is stable and sustainable can be determined.Put another way, this benefit stream is continuing into the future without change. In theshort term, the benefit stream can vary wildly due to circumstances in the fact pattern.However, at the end of the reasonably foreseeable future a terminal benefit stream mustbe estimated.
We estimate «4.00%» terminal compound annual growth. This «future earnings» growthestimate is based upon «my» assessment of the Company’s prospects for sustainedgrowth in relationship to the estimate of ongoing «future earnings» power developedabove.
The «future earnings» in the «tenth» period of the discrete forecast was «0». Applyingthe growth rate of «4.00%», «I» estimate the continuing stream should be $«3,237,046».
HELPER TEXT
If the midyear convention is used in the project, an explanation is needed here. The
following paragraph contains some suggested text.
In the normal discounting process it is assumed that the benefit stream is availableto the hypothetical buyer at the end of the period. This is not always the case since
sales and expenses occur over the course of a period. The benefit stream is then
available during the period and not only at the end. To implement this logic, amidyear convention is used in calculating the present value of the final benefit
stream.
The stream is then discounted to present value and summed with the discrete presentvalues in determining the «fair market value» of «Child's Clothing Store».

Estimate of Value Page 59 of 188
Midyear Convention
HELPER TEXT
These items are mapped from Pro’s Indicated Value Schedule.
In the normal discounting process it is assumed that the benefit stream is available to thehypothetical buyer at the end of the period. This is not always the case since sales occurover the course of a period and expenses occur over the course of a period. The benefitstream is then available during the period and not only at the end. To implement thislogic, a midyear convention is used. The midyear convention calculates the present valueof a benefit stream using arithmetic that presumes half is available before the midyearand half is available after the midyear. «I» have applied the midyear convention because
HELPER TEXT
Detail the reasons for applying the midyear convention.
Indicated Value
HELPER TEXT
These items are mapped from Pro’s Indicated Value Schedule.
To calculate the «fair market value» of «Child's Clothing Store», discrete short termbenefit streams are listed and the present value at «December 31, 2006» is calculated.The terminal benefit stream is then present valued. The sum of all these indicates aninitial «fair market value».
Application of Marketability Discount
HELPER TEXT
These items are mapped from Pro’s Indicated Value Schedule.
In «my» opinion, a discount of «37.30%» is required for lack of marketability. Thediscount reflects an expectation for the lack of a secondary market in which to negotiate aquick sale.
HELPER TEXT
Expand on other factors involved in the determination of the marketability discount.
Appendix E contains further information on the lack of a marketability discount.
Indicated Value Calculation
The following schedule presents the indicated value using the discounted future «futureearnings» method. As calculated, the indicated «fair market value» of the $«2,270,794» iswhich has been rounded to $«2,271,000».

Estimate of Value Page 60 of 188
«
P.V. Using
Forecast After Tax 31.50% Discounted
Period Cash Flow Discount Rate Cash Flow
2007 1,673,320 0.76046 1,272,487
2008 1,025,028 0.57829 592,767
2009 1,016,866 0.43977 447,184
2010 1,476,427 0.33442 493,752
2011 1,724,003 0.25431 438,439
2012 2,000,733 0.19340 386,932
2013 2,309,721 0.14707 339,687
2014 2,654,392 0.11184 296,865
2015 3,038,514 0.08505 258,422
2016 3,237,046 0.06468 209,359
Present Value of Terminal Value 791,757
Subtotal 5,527,651
Minority Interest Discount 37.30%
Subtotal 3,465,837
Marketability Discount 35.00%
Subtotal 2,252,794
Excess/Non-Operating Assets 18,000
Indicated Equity Value 2,270,794
SELECTED EQUITY VALUE 2,271,000
»
Capitalization of Excess Earnings
HELPER TEXT
The income methods have the Capitalization of Earnings method with severalschedules and sub-schedules in it. The data is being mapped from these schedules.
To have the Capitalization of Excess Earnings method appear as considered and
used, enter a 1 for its status on the Conclusions of Value schedule in Pro.
The capitalization of excess earnings method develops a value by blending pieces of theasset approach and the income approach. During Prohibition in the 1920’s, this methodwas introduced to estimate the intangible value of breweries and distilleries lost as aresult of enacting Prohibition laws. The US Treasury Department, in Appeals and ReviewMemorandum 34, established the methodology. Its current version is found in RevenueRuling 68-609. This method may appear simple, but it is easy to misuse.
The primary methodology adds the present value of the excess portion of a benefit streamover the normal benefit stream provided by the assemblage of the assets to the «fairmarket value» of those assets generating the benefit stream. Capitalization of excessearnings requires estimates of the adjusted net asset value, ongoing benefit stream,normal benefit stream return and a capitalization «future earnings».

Estimate of Value Page 61 of 188
Estimate of the Benefit Stream
HELPER TEXT
The schedule that develops the benefit stream is the Earnings/Cash Flow Base
Schedule.
The analysis presented below represents the ongoing economic benefit stream. It depictsthe calculation of the «after tax cash flow» benefit stream.

Estim
ate
of
Valu
ePage
62
of
188
Calc
ula
tio
nof
the
On
go
ing
Eco
no
mic
Ben
efi
tS
tream
«
Ye
ar
En
din
g
Ye
ar
En
din
g
Ye
ar
En
din
g
Ye
ar
En
din
g
Ye
ar
En
din
gD
ece
mb
er
31
,2
00
2
De
ce
mb
er
31
,2
00
3
De
ce
mb
er
31
,2
00
4
De
ce
mb
er
31
,2
00
5
De
ce
mb
er
31
,2
00
6Earn
ing P
ow
er
Base
d o
n N
et
ofD
ebt
Aft
er
Tax
Cash
Flo
w
Adju
sted P
reta
xIn
com
e184,0
00
275,0
00
269,0
00
434,0
00
586,0
00
Add
Depre
ciation/A
mort
ization a
nd
Oth
er
Non-C
ash
Expense
s50,0
00
66,0
00
85,0
00
146,0
00
170,0
00
5,0
00,0
00
5,0
00,0
00
5,0
00,0
00
Tota
l5,2
34,0
00
341,0
00
354,0
00
5,5
80,0
00
5,7
56,0
00
Weig
ht
12
34
5
Ongoin
gEarn
ing P
ow
er
3,8
71,8
67
Less
Ongoin
gD
epre
ciation/A
mort
ization
124,7
33
Taxable
Base
3,7
47,1
33
Less
Est
imate
dSta
teIn
com
eTaxes
-Effect
ive R
ate
:10.0
0%
Befo
re F
edera
lTaxe
s3,3
72,4
20
Less
Federa
lTaxes
1,1
46,6
23
Subto
tal
2,2
25,7
97
Additio
nal Adju
stm
ent
»

Estimate of Value Page 63 of 188
The weighting above was performed because
HELPER TEXT
Explain the reasons for weighting the benefit stream.
HELPER TEXT
Taxes show up in the report if the benefit stream is an after tax benefit stream on
the Earnings/Cash Flow Base Schedule.
Taxes were calculated as $«374,713» for the state and $«1,146,623» for federal. Theeconomic benefit stream was reduced by these outflows.
HELPER TEXT
Cash Flow items show up in the report if a cash flow base is chosen on theEarnings/Cash Flow Base Schedule.
A cash flow stream needs to define the changes in working capital, capital expendituresand long term debt. The ongoing increase/decrease in working capital is $«-25,000». Theongoing increase/decrease in capital expenditures is $«-50,000». The change in long termdebt amounts to $«-54,000».
Return on Adjusted Net «Assets» Value
HELPER TEXT
The reasonable rate of return schedule has the data mapped here.
The estimate of net «assets» value is developed below, where required adjustments areapplied to reported «assets». The specific adjustments in this analysis were made becauseof these reasons

Estimate of Value Page 64 of 188
HELPER TEXT
Expand on and make reference to the adjustments the balance sheet that werepreviously mentioned.
«
December 31,
2006
Historic Assets 3,095,000
Tax Affect of Built In Gain -31,074
Adjusted Operating Assets 3,063,926
Reasonable Rate of Return on Operating Equity 34.48%Calculated Return on Operating Equity 1,056,569
SELECTED RETURN ON OPERATING EQUITY 1,056,600
Historic Loan Loan Amount
Market Value Percent
Cash 549,000 100.00% 549,000
Accounts Receivable 140,000 75.00% 105,000
Inventory 840,000 75.00% 630,000
Other Current 80,000 0.00% 0
Net Fixed Assets 1,609,000 50.00% 804,500
Other Non-Current 1,338,000 0.00% 0Non-Operating Assets 75,000 0.00% 0
Tangible Debt Capacity 4,631,000 2,088,500
Existing Debt 1,398,000
Remaining Borrowing Capacity 33.06% 690,500
Market Borrowing Rate--Prime 9.00%
Add 0 Points to the Prime Lending Rate 1.00%
10.00%
1 - Normalized Effective Tax Rate 100.00% - 33.00% 67.00%
Required Rate of Return on Debt Capital 6.70% x 33.06% 2.22%
Required Rate of Return on Equity Capital 33.00% x 97.78% 32.27%
Low range of the earnings discount rate for the company being valued.
Reasonable Rate of Return on Net Tangible Assets 34.48%
Selected Reasonable Rate of Return on Net Tangible Assets 34.48%
»
A return of «34.48%» on net «assets» has been estimated to be appropriate for «Child'sClothing Store». This estimate was made for the following reasons
HELPER TEXT
Expand on the reasons why the estimate is valid.
A return on «assets» of «34.48%» multiplied against net adjusted «assets» results in acalculated return of $«1,056,569». This amount has been rounded to $«1,056,600».

Estimate of Value Page 65 of 188
Capitalization «Multiple»
HELPER TEXT
Revenue Ruling 59-60 says Sec 6 In the application of certain fundamental valuation
factors, such as earnings and dividends, it is necessary to capitalize the average or
current results at some appropriate rate. A determination of the proper capitalizationrate presents one of the most difficult problems in valuation. That there is no ready
or simple solution will become apparent by a cursory check of the rates of return and
dividend yields in terms of the selling prices of corporate shares listed on the majorexchanges of the country. Wide variations will be found even for companies in the
same industry. Moreover, the ratio will fluctuate from year to year depending upon
economic conditions. Thus, no standard tables of capitalization rates applicable toclosely held corporations can be formulated. Among the more important factors to be
taken into consideration in deciding upon a capitalization rate in a particular case
are: (1) the nature of the business; (2) the risk involved; and (3) the stability orirregularity of earnings.
These items are mapped from Pro’s Capitalization Rate Schedule.
The discount rate represents the risk an investor is willing to accept for the potentialreward an investment in the subject company will return. Different rates apply to types ofbusinesses. It is also known as the return that an investor requires by generating theinvestment on an ongoing basis. This risk is not calculated in a vacuum or a sterileenvironment but rather it is calculated based on the factors that can be contrasted againstthe investment in other vehicles that are available in the specific environment as of thevaluation date.
HELPER TEXT
These items are mapped from Pro’s Capitalization Rate Schedule.
The buildup method layers different risk estimates to build up a discount rate. Theappropriate discount rate components for the Company are the risk free rate, equity riskpremium, size premium and company specific premium. Subtracting sustainable growthfrom the discount rate develops the capitalization rate.
Risk Free Rate
HELPER TEXT
These items are mapped from Pro’s Capitalization Rate Schedule.
The risk free rate measures the rate of return an investor can earn without taking anyadditional risk. Examples of risk free returns are the United States Treasury bonds. As ofthe valuation date «December 31, 2006», this yield was «5.00%». The rate applied to thebuildup was «5.00%».
Equity Risk Premium
HELPER TEXT
These items are mapped from Pro’s Capitalization Rate Schedule.
The equity risk premium represents the risk an investor takes on for investing in largepublic companies. This risk is measured by taking the returns of public companies over
Estimate of Value Page 66 of 188
the last 78 years and subtracting the risk free return over the last 81 years(average annualreturns for large capitalization stocks minus average annual returns for long termgovernment bonds). This information is published by Morningstar. As of «December 31,2006», the equity risk premium was «6.00%». The rate applied to «Child's ClothingStore»was «6.00%».
Small Capitalization Equity Risk Premium
HELPER TEXT
These items are mapped from Pro’s Capitalization Rate Schedule.
Empirical evidence shows that the risk reward principle (the greater the risk the greaterthe reward) holds true in the size or capitalization of the company. The size premiumrepresents average annual returns for small capitalization stocks minus average annualreturns for large capitalization stocks. Based on Stocks, Bonds, Bills, and InflationYearbook, a publication of Morningstar, the small stock risk premium averaged «0.00%»from 1926 to 2006. The rate applied to «Child's Clothing Store» was «0.00%».
Industry Risk Premium
HELPER TEXT
These items are mapped from Pro’s Capitalization Rate Schedule.
Based upon the industry of the subject company as reported in Stocks, Bonds, Bills, andInflation Yearbook, a publication of Morningstar, the industry risk premium wascalculated as «4.50%». The rate applied to «Child's Clothing Store» was «4.50%».
Specific Company Risk Premium
HELPER TEXT
These items are mapped from Pro’s Capitalization Rate Schedule.
Based upon Company specific factors - cyclical risk, risks of competitive encroachment,size and various operating concentrations (key executive dependency, customerconcentration, for example) - the summation requires an additional risk premium of«17.50%».
HELPER TEXT
Explain the specific risks of the subject company.
Expected Sustainable Growth Rate
HELPER TEXT
The Capitalization Rate Schedule has a subschedule for Sustainable Growth. These
items are mapped from the Sustainable Growth subschedule.
We estimate «4.00%» long term compound annual growth. This «cash flow» growthestimate is based upon «my» assessment of the Company’s prospects for sustainedgrowth in relationship to the estimate of ongoing «multiple» power developed above.

Estimate of Value Page 67 of 188
Rate to Factor Conversion
HELPER TEXT
These items are mapped from Pro’s Capitalization Rate Schedule.
The capitalization rate developed using the buildup method is «36.00%». The reciprocalof this measure (1/«36.00%») provides a capitalization multiple of «2.888889».
Capitalization «Multiple» Calculation
The schedule below shows how the «multiple» was calculated.
«
BUILDUP CAPITALIZATION RATE
Risk-Free Rate of Return 5.00%
Equity Risk Premium 6.00%
Small Stock Risk Premium 7.00%
Plus/Minus Industry Risk Premium 4.50%
Company Specific Premium 17.50%
Net Cash Flow Discount Rate 40.00%
Discount Rate 40.00%
Sustainable Growth 4.00%
Capitalization Rate To Apply To Next Year Stream 36.00%
Selected Rate 36.00%
»
Indicated Value
HELPER TEXT
These items are mapped from Pro’s Indicated Value Schedule.
To calculate an indicated value for «Child's Clothing Store», the first step is to use the«after tax cash flow» benefit steam and subtract the normal returns on «assets». «In orderto match the appropriate period to the rate the benefit stream must be multiplied by thegrowth rate.». This difference represents the excess earnings and is «divided» by the«multiple» and represents the intangible value. The present value of ongoing benefitstream is then added to the adjusted «assets».
Application of Minority Interest Discount
HELPER TEXT
These items are mapped from Pro’s Indicated Value Schedule.
A minority interest discount is a reduction to the initial indicated value due to a lack ofcontrol prerogatives such as declaring dividends, liquidating the company, going public,issuing or buying stock, directing management, setting management’s salaries, etc. In«my» opinion, a minority interest discount of «60.80%» is appropriate because

Estimate of Value Page 68 of 188
HELPER TEXT
Explain why you applied a minority interest discount and how you arrived at theamount of the discount.
Application of Marketability Discount
HELPER TEXT
These items are mapped from Pro’s Indicated Value Schedule.
In «my» opinion, a discount of «35.00%» is required for lack of marketability. Thediscount reflects an expectation for the lack of a secondary market in which to negotiate aquick sale.
HELPER TEXT
Expand on other factors involved in the determination of the marketability discount.
Appendix E contains further information on the lack of a marketability discount.
Application of Excess or Non-Operating Assets
HELPER TEXT
These items are mapped from Pro’s Indicated Value Schedule.
Be aware that percentages of discounts and premiums may be applied to the excess
assets. If this is the case then explanatory text must be added.
Excess or Non-operating assets represent the value of resources the company has controlof but are not required to operate the business. Examples are excess cash on hand, realestate or other securities. In «my» judgment, excess and non-operating assets that need tobe added back and are part of the entity’s value total $«18,000».
HELPER TEXT
Explain why the assets are not required in the day to day activities of the business
and how the total value of those assets was determined.
Indicated Value Calculation
The following schedule presents the indicated value using the capitalization of excess«cash flow» method. As calculated, the indicated «fair market value» of the «Child'sClothing Store» is $«1,686,072»which has been rounded to $«1,686,072».

Estimate of Value Page 69 of 188
«
Net of Debt After Tax Cash Flow 2,221,500
Sustainable Growth Rate 4.00%
Net of Debt After Tax Cash Flow 2,310,360
SELECTED RETURN ON OPERATING ASSETS 1,056,600
Excess Earnings 1,253,760
Capitalization Rate 36.00%
Intangible Value 3,482,667
Adjusted Operating Assets 3,063,926
Subtotal 6,546,593
Minority Interest Discount 60.80%
Subtotal 2,566,264
Marketability Discount 35.00%
Subtotal 1,668,072
Excess/Non-Operating Assets 18,000Indicated Equity Value 1,686,072
SELECTED EQUITY VALUE 1,686,000 »
Subject Company Transactions
HELPER TEXT
These items are mapped from the Subject Company Transactions Schedule. To have
the Subject Company Transactions method appear as considered and used, enter a 1for its status on the Conclusions of Value schedule in Pro.
There were «2» transactions involving the Company’s stock. The transaction pricesranged from $«75.00» to $«87.00» per share of stock. Based on the price paid per shareof stock and the number of shares of stock outstanding at the time of the transactions, theimplied value of the Company ranged from $«130,500» to $«150,000».
Application of Minority Interest Discount
HELPER TEXT
These items are mapped from the Subject Company Transactions Schedule.
A minority interest discount is a reduction to the initial indicated value due to a lack ofcontrol prerogatives such as declaring dividends, liquidating the company, going public,issuing or buying stock, directing management, setting management’s salaries, etc. In«my» opinion, a minority interest discount of «37.30%» is appropriate because

Estimate of Value Page 70 of 188
HELPER TEXT
Explain why you applied a minority interest discount and how you arrived at theamount of the discount.
Indicated Value Calculation
The following schedule presents the conclusions of value using the capitalization ofearnings method. As calculated, the indicated «fair market value» of the «Child'sClothing Store» is $«57,159»which has been rounded to $«57,000».
«
Transaction Number # 1 # 2
Date of Transaction 11/30/2004 10/31/1999
Transaction Price Per Share 87.00 75.00
Total Shares Outstanding 1,500 2,000
Implied Value 130,500 150,000
Weight Applied 1 1
Weighted Average 140,250
Control Premium 37.30%
Subtotal 87,937 »
Market Data Method – BIZCOMPS
HELPER TEXT
The market approaches Market Data have the schedules that pertain to this method.To have the Market Data Method – BIZCOMPS appear as considered and used, enter
a 1 for its status on the Conclusions of Value schedule in Pro.
Guideline companies are companies that provide a reasonable basis for comparison to therelevant investment characteristics of a company being valued. Guideline companies aremost often publicly traded companies, although they may be private, in the same orsimilar business as the subject of this valuation. Guideline companies are used as a basisto develop valuation conclusions with respect to a subject company under thepresumption that a similar market exists for the subject company as exists for theguideline companies.
Ideal guideline companies should be in the same business as the company being valued.However, if there is insufficient transaction evidence in the same business, it may benecessary to consider companies with an underlying similarity of relevant investmentcharacteristics such as markets, products, growth, cyclical variability and other salientfactors.
The guideline company method uses a group of public companies and/or privately heldcompanies selected for their ability to provide valuation guidelines for the analyst. The
Estimate of Value Page 71 of 188
most commonly used version of the guideline company method develops a ratio, such asthe price/revenue ratio, with which to capitalize the base.
«I» searched the Bizcomps database for transactions involving privately held guidelinecompanies. The Bizcomps database is a study of small business sales whereby relevantpricing information is collected from business brokers and transaction intermediaries onindividual sales of small businesses.
«I» researched Bizcomps transactions by first identifying the industry in which «Child'sClothing Store» operates and, using the Standard Industrial Classification Code (SICCodes) for the industry, «I» performed a search for a group of companies in a similar lineof business as that of the subject company. «I» screened this group further through theuse of key words and phrases that are unique to and describe the subject Company’sproduct or operations. «I» also considered other possible companies mentioned bymanagement or discovered in other research. In the end, further analysis of the remainingcompanies in terms of operating, financial, geographical, industry, and/or marketcharacteristics to insure that the guideline companies are reasonable for inclusion in theguideline company group.
HELPER TEXT
Expand on how the Bizcomps database was scanned. In the following paragraph,
insert the required number.
Given these parameters, «I» found [insert the number of transactions in the grouping]transactions that meet the criteria for being included as guideline companies. The P/Rratios averaged «2.41» and the median was «1.15». The selected P/R ratio was «1.15».The P/SDE ratios averaged «0.19» and the median was «0.21». The selected P/SDE ratiowas «0.21».
Estimate of Revenue
The analysis presented below represents the calculation of the revenue base.

Estim
ate
of
Valu
ePage
72
of
188
Calc
ula
tio
nof
the
Reven
ue
Base
«
Ye
ar
En
din
g
Ye
ar
En
din
g
Ye
ar
En
din
g
Ye
ar
En
din
g
Ye
ar
En
din
g
His
toric
De
ce
mb
er
31
,2
00
2
De
ce
mb
er
31
,2
00
3
De
ce
mb
er
31
,2
00
4
De
ce
mb
er
31
,2
00
5
De
ce
mb
er
31
,2
00
6Revenue
2,1
00,0
00
2,9
35,0
00
3,9
70,0
00
5,1
94,0
00
5,9
66,0
00
Weig
ht
On R
evenue
12
34
5
Ongoin
g R
evenue
4,6
99,0
67
SELECTED
ON
GO
ING
REVEN
UE
BASE
4,6
99,1
00
»
Estimate of Value Page 73 of 188
The weighting above was performed because
HELPER TEXT
Explain why and how the weightings were calculated and applied.
The Revenue was calculated as $«4,699,067» and the selected assets was rounded as$«4,699,100».
Estimate of Sellers’ Discretionary Earnings
The analysis presented below represents the calculation of the SDE base.
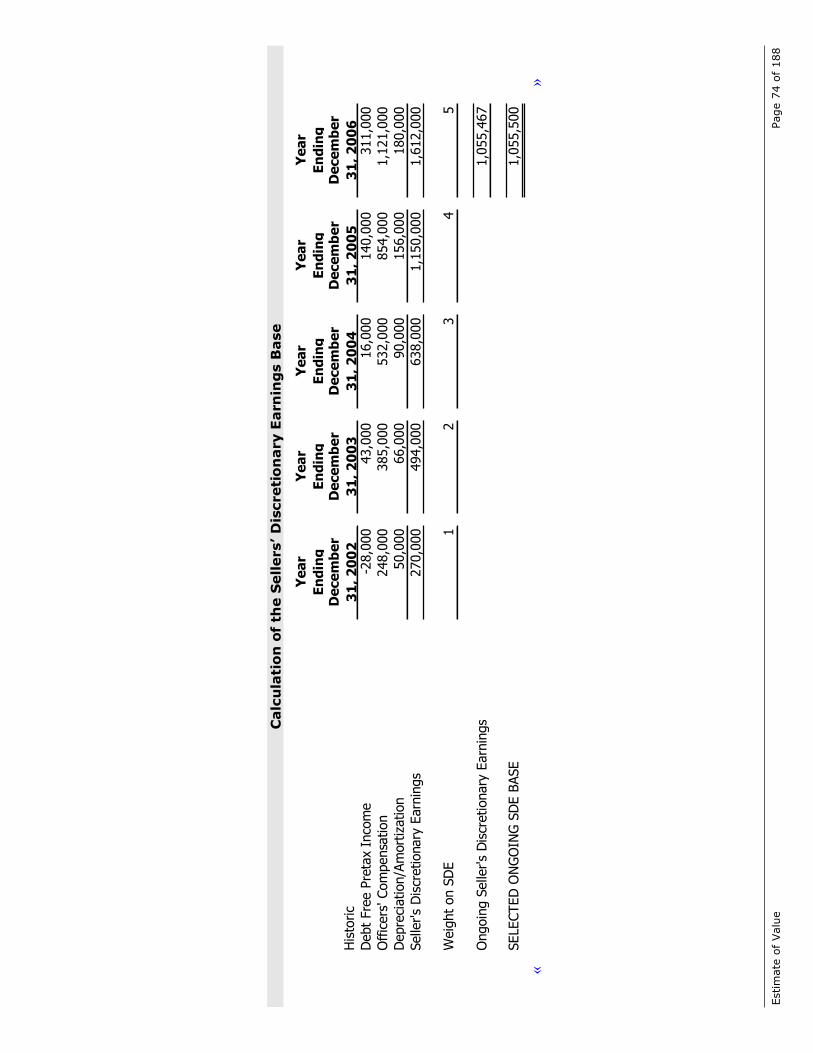
Estim
ate
of
Valu
ePage
74
of
188
Calc
ula
tio
nof
the
Sellers’D
iscreti
on
ary
Earn
ing
sB
ase
«
Ye
ar
En
din
g
Ye
ar
En
din
g
Ye
ar
En
din
g
Ye
ar
En
din
g
Ye
ar
En
din
g
His
toric
De
ce
mb
er
31
,2
00
2
De
ce
mb
er
31
,2
00
3
De
ce
mb
er
31
,2
00
4
De
ce
mb
er
31
,2
00
5
De
ce
mb
er
31
,2
00
6D
ebt
Fre
e P
reta
xIn
com
e-2
8,0
00
43,0
00
16,0
00
140,0
00
311,0
00
Offic
ers
'Com
pensa
tion
248,0
00
385,0
00
532,0
00
854,0
00
1,1
21,0
00
Depre
ciation/A
mort
ization
50,0
00
66,0
00
90,0
00
156,0
00
180,0
00
Selle
r's
Dis
cretionary
Earn
ings
270,0
00
494,0
00
638,0
00
1,1
50,0
00
1,6
12,0
00
Weig
ht
on
SD
E1
23
45
Ongoin
gSelle
r's
Dis
cretionary
Earn
ings
1,0
55,4
67
SELECTED
ON
GO
ING
SD
EBASE
1,0
55,5
00
»
Estimate of Value Page 75 of 188
The weighting above was performed because
HELPER TEXT
Explain why and how the weightings were calculated and applied.
The SDE was calculated as $«1,055,467» and the selected SDE was rounded as$«1,055,500».
Application of Minority Interest Discount
HELPER TEXT
The BIZCOMPS indicated value schedule is where the data is mapped from.
A minority interest discount is a reduction to the initial indicated value due to a lack ofcontrol prerogatives such as declaring dividends, liquidating the company, going public,issuing or buying stock, directing management, setting management’s salaries, etc. In«my» opinion, a minority interest discount of «37.30%» is appropriate because
HELPER TEXT
Explain why you applied a minority interest discount and how you arrived at theamount of the discount.
Application of Marketability Discount
HELPER TEXT
The BIZCOMPS indicated value schedule is where the data is mapped from.
In «my» opinion, a discount of «35.00%» is required for lack of marketability. Thediscount reflects an expectation for the lack of a secondary market in which to negotiate aquick sale.
HELPER TEXT
Expand on other factors involved in the determination of the marketability discount.
Appendix E contains further information on the lack of a marketability discount.
Application of Excess or Non-Operating Assets
HELPER TEXT
These items are mapped from Pro’s Indicated Value Schedule.
Be aware that percentages of discounts and premiums may be applied to the excessassets. If this is the case then explanatory text must be added.
Excess or Non-operating assets represent the value of resources the company has controlof but are not required to operate the business. Examples are excess cash on hand, real

Estimate of Value Page 76 of 188
estate or other securities. In «my» judgment, excess and non-operating assets that need tobe added back and are part of the entity’s value total $«18,000».
HELPER TEXT
Explain why the assets are not required in the day to day activities of the businessand how the total value of those assets was determined.
Indicated Value Calculation
HELPER TEXT
In the following paragraph, if only one ratio was used, delete the first sentence. If
more than one ratio was used, you must explain how they were weighted.
Each of the multiples were weighted. The following schedule presents the conclusions ofvalue using the BIZCOMPS data ratio methods. As calculated, the indicated «fair marketvalue» of the «1,049,104» is which has been rounded to «1,049,100».
«
Revenue SDE
Multiple Multiple
Base 4,699,100 1,055,500
Multiple 0.21 1.15
Subtotal 988,129 1,217,885
Net Operating Assets 1,427,000 1,427,000
Subtotal 2,415,129 2,644,885
Weight 1 1
Ongoing Value 2,530,007
Minority Interest Discount 37.30%
Subtotal 1,586,314
Marketability Discount 35.00%
Operating Value 1,031,104
Excess/Non-Operating Assets 18,000 »
Market Data Method – Pratts Stats
HELPER TEXT
The market approaches Market Data have the schedules that pertain to this method.To have the Market Data Method – Pratts Stats appear as considered and used, enter
a 1 for its status on the Conclusions of Value schedule in Pro.
Guideline companies are companies that provide a reasonable basis for comparison to therelevant investment characteristics of a company being valued. Guideline companies aremost often publicly traded companies, although they may be private, in the same orsimilar business as the subject of this valuation. Guideline companies are used as a basisto develop valuation conclusions with respect to a subject company under the

Estimate of Value Page 77 of 188
presumption that a similar market exists for the subject company as exists for theguideline companies.
Ideal guideline companies should be in the same business as the company being valued.However, if there is insufficient transaction evidence in the same business, it may benecessary to consider companies with an underlying similarity of relevant investmentcharacteristics such as markets, products, growth, cyclical variability and other salientfactors.
The guideline company method uses a group of public companies and/or privately heldcompanies selected for their ability to provide valuation guidelines for the analyst. Themost commonly used version of the guideline company method develops a price/earningsratio with which to capitalize net income. By convention, analysts express therelationship between the market price of a stock and its historical book value in the formof a ratio of the market price of book value, i.e., price/book (P/B) ratio. If the publiccompany group is sufficiently homogeneous with respect to the companies selected, theirrecent performances, and the public market’s reaction to their performances, analyststypically calculate some form of average P/B ratio as representative of the group.
In addition to searching for publicly traded guideline companies, «I» searched the PrattsStats database for transactions involving privately held and publicly traded guidelinecompanies. The Pratts Stats database is a study of transactions involving publicly tradedand privately held businesses. «I» researched guideline companies by first identifying theindustry in which «Child's Clothing Store» operates and, using the Standard IndustrialClassification Code (SIC Codes) for the industry, «I» performed a search for a group ofcompanies in a similar line of business as that of the subject company. «I» screened thisgroup further through the use of key words and phrases that are unique to and describethe subject Company’s product or operations and to eliminate those companies whosestock is very thinly traded. «I» also considered other possible companies mentioned bymanagement or discovered in other research. In the end, further analysis of the remainingcompanies in terms of operating, financial, geographical, industry, and/or marketcharacteristics to insure that the guideline companies are reasonable for inclusion in theguideline company group. The search parameters used in determining whether or not aparticular transaction in the Pratts Stats database was comparable to the subject Companywere ………………
The selected P/E ratio was «7.00». The selected P/R ratio was «0.80». The selectedP/Cash Flow ratio was «3.00».
Estimate of Net Earnings
The analysis presented below represents the calculation of the Net Earnings.

Estim
ate
of
Valu
ePage
78
of
188
Calc
ula
tio
nof
the
His
toric
alB
oo
kV
alu
e
« Year
En
din
g
Year
En
din
g
Year
En
din
g
Year
En
din
g
Year
En
din
gD
ecem
ber
31
,2
00
2
Decem
ber
31
,2
00
3
Decem
ber
31
,2
00
4
Decem
ber
31
,2
00
5
Decem
ber
31
,2
00
6H
isto
ric
Pre
tax
Inco
me
164,0
00
233,0
00
226,0
00
390,0
00
531,0
00
Weig
ht
12
34
5
Ongoin
g E
arn
ing
Pow
er
368,2
00
Taxable
Base
368,2
00
Less
Est
imate
dSta
teIn
com
eTaxes
-Effect
ive
Rate
:10.0
0%
Befo
reFedera
lTaxes
331,3
80
Less
Federa
l Taxes
112,4
88
Calc
ula
ted
Ongoin
gAdditio
nalAdju
stm
ent
218,8
92
SELECTED
ON
GO
ING
AD
DIT
ION
AL
AD
JUSTM
EN
T218,9
00
»

Estimate of Value Page 79 of 188
HELPER TEXT
Explain why and how the adjustments were made.
The weighting above was performed because
HELPER TEXT
Explain why and how the weightings were calculated and applied.
The earnings base was calculated as $«218,892» and the selected earnings base wasrounded as $«218,900».
Estimate of Revenue
The analysis presented below represents the calculation of the revenue.

Estim
ate
of
Valu
ePage
80
of
188
Calc
ula
tio
nof
the
His
toric
alB
oo
kV
alu
e
«
Ye
ar
En
din
g
Ye
ar
En
din
g
Ye
ar
En
din
g
Ye
ar
En
din
g
Ye
ar
En
din
g
His
toric
De
ce
mb
er
31
,2
00
2
De
ce
mb
er
31
,2
00
3
De
ce
mb
er
31
,2
00
4
De
ce
mb
er
31
,2
00
5
De
ce
mb
er
31
,2
00
6N
et
Sale
s2,1
00,0
00
2,9
35,0
00
3,9
70,0
00
5,1
94,0
00
5,9
66,0
00
Weig
ht
On N
et
Sale
s1
23
45
Ongoin
g N
et
Sale
s4,6
99,0
67
SELECTED
ON
GO
ING
NET
SALES
BASE
4,6
99,1
00
»

Estimate of Value Page 81 of 188
HELPER TEXT
Explain why and how the adjustments were made.
The weighting above was performed because
HELPER TEXT
Explain why and how the weightings were calculated and applied.
The revenue base was calculated as $«4,699,100» and the selected book value wasrounded as $«376,133».
Estimate of Cash Flow
The analysis presented below represents the calculation of the cash flow base.

Estim
ate
of
Valu
ePage
82
of
188
Calc
ula
tio
nof
the
His
toric
alB
oo
kV
alu
e
«
Ye
ar
En
din
g
Ye
ar
En
din
g
Ye
ar
En
din
g
Ye
ar
En
din
g
Ye
ar
En
din
g
His
toric
De
ce
mb
er
31
,2
00
2
De
ce
mb
er
31
,2
00
3
De
ce
mb
er
31
,2
00
4
De
ce
mb
er
31
,2
00
5
De
ce
mb
er
31
,2
00
6Aft
er
Tax
Inco
me
113,0
00
174,0
00
160,0
00
250,0
00
345,0
00
Depre
ciation a
nd
Am
ort
ization
50,0
00
66,0
00
90,0
00
156,0
00
180,0
00
Oth
er
Non-C
ash
Expense
s0
00
00
Gro
ssCash
Flo
w163,0
00
240,0
00
250,0
00
406,0
00
525,0
00
Weig
ht
On G
ross
Cash
Flo
wBase
12
34
5
Ongoin
gCash
Flo
wBase
376,1
33
SELECTED
ON
GO
ING
CASH
FLO
WBASE
376,1
00
»
Estimate of Value Page 83 of 188
HELPER TEXT
Explain why and how the adjustments were made.
The weighting above was performed because
HELPER TEXT
Explain why and how the weightings were calculated and applied.
The book value was calculated as $«376,133» and the selected book value was roundedas $«376,100».
Application of Minority Interest Discount
HELPER TEXT
The Pratts Stats indicated value schedule is where the data is mapped from.
A minority interest discount is a reduction to the initial indicated value due to a lack ofcontrol prerogatives such as declaring dividends, liquidating the company, going public,issuing or buying stock, directing management, setting management’s salaries, etc. In«my» opinion, a minority interest discount of «37.30%» is appropriate because
HELPER TEXT
Explain why you applied a minority interest discount and how you arrived at theamount of the discount.
Application of Marketability Discount
HELPER TEXT
The Pratts Stats indicated value schedule is where the data is mapped from.
In «my» opinion, a discount of «35.00%» is required for lack of marketability. Thediscount reflects an expectation for the lack of a secondary market in which to negotiate aquick sale.
HELPER TEXT
Expand on other factors involved in the determination of the marketability discount.
Appendix E contains further information on the lack of a marketability discount.

Estimate of Value Page 84 of 188
Application of Excess or Non-Operating Assets
HELPER TEXT
These items are mapped from Pro’s Indicated Value Schedule.
Be aware that percentages of discounts and premiums may be applied to the excess
assets. If this is the case then explanatory text must be added.
Excess or Non-operating assets represent the value of resources the company has controlof but are not required to operate the business. Examples are excess cash on hand, realestate or other securities. In «my» judgment, excess and non-operating assets that need tobe added back and are part of the entity’s value total $«18,000».
HELPER TEXT
Explain why the assets are not required in the day to day activities of the businessand how the total value of those assets was determined.
Indicated Value Calculation
HELPER TEXT
In the following paragraph, if only one ratio was used, delete the first sentence. If
more than one ratio was used, you must explain how they were weighted.
Each of the market Pratts Stats ratios were weighted. The following schedule presents theconclusions of value using the market data Pratts Stats ratio method. As calculated, theindicated «fair market value» of the $«890,141» is which has been rounded to$«890,100».

Estim
ate
of
Valu
ePage
85
of
188
In
dic
ate
dV
alu
e C
alc
ula
tio
n
«
Ne
tS
ale
sG
ross
Ca
sh
Flo
wN
et
Inco
me
Mu
ltip
leM
ult
iple
Mu
ltip
le
Base
4,6
99,1
00
376,1
00
218,9
00
Multip
le0.8
0x
3.0
0x
7.0
0x
Subto
tal
3,7
59,2
80
1,1
28,3
00
1,5
32,3
00
Weig
ht
11
1
Ongoin
gValu
e2,1
39,9
60
Min
ority
Inte
rest
Dis
count
37.3
0%
Subto
tal
1,3
41,7
55
Mark
eta
bili
tyD
isco
unt
35.0
0%
Opera
ting V
alu
e872,1
41
Exce
ss/N
on-O
pera
ting A
ssets
18,0
00
»
Estimate of Value Page 86 of 188
Market Data Method – IBA
HELPER TEXT
The market approaches Market Data have the schedules that pertain to this method.To have the Market Data Method – IBA appear as considered and used, enter a 1 for
its status on the Conclusions of Value schedule in Pro.
Guideline companies are companies that provide a reasonable basis for comparison to therelevant investment characteristics of a company being valued. Guideline companies aremost often publicly traded companies, although they may be private, in the same orsimilar business as the subject of this valuation. Guideline companies are used as a basisto develop valuation conclusions with respect to a subject company under thepresumption that a similar market exists for the subject company as exists for theguideline companies.
Ideal guideline companies should be in the same business as the company being valued.However, if there is insufficient transaction evidence in the same business, it may benecessary to consider companies with an underlying similarity of relevant investmentcharacteristics such as markets, products, growth, cyclical variability and other salientfactors.
The guideline company method uses a group of public companies and/or privately heldcompanies selected for their ability to provide valuation guidelines for the analyst. Themost commonly used version of the guideline company method develops a ratio, such asthe price/revenue ratio, with which to capitalize the base.
«I» searched the IBA database for transactions involving privately held guidelinecompanies. The IBA database is a study of small business sales whereby relevant pricinginformation is collected from business brokers and transaction intermediaries onindividual sales of small businesses. The search parameters used in determining whetheror not a particular transaction in the IBA database was comparable to the subjectCompany were
HELPER TEXT
Expand on how the IBA database was scanned. In the following paragraph, insert therequired number.
Given these parameters, «I» found [insert the number of transactions in the grouping]transactions that meet the criteria for being included as guideline companies. The selectedP/R ratio was «0.25». The selected P/SDE ratio was «1.10».
Estimate of Revenue
The analysis presented below represents the calculation of the revenue base.

Estim
ate
of
Valu
ePage
87
of
188
Calc
ula
tio
nof
the
Reven
ue
Base
«
Ye
ar
En
din
g
Ye
ar
En
din
g
Ye
ar
En
din
g
Ye
ar
En
din
g
Ye
ar
En
din
g
His
toric
De
ce
mb
er
31
,2
00
2
De
ce
mb
er
31
,2
00
3
De
ce
mb
er
31
,2
00
4
De
ce
mb
er
31
,2
00
5
De
ce
mb
er
31
,2
00
6Revenue
2,1
00,0
00
2,9
35,0
00
3,9
70,0
00
5,1
94,0
00
5,9
66,0
00
Weig
ht
On R
evenue
12
34
5
Ongoin
g R
evenue
4,6
99,0
67
SELECTED
ON
GO
ING
REVEN
UE
BASE
4,6
99,1
00
»

Estimate of Value Page 88 of 188
The weighting above was performed because
HELPER TEXT
Explain why and how the weightings were calculated and applied.
The Revenue was calculated as $«4,699,067» and the selected assets was rounded as$«4,699,100».
Estimate of Sellers’ Discretionary Earnings
The analysis presented below represents the calculation of the SDE base.
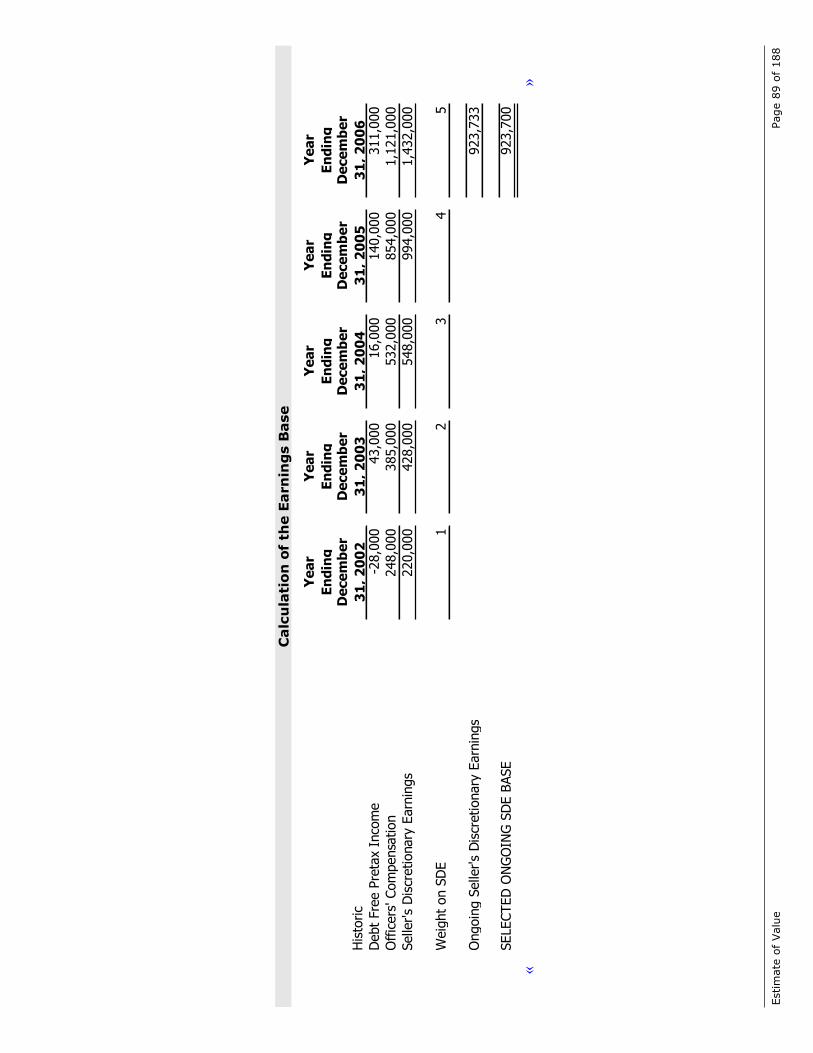
Estim
ate
of
Valu
ePage
89
of
188
Calc
ula
tio
nof
the
Earn
ing
sB
ase
«
Ye
ar
En
din
g
Ye
ar
En
din
g
Ye
ar
En
din
g
Ye
ar
En
din
g
Ye
ar
En
din
g
His
toric
De
ce
mb
er
31
,2
00
2
De
ce
mb
er
31
,2
00
3
De
ce
mb
er
31
,2
00
4
De
ce
mb
er
31
,2
00
5
De
ce
mb
er
31
,2
00
6D
ebt
Fre
e P
reta
xIn
com
e-2
8,0
00
43,0
00
16,0
00
140,0
00
311,0
00
Offic
ers
'Com
pensa
tion
248,0
00
385,0
00
532,0
00
854,0
00
1,1
21,0
00
Selle
r's
Dis
cretionary
Earn
ings
220,0
00
428,0
00
548,0
00
994,0
00
1,4
32,0
00
Weig
ht
on
SD
E1
23
45
Ongoin
gSelle
r's
Dis
cretionary
Earn
ings
923,7
33
SELECTED
ON
GO
ING
SD
EBASE
923,7
00
»
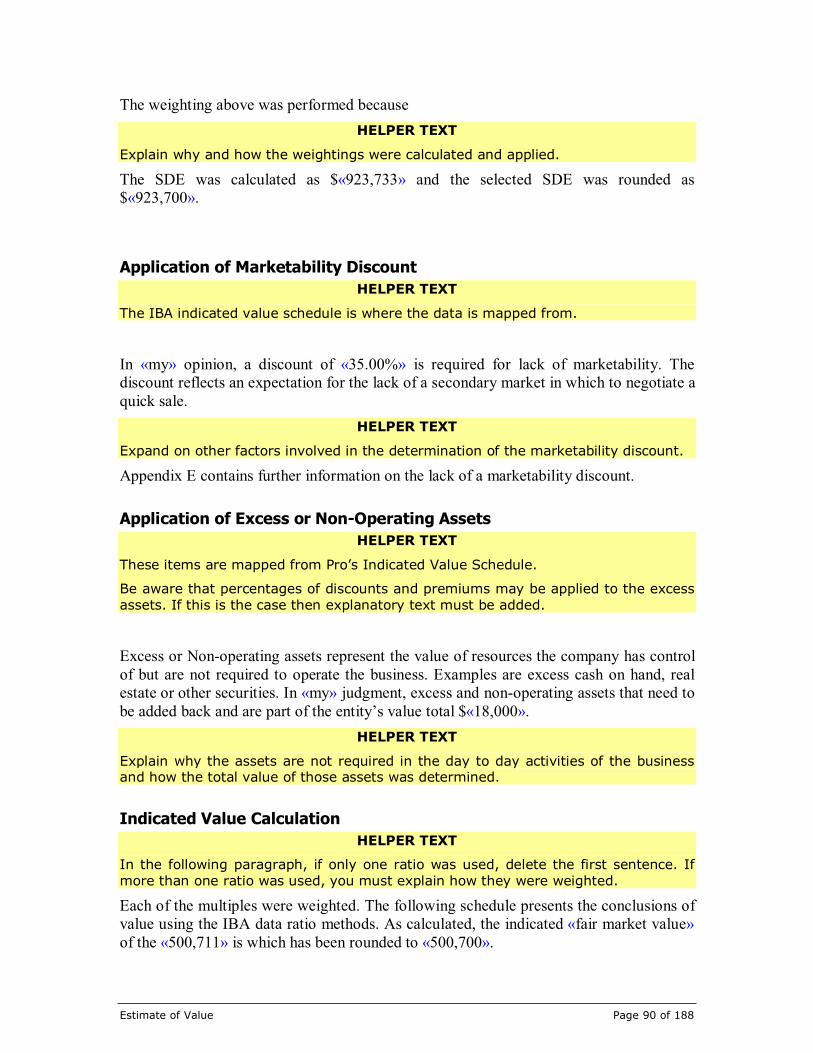
Estimate of Value Page 90 of 188
The weighting above was performed because
HELPER TEXT
Explain why and how the weightings were calculated and applied.
The SDE was calculated as $«923,733» and the selected SDE was rounded as$«923,700».
Application of Marketability Discount
HELPER TEXT
The IBA indicated value schedule is where the data is mapped from.
In «my» opinion, a discount of «35.00%» is required for lack of marketability. Thediscount reflects an expectation for the lack of a secondary market in which to negotiate aquick sale.
HELPER TEXT
Expand on other factors involved in the determination of the marketability discount.
Appendix E contains further information on the lack of a marketability discount.
Application of Excess or Non-Operating Assets
HELPER TEXT
These items are mapped from Pro’s Indicated Value Schedule.
Be aware that percentages of discounts and premiums may be applied to the excess
assets. If this is the case then explanatory text must be added.
Excess or Non-operating assets represent the value of resources the company has controlof but are not required to operate the business. Examples are excess cash on hand, realestate or other securities. In «my» judgment, excess and non-operating assets that need tobe added back and are part of the entity’s value total $«18,000».
HELPER TEXT
Explain why the assets are not required in the day to day activities of the businessand how the total value of those assets was determined.
Indicated Value Calculation
HELPER TEXT
In the following paragraph, if only one ratio was used, delete the first sentence. If
more than one ratio was used, you must explain how they were weighted.
Each of the multiples were weighted. The following schedule presents the conclusions ofvalue using the IBA data ratio methods. As calculated, the indicated «fair market value»of the «500,711» is which has been rounded to «500,700».

Estimate of Value Page 91 of 188
«
SDE Revenue
Multiple Multiple
Base 923,700 4,699,100
Multiple 1.10 0.25
Subtotal 1,016,070 1,174,775
Net Operating Assets 89,000 89,000
Subtotal 1,105,070 1,263,775
Weight 1 1
Ongoing Value 1,184,423
Minority Interest Discount 37.30%
Subtotal 742,633
Marketability Discount 35.00%
Operating Value 482,711
Excess/Non-Operating Assets 18,000 »
Market Data Method – Mid-Market Comps
HELPER TEXT
The market approaches Market Data have the schedules that pertain to this method.
To have the Market Data Method – Mid-Market Comps appear as considered andused, enter a 1 for its status on the Conclusions of Value schedule in Pro.
Guideline companies are companies that provide a reasonable basis for comparison to therelevant investment characteristics of a company being valued. Guideline companies aremost often publicly traded companies, although they may be private, in the same orsimilar business as the subject of this valuation. Guideline companies are used as a basisto develop valuation conclusions with respect to a subject company under thepresumption that a similar market exists for the subject company as exists for theguideline companies.
Ideal guideline companies should be in the same business as the company being valued.However, if there is insufficient transaction evidence in the same business, it may benecessary to consider companies with an underlying similarity of relevant investmentcharacteristics such as markets, products, growth, cyclical variability and other salientfactors.
The guideline company method uses a group of public companies and/or privately heldcompanies selected for their ability to provide valuation guidelines for the analyst. Themost commonly used version of the guideline company method develops a price/earningsratio with which to capitalize net income. By convention, analysts express therelationship between the market price of a stock and its historical book value in the formof a ratio of the market price of book value, i.e., price/book (P/B) ratio. If the publiccompany group is sufficiently homogeneous with respect to the companies selected, their

Estimate of Value Page 92 of 188
recent performances, and the public market’s reaction to their performances, analyststypically calculate some form of average P/B ratio as representative of the group.
In addition to searching for publicly traded guideline companies, «I» searched theMidmarket Comps database for transactions involving privately held and publicly tradedguideline companies. The Midmarket Comps database is a study of transactions involvingpublicly traded and privately held businesses with annual sales between $1million and$100 million. The study is compiled by World M&A Network. «I» researched guidelinecompanies by first identifying the industry in which «Child's Clothing Store» operatesand, using the Standard Industrial Classification Code (SIC Codes) for the industry, «I»performed a search for a group of companies in a similar line of business as that of thesubject company. «I» screened this group further through the use of key words andphrases that are unique to and describe the subject Company’s product or operations andto eliminate those companies whose stock is very thinly traded. «I» also considered otherpossible companies mentioned by management or discovered in other research. In theend, further analysis of the remaining companies in terms of operating, financial,geographical, industry, and/or market characteristics to insure that the guidelinecompanies are reasonable for inclusion in the guideline company group. The searchparameters used in determining whether or not a particular transaction in the Midmarketdatabase was comparable to the subject Company were
«
(000's) (000's) (000's) (000's) (000's) Price to Price to Price to Price to
SIC Code Date Price Revenue Earnings Assets S.H. Equity Earnings Revenue Assets Book
2813 12/30/95 6,000 4,000 1,000 1,000 4.62 1.40 4.29
5661 05/08/98 100,000 299,000 9,000 132,000 56,000 10.75 0.33 0.76 1.79
5661 03/07/00 64,000 469,000 -44,000 163,000 0.14 0.39
Calculated Mean 7.69 0.62 1.81 1.79Calculated Median 7.69 0.33 0.76 1.79
SELECTED MEDIAN 7.69 0.33 0.76 1.79
»
The P/E ratios averaged «7.69» and the median was «7.69». The selected P/E ratio was«7.69». The P/R ratios averaged «0.62» and the median was «0.33». The selected P/Rratio was «0.33». The P/A ratios averaged «1.81» and the median was «0.76». Theselected P/A ratio was «0.76». The P/B ratios averaged «1.79» and the median was«1.79». The selected P/B ratio was «1.79».
Estimate of Net Earnings
The analysis presented below represents the calculation of the Net Earnings.
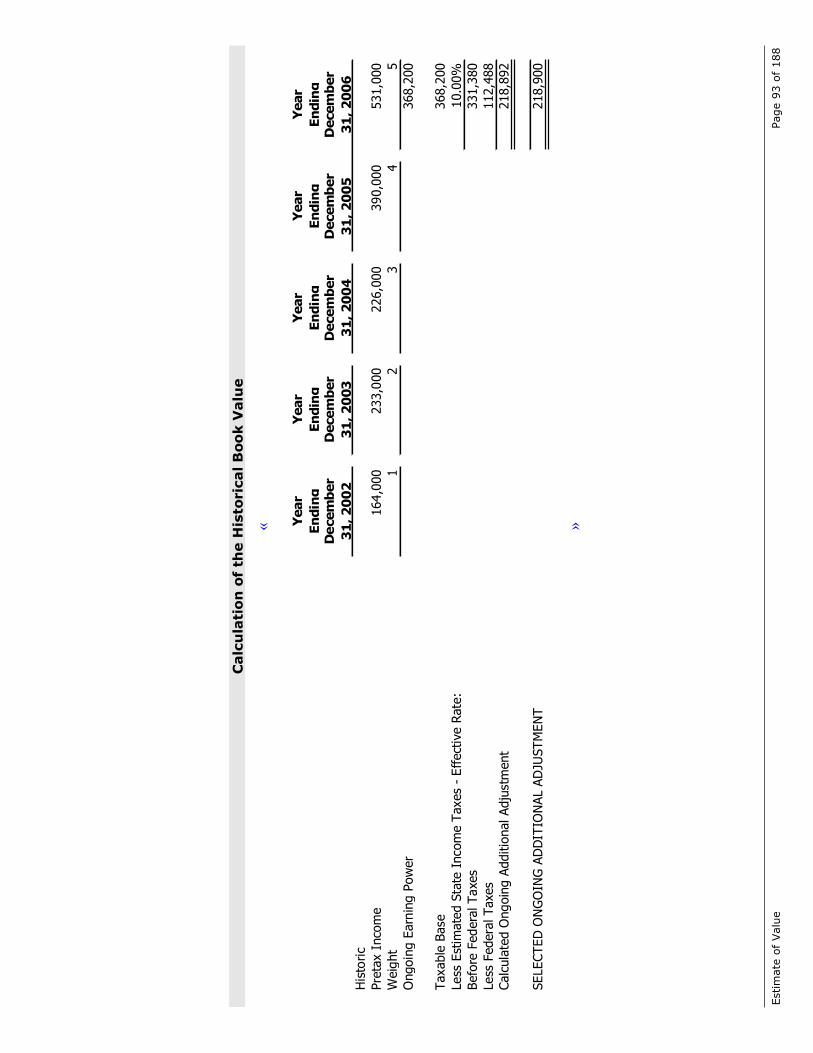
Estim
ate
of
Valu
ePage
93
of
188
Calc
ula
tio
nof
the
His
toric
alB
oo
kV
alu
e
« Year
En
din
g
Year
En
din
g
Year
En
din
g
Year
En
din
g
Year
En
din
gD
ecem
ber
31
,2
00
2
Decem
ber
31
,2
00
3
Decem
ber
31
,2
00
4
Decem
ber
31
,2
00
5
Decem
ber
31
,2
00
6H
isto
ric
Pre
tax
Inco
me
164,0
00
233,0
00
226,0
00
390,0
00
531,0
00
Weig
ht
12
34
5
Ongoin
g E
arn
ing
Pow
er
368,2
00
Taxable
Base
368,2
00
Less
Est
imate
dSta
teIn
com
eTaxes
-Effect
ive
Rate
:10.0
0%
Befo
reFedera
lTaxes
331,3
80
Less
Federa
l Taxes
112,4
88
Calc
ula
ted
Ongoin
gAdditio
nalAdju
stm
ent
218,8
92
SELECTED
ON
GO
ING
AD
DIT
ION
AL
AD
JUSTM
EN
T218,9
00
»

Estimate of Value Page 94 of 188
HELPER TEXT
Explain why and how the adjustments were made.
The weighting above was performed because
HELPER TEXT
Explain why and how the weightings were calculated and applied.
The book value was calculated as $«218,892» and the selected book value was roundedas $«218,900».
Estimate of Revenue
The analysis presented below represents the calculation of the revenue.

Estim
ate
of
Valu
ePage
95
of
188
Calc
ula
tio
nof
the
His
toric
alB
oo
kV
alu
e
«
Ye
ar
En
din
g
Ye
ar
En
din
g
Ye
ar
En
din
g
Ye
ar
En
din
g
Ye
ar
En
din
g
His
toric
De
ce
mb
er
31
,2
00
2
De
ce
mb
er
31
,2
00
3
De
ce
mb
er
31
,2
00
4
De
ce
mb
er
31
,2
00
5
De
ce
mb
er
31
,2
00
6Revenue
2,1
00,0
00
2,9
35,0
00
3,9
70,0
00
5,1
94,0
00
5,9
66,0
00
Weig
ht
On R
evenue
12
34
5
Ongoin
g R
evenue
4,6
99,0
67
SELECTED
ON
GO
ING
REVEN
UE
BASE
4,6
99,1
00
»

Estimate of Value Page 96 of 188
HELPER TEXT
Explain why and how the adjustments were made.
The weighting above was performed because
HELPER TEXT
Explain why and how the weightings were calculated and applied.
The book value was calculated as $«4,699,067» and the selected book value was roundedas $«4,699,100».
Estimate of Assets
The analysis presented below represents the calculation of the assets.

Estim
ate
of
Valu
ePage
97
of
188
Calc
ula
tio
nof
the
His
toric
alB
oo
kV
alu
e
«
Ye
ar
En
din
g
Ye
ar
En
din
g
Ye
ar
En
din
g
Ye
ar
En
din
g
Ye
ar
En
din
g
His
toric
De
ce
mb
er
31
,2
00
2
De
ce
mb
er
31
,2
00
3
De
ce
mb
er
31
,2
00
4
De
ce
mb
er
31
,2
00
5
De
ce
mb
er
31
,2
00
6Ass
ets
1,5
50,0
00
1,8
86,0
00
2,2
19,0
00
2,6
00,0
00
3,0
95,0
00
Weig
ht
On A
ssetBase
12
34
5
Ongoin
g A
sset
Base
2,5
23,6
00
SELECTED
ON
GO
ING
ASSET
BASE
2,5
23,6
00
»

Estimate of Value Page 98 of 188
HELPER TEXT
Explain why and how the adjustments were made.
The weighting above was performed because
HELPER TEXT
Explain why and how the weightings were calculated and applied.
The book value was calculated as $«2,523,600» and the selected book value was roundedas $«2,523,600».
Estimate of Book Value
The analysis presented below represents the calculation of the book value.

Estim
ate
of
Valu
ePage
99
of
188
Calc
ula
tio
nof
the
His
toric
alB
oo
kV
alu
e
«
Ye
ar
En
din
g
Ye
ar
En
din
g
Ye
ar
En
din
g
Ye
ar
En
din
g
Ye
ar
En
din
g
His
toric
De
ce
mb
er
31
,2
00
2
De
ce
mb
er
31
,2
00
3
De
ce
mb
er
31
,2
00
4
De
ce
mb
er
31
,2
00
5
De
ce
mb
er
31
,2
00
6Book V
alu
e615,0
00
705,0
00
905,0
00
1,1
25,0
00
1,4
45,0
00
Weig
ht
On
Book
Valu
e1
23
45
Ongoin
gBook V
alu
e1,0
97,6
67
SELECTED
ON
GO
ING
BO
OK V
ALU
EBASE
1,0
97,7
00
»

Estimate of Value Page 100 of 188
HELPER TEXT
Explain why and how the adjustments were made.
The weighting above was performed because
HELPER TEXT
Explain why and how the weightings were calculated and applied.
The book value was calculated as $«1,097,667» and the selected book value was roundedas $«1,097,700».
Application of Minority Interest Discount
HELPER TEXT
The Mid-Market Comps indicated value schedule is where the data is mapped from.
A minority interest discount is a reduction to the initial indicated value due to a lack ofcontrol prerogatives such as declaring dividends, liquidating the company, going public,issuing or buying stock, directing management, setting management’s salaries, etc. In«my» opinion, a minority interest discount of «37.30%» is appropriate because
HELPER TEXT
Explain why you applied a minority interest discount and how you arrived at theamount of the discount.
Application of Marketability Discount
HELPER TEXT
The Mid-Market Comps indicated value schedule is where the data is mapped from.
In «my» opinion, a discount of «35.00%» is required for lack of marketability. Thediscount reflects an expectation for the lack of a secondary market in which to negotiate aquick sale.
HELPER TEXT
Expand on other factors involved in the determination of the marketability discount.
Appendix E contains further information on the lack of a marketability discount.

Estimate of Value Page 101 of 188
Application of Excess or Non-Operating Assets
HELPER TEXT
These items are mapped from Pro’s Indicated Value Schedule.
Be aware that percentages of discounts and premiums may be applied to the excess
assets. If this is the case then explanatory text must be added.
Excess or Non-operating assets represent the value of resources the company has controlof but are not required to operate the business. Examples are excess cash on hand, realestate or other securities. In «my» judgment, excess and non-operating assets that need tobe added back and are part of the entity’s value total $«18,000».
HELPER TEXT
Explain why the assets are not required in the day to day activities of the businessand how the total value of those assets was determined.
Indicated Value Calculation
HELPER TEXT
In the following paragraph, if only one ratio was used, delete the first sentence. If
more than one ratio was used, you must explain how they were weighted.
Each of the market Mid-Market Comps ratios were weighted. The following schedulepresents the conclusions of value using the market data Mid-Market Comps ratio method.As calculated, the indicated «fair market value» of the $«743,008» is which has beenrounded to $«743,000».

Estim
ate
of
Valu
ePage
102
of
188
In
dic
ate
dV
alu
e C
alc
ula
tio
n
«
Ea
rnin
gs
Re
ve
nu
eA
sse
tB
oo
k V
alu
e
Mu
ltip
leM
ult
iple
Mu
ltip
leM
ult
iple
Base
218,9
00
4,6
99,1
00
2,5
23,6
00
1,0
97,7
00
Multip
le7.6
9x
0.3
3x
0.7
6x
1.7
9x
Subto
tal
1,6
82,2
47
1,5
50,7
03
1,9
17,9
36
1,9
64,8
83
Weig
ht
11
11
Ongoin
g V
alu
e1,7
78,9
42
Min
ority
Inte
rest
Dis
count
37.3
0%
Subto
tal
1,1
15,3
97
Mark
eta
bili
tyD
isco
unt
35.0
0%
Opera
ting V
alu
e725,0
08
Exce
ss/N
on-O
pera
ting A
ssets
18,0
00
»

Estimate of Value Page 103 of 188
Market Data Method – Public Guideline/Merged and Acquired
HELPER TEXT
The market approaches Market Data have the schedules that pertain to this method.To have the Market Data Method –Public and MnA appear as considered and used,
enter a 1 for its status on the Conclusions of Value schedule in Pro.
Guideline companies are companies that provide a reasonable basis for comparison to therelevant investment characteristics of a company being valued. Guideline companies aremost often publicly traded companies, although they may be private, in the same orsimilar business as the subject of this valuation. Guideline companies are used as a basisto develop valuation conclusions with respect to a subject company under thepresumption that a similar market exists for the subject company as exists for theguideline companies.
Ideal guideline companies should be in the same business as the company being valued.However, if there is insufficient transaction evidence in the same business, it may benecessary to consider companies with an underlying similarity of relevant investmentcharacteristics such as markets, products, growth, cyclical variability and other salientfactors.
The guideline company method uses a group of public companies and/or privately heldcompanies selected for their ability to provide valuation guidelines for the analyst. Themost commonly used version of the guideline company method develops a price/earningsratio with which to capitalize net income. By convention, analysts express therelationship between the market price of a stock and its historical book value in the formof a ratio of the market price of book value, i.e., price/book (P/B) ratio. If the publiccompany group is sufficiently homogeneous with respect to the companies selected, theirrecent performances, and the public market’s reaction to their performances, analyststypically calculate some form of average P/B ratio as representative of the group.
«I» searched for publicly traded guideline companies, for transactions involving publiclytraded guideline companies and merged and acquired companies. «I» researchedguideline companies by first identifying the industry in which «Child's Clothing Store»operates and, using the Standard Industrial Classification Code (SIC Codes) for theindustry, «I» performed a search for a group of companies in a similar line of business asthat of the subject company. «I» screened this group further through the use of key wordsand phrases that are unique to and describe the subject Company’s product or operationsand to eliminate those companies whose stock is very thinly traded. «I» also consideredother possible companies mentioned by management or discovered in other research. Inthe end, further analysis of the remaining companies in terms of operating, financial,geographical, industry, and/or market characteristics to insure that the guidelinecompanies are reasonable for inclusion in the guideline company group. The search

Estimate of Value Page 104 of 188
parameters used in determining whether or not a particular transaction was comparable tothe subject Company were ……..
The selected P/R ratio was «0.20». The selected P/E ratio was «7.00». The selected P/Aratio was «0.50». The selected P/B ratio was «0.25». The selected P/Cash Flow ratio was«4.00».
Estimate of Revenue
The analysis presented below represents the calculation of the revenue.

Estim
ate
of
Valu
ePage
105
of
188
Calc
ula
tio
nof
the
His
toric
alB
oo
kV
alu
e
«
Ye
ar
En
din
g
Ye
ar
En
din
g
Ye
ar
En
din
g
Ye
ar
En
din
g
Ye
ar
En
din
g
His
toric
De
ce
mb
er
31
,2
00
2
De
ce
mb
er
31
,2
00
3
De
ce
mb
er
31
,2
00
4
De
ce
mb
er
31
,2
00
5
De
ce
mb
er
31
,2
00
6Revenue
2,1
00,0
00
2,9
35,0
00
3,9
70,0
00
5,1
94,0
00
5,9
66,0
00
Weig
ht
On R
evenue
12
34
5
Ongoin
g R
evenue
4,6
99,0
67
SELECTED
ON
GO
ING
REVEN
UE
BASE
4,6
99,1
00
»

Estimate of Value Page 106 of 188
HELPER TEXT
Explain why and how the adjustments were made.
The weighting above was performed because
HELPER TEXT
Explain why and how the weightings were calculated and applied.
The revenue base value was calculated as $«4,699,067» and the selected book value wasrounded as $«4,699,100».
Estimate of Net Earnings
The analysis presented below represents the calculation of the Net Earnings.

Estim
ate
of
Valu
ePage
107
of
188
Calc
ula
tio
nof
the
His
toric
alB
oo
kV
alu
e
« Year
En
din
g
Year
En
din
g
Year
En
din
g
Year
En
din
g
Year
En
din
gD
ecem
ber
31
,2
00
2
Decem
ber
31
,2
00
3
Decem
ber
31
,2
00
4
Decem
ber
31
,2
00
5
Decem
ber
31
,2
00
6H
isto
ric
Pre
tax
Inco
me
164,0
00
233,0
00
226,0
00
390,0
00
531,0
00
Weig
ht
12
34
5
Ongoin
g E
arn
ing
Pow
er
368,2
00
Taxable
Base
368,2
00
Less
Est
imate
dSta
teIn
com
eTaxes
-Effect
ive
Rate
:10.0
0%
Befo
reFedera
lTaxes
331,3
80
Less
Federa
l Taxes
112,4
88
Calc
ula
ted
Ongoin
gAdditio
nalAdju
stm
ent
218,8
92
SELECTED
ON
GO
ING
AD
DIT
ION
AL
AD
JUSTM
EN
T218,9
00
»

Estimate of Value Page 108 of 188
HELPER TEXT
Explain why and how the adjustments were made.
The weighting above was performed because
HELPER TEXT
Explain why and how the weightings were calculated and applied.
The earnings base was calculated as $«218,892» and the selected book value wasrounded as $«218,900».
Estimate of Assets
The analysis presented below represents the calculation of the assets.

Estim
ate
of
Valu
ePage
109
of
188
Calc
ula
tio
nof
the
His
toric
alB
oo
kV
alu
e
«
Ye
ar
En
din
g
Ye
ar
En
din
g
Ye
ar
En
din
g
Ye
ar
En
din
g
Ye
ar
En
din
g
His
toric
De
ce
mb
er
31
,2
00
2
De
ce
mb
er
31
,2
00
3
De
ce
mb
er
31
,2
00
4
De
ce
mb
er
31
,2
00
5
De
ce
mb
er
31
,2
00
6Ass
ets
1,5
50,0
00
1,8
86,0
00
2,2
19,0
00
2,6
00,0
00
3,0
95,0
00
Weig
ht
On A
ssetBase
12
34
5
Ongoin
g A
sset
Base
2,5
23,6
00
SELECTED
ON
GO
ING
ASSET
BASE
2,5
23,6
00
»

Estimate of Value Page 110 of 188
HELPER TEXT
Explain why and how the adjustments were made.
The weighting above was performed because
HELPER TEXT
Explain why and how the weightings were calculated and applied.
The asset base was calculated as $«2,523,600» and the selected asset base was rounded as$«2,523,600».
Estimate of Book Value
The analysis presented below represents the calculation of the book value.

Estim
ate
of
Valu
ePage
111
of
188
Calc
ula
tio
nof
the
His
toric
alB
oo
kV
alu
e
«
Ye
ar
En
din
g
Ye
ar
En
din
g
Ye
ar
En
din
g
Ye
ar
En
din
g
Ye
ar
En
din
g
His
toric
De
ce
mb
er
31
,2
00
2
De
ce
mb
er
31
,2
00
3
De
ce
mb
er
31
,2
00
4
De
ce
mb
er
31
,2
00
5
De
ce
mb
er
31
,2
00
6Book V
alu
e615,0
00
705,0
00
905,0
00
1,1
25,0
00
1,4
45,0
00
Weig
ht
On
Book
Valu
e1
23
45
Ongoin
gBook V
alu
e1,0
97,6
67
SELECTED
ON
GO
ING
BO
OK V
ALU
EBASE
1,0
97,7
00
»

Estimate of Value Page 112 of 188
HELPER TEXT
Explain why and how the adjustments were made.
The weighting above was performed because
HELPER TEXT
Explain why and how the weightings were calculated and applied.
The book value was calculated as $«1,097,667» and the selected book value was roundedas $«1,097,700».
Estimate of Cash Flow
The analysis presented below represents the calculation of the cash flow base.

Estim
ate
of
Valu
ePage
113
of
188
Calc
ula
tio
nof
the
His
toric
alB
oo
kV
alu
e
«
Ye
ar
En
din
g
Ye
ar
En
din
g
Ye
ar
En
din
g
Ye
ar
En
din
g
Ye
ar
En
din
g
His
toric
De
ce
mb
er
31
,2
00
2
De
ce
mb
er
31
,2
00
3
De
ce
mb
er
31
,2
00
4
De
ce
mb
er
31
,2
00
5
De
ce
mb
er
31
,2
00
6Aft
er
Tax
Inco
me
113,0
00
174,0
00
160,0
00
250,0
00
345,0
00
Depre
ciation a
nd
Am
ort
ization
50,0
00
66,0
00
90,0
00
156,0
00
180,0
00
Oth
er
Non-C
ash
Expense
s0
00
00
Tota
l163,0
00
240,0
00
250,0
00
406,0
00
525,0
00
Weig
ht
On
Cash
Flo
wBase
12
34
5
Ongoin
gCash
Flo
wBase
376,1
33
SELECTED
ON
GO
ING
CASH
FLO
WBASE
376,1
00
»

Estimate of Value Page 114 of 188
HELPER TEXT
Explain why and how the adjustments were made.
The weighting above was performed because
HELPER TEXT
Explain why and how the weightings were calculated and applied.
The cash flow base was calculated as $«376,133» and the selected cash flow base wasrounded as $«376,100».
Application of Minority Interest Discount
HELPER TEXT
The data is mapped from the public and MnA indicated value schedule.
A minority interest discount is a reduction to the initial indicated value due to a lack ofcontrol prerogatives such as declaring dividends, liquidating the company, going public,issuing or buying stock, directing management, setting management’s salaries, etc. In«my» opinion, a minority interest discount of «37.30%» is appropriate because
HELPER TEXT
Explain why you applied a minority interest discount and how you arrived at theamount of the discount.
Application of Marketability Discount
HELPER TEXT
The data is mapped from, the public and MnA indicated value schedule.
In «my» opinion, a discount of «35.00%» is required for lack of marketability. Thediscount reflects an expectation for the lack of a secondary market in which to negotiate aquick sale.
HELPER TEXT
Expand on other factors involved in the determination of the marketability discount.
Appendix E contains further information on the lack of a marketability discount.

Estimate of Value Page 115 of 188
Application of Excess or Non-Operating Assets
HELPER TEXT
These items are mapped from Pro’s Indicated Value Schedule.
Be aware that percentages of discounts and premiums may be applied to the excess
assets. If this is the case then explanatory text must be added.
Excess or Non-operating assets represent the value of resources the company has controlof but are not required to operate the business. Examples are excess cash on hand, realestate or other securities. In «my» judgment, excess and non-operating assets that need tobe added back and are part of the entity’s value total $«18,000».
HELPER TEXT
Explain why the assets are not required in the day to day activities of the businessand how the total value of those assets was determined.
Indicated Value Calculation
HELPER TEXT
In the following paragraph, if only one ratio was used, delete the first sentence. If
more than one ratio was used, you must explain how they were weighted.
Each of the market Public and MnA ratios were weighted. The following schedulepresents the conclusions of value using the market data Public and MnA ratio method. Ascalculated, the indicated «fair market value» of the $«392,453» is which has beenrounded to $«392,500».

Estim
ate
of
Valu
ePage
116
of
188
In
dic
ate
dV
alu
e C
alc
ula
tio
n
«
Re
ve
nu
eE
arn
ing
sA
sse
tB
oo
k V
alu
eC
ash
Flo
wE
BIT
DA
Mu
ltip
leM
ult
iple
Mu
ltip
leM
ult
iple
Mu
ltip
leM
ult
iple
Base
4,6
99,1
00
218,9
00
2,5
23,6
00
1,0
97,7
00
376,1
00
0
Multip
le0.2
0x
7.0
0x
0.5
0x
0.2
5x
4.0
0x
8.0
0x
Subto
tal
939,8
20
1,5
32,3
00
1,2
61,8
00
274,4
25
1,5
04,4
00
0
Weig
ht
11
11
11
Ongoin
gValu
e918,7
91
Min
ority
Inte
rest
Dis
count
37.3
0%
Subto
tal
576,0
82
Mark
eta
bili
tyD
isco
unt
35.0
0%
Opera
ting
Valu
e374,4
53
Exce
ss/N
on-O
pera
ting
Ass
ets
18,0
00
Indic
ate
d E
quity
Valu
e392,4
53
SELECTED
EQ
UIT
YVALU
E392,5
00
»

Estimate of Value Page 117 of 188
Market Data Method – Private Company
HELPER TEXT
The market approaches Market Data have the schedules that pertain to this method.
To have the Market Data Method – Private Company appear as considered and used,enter a 1 for its status on the Conclusions of Value schedule in Pro.
Guideline companies are companies that provide a reasonable basis for comparison to therelevant investment characteristics of a company being valued. Guideline companies aremost often publicly traded companies, although they may be private, in the same orsimilar business as the subject of this valuation. Guideline companies are used as a basisto develop valuation conclusions with respect to a subject company under thepresumption that a similar market exists for the subject company as exists for theguideline companies.
Ideal guideline companies should be in the same business as the company being valued.However, if there is insufficient transaction evidence in the same business, it may benecessary to consider companies with an underlying similarity of relevant investmentcharacteristics such as markets, products, growth, cyclical variability and other salientfactors.
This guideline company method uses a group privately held companies selected for theirability to provide valuation guidelines for the analyst. The most commonly used versionof the guideline company method develops a price/earnings ratio with which to capitalizenet income. If the public company group is sufficiently homogeneous with respect to thecompanies selected, their recent performances, and the public market’s reaction to theirperformances, analysts typically calculate some form of average ratio as representative ofthe group.
«I» searched for privately held guideline companies, for transactions. «I» researchedguideline companies by first identifying the industry in which «Child's Clothing Store»operates and, using the Standard Industrial Classification Code (SIC Codes) for theindustry, «I» performed a search for a group of companies in a similar line of business asthat of the subject company. «I» screened this group further through the use of key wordsand phrases that are unique to and describe the subject Company’s product or operationsand to eliminate those companies whose stock is very thinly traded. «I» also consideredother possible companies mentioned by management or discovered in other research. Inthe end, further analysis of the remaining companies in terms of operating, financial,geographical, industry, and/or market characteristics to insure that the guidelinecompanies are reasonable for inclusion in the guideline company group. The searchparameters used in determining whether or not a particular transaction was comparable tothe subject Company were ……..

Estimate of Value Page 118 of 188
The selected P/R ratio was «0.24». The selected P/E ratio was «7.00». The selected P/Aratio was «0.40». The selected P/B ratio was «0.20». The selected P/Cash Flow ratio was«5.00».
Estimate of Revenue
The analysis presented below represents the calculation of the revenue.

Estim
ate
of
Valu
ePage
119
of
188
Calc
ula
tio
nof
the
His
toric
alB
oo
kV
alu
e
«
Ye
ar
En
din
g
Ye
ar
En
din
g
Ye
ar
En
din
g
Ye
ar
En
din
g
Ye
ar
En
din
g
His
toric
De
ce
mb
er
31
,2
00
2
De
ce
mb
er
31
,2
00
3
De
ce
mb
er
31
,2
00
4
De
ce
mb
er
31
,2
00
5
De
ce
mb
er
31
,2
00
6Revenue
2,1
00,0
00
2,9
35,0
00
3,9
70,0
00
5,1
94,0
00
5,9
66,0
00
Weig
ht
On R
evenue
12
34
5
Ongoin
g R
evenue
4,6
99,0
67
SELECTED
ON
GO
ING
REVEN
UE
BASE
4,6
99,1
00
»

Estimate of Value Page 120 of 188
HELPER TEXT
Explain why and how the adjustments were made.
The weighting above was performed because
HELPER TEXT
Explain why and how the weightings were calculated and applied.
The revenue base value was calculated as $«4,699,067» and the selected book value wasrounded as $«4,699,100».
Estimate of Net Earnings
The analysis presented below represents the calculation of the Net Earnings.

Estim
ate
of
Valu
ePage
121
of
188
Calc
ula
tio
nof
the
Net
Earn
ing
s
« Year
En
din
g
Year
En
din
g
Year
En
din
g
Year
En
din
g
Year
En
din
gD
ecem
ber
31
,2
00
2
Decem
ber
31
,2
00
3
Decem
ber
31
,2
00
4
Decem
ber
31
,2
00
5
Decem
ber
31
,2
00
6H
isto
ric
Pre
tax
Inco
me
164,0
00
233,0
00
226,0
00
390,0
00
531,0
00
Weig
ht
12
34
5
Ongoin
g E
arn
ing
Pow
er
368,2
00
Taxable
Base
368,2
00
Less
Est
imate
dSta
teIn
com
eTaxes
-Effect
ive
Rate
:10.0
0%
Befo
reFedera
lTaxes
331,3
80
Less
Federa
l Taxes
112,4
88
Calc
ula
ted
Ongoin
gAdditio
nalAdju
stm
ent
218,8
92
SELECTED
ON
GO
ING
AD
DIT
ION
AL
AD
JUSTM
EN
T218,9
00
»
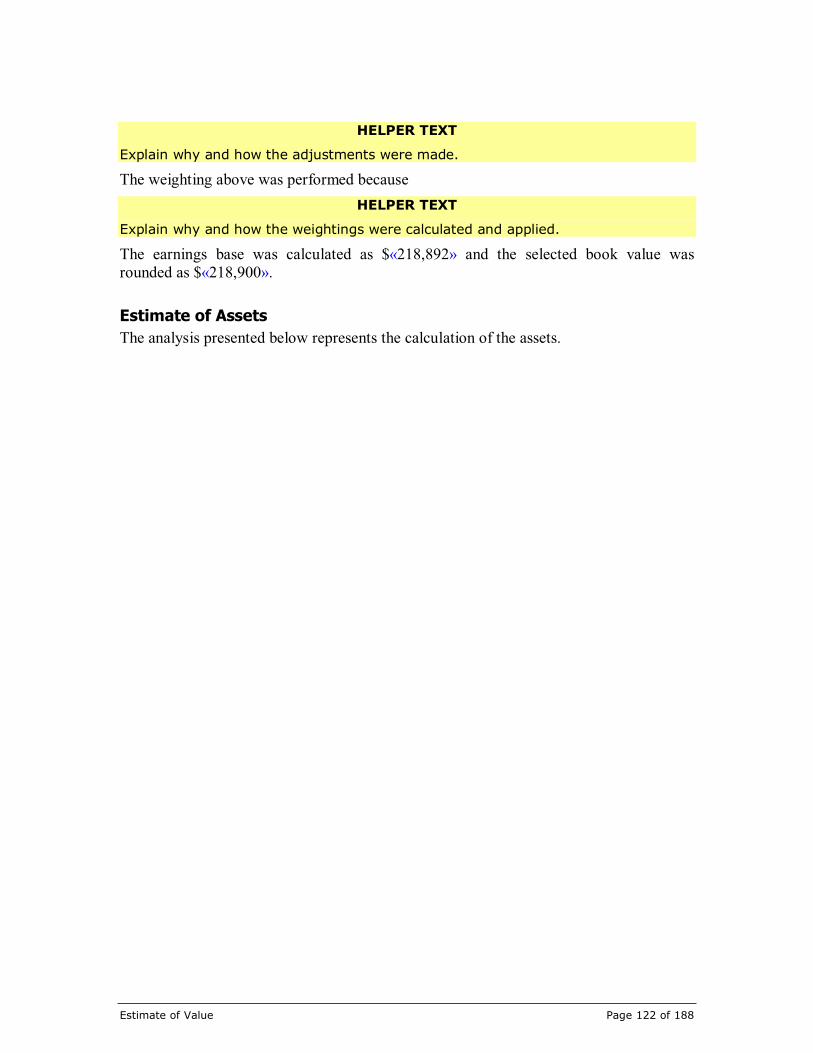
Estimate of Value Page 122 of 188
HELPER TEXT
Explain why and how the adjustments were made.
The weighting above was performed because
HELPER TEXT
Explain why and how the weightings were calculated and applied.
The earnings base was calculated as $«218,892» and the selected book value wasrounded as $«218,900».
Estimate of Assets
The analysis presented below represents the calculation of the assets.

Estim
ate
of
Valu
ePage
123
of
188
Calc
ula
tio
nof
the
Asset
Base
«
Ye
ar
En
din
g
Ye
ar
En
din
g
Ye
ar
En
din
g
Ye
ar
En
din
g
Ye
ar
En
din
g
His
toric
De
ce
mb
er
31
,2
00
2
De
ce
mb
er
31
,2
00
3
De
ce
mb
er
31
,2
00
4
De
ce
mb
er
31
,2
00
5
De
ce
mb
er
31
,2
00
6Ass
ets
1,5
50,0
00
1,8
86,0
00
2,2
19,0
00
2,6
00,0
00
3,0
95,0
00
Weig
ht
On A
ssetBase
12
34
5
Ongoin
g A
sset
Base
2,5
23,6
00
SELECTED
ON
GO
ING
ASSET
BASE
2,5
23,6
00
»

Estimate of Value Page 124 of 188
HELPER TEXT
Explain why and how the adjustments were made.
The weighting above was performed because
HELPER TEXT
Explain why and how the weightings were calculated and applied.
The asset base was calculated as $«2,523,600» and the selected asset base was rounded as$«2,523,600».
Estimate of Book Value
The analysis presented below represents the calculation of the book value.
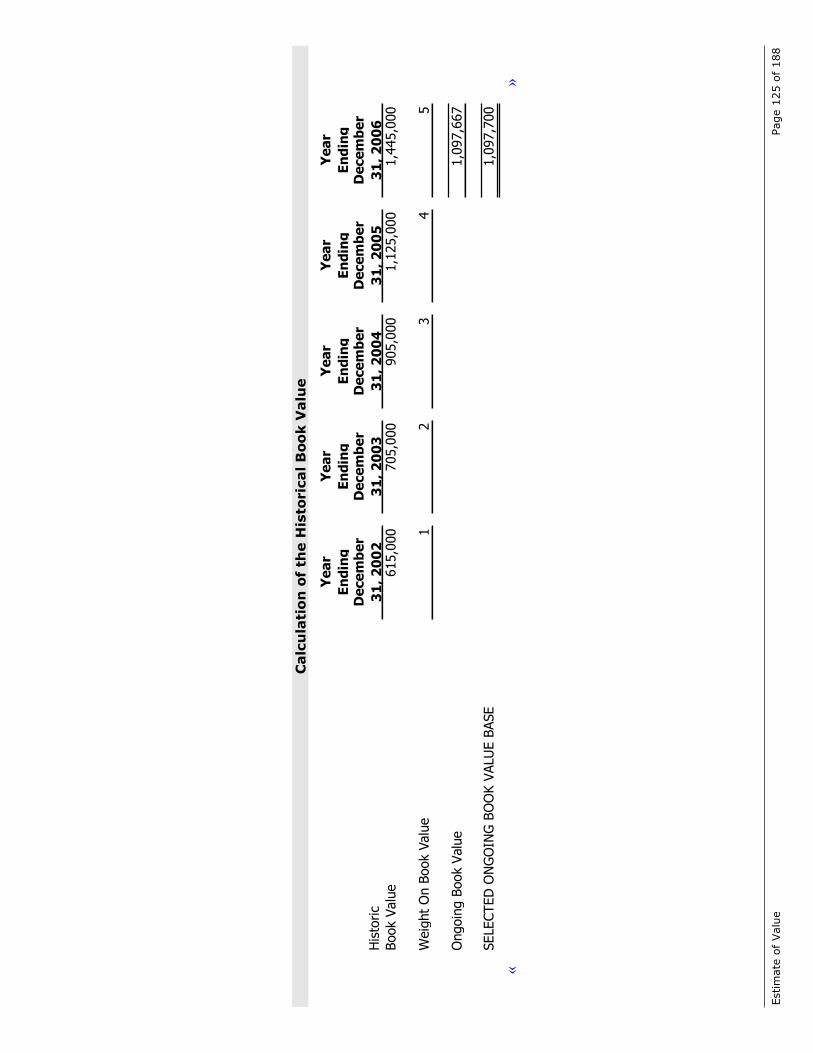
Estim
ate
of
Valu
ePage
125
of
188
Calc
ula
tio
nof
the
His
toric
alB
oo
kV
alu
e
«
Ye
ar
En
din
g
Ye
ar
En
din
g
Ye
ar
En
din
g
Ye
ar
En
din
g
Ye
ar
En
din
g
His
toric
De
ce
mb
er
31
,2
00
2
De
ce
mb
er
31
,2
00
3
De
ce
mb
er
31
,2
00
4
De
ce
mb
er
31
,2
00
5
De
ce
mb
er
31
,2
00
6Book V
alu
e615,0
00
705,0
00
905,0
00
1,1
25,0
00
1,4
45,0
00
Weig
ht
On
Book
Valu
e1
23
45
Ongoin
gBook V
alu
e1,0
97,6
67
SELECTED
ON
GO
ING
BO
OK V
ALU
EBASE
1,0
97,7
00
»

Estimate of Value Page 126 of 188
HELPER TEXT
Explain why and how the adjustments were made.
The weighting above was performed because
HELPER TEXT
Explain why and how the weightings were calculated and applied.
The book value was calculated as $«1,097,667» and the selected book value was roundedas $«1,097,700».
Estimate of Cash Flow
The analysis presented below represents the calculation of the cash flow base.

Estim
ate
of
Valu
ePage
127
of
188
Calc
ula
tio
nof
the C
ash
Flo
w
«
Ye
ar
En
din
g
Ye
ar
En
din
g
Ye
ar
En
din
g
Ye
ar
En
din
g
Ye
ar
En
din
g
His
toric
De
ce
mb
er
31
,2
00
2
De
ce
mb
er
31
,2
00
3
De
ce
mb
er
31
,2
00
4
De
ce
mb
er
31
,2
00
5
De
ce
mb
er
31
,2
00
6Aft
er
Tax
Inco
me
113,0
00
174,0
00
160,0
00
250,0
00
345,0
00
Depre
ciation a
nd
Am
ort
ization
50,0
00
66,0
00
90,0
00
156,0
00
180,0
00
Oth
er
Non-C
ash
Expense
s0
00
00
Tota
l163,0
00
240,0
00
250,0
00
406,0
00
525,0
00
Weig
ht
On
Cash
Flo
wBase
12
34
5
Ongoin
gCash
Flo
wBase
376,1
33
SELECTED
ON
GO
ING
CASH
FLO
WBASE
376,1
00
»

Estimate of Value Page 128 of 188
HELPER TEXT
Explain why and how the adjustments were made.
The weighting above was performed because
HELPER TEXT
Explain why and how the weightings were calculated and applied.
The cash flow base was calculated as $«376,133» and the selected cash flow base wasrounded as $«376,100».
Application of Minority Interest Discount
HELPER TEXT
The Private Company indicated value schedule is where the data is mapped from.
A minority interest discount is a reduction to the initial indicated value due to a lack ofcontrol prerogatives such as declaring dividends, liquidating the company, going public,issuing or buying stock, directing management, setting management’s salaries, etc. In«my» opinion, a minority interest discount of «37.30%» is appropriate because
HELPER TEXT
Explain why you applied a minority interest discount and how you arrived at theamount of the discount.
Application of Marketability Discount
HELPER TEXT
The Private Company indicated value schedule is where the data is mapped from.
In «my» opinion, a discount of «35.00%» is required for lack of marketability. Thediscount reflects an expectation for the lack of a secondary market in which to negotiate aquick sale.
HELPER TEXT
Expand on other factors involved in the determination of the marketability discount.
Appendix E contains further information on the lack of a marketability discount.
Estimate of Value Page 129 of 188
Application of Excess or Non-Operating Assets
HELPER TEXT
These items are mapped from Pro’s Indicated Value Schedule.
Be aware that percentages of discounts and premiums may be applied to the excess
assets. If this is the case then explanatory text must be added.
Excess or Non-operating assets represent the value of resources the company has controlof but are not required to operate the business. Examples are excess cash on hand, realestate or other securities. In «my» judgment, excess and non-operating assets that need tobe added back and are part of the entity’s value total $«18,000».
HELPER TEXT
Explain why the assets are not required in the day to day activities of the businessand how the total value of those assets was determined.
Indicated Value Calculation
HELPER TEXT
In the following paragraph, if only one ratio was used, delete the first sentence. If
more than one ratio was used, you must explain how they were weighted.
Each of the market Private Company ratios were weighted. The following schedulepresents the conclusions of value using the market data Private Company ratio method.As calculated, the indicated «fair market value» of the $«583,478» is which has beenrounded to $«583,500».
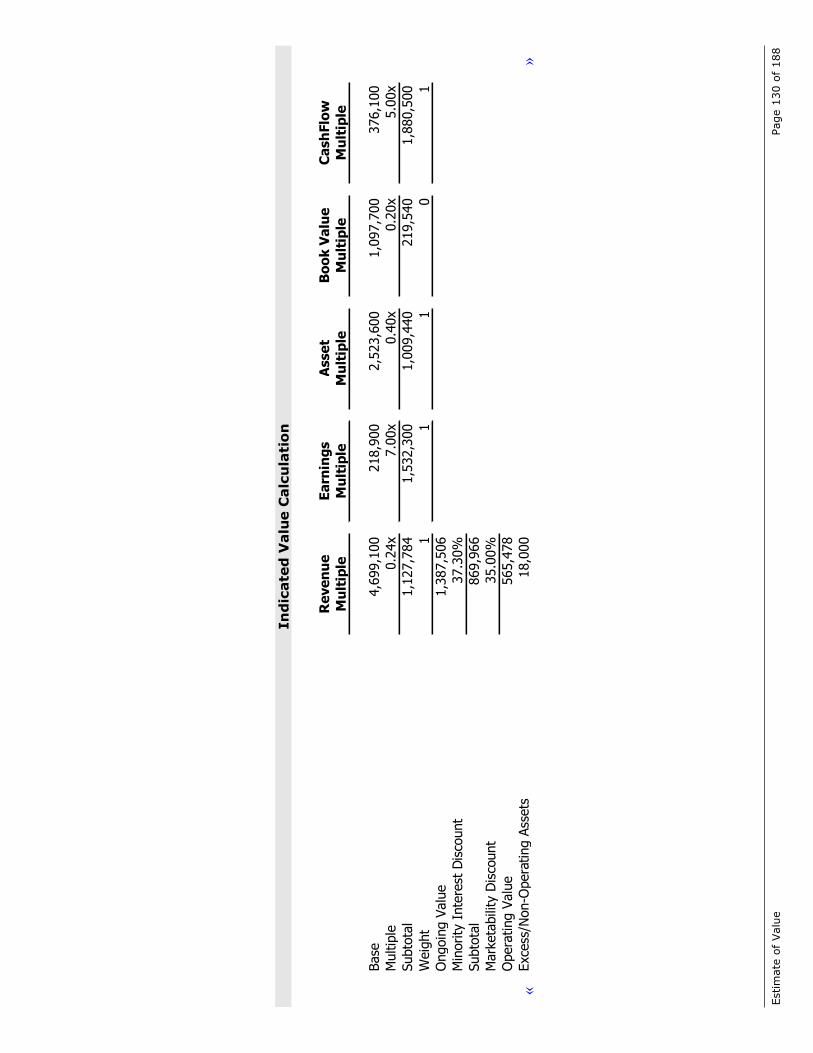
Estim
ate
of
Valu
ePage
130
of
188
In
dic
ate
dV
alu
e C
alc
ula
tio
n
«
Re
ve
nu
eE
arn
ing
sA
sse
tB
oo
k V
alu
eC
ash
Flo
w
Mu
ltip
leM
ult
iple
Mu
ltip
leM
ult
iple
Mu
ltip
le
Base
4,6
99,1
00
218,9
00
2,5
23,6
00
1,0
97,7
00
376,1
00
Multip
le0.2
4x
7.0
0x
0.4
0x
0.2
0x
5.0
0x
Subto
tal
1,1
27,7
84
1,5
32,3
00
1,0
09,4
40
219,5
40
1,8
80,5
00
Weig
ht
11
10
1
Ongoin
g V
alu
e1,3
87,5
06
Min
ority
Inte
rest
Dis
count
37.3
0%
Subto
tal
869,9
66
Mark
eta
bili
tyD
isco
unt
35.0
0%
Opera
ting V
alu
e565,4
78
Exce
ss/N
on-O
pera
ting A
ssets
18,0
00
»
Estimate of Value Page 131 of 188
Market Data Method – Analyst
HELPER TEXT
The market approaches Market Data have the schedules that pertain to this method.
To have the Market Data Method – Analyst appear as considered and used, enter a 1 for its status on the Conclusions of Value schedule in Pro.
Guideline companies are companies that provide a reasonable basis for comparison to therelevant investment characteristics of a company being valued. Guideline companies aremost often publicly traded companies, although they may be private, in the same orsimilar business as the subject of this valuation. Guideline companies are used as a basisto develop valuation conclusions with respect to a subject company under thepresumption that a similar market exists for the subject company as exists for theguideline companies.
Ideal guideline companies should be in the same business as the company being valued.However, if there is insufficient transaction evidence in the same business, it may benecessary to consider companies with an underlying similarity of relevant investmentcharacteristics such as markets, products, growth, cyclical variability and other salientfactors.
The guideline company method uses a group of public companies and/or privately heldcompanies selected for their ability to provide valuation guidelines for the analyst. Themost commonly used version of the guideline company method develops a price/earningsratio with which to capitalize net income. By convention, analysts express therelationship between the market price of a stock and its historical book value in the formof a ratio of the market price of book value, i.e., price/book (P/B) ratio. If the publiccompany group is sufficiently homogeneous with respect to the companies selected, theirrecent performances, and the public market’s reaction to their performances, analyststypically calculate some form of average P/B ratio as representative of the group.
«I» searched for publicly traded guideline companies, for transactions involving publiclytraded guideline companies and merged and acquired companies. «I» researchedguideline companies by first identifying the industry in which «Child's Clothing Store»operates and, using the Standard Industrial Classification Code (SIC Codes) for theindustry, «I» performed a search for a group of companies in a similar line of business asthat of the subject company. «I» screened this group further through the use of key wordsand phrases that are unique to and describe the subject Company’s product or operationsand to eliminate those companies whose stock is very thinly traded. «I» also consideredother possible companies mentioned by management or discovered in other research. Inthe end, further analysis of the remaining companies in terms of operating, financial,geographical, industry, and/or market characteristics to insure that the guideline

Estimate of Value Page 132 of 188
companies are reasonable for inclusion in the guideline company group. The searchparameters used in determining whether or not a particular transaction was comparable tothe subject Company were ……..
The selected P/R ratio was «0.15». The selected P/E ratio was «8.24». The selected P/Aratio was «0.42». The selected P/B ratio was «0.26». The selected P/Cash Flow ratio was«9.00». The selected P/EBIT ratio was «5.00». The selected P/EBITDA ratio was «8.00».
HELPER TEXT
The data source is the Analyst Guideline Company Schedule and an option to use thefundamental adjustment is selected. A subschedule has some data on it.
Adjustment to the Base Capitalization Factors (FundamentalAdjustment)
In «my» opinion, there are certain fundamental differences between the Company and thepublic companies in the group. The necessity for and appropriateness of fundamentaladjustments is often overlooked by valuation analysts. A discussion in a book aboutvaluing banks (Valuing Financial Institutions by Z. Christopher Mercer), which is equallyapplicable to the valuation of other companies, makes the point quite clearly:
As with the valuation of other commercial enterprises using public comparable groups, itis necessary to make fundamental adjustments to market derived base capitalization ratesin order to make a proper appraisal of the subject bank.
Fundamental adjustments are often necessary when valuing private businesses inrelationship to groups of publicly traded guideline companies. These adjustments arenecessary to account for basic differences between the valuation subject and the selectedgroup of guideline companies. Fundamental adjustments can give negative (discounts) orpositive (premiums) in relationship to the base guideline company multiples.
Several factors give rise to the need for fundamental adjustments, including:
1. Size. Public guideline companies are generally larger than the private companies mostappraisers value;
2. Growth. Compared to public guideline companies, privately held companies’ growthopportunities are relatively limited by their capital structure;
3. Access to Capital Markets. The ability to access the public capital markets to facilitatefuture growth is an often overlooked difference between public and private companies.Even for private companies of sufficient size and earning power to be attractive as publiccandidates, the markets typically discount their share prices in relationship to similar,existing public companies in the form of an IPO discount;
4. Financial/Operating Strength. Public companies tend to be better capitalized, havebroader management and more depth of management;

Estimate of Value Page 133 of 188
5. Key executive dependency. Often, a privately held company’s success is dependentupon a few (or one) key executives as opposed to the management depth of a typicalpublic company.
Based upon the above factors, it is «my» opinion that a fundamental discount ofapproximately «48.55%» should be applied to the base net earnings capitalization factorcalculated using publicly traded guideline companies.
The magnitude of this fundamental discount is confirmed by an analysis using the CapitalAsset Pricing Model. The CAPM derives an estimated base capitalization multiple (P/E)of «48.55%». The base P/E multiple of the guideline company group, when substitutedinto the CAPM model, suggests an expectation for future growth of «5.00%». «I»consider the long term internal growth potential for the Company to be about «5.00%»per year. The analysis clearly affirms the appropriateness of the fundamental discountdeveloped above.
After applying a fundamental discount of «48.55%» to the base guideline company P/Eof «8.24», «I» develop an adjusted guideline company capitalization factor of «4.24».
Estimate of Revenue
The analysis presented below represents the calculation of the revenue.

Estim
ate
of
Valu
ePage
134
of
188
Calc
ula
tio
nof
the
Reven
ue
Base
«
Ye
ar
En
din
g
Ye
ar
En
din
g
Ye
ar
En
din
g
Ye
ar
En
din
g
Ye
ar
En
din
g
His
toric
De
ce
mb
er
31
,2
00
2
De
ce
mb
er
31
,2
00
3
De
ce
mb
er
31
,2
00
4
De
ce
mb
er
31
,2
00
5
De
ce
mb
er
31
,2
00
6Revenue
2,1
00,0
00
2,9
35,0
00
3,9
70,0
00
5,1
94,0
00
5,9
66,0
00
Weig
ht
On R
evenue
12
34
5
Ongoin
g R
evenue
4,6
99,0
67
SELECTED
ON
GO
ING
REVEN
UE
BASE
4,6
99,1
00
»

Estimate of Value Page 135 of 188
HELPER TEXT
Explain why and how the adjustments were made.
The weighting above was performed because
HELPER TEXT
Explain why and how the weightings were calculated and applied.
The revenue base value was calculated as $«4,699,067» and the selected book value wasrounded as $«4,699,100».
Estimate of Net Earnings
The analysis presented below represents the calculation of the Net Earnings.

Estim
ate
of
Valu
ePage
136
of
188
Calc
ula
tio
nof
the
Earn
ing
sB
ase
« Year
En
din
g
Year
En
din
g
Year
En
din
g
Year
En
din
g
Year
En
din
gD
ecem
ber
31
,2
00
2
Decem
ber
31
,2
00
3
Decem
ber
31
,2
00
4
Decem
ber
31
,2
00
5
Decem
ber
31
,2
00
6H
isto
ric
Pre
tax
Inco
me
164,0
00
233,0
00
226,0
00
390,0
00
531,0
00
Weig
ht
12
34
5
Ongoin
g E
arn
ing
Pow
er
368,2
00
Taxable
Base
368,2
00
Less
Est
imate
dSta
teIn
com
eTaxes
-Effect
ive
Rate
:10.0
0%
Befo
reFedera
lTaxes
331,3
80
Less
Federa
l Taxes
112,4
88
Calc
ula
ted
Ongoin
gAdditio
nalAdju
stm
ent
218,8
92
SELECTED
ON
GO
ING
AD
DIT
ION
AL
AD
JUSTM
EN
T218,9
00
»

Estimate of Value Page 137 of 188
HELPER TEXT
Explain why and how the adjustments were made.
The weighting above was performed because
HELPER TEXT
Explain why and how the weightings were calculated and applied.
The earnings base was calculated as $«218,892» and the selected book value wasrounded as $«218,900».
Estimate of Assets
The analysis presented below represents the calculation of the assets.

Estim
ate
of
Valu
ePage
138
of
188
Calc
ula
tio
nof
the
Asset
Base
«
Ye
ar
En
din
g
Ye
ar
En
din
g
Ye
ar
En
din
g
Ye
ar
En
din
g
Ye
ar
En
din
g
His
toric
De
ce
mb
er
31
,2
00
2
De
ce
mb
er
31
,2
00
3
De
ce
mb
er
31
,2
00
4
De
ce
mb
er
31
,2
00
5
De
ce
mb
er
31
,2
00
6Ass
ets
1,5
50,0
00
1,8
86,0
00
2,2
19,0
00
2,6
00,0
00
3,0
95,0
00
Weig
ht
On A
ssetBase
12
34
5
Ongoin
g A
sset
Base
2,5
23,6
00
SELECTED
ON
GO
ING
ASSET
BASE
2,5
23,6
00
»

Estimate of Value Page 139 of 188
HELPER TEXT
Explain why and how the adjustments were made.
The weighting above was performed because
HELPER TEXT
Explain why and how the weightings were calculated and applied.
The asset base was calculated as $«2,523,600» and the selected asset base was rounded as$«2,523,600».
Estimate of Book Value
The analysis presented below represents the calculation of the book value.

Estim
ate
of
Valu
ePage
140
of
188
Calc
ula
tio
nof
the
Boo
kV
alu
eB
ase
«
Ye
ar
En
din
g
Ye
ar
En
din
g
Ye
ar
En
din
g
Ye
ar
En
din
g
Ye
ar
En
din
g
His
toric
De
ce
mb
er
31
,2
00
2
De
ce
mb
er
31
,2
00
3
De
ce
mb
er
31
,2
00
4
De
ce
mb
er
31
,2
00
5
De
ce
mb
er
31
,2
00
6Book V
alu
e615,0
00
705,0
00
905,0
00
1,1
25,0
00
1,4
45,0
00
Weig
ht
On
Book
Valu
e1
23
45
Ongoin
gBook V
alu
e1,0
97,6
67
SELECTED
ON
GO
ING
BO
OK V
ALU
EBASE
1,0
97,7
00
»
Estimate of Value Page 141 of 188
HELPER TEXT
Explain why and how the adjustments were made.
The weighting above was performed because
HELPER TEXT
Explain why and how the weightings were calculated and applied.
The book value was calculated as $«1,097,667» and the selected book value was roundedas $«1,097,700».
Estimate of Cash Flow
The analysis presented below represents the calculation of the cash flow base.

Estim
ate
of
Valu
ePage
142
of
188
Calc
ula
tio
nof
the C
ash
Flo
wB
ase
«
Ye
ar
En
din
g
Ye
ar
En
din
g
Ye
ar
En
din
g
Ye
ar
En
din
g
Ye
ar
En
din
g
His
toric
De
ce
mb
er
31
,2
00
2
De
ce
mb
er
31
,2
00
3
De
ce
mb
er
31
,2
00
4
De
ce
mb
er
31
,2
00
5
De
ce
mb
er
31
,2
00
6Aft
er
Tax
Inco
me
113,0
00
174,0
00
160,0
00
250,0
00
345,0
00
Depre
ciation a
nd
Am
ort
ization
50,0
00
66,0
00
90,0
00
156,0
00
180,0
00
Oth
er
Non-C
ash
Expense
s0
00
00
Tota
l163,0
00
240,0
00
250,0
00
406,0
00
525,0
00
Weig
ht
On
Cash
Flo
wBase
12
34
5
Ongoin
gCash
Flo
wBase
376,1
33
SELECTED
ON
GO
ING
CASH
FLO
WBASE
376,1
00
»

Estimate of Value Page 143 of 188
HELPER TEXT
Explain why and how the adjustments were made.
The weighting above was performed because
HELPER TEXT
Explain why and how the weightings were calculated and applied.
The cash flow base was calculated as $«376,133» and the selected cash flow base wasrounded as $«376,100».
Estimate of Earnings Before Interest and Taxes Base
The analysis presented below represents the calculation of the ongoing economic benefitstream. It depicts the calculation of the earnings before interest and taxes benefit stream.

Estim
ate
of
Valu
ePage
144
of
188
Calc
ula
tio
nof
the
Earn
ing
sB
efo
re
In
terest
an
dT
axes
Base
«
Ye
ar
En
din
g
Ye
ar
En
din
g
Ye
ar
En
din
g
Ye
ar
En
din
g
Ye
ar
En
din
g
His
toric
De
ce
mb
er
31
,2
00
2
De
ce
mb
er
31
,2
00
3
De
ce
mb
er
31
,2
00
4
De
ce
mb
er
31
,2
00
5
De
ce
mb
er
31
,2
00
6Pre
Tax
Inco
me
164,0
00
233,0
00
226,0
00
390,0
00
531,0
00
Inte
rest
-192,0
00
-190,0
00
-210,0
00
-250,0
00
-220,0
00
Tota
l-2
8,0
00
43,0
00
16,0
00
140,0
00
311,0
00
Weig
ht
On R
evenue
1
Ongoin
gEBIT
Base
311,0
00
SELECTED
ON
GO
ING
EBIT
BASE
311,0
00
»

Estimate of Value Page 145 of 188
HELPER TEXT
The EBIT Schedule is where the data is mapped from.
The weighting above was performed because
HELPER TEXT
Explain why and how the weightings were calculated and applied.
The ongoing EBIT was calculated as «311,000» and the selected EBIT was rounded as«311,000».
Estimate of EBITDA Base
The analysis presented below represents the calculation of the ongoing economic benefitstream. It depicts the calculation of the earnings before interest, taxes, depreciation andamortization (EBITDA) benefit stream.
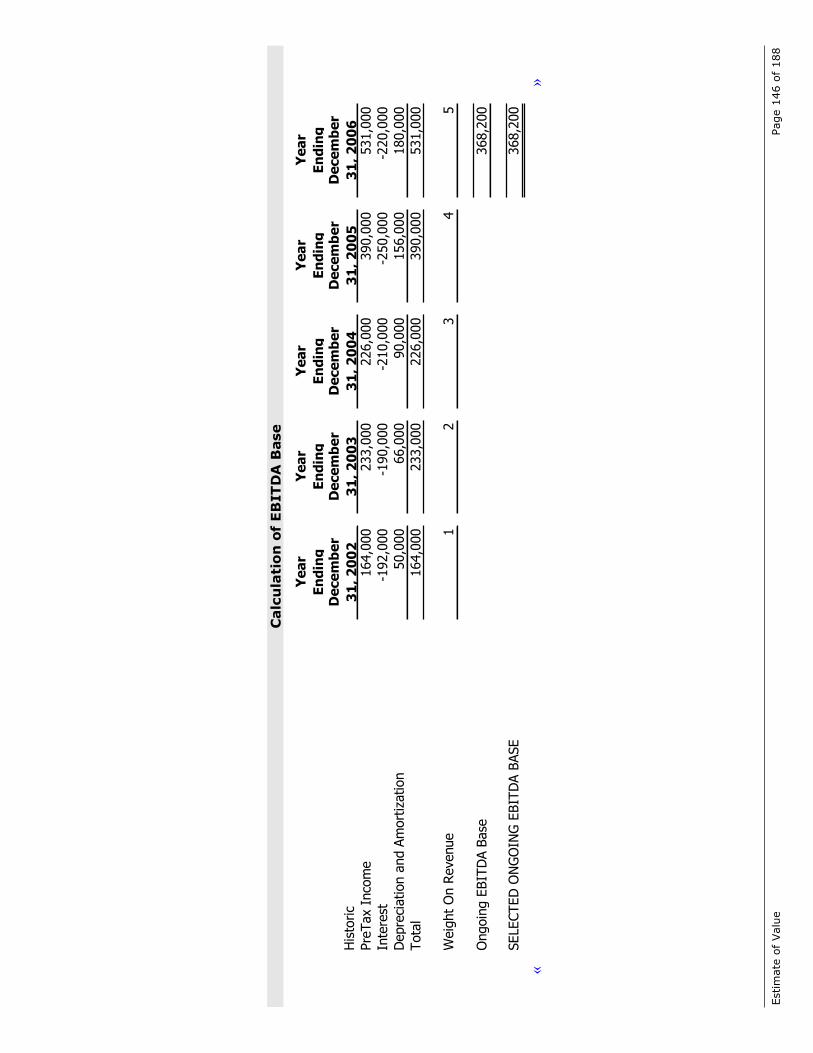
Estim
ate
of
Valu
ePage
146
of
188
Calc
ula
tio
nof
EB
IT
DA
Base
«
Ye
ar
En
din
g
Ye
ar
En
din
g
Ye
ar
En
din
g
Ye
ar
En
din
g
Ye
ar
En
din
g
His
toric
De
ce
mb
er
31
,2
00
2
De
ce
mb
er
31
,2
00
3
De
ce
mb
er
31
,2
00
4
De
ce
mb
er
31
,2
00
5
De
ce
mb
er
31
,2
00
6Pre
Tax
Inco
me
164,0
00
233,0
00
226,0
00
390,0
00
531,0
00
Inte
rest
-192,0
00
-190,0
00
-210,0
00
-250,0
00
-220,0
00
Depre
ciation a
nd
Am
ort
ization
50,0
00
66,0
00
90,0
00
156,0
00
180,0
00
Tota
l164,0
00
233,0
00
226,0
00
390,0
00
531,0
00
Weig
ht
On R
evenue
12
34
5
Ongoin
gEBIT
DA
Base
368,2
00
SELECTED
ON
GO
ING
EBIT
DA
BASE
368,2
00
»

Estimate of Value Page 147 of 188
HELPER TEXT
The EBITDA Schedule is where the data is mapped from.
The weighting above was performed because
HELPER TEXT
Explain why and how the weightings were calculated and applied.
The ongoing EBITDA was calculated as $«368,200» and the selected EBITDA wasrounded as $«368,200».
Application of Minority Interest Discount
HELPER TEXT
The Analyst indicated value schedule is where the data is mapped from.
A minority interest discount is a reduction to the initial indicated value due to a lack ofcontrol prerogatives such as declaring dividends, liquidating the company, going public,issuing or buying stock, directing management, setting management’s salaries, etc. In«my» opinion, a minority interest discount of «37.30%» is appropriate because
HELPER TEXT
Explain why you applied a minority interest discount and how you arrived at the
amount of the discount.
Application of Marketability Discount
HELPER TEXT
The Analyst indicated value schedule is where the data is mapped from.
In «my» opinion, a discount of «35.00%» is required for lack of marketability. Thediscount reflects an expectation for the lack of a secondary market in which to negotiate aquick sale.
HELPER TEXT
Expand on other factors involved in the determination of the marketability discount.
Appendix E contains further information on the lack of a marketability discount.
Application of Excess or Non-Operating Assets
HELPER TEXT
These items are mapped from Pro’s Indicated Value Schedule.
Be aware that percentages of discounts and premiums may be applied to the excessassets. If this is the case then explanatory text must be added.

Estimate of Value Page 148 of 188
Excess or Non-operating assets represent the value of resources the company has controlof but are not required to operate the business. Examples are excess cash on hand, realestate or other securities. In «my» judgment, excess and non-operating assets that need tobe added back and are part of the entity’s value total $«18,000».
HELPER TEXT
Explain why the assets are not required in the day to day activities of the businessand how the total value of those assets was determined.
Indicated Value Calculation
HELPER TEXT
In the following paragraph, if only one ratio was used, delete the first sentence. If
more than one ratio was used, you must explain how they were weighted.
Each of the market Analyst ratios were weighted. The following schedule presents theconclusions of value using the market data Analyst ratio method. As calculated, theindicated «fair market value» of the $«689,655» is which has been rounded to$«689,700».

Estim
ate
of
Valu
ePage
149
of
188
In
dic
ate
dV
alu
e C
alc
ula
tio
n
«
Re
ve
nu
eE
arn
ing
sA
sse
tsB
oo
kV
alu
eC
ash
Flo
wE
BIT
EB
ITD
A
Mu
ltip
leM
ult
iple
Mu
ltip
leM
ult
iple
Mu
ltip
leM
ult
iple
Mu
ltip
le
Base
4,6
99,1
00
218,9
00
2,5
23,6
00
1,0
97,7
00
376,1
00
311,0
00
368,2
00
Multip
le0.1
5x
8.2
4x
0.4
2x
0.2
6x
5.0
0x
8.0
0x
9.0
0x
Subto
tal
704,8
65
1,8
03,7
36
1,0
59,9
12
285,4
02
1,8
80,5
00
2,4
88,0
00
3,3
13,8
00
Weig
ht
11
11
11
1
Ongoin
gValu
e1,6
48,0
31
Min
ority
Inte
rest
Dis
count
37.3
0%
Subto
tal
1,0
33,3
15
Mark
eta
bility
Dis
count
35.0
0%
Opera
ting V
alu
e671,6
55
Exce
ss/N
on-O
pera
ting
Ass
ets
18,0
00
Indic
ate
dEquity V
alu
e689,6
55
SELECTED
EQ
UIT
Y V
ALU
E689,7
00
»

Estimate of Value Page 150 of 188
Industry Data Method – Mergerstat
HELPER TEXT
The industry approaches in the Market Data have the schedules that pertain to this
method. To have the Industry Data Method – Mergerstat appear as considered andused, enter a 1 for its status on the Conclusions of Value schedule in Pro.
Using multiples derived from compilations of industry pricing statistics a marketapproach may be used to estimate the «fair market value» of a company when thecompany can be shown to be representative of the market. By convention, analystsexpress the relationship between the market price of a stock and its historical earnings inthe form of a ratio of the market price of earnings for the most recent twelve months, i.e.,price/earnings (P/E) ratio. Using the industry pricing statistic against the company’searnings the «fair market value» can be estimated.
The company is representative of the industry in these ways.
HELPER TEXT
Explain why the company is representative of the industry. Make a compelling
argument that an industry average is the same as the specific ratio for the company.
The data source is the Merger PE Schedule.
One source of industry pricing ratios used in the analysis comes fromMergerstat Review(published by Houlihan, Howard, Lokey and Zukin). For over 30 years, Mergerstat hascompiled statistics on publicly announced mergers, acquisitions and divestures. The P/Eratio is based on the sellers last 12 months of earnings or the latest financial statement ifit was a private company. The industry from which the P/E was taken is «Retail» and theP/E ratio from Mergerstat Review is «22.30».
Estimate of Earnings Base
The analysis presented below represents the calculation of the ongoing economic benefitstream. It depicts the calculation of the earnings or net income after tax benefit stream.

Estim
ate
of
Valu
ePage
151
of
188
Calc
ula
tio
nof
the
Earn
ing
so
rN
et
In
co
me
Aft
er
Tax
Base
«
Year
En
din
g
Year
En
din
g
Year
En
din
g
Year
En
din
g
Year
En
din
gD
ecem
ber
31
,2
00
2
Decem
ber
31
,2
00
3
Decem
ber
31
,2
00
4
Decem
ber
31
,2
00
5
Decem
ber
31
,2
00
6H
isto
ric
Pre
tax
Inco
me
164,0
00
233,0
00
226,0
00
390,0
00
531,0
00
Tota
l164,0
00
233,0
00
226,0
00
390,0
00
531,0
00
Weig
ht
12
34
5
Ongoin
g E
arn
ing
Pow
er
368,2
00
Taxable
Base
368,2
00
Less
Est
imate
dSta
teIn
com
eTaxes
-Effect
ive
Rate
:10.0
0%
Befo
reFedera
lTaxes
331,3
80
Less
Federa
l Taxes
112,4
88
Calc
ula
ted
Ongoin
gAdditio
nalAdju
stm
ent
218,8
92
SELECTED
ON
GO
ING
AD
DIT
ION
AL
AD
JUSTM
EN
T218,9
00
»

Estimate of Value Page 152 of 188
HELPER TEXT
The Industry After Tax Earnings Schedule is where the data is mapped from.
The weighting above was performed because
HELPER TEXT
Explain why and how the weightings were calculated and applied.
The ongoing earnings was calculated as $«218,892» and the selected earnings wasrounded as $«218,900».
Application of Minority Interest Discount
HELPER TEXT
The PE indicated value schedule is where the data is mapped from.
A minority interest discount is a reduction to the initial indicated value due to a lack ofcontrol prerogatives such as declaring dividends, liquidating the company, going public,issuing or buying stock, directing management, setting management’s salaries, etc. In«my» opinion, a minority interest discount of «37.30%» is appropriate because
HELPER TEXT
Explain why you applied a minority interest discount and how you arrived at the
amount of the discount.
Application of Marketability Discount
HELPER TEXT
The PE indicated value schedule is where the data is mapped from.
In «my» opinion, a discount of «35.00%» is required for lack of marketability. Thediscount reflects an expectation for the lack of a secondary market in which to negotiate aquick sale.
HELPER TEXT
Expand on other factors involved in the determination of the marketability discount.
Appendix E contains further information on the lack of a marketability discount.
Application of Excess or Non-Operating Assets
HELPER TEXT
These items are mapped from Pro’s Indicated Value Schedule.
Be aware that percentages of discounts and premiums may be applied to the excessassets. If this is the case then explanatory text must be added.

Estimate of Value Page 153 of 188
Excess or Non-operating assets represent the value of resources the company has controlof but are not required to operate the business. Examples are excess cash on hand, realestate or other securities. In «my» judgment, excess and non-operating assets that need tobe added back and are part of the entity’s value total $«18000».
HELPER TEXT
Explain why the assets are not required in the day to day activities of the businessand how the total value of those assets was determined.
Indicated Value Calculation
HELPER TEXT
In the following paragraph, if only one ratio was used, delete the first sentence. If
more than one ratio was used, you must explain how they were weighted.
Each of the industry P/E were weighted. The following schedule presents the conclusionsof value using the industry data P/E ratio method. As calculated, the indicated «fairmarket value» of the $«2,007,443» is which has been rounded to $«2,007,400».
«
Earnings
Multiple
Base 218,900
Multiple 22.30
Subtotal 4,881,470
Minority Interest Discount 37.30%
Subtotal 3,060,682
Marketability Discount 35.00%
Operating Value 1,989,443
Excess/Non-Operating Assets 18,000
Indicated Equity Value 2,007,443
SELECTED EQUITY VALUE 2,007,400
»
Industry Data Method – Analyst
HELPER TEXT
The industry approaches in the Market Data have the schedules that pertain to thismethod. To have the Industry Data Method – Analyst appear as considered and
used, enter a 1 for its status on the Conclusions of Value schedule in Pro.
Using multiples derived from compilations of Industry Analyst statistics a marketapproach may be used to estimate the «fair market value» of a company when thecompany can be shown to be representative of the market. By convention, analystsexpress the relationship between the market price of a stock and its historical revenues inthe form of a ratio of the market price of revenues for the most recent twelve months, i.e.,

Estimate of Value Page 154 of 188
price/revenues (P/R) ratio. Using the Industry Analyst pricing statistic against thecompany’s earnings the «fair market value» can be estimated.
The company is representative of the industry in these ways.
HELPER TEXT
Explain why the company is representative of the industry. Make a compelling
argument that an industry average is the same as the specific ratio for the company.
The mean P/R ratio was «0.23». The median P/R ratio was «0.22». The selected P/R ratiowas «0.22». The mean P/E ratio was «7.73». The median P/E ratio was «7.82». Theselected P/E ratio was «7.82». The mean P/B ratio was «0.31». The median P/B ratio was«0.25». The selected P/B ratio was «0.25». The mean P/Cash Flow ratio was «8.25». Themedian P/Cash Flow ratio was «8.25». The selected P/Cash Flow ratio was «8.80».
Estimate of Revenue
The analysis presented below represents the calculation of the revenue.

Estim
ate
of
Valu
ePage
155
of
188
Calc
ula
tio
nof
the
Reven
ue
Base
«
Ye
ar
En
din
g
Ye
ar
En
din
g
Ye
ar
En
din
g
Ye
ar
En
din
g
Ye
ar
En
din
g
His
toric
De
ce
mb
er
31
,2
00
2
De
ce
mb
er
31
,2
00
3
De
ce
mb
er
31
,2
00
4
De
ce
mb
er
31
,2
00
5
De
ce
mb
er
31
,2
00
6Revenue
2,1
00,0
00
2,9
35,0
00
3,9
70,0
00
5,1
94,0
00
5,9
66,0
00
Weig
ht
On R
evenue
12
34
5
Ongoin
g R
evenue
4,6
99,0
67
SELECTED
ON
GO
ING
REVEN
UE
BASE
4,6
99,1
00
»

Estimate of Value Page 156 of 188
HELPER TEXT
Explain why and how the adjustments were made.
The weighting above was performed because
HELPER TEXT
Explain why and how the weightings were calculated and applied.
The revenue base value was calculated as $«4,699,067» and the selected book value wasrounded as $«4,699,100».
Estimate of Net Earnings
The analysis presented below represents the calculation of the Net Earnings.

Estim
ate
of
Valu
ePage
157
of
188
Calc
ula
tio
nof
the
Net
Earn
ing
sB
ase
« Year
En
din
g
Year
En
din
g
Year
En
din
g
Year
En
din
g
Year
En
din
gD
ecem
ber
31
,2
00
2
Decem
ber
31
,2
00
3
Decem
ber
31
,2
00
4
Decem
ber
31
,2
00
5
Decem
ber
31
,2
00
6H
isto
ric
Pre
tax
Inco
me
164,0
00
233,0
00
226,0
00
390,0
00
531,0
00
Weig
ht
12
34
5
Ongoin
g E
arn
ing
Pow
er
368,2
00
Taxable
Base
368,2
00
Less
Est
imate
dSta
teIn
com
eTaxes
-Effect
ive
Rate
:10.0
0%
Befo
reFedera
lTaxes
331,3
80
Less
Federa
l Taxes
112,4
88
Calc
ula
ted
Ongoin
gAdditio
nalAdju
stm
ent
218,8
92
SELECTED
ON
GO
ING
AD
DIT
ION
AL
AD
JUSTM
EN
T218,9
00
»

Estimate of Value Page 158 of 188
HELPER TEXT
Explain why and how the adjustments were made.
The weighting above was performed because
HELPER TEXT
Explain why and how the weightings were calculated and applied.
The earnings base was calculated as $«218,892» and the selected book value wasrounded as $«218,900».
Estimate of Book Value
The analysis presented below represents the calculation of the book value.

Estim
ate
of
Valu
ePage
159
of
188
Calc
ula
tio
nof
the
Boo
kV
alu
e
«
Ye
ar
En
din
g
Ye
ar
En
din
g
Ye
ar
En
din
g
Ye
ar
En
din
g
Ye
ar
En
din
g
His
toric
De
ce
mb
er
31
,2
00
2
De
ce
mb
er
31
,2
00
3
De
ce
mb
er
31
,2
00
4
De
ce
mb
er
31
,2
00
5
De
ce
mb
er
31
,2
00
6Book V
alu
e615,0
00
705,0
00
905,0
00
1,1
25,0
00
1,4
45,0
00
Weig
ht
On
Book
Valu
e1
23
45
Ongoin
gBook V
alu
eBase
1,0
97,6
67
SELECTED
BO
OK
VALU
EBASE
1,0
97,7
00
»

Estimate of Value Page 160 of 188
HELPER TEXT
Explain why and how the adjustments were made.
The weighting above was performed because
HELPER TEXT
Explain why and how the weightings were calculated and applied.
The book value was calculated as $«1,097,667» and the selected book value was roundedas $«1,097,700».
Estimate of Cash Flow
The analysis presented below represents the calculation of the cash flow base.
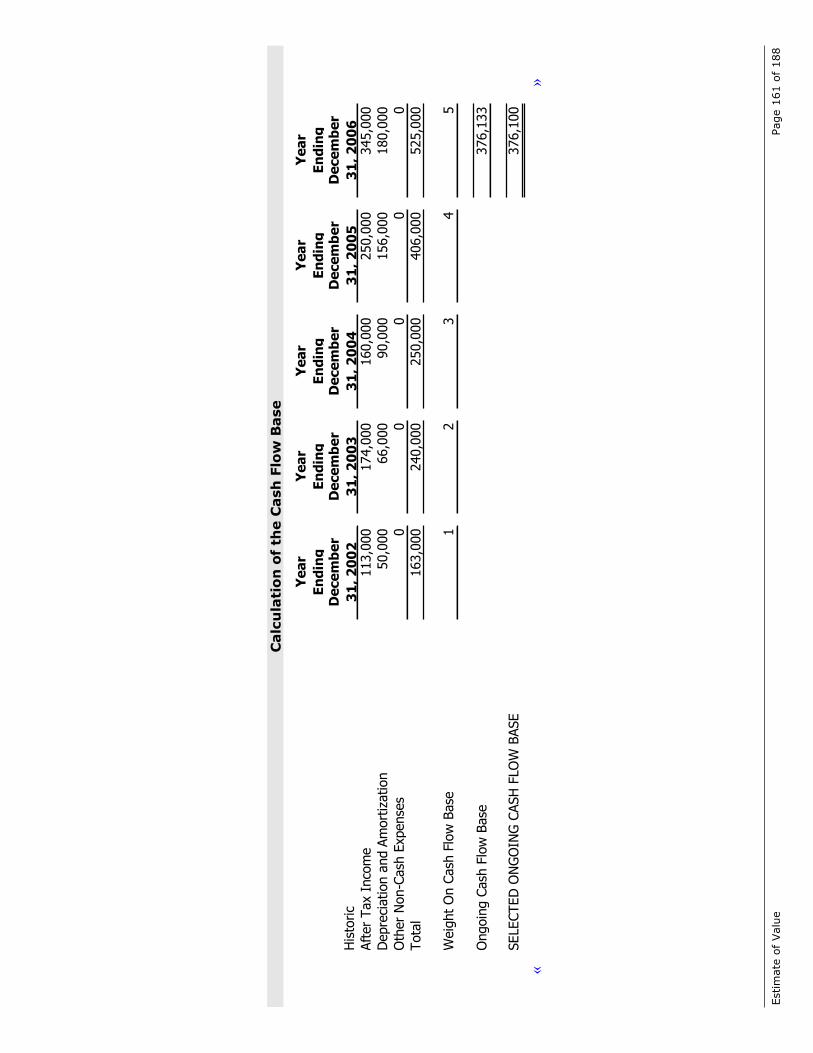
Estim
ate
of
Valu
ePage
161
of
188
Calc
ula
tio
nof
the C
ash
Flo
wB
ase
«
Ye
ar
En
din
g
Ye
ar
En
din
g
Ye
ar
En
din
g
Ye
ar
En
din
g
Ye
ar
En
din
g
His
toric
De
ce
mb
er
31
,2
00
2
De
ce
mb
er
31
,2
00
3
De
ce
mb
er
31
,2
00
4
De
ce
mb
er
31
,2
00
5
De
ce
mb
er
31
,2
00
6Aft
er
Tax
Inco
me
113,0
00
174,0
00
160,0
00
250,0
00
345,0
00
Depre
ciation a
nd
Am
ort
ization
50,0
00
66,0
00
90,0
00
156,0
00
180,0
00
Oth
er
Non-C
ash
Expense
s0
00
00
Tota
l163,0
00
240,0
00
250,0
00
406,0
00
525,0
00
Weig
ht
On
Cash
Flo
wBase
12
34
5
Ongoin
gCash
Flo
wBase
376,1
33
SELECTED
ON
GO
ING
CASH
FLO
WBASE
376,1
00
»
Estimate of Value Page 162 of 188
HELPER TEXT
Explain why and how the adjustments were made.
The weighting above was performed because
HELPER TEXT
Explain why and how the weightings were calculated and applied.
The cash flow base was calculated as $«376,133» and the selected cash flow base wasrounded as $«376,100».
Application of Minority Interest Discount
HELPER TEXT
The PR indicated value schedule is where the data is mapped from.
A minority interest discount is a reduction to the initial indicated value due to a lack ofcontrol prerogatives such as declaring dividends, liquidating the company, going public,issuing or buying stock, directing management, setting management’s salaries, etc. In«my» opinion, a minority interest discount of «37.30%» is appropriate because
HELPER TEXT
Explain why you applied a minority interest discount and how you arrived at the
amount of the discount.
Application of Marketability Discount
HELPER TEXT
The PR indicated value schedule is where the data is mapped from.
In «my» opinion, a discount of «35.00%» is required for lack of marketability. Thediscount reflects an expectation for the lack of a secondary market in which to negotiate aquick sale.
HELPER TEXT
Expand on other factors involved in the determination of the marketability discount.
Appendix E contains further information on the lack of a marketability discount.

Estimate of Value Page 163 of 188
Application of Excess or Non-Operating Assets
HELPER TEXT
These items are mapped from Pro’s Indicated Value Schedule. Be aware that
percentages of discounts and premiums may be applied to the excess assets. If this
is the case then explanatory text must be added.
Excess or Non-operating assets represent the value of resources the company has controlof but are not required to operate the business. Examples are excess cash on hand, realestate or other securities. In «my» judgment, excess and non-operating assets that need tobe added back and are part of the entity’s value total $«18000».
HELPER TEXT
Explain why the assets are not required in the day to day activities of the businessand how the total value of those assets was determined.
Indicated Value Calculation
HELPER TEXT
In the following paragraph, if only one ratio was used, delete the first sentence. If
more than one ratio was used, you must explain how they were weighted.
Each of the industry P/R were weighted. The following schedule presents the conclusionsof value using the industry data P/R ratio method. As calculated, the indicated «fairmarket value» of the $«660,524» is which has been rounded to $«660,500».
«
Revenue Earnings Book Value Cash Flow
Multiple Multiple Multiple Multiple
Base 4,699,100 218,900 1,097,700 376,100
Multiple 0.22x 7.82x 0.25x 8.80x
Subtotal 1,010,307 1,711,798 274,425 3,309,680
Weight 1 1 1 1
Ongoing Value 1,576,552
Minority Interest Discount 37.30%
Subtotal 988,498
Marketability Discount 35.00%
Operating Value 642,524
Excess/Non-Operating Assets 18,000
Indicated Equity Value 660,524
SELECTED EQUITY VALUE 660,500
»

Conclusion of Value Page 164 of 188
CONCLUSION OF VALUE
HELPER TEXT
The data in this section comes from Pro’s Conclusions of Value schedule.
Revenue Ruling 59-60 states:
Because valuations cannot be made on the basis of a prescribed formula, thereis no means whereby the various applicable factors in a particular case can beassigned mathematical weights in deriving the fair market value. For thisreason, no useful purpose is served by taking an average of several factors(for example, book value, capitalized earnings and capitalized dividends) andbasing the valuation on the result. Such a process excludes activeconsideration of other pertinent factors, and the end result cannot besupported by a realistic application of the significant facts in the case exceptby mere chance.
Because of this, the method selected to value «Child's Clothing Store» was «book valuemethod».
Indicated Fair Market Value
As calculated in the following schedule, the indicated fair market value of the$«357,387» is which has been rounded to $«357,400».
«
Indicated
Valuation Indication by Method Value Weight
Book Value Method 589,000 1
Adjusted Book Value Method - Going Concern 344,000 1
Adjusted Book Value Method - Liquidation -18,000 1
Capitalization of Earnings Method 412,000 1
Multi-Stage Growth 507,000 1
Discounted Cash Flow Method - Summary Projections 1,625,000 1
Discounted Cash Flow Method - Detailed Projections 2,271,000 1
Capitalization of Excess Earnings Method 1,686,000 1
Market Data Method - Bizcomps 1,049,100 1
Market Data Method - IBA 500,700 1
Industry Data Method - Mergerstat Industry PE 2,007,400 1
Market Data Method - MMC 743,000 1
Market Data Method - Pratts Stats 890,100 1
Market Data Method - Merged, Acquired and Guideline Data 392,500 1
Market Data Method - Private Company Data 583,500 1
Market Data Method - Analyst Data 689,700 1
Subject Company Transactions Method 57,000 1
Industry Data Method - Analyst Data 660,500 1Calculated Conclusion of Equity Value 357,387
SELECTED CONCLUSION OF EQUITY VALUE 357,400
»

Opinion Page 165 of 188
OPINION
HELPER TEXT
In the following paragraph, replace the highlighted phrase with the basis of the
opinion. An example is “control, non-marketable basis”. Another example is“minority bases (21,500 shares of 50,000) marketable basis”.
Therefore, based upon the facts and circumstances of the valuation and subject to thelimitations in both conditions and scope listed in this report, «my» opinion of theresultant fair market value of «Child's Clothing Store» on a [enter the basis] as of«December 31, 2006» is:.
$ «357,400»
===========
Appendix A: Valuation Certification and Signature of the Analyst Page 166 of 188
APPENDIX A: VALUATION CERTIFICATION
AND SIGNATURE OF THE ANALYST
«I» certify to the best of «my» knowledge:
1. The statements of fact contained in this report are true and correct.
2. The reported analyses, opinions, and conclusions are limited only by the reportedassumptions and limiting conditions, and are «my» personal, impartial, andunbiased professional analyses, opinions, and conclusions.
3. «I» have no (or the specified) present or prospective interest in the property that isthe subject of this report and no (or the specified) personal interest with respect tothe parties involved.
4. «I» have no bias with respect to the property that is the subject of this report or tothe parties involved with this assignment.
5. «My» engagement in this assignment was not contingent upon developing orreporting predetermined results.
6. «My» compensation for completing this assignment is not contingent upon thedevelopment or reporting of a predetermined value or direction in value thatfavors the cause of the client, the amount of the value opinion, the attainment of astipulated result, or the occurrence of a subsequent event directly related to theintended use of this appraisal.
7. «My» analyses, opinion,, and conclusions were developed, and this report hasbeen prepared in conformity with the Uniform Standards of ProfessionalAppraisal Practice.
8. «I» have (have not) made a personal inspection of the property that is the subjectof this report. (If more than one person signs this certification, the certificationmust clearly specify which individuals did and which individuals did not make apersonal inspection the appraised property.)
9. No one provided significant personal property appraisal assistance to the personsigning this certification. (If there are exceptions, the name of each individualproviding significant personal property appraisal assistance must be stated.)
Signature of the Analyst:
Mr/Ms. «Joe Appraiser»
Title
«Joe Appraiser CPA»

Appendix B: Limiting Conditions Page 167 of 188
APPENDIX B: LIMITING CONDITIONS
HELPER TEXT
Not of the following limiting conditions need to be in the report. Delete those that are
unnecessary and add any that are missing. The listing of conditions should becomplete given the fact pattern.
Preparation of this report involved the review of substantial documentation with respectto the Company, the industry and the national economy. Information reviewed relative tothe Company is summarized in Appendix C. Sources of information related to theindustry and the national economy are cited specifically at appropriate sections of thereport.
In conjunction with the preparation of this report, «Joe Appraiser» of «Joe AppraiserCPA» visited with management of «Child's Clothing Store». This visit, together withother conversations with management, provided important perspective to «my»understanding of the information reviewed and analyzed in the preparation of thisvaluation opinion.
In all cases, «I» have relied upon the referenced information without independentverification. This report is, therefore, dependent upon the information provided. Amaterial change in critical information relied upon in this report would be cause for areassessment to determine the effect, if any, upon «my» conclusion.
Users of this business valuation report should be aware that business valuations are basedon future earnings potential that may or may not materialize. Therefore, the actual resultsachieved during the projection period will vary from the projections utilized in thisvaluation, and the variations may be material.
Some assumptions invariably will not materialize, and unanticipated events andcircumstances may occur. Therefore, the actual performance in any areasforecasted/projected will vary from the forecast/projection, and the variations may bematerial. «Joe Appraiser CPA» will not express any form of assurance on the likelihoodof achieving the forecast/projection or on the reasonableness of the used assumptions.Any such forecast/projection is presented as part of the appraisal and is not intended to beused separately.
The value premise(s) cited in this report are fundamental to the value opinions renderedherein, and «I» reserve the right to reconsider such premise(s) should subsequent oradditional information be discovered, although no such obligation exists.
We have relied upon the representations of the owners, management and other thirdparties concerning the value and useful condition of all equipment, real estate,investments used in the business, and any other assets or liabilities except as specificallystated to the contrary in this report. «I» have not attempted to confirm whether or not allassets of the business are free and clear of liens and encumbrances, or that «Child'sClothing Store» has good title to all assets.
Appendix B: Limiting Conditions Page 168 of 188
The estimate of value included in this report assumes that «Child's Clothing Store» willmaintain the character and integrity of the company through any sale, reorganization orreduction of any owner's/manager's participation in the existing activities of the company.
Since neither «Child's Clothing Store» management nor advisors have advised «me»otherwise, «I» assume that there is full compliance with all applicable federal, state, andlocal laws and regulations unless the lack of compliance is stated, defined, andconsidered in the appraisal report.
Public information, purchased private information and industry statistical information arefrom sources «I» deem to be reliable; however, «I» make no representation as to theaccuracy or completeness of such information, and have accepted the information withoutfurther verification.
This report and its related calculations were prepared using various software applicationspotentially including Microsoft Word and Microsoft Excel, Pro, and/or various Internet-related software, third-party data (as indicated) and information.
«I» assume no responsibility for the legal description or matters including legal or titleconsiderations. Title to the subject assets, properties, or business interests is assumed tobe good and marketable as represented by owners, management and advisors of «Child'sClothing Store» unless otherwise stated.
We assume no hidden or unapparent conditions regarding the subject assets, properties orbusiness interests.
Unless otherwise stated in this report, «I» did not observe, and «I» have no knowledge of,the existence of hazardous materials with regard to the subject assets, properties, orbusiness interests. However, «I» are not qualified to detect such substances. «I» assumeno responsibility for such conditions or for any expertise required to discover them.
No opinion, counsel or interpretation is intended in matters that require legal or otherappropriate professional advice. It is assumed that such opinions, counsel orinterpretations have been or will be obtained from the appropriate professional sources.
The analyses, opinions, and conclusions presented in this report apply to this engagementonly and may not be used out of the context presented herein. This report is valid only forthe effective date(s) specified and only for the purpose(s) specified herein.
Although «I» have exerted considerable diligence and applied «my» best efforts inconstructing this document, immaterial anomalies, if any, may arise. Even so, «I» areconfident that «my» overall conclusion would still fall within a materially consistentconclusion.
While the client has not informed «Child's Clothing Store» of any intent to do so, anythird parties to whom this report is shown may be assured that this report, whileperformed in the employ of the client, was materially prepared on a non-advocacy basis.Any third persons, however, are cautioned that «Joe Appraiser CPA» has no duty to youand, therefore, no warranty is expressed or implied. Nothing in this report is intended toreplace your independent sole judgment, due diligence, or decision to seek professionallegal, accounting, or valuation counsel.

Appendix B: Limiting Conditions Page 169 of 188
This report has been prepared solely for the use of the party or parties named andspecifically for the purposes set out therein. In accordance with normal practice, «I»hereby disclaim liability to any other person. Any other person should not rely upon theinformation and conclusions reached nor should any statement in this report be used forany other purpose without written consent from «Child's Clothing Store».
The statements and opinions given in this report are given in good faith and in the beliefthat such statements are not false or misleading. In preparing this report «I» have reliedupon information believed to be reliable and accurate provided by the owners,management and advisors of «Child's Clothing Store» and other sources. «I» have noreason to believe that any material facts have been withheld from «me», nor do «I»warrant that «my» investigation has revealed all of the matters in which an audit or moreextensive examination might disclose.
This valuation reflects facts and conditions existing at the date of this valuation.Subsequent events have not been considered, and «I» have no obligation to update «my»report for such events and conditions.
«Joe Appraiser CPA» does not purport to be a guarantor of value. Valuation of closelyheld companies is an imprecise science, with value being a question of fact, andreasonable people can differ in their estimates of value. «Joe Appraiser CPA», however,performed conceptually sound and commonly accepted methods and procedures ofvaluation in determining the estimate of value included in this report. «Joe AppraiserCPA» is not liable for any use, reliance, financial applications, report distribution or otherutilization of any kind, by any party not having written authorization from «Joe AppraiserCPA».
The appraised estimate of fair market value in this report is based on the definitionapplied throughout such report. An actual transaction in the shares may be completed at avalue higher, lower or equal to the value rendered herein. «I» make no guarantee of anykind with regard to the likely or ultimate amount that may result in any future transaction.
The opinion(s) offered in this report do not constitute an offer to buy or sell the shares.
The valuation analyst, by reason of performing this valuation and preparing this report, isnot to be required to give expert testimony nor to be in attendance in court or at anygovernment, professional or regulatory hearing, including IRS matters with reference tothe matters contained herein, unless prior written arrangements have been made with«Joe Appraiser CPA» regarding such additional engagement as to the timing, feearrangements, and nature of the services required.
None of the partners or employees of «Joe Appraiser CPA» have any present orcontemplated future interest in the property being valued, any personal interest withrespect to the parties involved, or any other interest that might prevent «me» fromperforming an unbiased valuation. «I was» compensation is not contingent on an actionor event resulting from the analysis, opinions, or conclusions in, or the use of, this report.
Possession of this report does not carry with it the right of publication. It may not be usedfor any purpose by any person other than the client to whom it is addressed without «my»written consent and, in any event, only with proper written qualifications and only in itsentirety.

Appendix B: Limiting Conditions Page 170 of 188
Neither all nor any part of the contents of this report shall be disseminated to the publicthrough advertising, public relations, news, sales, or other media without «my» priorwritten consent and approval.
Liability of «Joe Appraiser CPA» and its partners and employees for errors andomissions, if any, in this work will be limited to the amount of its compensation for thework performed in this assignment.
This report is further subject to any other contingencies, assumptions, and limitingconditions that may be set out elsewhere within this report.

Appendix C: Qualifications of Appraiser Page 171 of 188
APPENDIX C: QUALIFICATIONS OF
APPRAISER
HELPER TEXT
Use Report Writer’s Insert From Word command to insert the Microsoft Word
document file that contains the appraiser’s resume or qualifications.
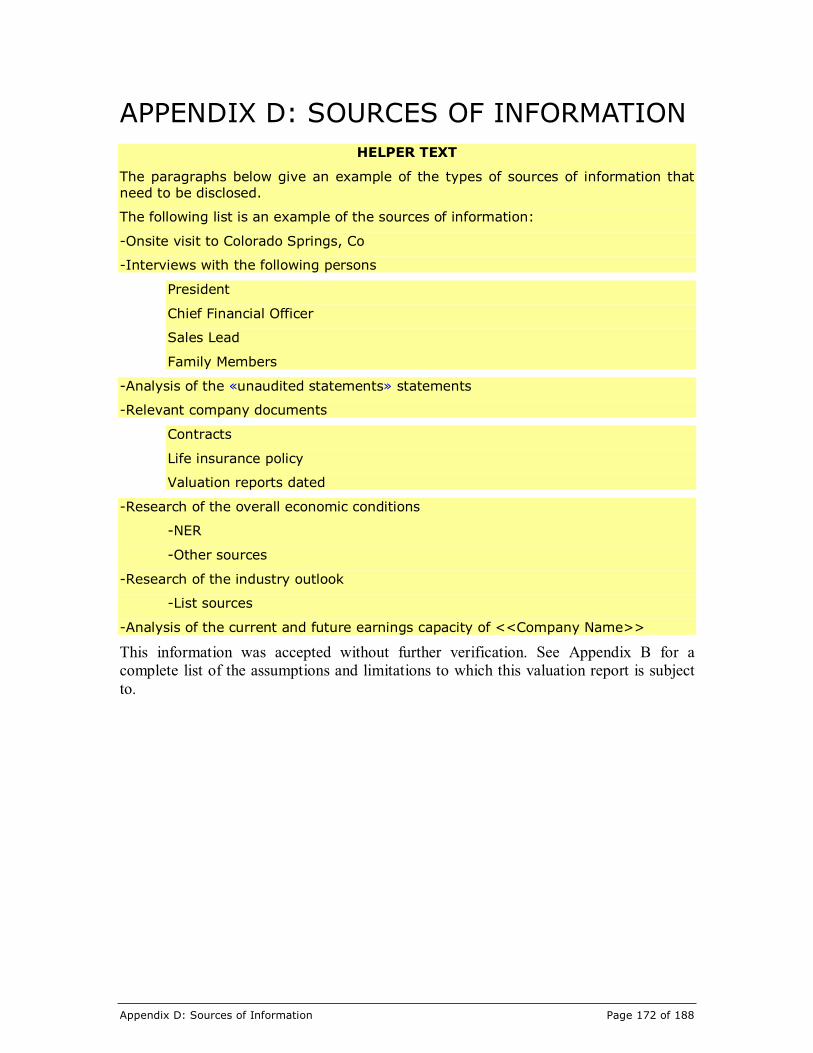
Appendix D: Sources of Information Page 172 of 188
APPENDIX D: SOURCES OF INFORMATION
HELPER TEXT
The paragraphs below give an example of the types of sources of information that
need to be disclosed.
The following list is an example of the sources of information:
-Onsite visit to Colorado Springs, Co
-Interviews with the following persons
President
Chief Financial Officer
Sales Lead
Family Members
-Analysis of the «unaudited statements» statements
-Relevant company documents
Contracts
Life insurance policy
Valuation reports dated
-Research of the overall economic conditions
-NER
-Other sources
-Research of the industry outlook
-List sources
-Analysis of the current and future earnings capacity of <<Company Name>>
This information was accepted without further verification. See Appendix B for acomplete list of the assumptions and limitations to which this valuation report is subjectto.
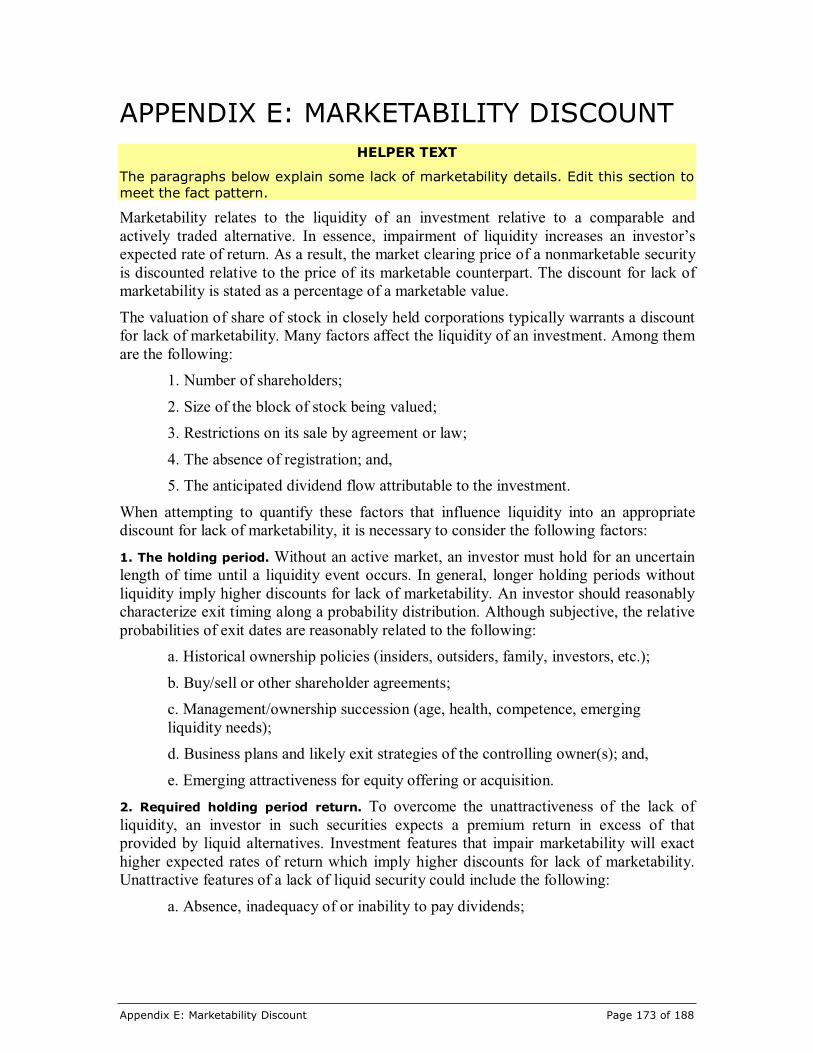
Appendix E: Marketability Discount Page 173 of 188
APPENDIX E: MARKETABILITY DISCOUNT
HELPER TEXT
The paragraphs below explain some lack of marketability details. Edit this section to
meet the fact pattern.
Marketability relates to the liquidity of an investment relative to a comparable andactively traded alternative. In essence, impairment of liquidity increases an investor’sexpected rate of return. As a result, the market clearing price of a nonmarketable securityis discounted relative to the price of its marketable counterpart. The discount for lack ofmarketability is stated as a percentage of a marketable value.
The valuation of share of stock in closely held corporations typically warrants a discountfor lack of marketability. Many factors affect the liquidity of an investment. Among themare the following:
1. Number of shareholders;
2. Size of the block of stock being valued;
3. Restrictions on its sale by agreement or law;
4. The absence of registration; and,
5. The anticipated dividend flow attributable to the investment.
When attempting to quantify these factors that influence liquidity into an appropriatediscount for lack of marketability, it is necessary to consider the following factors:
1. The holding period. Without an active market, an investor must hold for an uncertainlength of time until a liquidity event occurs. In general, longer holding periods withoutliquidity imply higher discounts for lack of marketability. An investor should reasonablycharacterize exit timing along a probability distribution. Although subjective, the relativeprobabilities of exit dates are reasonably related to the following:
a. Historical ownership policies (insiders, outsiders, family, investors, etc.);
b. Buy/sell or other shareholder agreements;
c. Management/ownership succession (age, health, competence, emergingliquidity needs);
d. Business plans and likely exit strategies of the controlling owner(s); and,
e. Emerging attractiveness for equity offering or acquisition.
2. Required holding period return. To overcome the unattractiveness of the lack ofliquidity, an investor in such securities expects a premium return in excess of thatprovided by liquid alternatives. Investment features that impair marketability will exacthigher expected rates of return which imply higher discounts for lack of marketability.Unattractive features of a lack of liquid security could include the following:
a. Absence, inadequacy of or inability to pay dividends;

Appendix E: Marketability Discount Page 174 of 188
b. Subjective uncertainties related to the duration of the expected holding periodand to achieving a favorable exit date valuation;
c. Restrictive shareholder agreements; and,
d. Various other features that increase uncertainty of cash flows.
3. Growth in underlying value during the holding period. If an investment isappreciating, that growth will provide a portion of the realized return during the holdingperiod. Growth and marketability discounts are negatively correlated. As expected capitalappreciation increases, discounts for lack of marketability decrease. Growth potentialshould be evaluated in the context of management’s business plan, historical growth, andexternal factors such as emerging industry conditions and market valuations.
4. Expected cash flow distributions during the holding period. Holding period returnsare also provided by interim cash flows (in addition to capital appreciation). As withgrowth, holding period cash distributions and discounts for lack of marketability arenegatively correlated. Holding period cash flows (dividends, etc.) should be evaluated inthe context of historical dividend policy, ability to distribute and the cash needs impliedby the business plan.
Empirical StudiesGuidance as to the proper level of the discount can also be found in examining studieswhich have approached the question from several different perspectives.
One approach is to analyze the differences in prices between publicly traded securitiesand those of restricted stocks of the same companies. Since a “lettered” stock is identicalto the traded stock in all respects except marketability, the difference in price highlightsthe marketability discount. Among the more prominent studies are the following:
1. “Discounts Involved in Purchases of Common Stock,” in US 92nd Congress, 1stSession, House, Institutional Investor Study Report of the Securities and ExchangeCommission (Washington, DC: US Government Printing Office, March 10, 1971,5:2444-2456, Document No. 92-64, Part 5);
2. A study of closed end investment funds (Milton Gelman, “An Economist-FinancialAnalyst’s Approach to Valuing Stock of A Closely Held Company,” Journal of Taxation(June 1972), p. 354);
3. A study of prices paid for restricted stocks (Robert E. Maroney, “Most CourtsOvervalue Closely Held Stocks,” Taxes, March 1973, pp. 144-54);
4. A study of prices paid for restricted stocks (J. Michael Maher, “Discounts for Lack ofMarketability for Closely Held Business Interests,” Taxes, September 1976, pp. 562-71;and,
5. A more recent study of restricted stocks (William L. Silber, “Discounts on RestrictedStock: The Impact of Illiquidity on Stock Prices,” Financial Analysts Journal,July/August 1991, pp. 62-64.)

Appendix E: Marketability Discount Page 175 of 188
All of these studies identified median or average discounts in the range of 30-40% forprices of non-marketable stocks in comparison to marketable shares which wereotherwise deemed to be comparable. The SEC Institutional Investor study reflected amean discount of 25.8% while the remainder had average discounts in the range of 33-35%.
A second approach is to analyze the relationship between the prices of companies whoseshares were initially offered to the public (IPO) and the prices at which their sharestraded privately within a five month period immediately preceding the public offering. Aseries of studies conducted by John D. Emory at Robert W. Baird & Co., Inc. indicatemedian and mean lack of marketability discounts of 40% to 45% (see Emory, John D.,“The Value of Marketability as Illustrated in Initial Public Offerings of Common Stock,February 1992 through July 1993,” Business Valuation Review, December 1993, pp. 3-5).
The objective of the Emory studies is to relate the prices at which private transactionstook place before an IPO and the price at which the stock was subsequently offered to thepublic, in order to objectively gauge the value of marketability. The majority of thecompanies in the survey reflected discounts exceeding 30%. The highest discountsindicated in the sample were 82% and 94%.
The implication of the studies is clear: presumably arm’s length transactions taking placewithin a short time of the actual IPOs occur at substantial discounts to the ultimate publicoffering price. These studies support both the validity and magnitude of marketabilitydiscounts in general, and particularly for companies that are not public offeringcandidates and for which the prospects for shareholder liquidity may be remote.
Court DecisionsFurther guidance for marketability discounts can be found in various court decisions.These decisions provide insight into the discounts allowed in various circumstances. «I»look at evidence from court decisions, not to cite as direct evidence in the instant case,but to review how courts have previously interpreted the objective evidence presented. Inaddition, «I» look to court cases for general guidance concerning the nature of evidencedeemed acceptable in previous decisions.
A survey performed by Thomas Solberg (Thomas A. Solberg, “Valuing RestrictedSecurities: What Factors Do the Courts and the Service Look For,” Journal of Taxation,September 1979, pp. 150-54) of fifteen cases indicated a mean discount of 37.4%. Asimilar study by Phillip Moore (Phillip W. Moore, “Valuation Revisited,” Trusts &Estates, February 1987, pp. 40-52), which analyzed fourteen cases by the U.S. Tax Courtfrom 1969 through 1982, indicated wide variations in the decisions but with a trendtoward allowing higher discounts.
In “Estate of Berg” (61 TCM 1991-279), the Tax Court relied upon an expert’s analysisof specific factors that influenced the magnitude of a minority interest discount (20%)and a marketability discount (10%). The expert’s specificity appeared to be persuasive tothe court. Other experts in the Berg case were admonished by the court for presenting
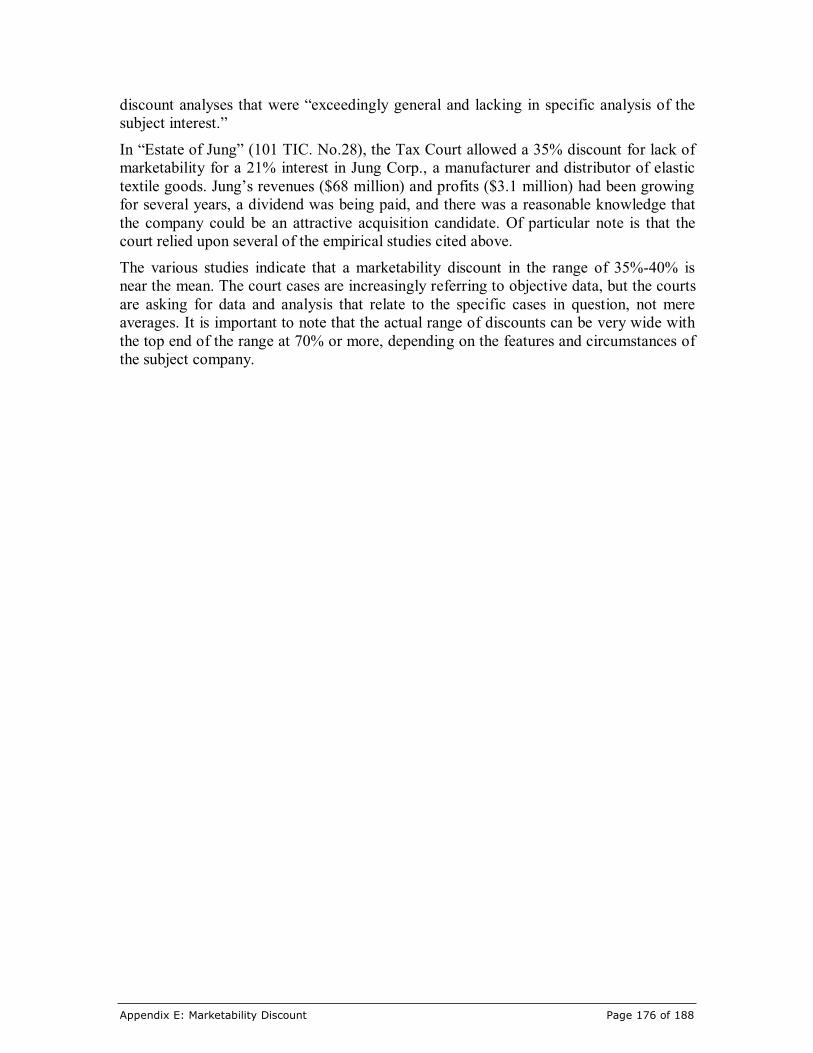
Appendix E: Marketability Discount Page 176 of 188
discount analyses that were “exceedingly general and lacking in specific analysis of thesubject interest.”
In “Estate of Jung” (101 TIC. No.28), the Tax Court allowed a 35% discount for lack ofmarketability for a 21% interest in Jung Corp., a manufacturer and distributor of elastictextile goods. Jung’s revenues ($68 million) and profits ($3.1 million) had been growingfor several years, a dividend was being paid, and there was a reasonable knowledge thatthe company could be an attractive acquisition candidate. Of particular note is that thecourt relied upon several of the empirical studies cited above.
The various studies indicate that a marketability discount in the range of 35%-40% isnear the mean. The court cases are increasingly referring to objective data, but the courtsare asking for data and analysis that relate to the specific cases in question, not mereaverages. It is important to note that the actual range of discounts can be very wide withthe top end of the range at 70% or more, depending on the features and circumstances ofthe subject company.

Appendix F: Glossary Page 177 of 188
APPENDIX F: GLOSSARY
HELPER TEXT
Use Report Writer’s Insert From Word command to insert the Microsoft Word
document file that contains your valuation glossary.
This Glossary was developed jointly by representatives of the American Institute ofCPAs, the American Society of Appraisers, the Canadian Institute of Business Valuers,the Institute of Business Appraisers, and the National Association of Certified ValuationAnalysts.
Adjusted Book Value - the value that results after one or more asset(s) or liabilityamounts are added, deleted, or changed from their respective financial statementamounts.
Appraisal - See Valuation.
Appraisal Approach - See Valuation Approach.
Appraisal Date - See Valuation Date.
Appraisal Method - See Valuation Method.
Appraisal Procedure - See Valuation Procedure.
Asset (Asset-Based) Approach - a general way of determining a value indication of abusiness, business ownership interest, or security by using one or more methods based onthe value of the assets of that business net of liabilities.
Benefit Stream - any level of income, cash flow, or earnings generated by an asset,group of assets, or business enterprise. When the term is used, it should be supplementedby a definition of exactly what it means in the given valuation context.
Beta - a measure of systematic risk of a security; the tendency of a security’s returns tocorrelate with swings in the broad market.
Blockage Discount - an amount or percentage deducted from the current market price ofa publicly traded security to reflect the decrease in the per share value of a block of thosesecurities that is of a size that could not be sold in a reasonable period of time givennormal trading volume.
Business - see Business Enterprise.
Business Enterprise - a commercial, industrial, service, or investment entity, or acombination thereof, pursuing an economic activity.
Business Valuation - the act or process of determining the value of a business enterpriseor ownership interest therein.
Capital Asset Pricing Model (CAPM) - a model in which the cost of capital for anysecurity or portfolio of securities equals a risk free rate plus a risk premium that isproportionate to the systematic risk of the security or portfolio.
Capitalization - a conversion of a single period stream of benefits into value.
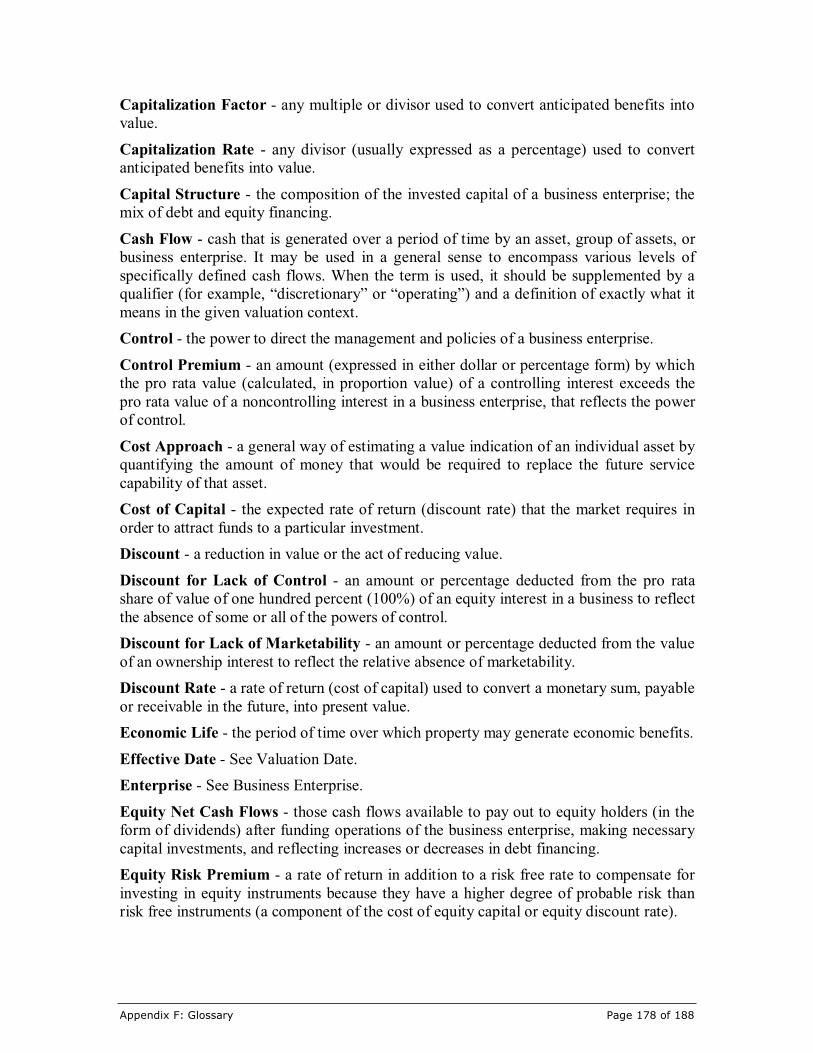
Appendix F: Glossary Page 178 of 188
Capitalization Factor - any multiple or divisor used to convert anticipated benefits intovalue.
Capitalization Rate - any divisor (usually expressed as a percentage) used to convertanticipated benefits into value.
Capital Structure - the composition of the invested capital of a business enterprise; themix of debt and equity financing.
Cash Flow - cash that is generated over a period of time by an asset, group of assets, orbusiness enterprise. It may be used in a general sense to encompass various levels ofspecifically defined cash flows. When the term is used, it should be supplemented by aqualifier (for example, “discretionary” or “operating”) and a definition of exactly what itmeans in the given valuation context.
Control - the power to direct the management and policies of a business enterprise.
Control Premium - an amount (expressed in either dollar or percentage form) by whichthe pro rata value (calculated, in proportion value) of a controlling interest exceeds thepro rata value of a noncontrolling interest in a business enterprise, that reflects the powerof control.
Cost Approach - a general way of estimating a value indication of an individual asset byquantifying the amount of money that would be required to replace the future servicecapability of that asset.
Cost of Capital - the expected rate of return (discount rate) that the market requires inorder to attract funds to a particular investment.
Discount - a reduction in value or the act of reducing value.
Discount for Lack of Control - an amount or percentage deducted from the pro ratashare of value of one hundred percent (100%) of an equity interest in a business to reflectthe absence of some or all of the powers of control.
Discount for Lack of Marketability - an amount or percentage deducted from the valueof an ownership interest to reflect the relative absence of marketability.
Discount Rate - a rate of return (cost of capital) used to convert a monetary sum, payableor receivable in the future, into present value.
Economic Life - the period of time over which property may generate economic benefits.
Effective Date - See Valuation Date.
Enterprise - See Business Enterprise.
Equity Net Cash Flows - those cash flows available to pay out to equity holders (in theform of dividends) after funding operations of the business enterprise, making necessarycapital investments, and reflecting increases or decreases in debt financing.
Equity Risk Premium - a rate of return in addition to a risk free rate to compensate forinvesting in equity instruments because they have a higher degree of probable risk thanrisk free instruments (a component of the cost of equity capital or equity discount rate).

Appendix F: Glossary Page 179 of 188
Excess Earnings - that amount of anticipated benefits that exceeds a fair rate of return onthe value of a selected asset base (often net tangible assets) used to generate thoseanticipated benefits.
Excess Earnings Method - a specific way of determining a value indication of abusiness, business ownership interest, or security determined as the sum of the value ofthe assets obtained by capitalizing excess earnings and the value of the selected assetbase. Also frequently used to value intangible assets. See Excess Earnings.
Fair Market Value - the price, expressed in terms of cash equivalents, at which propertywould change hands between a hypothetical willing and able buyer and a hypotheticalwilling and able seller, acting at arm’s length in an open and unrestricted market, whenneither is under compulsion to buy or sell and when both have reasonable knowledge ofthe relevant facts. {NOTE: In Canada, the term “price” should be replaced with the term“highest price”.}
Forced Liquidation Value - liquidation value at which the asset or assets are sold asquickly as possible, such as at an auction.
Going Concern - an ongoing operating business enterprise.
Going Concern Value - the value of a business enterprise that is expected to continue tooperate into the future. The intangible elements of Going Concern Value result fromfactors such as having a trained work force, an operational plant, and the necessarylicenses, systems, and procedures in place.
Goodwill - that intangible asset arising as a result of name, reputation, customer loyalty,location, products, and similar factors not separately identified.
Goodwill Value - the value attributable to goodwill.
Income (Income-Based) Approach - a general way of determining a value indication ofa business, business ownership interest, security, or intangible asset using one or moremethods that convert anticipated benefits into a present single amount.
Intangible Assets - nonphysical assets (such as franchises, trademarks, patents,copyrights, goodwill, equities, mineral rights, securities and contracts as distinguishedfrom physical assets) that grant rights, privileges, and have economic benefits for theowner.
Invested Capital - the sum of equity and debt in a business enterprise. Debt is typicallylong term liabilities or the sum of short term interest bearing debt and long termliabilities. When the term is used, it should be supplemented by a definition of exactlywhat it means in the given valuation context.
Invested Capital Net Cash Flows - those cash flows available to pay out to equityholders (in the form of dividends) and debt investors (in the form of principle andinterest) after funding operations of the business enterprise and making necessary capitalinvestments.
Investment Risk - the degree of uncertainty as to the realization of expected returns.

Appendix F: Glossary Page 180 of 188
Investment Value - the value to a particular investor based on individual investmentrequirements and expectations. {NOTE: In Canada, the term used is “Value to theOwner.”}
Key Person Discount - an amount or percentage deducted from the value of anownership interest to reflect the reduction in value resulting from the actual or potentialloss of a key person in a business enterprise.
Levered Beta - the beta reflecting a capital structure that includes debt.
Liquidity - the ability to quickly convert property to cash or pay a liability.
Liquidation Value - the net amount that can be realized if the business is terminated andthe assets are sold piecemeal. Liquidation can be either “orderly” or “forced”.
Majority Control - the degree of control provided by a majority position.
Majority Interest - an ownership interest greater than fifty percent (50%) of the votinginterest in a business enterprise.
Market (Market-Based) Approach - a general way of determining a value indication ofa business, business ownership interest, security, or intangible asset by using one or moremethods that compare the subject to similar businesses, business ownership interests,securities, or intangible assets that have been sold.
Marketability - the ability to quickly convert property to cash at minimal cost.
Marketability Discount - See Discount for Lack of Marketability.
Minority Discount - a discount for lack of control applicable to a minority interest.
Minority Interest - an ownership interest less than fifty percent (50%) of the votinginterest in a business enterprise.
Net Book Value - with respect to a business enterprise, the difference between totalassets (net of accumulated depreciation, depletion, and amortization) and total liabilitiesof a business enterprise as they appear on the balance sheet (synonymous withShareholder’s Equity); with respect to an intangible asset, the capitalized cost of anintangible asset less accumulated amortization as it appears on the accounting books ofthe business enterprise.
Net Cash Flow - a form of cash flow. When the term is used, it should be supplementedby a qualifier (for example, “Equity” or “Invested Capital”) and a definition of exactlywhat it means in the given valuation context.
Net Tangible Asset Value - the value of the business enterprise’s tangible assets(excluding excess assets and nonoperating assets) minus the value of its liabilities.{NOTE: In Canada, tangible assets also include identifiable intangible assets.}
Nonoperating Assets - assets not necessary to ongoing operations of the businessenterprise. {NOTE: In Canada, the term used is “Redundant Assets.”}
Orderly Liquidation Value - liquidation value at which the asset or assets are sold overa reasonable period of time to maximize proceeds received.
Appendix F: Glossary Page 181 of 188
Premise of Value - an assumption regarding the most likely set of transactionalcircumstances that may be applicable to the subject valuation; e.g. going concern,liquidation.
Portfolio Discount - an amount or percentage that may be deducted from the value of abusiness enterprise to reflect the fact that it owns dissimilar operations or assets that maynot fit well together.
Rate of Return - an amount of income (loss) and/or change in value realized oranticipated on an investment, expressed as a percentage of that investment.
Redundant Assets - {NOTE: In Canada, see “Nonoperating Assets.”}
Report Date - the date conclusions are transmitted to the client.
Replacement Cost New - the current cost of a similar new property having the nearestequivalent utility to the property being valued.
Reproduction Cost New - the current cost of an identical new property.
Residual Value - the prospective value as of the end of the discrete projection period in adiscounted benefit streams model.
Risk Free Rate - the rate of return available in the market on an investment free ofdefault risk.
Risk Premium - a rate of return in addition to a risk free rate to compensate the investorfor accepting risk.
Rule of Thumb - a mathematical relationship between or among variables based onexperience, observation, hearsay, or a combination of these, usually applicable to aspecific industry.
Special Interest Purchasers - acquirers who believe they can enjoy post-acquisitioneconomies of scale, synergy, or strategic advantages by combining the acquired businessinterest with their own.
Standard of Value - the identification of the type of value being utilized in a specificengagement; e.g. fair market value, fair value, investment value.
Sustaining Capital Reinvestment - the periodic capital outlay required to maintainoperations at existing levels, net of the tax shield available from such outlays.
Systematic Risk - the risk that is common to all risky securities and cannot be eliminatedthrough diversification. When using the capital asset pricing model, systematic risk ismeasured by beta.
Terminal Value - See Residual Value.
Unlevered Beta - the beta reflecting a capital structure without debt.
The Risk Management Association – Formerly know as Robert Morris Associates.
Unsystematic Risk - the portion of total risk specific to an individual security that can beavoided through diversification.

Appendix F: Glossary Page 182 of 188
Valuation - the act or process of determining the value of a business, business ownershipinterest, security, or intangible asset.
Valuation Approach - a general way of determining a value indication of a business,business ownership interest, security, or intangible asset using one or more valuationmethods.
Valuation Date - the specific point in time as of which the valuator’s opinion of valueapplies (also referred to as “Effective Date” or “Appraisal Date”).
Valuation Method - within approaches, a specific way to determine value.
Valuation Procedure - the act, manner, and technique of performing the steps of anappraisal method.
Valuation Ratio - a fraction in which a value or price serves as the numerator andfinancial, operating, or physical data serve as the denominator.
Value to the Owner - {NOTE: In Canada, see Investment Value.}
Weighted Average Cost of Capital (WACC) - the cost of capital (discount rate)determined by the weighted average at market value of the cost of all financing sources inthe business enterprise’s capital structure.

Exhibits Page 183 of 188
EXHIBITS
HELPER TEXT
Include any exhibits in this section. You can use Report Writer’s Paste Link command
to insert data from Microsoft Excel or Word.