
BUSINESS VALUATION & FINANCIAL ADVISORY SERVICES … · BUSINESS VALUATION & FINANCIAL ADVISORY...
12
BUSINESS VALUATION & FINANCIAL ADVISORY SERVICES Segment Focus: Agriculture Chemicals Overview 1 Fertilizer 2 Pesticide 4 Agricultural Chemicals Recent M&A Activity 6 Agribusiness Industry Commodity Prices 8 Publicly Traded Agriculture Companies 9 Indices Performance 10 Historical EV / EBITDA Multiples 10 About Mercer Capital 11 Q1: Agriculture Machinery, Equipment & Implements Q2: Crops & Crop Services Q3: Agriculture Real Estate Q4: Agriculture Chemicals SEGMENT FOCUS Agriculture Chemicals 2016 www.mercercapital.com VALUE FOCUS Agribusiness Industry
Transcript of BUSINESS VALUATION & FINANCIAL ADVISORY SERVICES … · BUSINESS VALUATION & FINANCIAL ADVISORY...

BUSINESS VALUATION & FINANCIAL ADVISORY SERVICES
Segment Focus: Agriculture Chemicals Overview 1
Fertilizer 2
Pesticide 4
Agricultural Chemicals Recent M&A Activity 6
Agribusiness Industry Commodity Prices 8
Publicly Traded Agriculture Companies 9
Indices Performance 10
Historical EV / EBITDA Multiples 10
About Mercer Capital 11
Q1: Agriculture Machinery, Equipment & Implements
Q2: Crops & Crop Services
Q3: Agriculture Real Estate
Q4: Agriculture Chemicals
SEGMENT FOCUS Agriculture Chemicals 2016
www.mercercapital.com
VALUE FOCUS
Agribusiness Industry

© 2017 Mercer Capital // www.mercercapital.com 1
Mercer Capital’s Value Focus: Agribusiness Industry Fourth Quarter 2016
Agricultural chemical producers and manufacturers have experienced a decline in revenues due to weak demand from
farmers as crop prices have remained low. According to the USDA farm income forecast for 2017, U.S. net cash farm
income is projected to rebound only slightly (an increase of 1.8%), following three years of decline. The 2017 projected level
is 31% below the 2013 peak. When adjusted for noncash expenses, U.S. net farm income is projected to decline 8.7%.
Prices for most major field crops are expected to continue their downward trajectory in 2017, with the exception of soybeans
and cotton. Rising yields and growing inventories have put downward pressure on crop prices and will require farmers to
plant fewer acres further reducing the demand for fertilizers and pesticides. Farmers are projected to cut expenses on
agricultural chemicals such as fertilizer and pesticides by 5.4%, which would mark the first three year decline since 1987.
Lower or stagnating farm incomes should increase farmers’ price sensitivity for inputs which may favor low cost pro-
ducers relative to the rest of the industry. Many chemical producers invested in expanded production capabilities when
crop prices peaked several years ago, which may contribute to oversupply and weigh on chemical prices. Mergers and
acquisitions activity has been strong in the agricultural chemicals industry over the past few years, and revenue pres-
sures and the potential for cost savings may spur further deal activity.
Overview
SEGMENT FOCUS
Agriculture Chemicals
U.S. Farm Sector Income Statement (2012-2017F) // ($ billions)
2012 2013 2014 2015 2016F 2017F
Crops 231.6 220.8 211.4 185.7 187.7 186.7
Livestock 169.8 182.7 212.8 189.8 168.1 168.2
Direct Government Payments 10.6 11.0 9.8 10.8 13.0 12.5
Other Farm-related Income 39.3 41.0 36.6 34.4 30.7 34.4
Gross Cash Income $451.3 $455.5 $470.5 $420.6 $399.5 $401.8
Noncash Income 18.3 17.7 16.9 17.8 18.8 19.9
Value of Inventory Adjustment (19.8) 10.6 (4.3) 1.3 (0.1) (9.3)
Total Gross Income $449.8 $483.8 $483.1 $439.7 $418.2 $412.4
Total Expenses 353.3 360.1 390.5 358.8 349.9 350.0
Net Cash Farm Income $96.5 $123.7 $92.6 $80.9 $68.3 $62.3
Source: USDA WASDE Report, February 7, 2017

© 2017 Mercer Capital // www.mercercapital.com 2
Mercer Capital’s Value Focus: Agribusiness Industry Fourth Quarter 2016
The fertilizer manufacturing industry produces fertilizer products, primarily consisting of phosphorous-based and nitro-
gen-based fertilizers. Nearly 80% of industry products are used for various agricultural products, making the industry
highly correlated with the general farming economy.
Along with the impact of the decline in crop prices discussed above, the decline in natural gas prices, a key input for
nitrogen fertilizers, will put further pressure on fertilizer prices. Overproduction may prove most costly for potash, where
expansion takes more time and it is difficult to pull capacity off line for short periods of time. As farmers cut costs on
fertilizer, underutilization presents a challenge for small and high-cost producers. Potash and phosphate producers are
more vulnerable in the short run because foregoing or delaying the use of potash or phosphate has a less immediate
impact on crop yields than nitrogen.
Fertilizer
Fertilizer Manufacturing Industry Revenue
0
2
4
6
8
10
12
14
0
5,000
10,000
15,000
20,000
25,000
30,000
35,000
2008 2009 2010 2011 2012 2013 2014 2015 2016 2017 2018 2019
Dem
and
from
Cro
p Pr
oduc
tion
($ m
illio
ns)
Indu
stry
Rev
enue
($
mill
ions
)
Revenue Demand from Crop ProductionSource: IBISWorld Report

© 2017 Mercer Capital // www.mercercapital.com 3
Mercer Capital’s Value Focus: Agribusiness Industry Fourth Quarter 2016
The nearly $25 billion industry is dominated by a handful of large multinational corporations. Four fertilizer manufac-
turing companies comprise a majority of overall market share due to factors such as access to natural resources and key
inputs, along with intense price competition. Industry revenue declined 9.6% in 2014 as the drop in crop and fertilizer
prices initiated a multi-year period of falling revenue (as shown in the chart on page 2). Reduced demand from crop
production and lower farm incomes, along with technological breakthroughs reducing the need for industry products, will
continue to keep revenue growth low in the short term until farmer demand and fertilizer prices start to increase again.
A large quantity of U.S. fertilizer consumption is supplied by imports. The USDA reports that in 2011 (most recent
data available) more than 85% of the potash supply used in U.S. was imported. In the future, the U.S., with its limited
domestic nitrogen and potash production capacity, will consume an even larger portion of these fertilizers from foreign
imports. U.S. phosphate production, however, is overwhelmingly domestic. U.S. manufacturers produce more than
90% of U.S. consumed phosphate, and over 60% of phosphate produced in the U.S. is exported. Key export markets
include Canada and Brazil.
Natural gas is the main raw material used to produce nitrogen fertilizer (35.3%), the second most popular type of fertil-
izer behind phosphate based fertilizer (44.4%). Energy price trends over the past five years have benefitted the industry,
lowering manufacturing costs. Natural gas prices have started to increase after falling to lows of $1.73 per million Btu
in early 2016 but still remain below the highs of 2014.
Fertilizer (continued)
Henry Hub Natural Gas Spot Price
0.00.51.01.52.02.53.03.54.0
Jan-2015 Apr-2015 Jul-2015 Oct-2015 Jan-2016 Apr-2016 Jul-2016 Oct-2016
Dol
lars
per
Mill
ion
Btu
Source: EIA

© 2017 Mercer Capital // www.mercercapital.com 4
Mercer Capital’s Value Focus: Agribusiness Industry Fourth Quarter 2016
Pesticide manufacturers cover a wide variety of products for household and agricultural pest control. Herbicides
(53%), fungicides (25%), and insecticides (19%) make up the majority of industry products. Crop industries in the U.S.
accounted for nearly 65% of pesticide manufacturing revenue in 2016, followed by exports (24%) and household/other
uses (11%). In 2012, over 60% of all herbicide treatments were applied to corn and soybean crops, while citrus and
cotton crops received more than 50% of all insecticide treatments.
Like fertilizers, pesticide industry revenue has been volatile over the past five years as reduced farm incomes led to
a significant decline in 2014 that has continued through 2016. Revenue is projected to stagnate over the next couple
of years as farmers cut costs and reduce acres planted. However, oil is a major input for pesticide manufacturers and
operators in the pesticide manufacturing industry have benefitted from the sharp drop in prices since the second half of
2014 due to the crude oil glut.
Pesticide
Pesticide Manufacturing Industry Revenue
0
500
1,000
1,500
2,000
2,500
3,000
3,500
0
2,000
4,000
6,000
8,000
10,000
12,000
14,000
16,000
18,000
20,000
2008 2009 2010 2011 2012 2013 2014 2015 2016 2017 2018 2019
Net
Exp
orts
($
mill
ions
)
Indu
stry
Rev
enue
($
mill
ions
)
Revenue Net ExportsSource: IBISWorld Report

© 2017 Mercer Capital // www.mercercapital.com 5
Mercer Capital’s Value Focus: Agribusiness Industry Fourth Quarter 2016
The U.S. pesticide manufacturing industry is a net exporter of industry products, and the importance of exports is
expected to increase moving forward as reduced U.S. farm incomes temper demand. Exports accounted for $3.5 bil-
lion in industry revenue in 2016, 24% of overall revenue, with Canada (28%), Brazil (19%), Mexico (8%), and China (6%)
constituting the industry’s major trading targets. Export totals increased over 11% from 2009 to 2014, due to Brazil’s
economic growth and a weak U.S. dollar. A strengthening U.S. dollar over the second half of 2014 dampened export
totals for both fertilizer and pesticides. The Wall Street Journal Dollar index, which measures the U.S. dollar against
a number of currencies, rose 2.5% in 2016 and remains at multi-year highs. Future dollar appreciation may hurt U.S.
exports going forward, negatively affecting the profitability of both fertilizer and pesticide manufacturers.
As farmers continue to cut costs and look for ways to more efficiently employ their crop inputs, more farmers will adapt
the use of new farm data management practices and technologies such as variable rate seeding. Variable rate seeding
helps farmers alter their seeding rates according to specific field variables which increases seed utilization efficiency
and minimizes total costs. According to a Purdue University farm retail survey, the use of variable rate seeding and other
pesticide technologies reached new highs in 2015. Data management services and offerings may provide competitors
an advantage as overall demand for chemicals and seeds stagnates.
Additionally, the increasing implementation of genetically modified crops has hurt industry product demand, as new
seeds are created with a resistance to many agricultural diseases and pests. In addition, the growing trend of organic
farming avoids the use of synthetic chemical pesticides, opting instead to use production practices and natural means
to reduce pests.
Pesticide (continued)

© 2017 Mercer Capital // www.mercercapital.com 6
Mercer Capital’s Value Focus: Agribusiness Industry Fourth Quarter 2016
There were 37 transactions announced or closed in 2016 in the agricultural chemicals sector. According to data from
Capital IQ, total deal volume for the industry (represented by SIC Code 2870) was over $137 billion for the period, with
an average transaction value of $3.7 billion.* Given the global nature of the industry, transaction volume includes a sig-
nificant number of cross-border deals.
Major Transactions
• February 3, 2016: China National Chemical Corp., a Chinese government-owned manufacturer of chemical
products, placed a $43 billion offer to buy Syngenta AG, a Switzerland-based pesticide and seed company. If
successful, the acquisition would be the largest foreign deal completed by a Chinese company. The deal is still
pending approval from government officials due to antitrust and potential national security concerns. For Chem-
China, the deal would provide access to Syngenta’s developed biotechnology, and Syngenta would gain access
to the massive Chinese market.
• December 19, 2016: The Mosaic Company entered into an agreement to purchase the majority of Brazilian
mining firm Vale SA’s fertilizer business for $2.5 billion. The deal is expected to close by the end of 2017. Vale
will use the proceeds of the deal to pay down debt accumulated during the period of low commodity prices while
The Mosaic Company will gain a foothold in the promising Brazilian fertilizer market. Brazil is viewed as a key
market for growth in fertilizers and agriculture and represents a strong export market for U.S. producers.
* Capital IQ. Deal Volume and Averages are derived from disclosed deal information.
Agricultural Chemicals Recent M&A Activity

© 2017 Mercer Capital // www.mercercapital.com 7
Mercer Capital’s Value Focus: Agribusiness Industry Fourth Quarter 2016
• September 12, 2016: Two Canadian firms, Agrium Inc. and Potash Corp. of Saskatchewan, agreed to a merger
that would produce a combined company worth $27 billion. Potash Corp. is the world’s largest fertilizer producer
in terms of capacity and Agrium is the biggest retailer of fertilizer, seeds, and equipment in North America. The
deal would strengthen Agrium’s supply of Potash and other fertilizer ingredients while protecting Potash from
volatile fertilizer prices and providing a stronger distribution network. The combined company would potentially
control 60% of North American capacity.
Further deals may materialize as a lack of organic growth opportunities will place pressure on firms to cut costs and
pursue other means of growth. Despite weak earnings growth, significant M&A deals have helped bolster agricultural
chemical company valuations. However, according to Bloomberg Intelligence, chemicals mergers between large, estab-
lished firms have performed worse historically than bolt-on acquisitions. Over the past 20 years, the return on capital fell
an average 2% in the three years after a chemicals deal. Megadeals raised return on capital only half as often as smaller
deals. Too much further M&A activity may signal a potential economic downturn as recessions have followed two of the
last three large M&A waves in the agricultural chemicals industry.
Agricultural Chemicals Recent M&A Activity (continued)
Mercer Capital’s Value Focus: Agribusiness Industry Fourth Quarter 2016
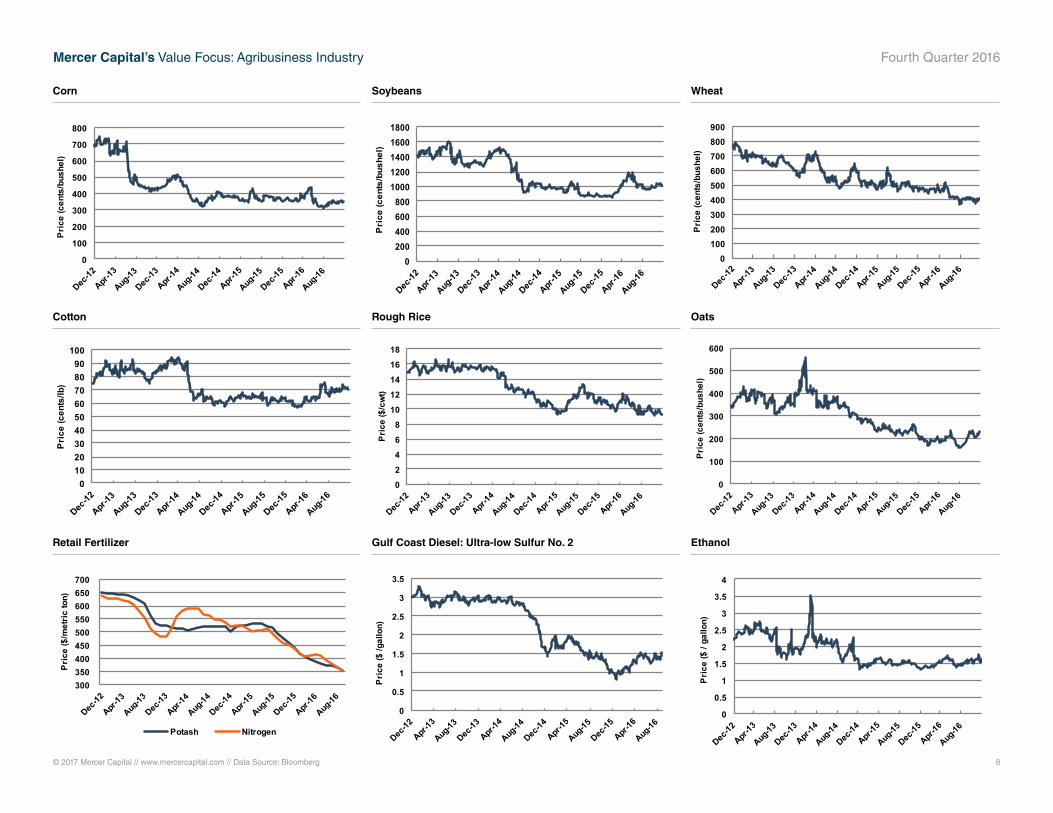
© 2017 Mercer Capital // www.mercercapital.com // Data Source: Bloomberg 8
0
100
200
300
400
500
600
700
800
Pric
e (c
ents
/bus
hel)
0200400600800
10001200140016001800
Pri
ce (c
ents
/bus
hel)
0100200300400500600700800900
Pric
e (c
ents
/bus
hel)
Corn Soybeans Wheat
0102030405060708090
100
Pric
e (c
ents
/lb)
02468
1012141618
Pric
e ($
/cwt
)
0
100
200
300
400
500
600
Pric
e (c
ents
/bus
hel)
Cotton Rough Rice Oats
300 350 400 450 500 550 600 650 700
Pric
e ($
/met
ric to
n)
Potash Nitrogen
0
0.5
1
1.5
2
2.5
3
3.5
Pric
e ($
/gal
lon)
0
0.5
1
1.5
2
2.5
3
3.5
4
Pri
ce ($
/ ga
llon)
Retail Fertilizer Gulf Coast Diesel: Ultra-low Sulfur No. 2 Ethanol

© 2017 Mercer Capital // www.mercercapital.com 9
Mercer Capital’s Value Focus: Agribusiness Industry Fourth Quarter 2016
Company Name Ticker
Price12/31/16
($)
52 Wk Perform(Market
Cap)
LTM Revenue
($)
Enterprise Value ($M)
Debt/MVTC
EBITDA Margin
EV / LTM EBITDA
(x)
TEV / Nxt Yr EBITDA
(x)
Price/ LTM
Earnings (x)
Diversified Agribusiness
Agrium Inc. TSX:AGU 100.47 12.7% 13,665 19,692 26.0% 11.5% 12.56 10.95 23.42
CF Industries Holdings, Inc. NYSE:CF 31.48 -22.9% 3,685 14,444 40.0% 33.6% 11.66 12.06 NM
The Mosaic Company NYSE:MOS 29.33 6.3% 7,163 13,533 28.2% 16.8% 11.26 12.14 34.51
Potash Corporation of Saskatchewan Inc. TSX:POT 18.08 5.9% 3,921 19,678 23.3% 31.8% 15.79 13.77 46.97
Intrepid Potash, Inc. NYSE:IPI 2.08 -29.5% 164 278 48.0% -5.4% NM 12.78 NM
Terra Nitrogen Company, L.P. NYSE:TNH 102.71 1.1% 418 1,927 0.0% 59.8% 7.72 NM 13.53
Yara International ASA OB:YAR 39.51 -8.7% 11,068 12,259 15.7% 13.9% 7.99 7.62 14.62
Monsanto Company NYSE:MON 105.21 6.8% 13,933 53,611 16.1% 28.8% 13.36 13.72 28.79
Syngenta AG SWX:SYNN 396.25 1.1% 12,790 39,573 9.2% 20.5% 15.11 13.93 30.95
Archer-Daniels-Midland Company NYSE:ADM 45.65 24.5% 62,346 32,441 21.4% 4.1% 12.78 9.78 20.99
Bunge Limited NYSE:BG 72.24 5.8% 42,679 15,724 30.5% 3.9% 9.42 8.02 14.07
Median - Diversified Agribusiness 6% 11,068 15,724 23.3% 16.8% 12.11 12.10 23.42
Agricultural Machinery & Equipment
Manufacturers
Deere & Company NYSE:DE 103.04 35% 26,549 64,889 55.0% 14.4% 17.02 17.98 21.32
AGCO Corporation NYSE:AGCO 57.86 27% 7,411 6,403 26.6% 7.8% 11.14 11.69 29.42
Lindsay Corporation NYSE:LNN 74.61 3% 505 809 14.5% 8.3% 19.27 13.57 56.50
Median - Manufacturers 27% 7,411 6,403 26.6% 8.3% 17.02 13.57 29.42
Dealers
Titan Machinery Inc. NasdaqGS:TITN 14.57 33% 1,231 759 66.2% 1.8% 34.77 28.40 NM
Rocky Mountain Dealerships Inc. TSX:RME 7.21 60.4% 693 384 67.4% 4.6% 11.95 13.42 12.55
Cervus Equipment Corporation TSX:CERV 11.80 23.5% 826 371 34.7% 4.2% 10.74 9.07 10.48
Median - Dealers 33% 826 384 66.2% 4.2% 11.95 13.42 11.52
Source: Capital IQ
Publicly Traded Agribusiness Companies

© 2017 Mercer Capital // www.mercercapital.com 10
Mercer Capital’s Value Focus: Agribusiness Industry Fourth Quarter 2016
40
60
80
100
120
140
160
Dec-15 Jan-16 Feb-16 Mar-16 Apr-16 May-16 Jun-16 Jul-16 Aug-16 Sep-16 Oct-16 Nov-16
MCM Diversified Ag Index MCM Ag Machinery Manufacturing IndexMCM Ag Machinery Dealer Index S&P 500
6/30/2015 = 100
Mercer Capital Agriculture Indices: One Year Performance
5.00
7.00
9.00
11.00
13.00
15.00
17.00
19.00
12/31/14 3/31/15 6/30/15 9/30/15 12/31/15 3/31/16 6/30/16 9/30/16 12/31/16
Diversified Ag Equip Manufacturers Equip Dealers
Historical EV / EBITDA Multiples
Source: Yahoo! Finance
Source: Capital IQ
Mercer CapitalAgribusiness Industry Services
Contact Us
Copyright © 2017 Mercer Capital Management, Inc. All rights reserved. It is illegal under Federal law to reproduce this publication or any portion of its contents without the publisher’s permission. Media quotations with source attribution are encouraged. Reporters
requesting additional information or editorial comment should contact Barbara Walters Price at 901.685.2120. Mercer Capital’s Industry Focus is published quarterly and does not constitute legal or financial consulting advice. It is offered as an information service to
our clients and friends. Those interested in specific guidance for legal or accounting matters should seek competent professional advice. Inquiries to discuss specific valuation matters are welcomed. To add your name to our mailing list to receive this complimentary
publication, visit our web site at www.mercercapital.com.
Mercer Capital has expertise providing business valuation and financial advisory services to companies in the agribusiness industry.
Industry Segments
Mercer Capital serves the following industry segments:
• Agriculture Machinery, Equipment, & Implements
• Crop and Crop Services
• Agriculture Real Estate
• Agriculture Chemicals
Contact a Mercer Capital professional to discuss your needs in confidence.
Nicholas J. Heinz, ASA
901.322.9788
Timothy R. Lee, ASA
901.322.9740
Laura J. Stevens, CFA, ASA
901.322.9764
Brian F. Adams
901.322.9706
MERCER CAPITAL
Memphis
5100 Poplar Avenue, Suite 2600
Memphis, Tennessee 38137
901.685.2120
Dallas
12201 Merit Drive, Suite 480
Dallas, Texas 75251
214.468.8400
Nashville
102 Woodmont Blvd., Suite 231
Nashville, Tennessee 37205
615.345.0350
www.mercercapital.com
BUSINESS VALUATION & FINANCIAL ADVISORY SERVICES
Services Provided
• Valuation of agriculture companies
• Transaction advisory for acquisitions and divestitures
• Valuations for purchase accounting and impairment
testing
• Fairness and solvency opinions
• Litigation support for economic damages and valuation
and shareholder disputes


