Business Subsidies in Canada report - Home - The … Lester SUMMARY Business subsidies in Canada:...
34
www.policyschool.ca PUBLICATIONS PUBLICATIONS SPP Research Paper SPP Research Paper Volume 11:1 January 2018 http://dx.doi.org/10.11575/sppp.v11i0.43144 BUSINESS SUBSIDIES IN CANADA: COMPREHENSIVE ESTIMATES FOR THE GOVERNMENT OF CANADA AND THE FOUR LARGEST PROVINCES John Lester SUMMARY Business subsidies in Canada: the “winner” is Alberta; the loser is the taxpayer The federal government and the four largest provinces in Canada spend about $29 billion a year on business subsidies, delivered through program spending, the tax system, government business enterprises and direct investments by government. These subsidies represent almost half of the corporate income tax revenue collected by the five jurisdictions. Surprisingly, given its reputation as a bastion of free enterprise, Alberta is the most prolific subsidizer. In the 2014-15 fiscal year, per person subsidies were $640 in Alberta, about $100 ahead of the next most generous jurisdiction, Québec. Alberta has probably added to its “lead” through measures introduced in the October 2015 Fiscal Update and the 2016 budget. Alberta also stands out by having the least transparent public reporting of business subsidies. What motivates governments to subsidize business? Abstracting from cynical efforts to win votes, business subsidies have two broad objectives: to improve economic performance and to achieve a social objective by supporting specific firms, industries or regions. On average in the five jurisdictions, the split between the two categories is about 70-30 in favour of economic development measures. Assessing value for money from programs with a social objective is subjective, but measures intended to improve economic performance should be assessed on their ability to raise real income. Business subsidies can only raise real income if markets fail to allocate labour and capital to their best uses. The classic case is R&D. When a firm undertakes R&D, some of the knowledge created inevitably spills over to the benefit other firms. Firms are focused on their own benefits and costs when deciding how much to spend on R&D, not the benefits received
-
Upload
phungduong -
Category
Documents
-
view
214 -
download
0
Transcript of Business Subsidies in Canada report - Home - The … Lester SUMMARY Business subsidies in Canada:...
www.policyschool.ca
PUBLICATIONSPUBLICATIONSSPP Research PaperSPP Research Paper
Volume 11:1 January 2018
http://dx.doi.org/10.11575/sppp.v11i0.43144
BUSINESS SUBSIDIES IN CANADA: COMPREHENSIVE ESTIMATES FOR THE GOVERNMENT OF CANADA AND THE FOUR LARGEST PROVINCES
John Lester
SUMMARY
Business subsidies in Canada: the “winner” is Alberta; the loser is the taxpayer
The federal government and the four largest provinces in Canada spend about $29 billion a year on business subsidies, delivered through program spending, the tax system, government business enterprises and direct investments by government. These subsidies represent almost half of the corporate income tax revenue collected by the five jurisdictions.
Surprisingly, given its reputation as a bastion of free enterprise, Alberta is the most prolific subsidizer. In the 2014-15 fiscal year, per person subsidies were $640 in Alberta, about $100 ahead of the next most generous jurisdiction, Québec. Alberta has probably added to its “lead” through measures introduced in the October 2015 Fiscal Update and the 2016 budget. Alberta also stands out by having the least transparent public reporting of business subsidies.
What motivates governments to subsidize business? Abstracting from cynical efforts to win votes, business subsidies have two broad objectives: to improve economic performance and to achieve a social objective by supporting specific firms, industries or regions. On average in the five jurisdictions, the split between the two categories is about 70-30 in favour of economic development measures.
Assessing value for money from programs with a social objective is subjective, but measures intended to improve economic performance should be assessed on their ability to raise real income. Business subsidies can only raise real income if markets fail to allocate labour and capital to their best uses. The classic case is R&D. When a firm undertakes R&D, some of the knowledge created inevitably spills over to the benefit other firms. Firms are focused on their own benefits and costs when deciding how much to spend on R&D, not the benefits received
by other firms, so society has an interest in encouraging additional R&D. While markets generally do a good job allocating capital to its most productive uses, governments express concern about the ability of small firms to access external financing. Just over half of business subsidies are intended to address these two issues.
Governments also provide subsidies in order to create what are often described as “good jobs,” meaning employment in high-wage, high-productivity industries. There is ample evidence that wages differ by sector even after differences in worker skills and working conditions are taken into account. That opens up the possibility that subsidizing high-wage jobs will make us better off. Almost 10 per cent of government subsidies are pursuing “industrial policy” objectives.
But real income won't necessarily go up, even in these circumstances. Benefit-cost analyses of key programs suggest that, at best, only a third of subsidies intended to raise real income achieve their objective. The main reason these subsidies are unsuccessful is that they have to be funded, either by raising taxes or cutting program spending, both of which harm economic performance. And avoiding the pitfall of excessive subsidization can be challenging. For example, small firms performing R&D get about 43% of their funding from governments, which is substantially beyond an effective level. Industrial policy measures are particularly tricky to get right. Governments have to identify sectors and firms that pay a premium for a given set of skills and working conditions, determine the subsidy that generates a social benefit net of the costs of providing assistance and avoid transferring income from low to high-wage taxpayers.
With so much money at play, business subsidies should be reported more transparently and managed more effectively. For greater transparency, governments should prepare a comprehensive annual report on business subsidies delivered through program spending, the tax system and through the activities of government business enterprises. The report would describe the programs, state their objectives and report funding levels. When discussing program objectives, the report should set out in general terms the expected benefits and costs of government intervention and discuss who benefits from the measure and who is expected to pay for it. Making a commitment to set out the expected benefits and costs of all new business subsidies as they are introduced might prevent the worst offenders from being implemented in the first place.

1
SUMMARYGovernments provide support to business through a number of channels, including spending programs, the tax system, direct investment and the activities of government business enterprises. This paper presents the first comprehensive estimates of such assistance, or “business subsidies,” for the federal government and the four largest provinces: British Columbia (B.C.), Alberta, Ontario and Quebec. The paper provides a snapshot of overall business subsidies in 2014–15, the latest year for which data are available for all five jurisdictions. A 10-year perspective is also provided for all jurisdictions except Alberta, which began publishing tax expenditure estimates in 2013. The paper provides assessments of some key programs and makes recommendations for improving the way business subsidies are reported by governments.
Federal government business subsidies amounted to $14 billion in 2014–15. Business subsidies amounted to $14.6 billion in the four provinces. Per capita subsidies were largest in Alberta at $640 and lowest in B.C. and the federal government, with both at $390. The tax system is by far the preferred delivery vehicle in all jurisdictions except Quebec, accounting for almost half to two-thirds of overall subsidies. Subsidies are highly concentrated in all jurisdictions except Quebec. For example, small business accounts for about 40 to 60 per cent of business subsidies in all jurisdictions except Quebec, where the small-business share is just under 20 per cent. Budgets tabled since 2014–15 suggest that the level of business subsidies will remain relatively stable in the near term in B.C. and Quebec. Increases are likely in Ontario and at the federal level. Announced increases in Alberta are more substantial, particularly when measured on an accrual basis.
Over the 10-year period ending in 2014–15, federal real per capita subsidies rose substantially during the economic downturn but were trimmed sharply thereafter. The net change over the period was a decline of nine per cent. Subsidies in Quebec had a similar profile, but the increase was more substantial and the reduction more subdued. The net increase over the period was 25 per cent. Real per capita subsidies in Ontario were on an upward trend until 2012–13; small reductions in the following two years resulted in a net increase of 43 per cent over the 10-year period. In B.C., there was a sharp downward correction to business subsidies in 2006–07, but this was almost completely offset by increases over the three years ending in 2014–15.
Governments provide business subsidies for a number of reasons, including to address market failures, to promote high-wage, high-productivity industries and to transfer income. Measures in the first category clearly have the potential to improve economic performance, with the impact depending on the size of the benefits relative to the costs of providing assistance. There is much less of a consensus on the ability of measures in the second category, which are often labelled “industrial policies,” to improve economic performance, primarily because governments have to choose which industries and firms to support. About 70 per cent of business subsidies fall into the first two categories. Benefit-cost analyses of key programs suggest that, at best, only a third of spending in these categories, or about a fifth of overall subsidies, succeeds in raising real income.
Governments should be more transparent in reporting business subsidies. Quebec and the federal government provide the most useful information on subsidies. Both of these governments classify program-spending subsidies by recipient class: businesses, individuals, non-profits and other levels of government. Quebec takes the additional step of identifying subsidies received by business both directly and indirectly through other levels of government and non-profit organizations. This approach should be adopted by other jurisdictions. On the other hand, Quebec undertakes a substantial fraction of its spending on subsidies through special funds, most of which provide only minimal detail on revenues and expenditures. It is therefore difficult to identify the beneficiaries of their spending. The federal government and Quebec both publish comprehensive documentation of tax expenditures. Quebec presents estimates for all tax bases while the federal estimates do not include excise taxes, a deficiency that should be remedied. The federal estimates are available in digital format for an extended historical period, which is an example for other jurisdictions to follow.
2
Subsidies delivered through spending programs are reasonably well documented in B.C. and Ontario, but the amount received by business, either directly or indirectly, is not identified. Alberta reports subsidies by ministry, but the data are not presented by program, which is a serious lack of transparency. As a result, the only way to determine business subsidies delivered through program spending in Alberta is to file access to information requests. Ontario, Alberta and B.C. provide comprehensive estimates of tax expenditures. However, documentation is less detailed in the Ontario accounts than for Quebec or the federal government and is sparse for Alberta and B.C. All three jurisdictions present estimates for a single year in their annual publications. These provinces should adopt the reporting standards of the federal government and Quebec.
1. INTRODUCTIONIn this paper, I present estimates of assistance, or subsidies, provided to private businesses by the government of Canada and the four largest provinces: British Columbia (B.C.), Alberta, Ontario and Quebec. These four provinces account for about 85 per cent of Canada’s GDP and population. The estimates in this paper are comprehensive in the sense that they include measures delivered through direct spending programs, through the tax system, through direct investments in firms, through loan-guarantee programs and through the activities of government business enterprises (GBEs). The assistance, or burden, of regulatory initiatives is not included. In order to develop the estimates, I supplemented publicly available information on business subsidies with data obtained from access-to-information requests. In addition, I examined the annual reports and financial statements of GBEs to determine the extent that their activities effectively subsidize business and quantified the amount of the subsidy.
The next section of the paper reviews the rationales for government intervention. A discussion of the data sources and methodology used in the study is presented in Section 3, which also includes recommendations for improving how governments report business subsidies. Section 4 provides a snapshot of overall business subsidies in 2014–15. Subsidies are classified by delivery instrument, sector, activity and rationale. Section 5 summarizes developments in business subsidies since 2014–15. A 10-year perspective is provided in Section 6 for all jurisdictions except Alberta, which began publishing tax expenditure estimates in 2013. An assessment of some key programs is presented in Section 7. The last section contains concluding remarks.
2. RATIONALES FOR SUBSIDIZING BUSINESSGovernments provide subsidies, or more generally, intervene in markets for a number of reasons. One rationale is to correct market failures, which could arise from externalities, asymmetric information or other market imperfections. Externalities arise when prices do not capture all the costs and benefits of economic activity. The classic positive externality is investment in R&D, which occurs because R&D performed by one firm inevitably leaks out and provides (unpaid) benefits to other firms. Since firms cannot capture all of the benefits from the R&D they perform, the amount undertaken will be too low from society’s perspective, so a subsidy may be justified. Governments may also see positive externalities in promoting national culture or national self-sufficiency in certain products. The classic negative externality is pollution, which is addressed with both tax measures and subsidies.
Asymmetric information problems arise in two circumstances. The problem of hidden information occurs when the two sides of a transaction have different information about a product’s quality or the riskiness of an investment; this is known as an adverse-selection problem. The second type of asymmetric information problem arises from hidden actions: one of the parties to a transaction can take actions that are not observable by the other party and which can affect product quality or the riskiness of an investment. This is known as moral hazard or as a principal-agent problem. The
3
impact of asymmetric information is particularly severe for innovative firms due to the complexity of their activities. Further, the impact of asymmetric information varies across capital markets, likely causing underinvestment by startup entrepreneurs and overinvestment in the venture capital segment of risk capital.1 Subsidizing access to capital by startup entrepreneurs is therefore more likely to improve economic performance than is subsidizing venture capital.
Governments also provide subsidies in order to create what are often described as “good jobs,” meaning employment in high-wage, high-productivity industries, which could be established or nascent. Such policies could only be successful in the presence of imperfectly competitive, or at least incomplete, markets, which would allow a subsidy-induced reallocation of labour and capital to improve economic outcomes. There is a substantial body of evidence documenting large and persistent inter-industry wage differentials that do not appear to be caused by differences in labour quality (Lester, Forthcoming), which suggests that the minimum condition for a successful intervention is met. Nevertheless, the majority view in the economics profession is that “industrial policies” harm rather than help economic performance,2 reflecting doubts on the ability of governments to choose appropriate targets and the fact that there are substantial costs associated with providing assistance.
Another rationale for targeted intervention by government is to improve the trade-off between efficiency and protecting the tax base that often occurs when designing the tax system. Some otherwise sound policies cause unintended revenue losses and recovering the lost revenue results in a net loss in efficiency. One example is the treatment of profit and losses: profits are taxed as earned, while there are limitations on the deductibility of losses. This asymmetric treatment raises the effective tax rate on startups and other unprofitable firms. In principle, efficiency would be enhanced by ensuring that business losses affect net income as they are incurred, up to the point of refunding losses to non-taxable firms. In practice, however, such a policy would encourage multinational firms to book more losses in a country providing refundability, which would reduce revenue without any improvement in efficiency.3 Policies such as flow-through-share deductions are intended to improve tax efficiency by treating profits and losses more symmetrically, while limiting the scope for unintended revenue losses by restricting eligibility by firm size and sector.
The taxation of capital gains also involves a compromise between efficiency and protecting the tax base. As discussed by Mintz and Richardson (1995) taxation of capital gains can give rise to double taxation. This occurs, for example, when an innovation raises the expected profitability of a firm, thereby increasing the value of its shares. If the shares are sold, the additional income generated by the innovation will be taxed twice: once as a capital gain and a second time when it is distributed as dividends. That is, taxing both the present value of the higher income stream and the stream itself results in double taxation. Exempting capital gains in these circumstances would improve efficiency. On the other hand, exempting capital gains makes it harder to protect the revenue base, even if the exemption is restricted to gains on business shares. For example, firms would have an incentive to use share buy-backs to substitute tax-free capital gains for dividends. Restricting the capital gains exemption to small firms reduces the importance of unintended revenue losses because the scope for international profit shifting is limited and because many small businesses are unprofitable.4
Governments also intervene to promote equity by redistributing income. For example, a number of programs provide subsidized agricultural income insurance, which effectively transfers income to farmers from other taxpayers while sustaining agricultural production. There is a similar outcome when governments use business subsidies to retain or attract economic activity in specific
1 See Lester (2017a)2 For a review of the theoretical underpinnings of and the empirical support for industrial policies see Pack and Saggi (2006)3 For a more detailed discussion see Mintz et al. (1997)4 In 2009, about two-thirds of firms eligible to claim the small business deduction did not do so because they did not have
positive active business income. The source is unpublished data from Dachis and Lester (2015).

4
regions. While there is an efficiency argument supporting regional development subsidies,5 altering the market-determined spatial distribution of economic activity will generally result in lower overall income along with an income transfer to residents in the subsidized region from other taxpayers. Another example is assistance paid to firms or individuals in order to help them adjust to structural changes, such as import competition or technological change. In each of these examples, the government is providing income support without expecting an improvement in economic performance. There is a deliberate policy choice in favour of equity over efficiency.
3. DATA SOURCES AND METHODOLOGYGovernments subsidize business through spending programs, through tax measures and by making what are typically described in the public accounts as “loans, investments and advances” to government-controlled entities and private sector firms. Most of these investments are made in government-controlled entities, and more specifically in government business enterprises (GBEs). These GBEs may subsidize business by providing goods or services without recovering the full cost of capital employed or by purchasing goods and services at preferential prices. As a result, the activities of GBEs are considered a distinct source of subsidies, separate from other loans, investments and advances, which are described as “direct investment.” In contrast to spending programs and tax measures, supplementary calculations are required to determine the subsidy arising from the activities of GBEs and direct investment in firms.
Business subsidies in this study include all measures with an economic objective. Also included are agricultural insurance programs and regional development measures, both of which have economic objectives, but which also provide income support. Subsidies supporting Canadian culture are excluded since they are not expected to contribute to better economic performance. Subsidies promoting more efficient use of energy are also excluded on the grounds that their primary objective is to protect the environment.6 Finally, not all of the business subsidies provided by GBEs are included in this study. In particular, any subsidy arising from GBEs providing infrastructure services, such as port management, are excluded. Some measures that support activity of a specific sector without involving payments directly to firms are included in the estimates. For example, programs promoting tourism or providing funding for marketing activities in other sectors are included in business subsidies, providing that funding comes from general revenues rather than an industry levy.
Following adoption of a Public Sector Accounting Board standard in 2012, refundable tax credits are classified as program spending by the federal government and all provinces. The extent to which refundable tax credits are integrated in the public accounts varies by jurisdiction. The treatment in the Ontario public accounts appears to be the most complete, with refundable tax credits appearing as program spending by the relevant department. In this study, refundable tax credits are included in subsidies delivered via program spending, while non-refundable credits are part of tax-based spending.
The subsidy estimates in this paper should not, in principle, include delivery (administration) expenses. Fortunately, only subsidies delivered through direct spending programs in Quebec are gross of administration expenses.
5 The efficiency argument for regional development programs is that depopulation will require public infrastructure (schools, hospitals, etc.) to be rebuilt elsewhere; to the extent that firms and households do not pay the full cost of building public infrastructure elsewhere, society bears some of the adjustment costs and some of these public funds could be allocated to sustaining regional activity.
6 This distinction glosses over the fact that in many cases protecting the environment also promotes economic development.
5
3.1. Program spending
All jurisdictions except Alberta publish information on subsidies by department and program in their public accounts, but only the federal government and Quebec present the data by major recipient — individuals, business, non-profit entities, and other levels of government.7 In addition, the federal public accounts present this information for agencies, such as the Atlantic Canada Opportunities Agency, as well as for direct departmental activities. The federal government and Ontario recently began publishing subsidies by program and department in digital format.8 This information is available for the most recent five years for the federal government and for the two most recent years for Ontario.9
The federal public accounts include substantive program descriptions. Unfortunately, the subsidies data are presented by general recipient class at the department/agency level, not at the program level. Program-level data on subsidies by recipient class were obtained through access to information requests to all departments and agencies reporting subsidies to business. Program descriptions in the public accounts and additional information available in the Report on Plans and Priorities document published annually by each department were used to identify business subsidies and to estimate the proportion of payments to non-business entities that are ultimately received by business.
For example, the federal public accounts report subsidies received directly by business amounting to $2.4 billion in the 2014–15 fiscal year, but about a third of that amount consisted of programs with a non-economic objective, such as aboriginal land-claims settlements, measures to protect the environment and support for cultural industries. On the other hand, payments received directly by business understate the amount of subsidies. In 2014–15, the federal government transferred about $600 million to provincial governments to fund cost-shared programs in agriculture, which was ultimately received by business.10 In addition, some of the transfers to non-profit entities were ultimately used to subsidize business. For example, Western Economic Diversification works with non-profit entities that deliver subsidies to business. After eliminating subsidies that did not have an economic objective and adding subsidies delivered by other levels of government and non-profit entities, federal business subsidies delivered via departmental program spending amounted to $2.9 billion in 2014–15. Refundable tax credits, which are included in program spending, raised the total to $4.5 billion.
Federal business subsidies provided through departmental spending programs take two general forms: grants and contributions. Grants are unconditional subsidies; recipients are not required to report on the use of funds and are not audited. Contributions are subject to performance conditions and recipients must report on the use of funds; they are also subject to audit. Contributions may be non-repayable, or repayable with or without conditions. Non-repayable and conditionally repayable contributions are included in subsidies as they are made. Unconditionally repayable contributions are considered loans. Recoveries of conditionally repayable contributions are included in departmental revenues. In this study, these repayments are deducted from subsidies to avoid overstating subsidy payments; they represent a small share of total subsidies but are significant in several programs.
7 This information is presented by department in Volume 2 of the federal and Quebec public accounts.8 The federal and Ontario online databases can be accessed at http://www.tbs-sct.gc.ca/ems-sgd/edb-bdd/index-eng.
html#start and https://www.ontario.ca/data/public-accounts-volume-1-data.9 B.C., Alberta and the federal government publish data on transfers by individual recipient in digital format, but this
information cannot easily be used to identify total subsidies received by business.10 This information is presented in Section 9, Volume 3 of the public accounts of Canada.

6
The Quebec public accounts do not contain program descriptions. Brief descriptions appear in the Quebec Expenditure Budget,11 but these are not always sufficient to determine program objectives. Fortunately, the public accounts12 provide reasonably detailed data on subsidies by program and department. Further, these subsidies include payments received directly and indirectly by firms. As a result, business subsidies can be identified with a high degree of confidence. On the other hand, Quebec makes use of a substantial number of special funds13 to deliver spending programs. Only general information on the transactions made by these funds are included in the Quebec public accounts. Some funds, such as the Economic Development Fund, publish separate financial statements and details on spending are available in the annual report of the responsible department. In other cases, such as the Natural Resources Fund, the required information could only be obtained through access to information requests. Finally, in contrast to the other jurisdictions, the value of business subsidies delivered by departments includes administration costs.
The Quebec public accounts report business subsidies delivered through broadly defined spending programs amounting to $1.7 billion in fiscal 2014–15. However, less than half of this amount is included in subsidies as defined in this paper. For example, subsidies to commercial day-care centres and ambulance services amounted to about $900 million. A further $440 million was transferred to a GBE, La Financière agricole de Québec, so business subsidies delivered directly by departments amounted to $260 million in 2014–15. Subsidies delivered through special funds, such as the Economic Development Fund, are almost 70-per-cent larger than direct spending subsidies, bringing total subsidies delivered by departments to $700 million in 2014–15. Business subsidies delivered through refundable tax credits amounted to about $1.6 billion.
Ontario publishes a detailed breakdown of spending, including subsidies, by ministry and program in the public accounts. Ontario makes substantial use of special funds to deliver subsidies; these amounts are clearly identified in the public accounts. Information by broad category of recipient is not available. Ontario also includes the subsidy component of loans in program spending. That is, when loans are made on preferential terms, the value of the interest incentive is included as a subsidy in program spending. An example is $1.4 million in interest incentives provided through loans by the Strategic Jobs and Investment Fund.
Descriptions of broad spending categories by ministry are included in the public accounts. These descriptions, along with the names of specific subsidy programs, can be used to identify subsidies to business. Such an approach is likely to overstate business subsidies because not all payments under these programs will be received by business. The subsidy estimates reported in this study for the period up to 2013–14 were obtained through an access to information request to the Ministry of Finance. There does not appear to be any attempt to eliminate subsidies received by non-business entities in compiling these estimates. Estimates of subsidies received by business in 2014–15 were developed by reviewing program descriptions in the public accounts, supplemented with estimates contained in a review of economic support programs in a 2015 report by Ontario’s auditor general.14 Business subsidies delivered directly by departments amounted to $975 million in 2014–15, while subsidies delivered through refundable tax credits amounted to $800 million.
B.C. presents subsidies by program and department in the public accounts, but information by broad category of recipient is not available. Although program descriptions are not available in the public accounts, they are provided in the expenditure budget (the “Estimates”).15 The public accounts also provide the aggregate value of subsidies related to natural resources and economic
11 Available at: http://www.tresor.gouv.qc.ca/fileadmin/PDF/budget_depenses/14–15/AnnualExpenditureManagementPlansDepartmentsBodies.pdf.
12 Volume 2, Section 3.13 Some of these funds have similar characteristics to federal agencies, such as the Atlantic Canada Opportunities Agency.14 Office of the Auditor General of Ontario (2015).15 http://www.bcbudget.gov.bc.ca/2014/estimates/2014_Estimates.pdf.
7
development. The Office of the Comptroller General of B.C. kindly supplied the program name and the value of subsidies included in this aggregate amount. The information supplied likely overstates business subsidies because some payments in this category will be received and spent by non-business entities. The value of business subsidies delivered directly by departments is very small, about $50 million in 2014–15. In contrast, subsidies delivered through refundable tax credits amounted to $510 million.
Alberta stands out as being the least transparent on business subsidies delivered through spending programs. Alberta’s public accounts report only the aggregate value of subsidies by ministry. Programs are not systematically described in the public accounts and detailed information is difficult to obtain from other sources. Business subsidy programs were identified through access to information requests submitted to all ministries with business-related responsibilities. Given the limited documentation, it was not always possible to determine if a program constitutes a business subsidy or if some of the payments were received and spent by non-business entities. Subject to these limitations, I estimate that Alberta government departments delivered $585 million in business subsidies in 2014–15. Subsidies delivered through refundable tax credits were much smaller at $82 million.
The federal estimates of business subsidies include payments made under federal-provincial shared-cost programs, which are concentrated in the agricultural sector. The federal share is excluded from published estimates of subsidies in all provinces except B.C. The gross payments under the shared-cost programs recorded in the B.C. public accounts were reduced by the percentage funded by the federal government, generally 60 per cent.
3.2. Tax-based spending
A tax expenditure is typically defined as a measure that deviates from a benchmark tax system in order to achieve an economic or social objective. Depending on how the benchmark is specified, tax expenditures may include measures that fulfill the same function as program spending as well as measures that are implemented to address issues of the efficiency, fairness and simplicity of the tax system. In order to distinguish between the two categories, I proposed (Lester 2012b) using the term “tax-based spending programs” for the first category and structural tax measures for the second.16 The structural category includes measures implemented to promote horizontal equity, to recognize costs of earning income, to avoid double taxation and to keep administration and compliance costs at reasonable levels.
Identifying business subsidies is more clear-cut for measures delivered through the tax system than for direct spending measures. All jurisdictions publish estimates of tax expenditures, and while the extent of documentation varies considerably (Table 1), it is not difficult to determine the objective of tax measures. A number of personal income tax measures promote economic development by reducing the tax burden on business-related income. Notable examples are the lifetime capital gains exemptions for small-business shares and farming and fishing property as well as flow-through-share deductions.
Estimates of the tax revenue forgone are not provided for all measures included in the tax expenditure reports. In most cases, the amount involved is likely to be small. Two exceptions are accelerated capital cost allowances (CCA) for several types of capital equipment and the tax treatment of cross-border interest deductibility. Estimating the cost of accelerated CCA provisions is difficult because such measures have a variable impact on revenues over time: for investment in a given year, revenues initially decline, but once the tax allowance is exhausted, revenue rises relative
16 This terminology was adopted by the Office of the Auditor General in its 2015 audit of the management of tax expenditures by Finance Canada and the Canada Revenue Agency. Following the audit, Finance Canada revamped its tax expenditures report. Among other changes, tax measures are now classified as structural and non-structural.

8
to the baseline calculated using regular CCA. The revenue increase is offset by revenue losses arising from investment in subsequent years. For example, the cost of the accelerated CCA for most machinery and equipment (M&E) assets used in manufacturing announced in the 2015 budget was projected to peak at $360 million in its second full year.17 Quebec is the only jurisdiction that includes estimates of the tax revenue forgone from accelerated CCA in its tax expenditure report.
TABLE 1 SUMMARY DESCRIPTION OF TAX EXPENDITURE REPORTING
Available starting in: Included Taxes Documentation Digital Format
Federal 1999 Income and the GST Measures well described, including a history of policy changes; objectives clearly stated; estimates for multiple years in each report.
From 2010
B.C. 1999 Income, retail sales, fuel and property Descriptions of measures not provided; estimates for a single year in each report.
No
Alberta 2013 Income and fuel Descriptions of measures not provided; estimates for a single year in each report.
No
Ontario 2005 Income, retail/HST, excise, mining, health and property
Measures well described in a separate document; estimates for a single year in each report.
No
Quebec 1996 Income, value-added, excise, capital and health
Measures well described, including some history of policy changes; estimates for multiple years in each report.
No
Canada’s tax treatment of cross-border interest expense make it possible to obtain two interest deductions for debt incurred to finance outbound investment, one in Canada and another in the host country.18 An illustrative calculation suggests that the amount of tax revenue forgone as a result of this incentive is substantial, likely around $2.5 billion for the federal government and an additional $1.5 to $2 billion for provincial governments in 2014.19 These costs are not included in the estimates of tax-based spending because there is not enough information available to calculate the cost to specific provinces.
The federal government does not publish estimates of the tax revenue forgone through excise taxes or through preferential employment-insurance contribution rates. This study includes the cost of the hiring credit for small business introduced in 2011 and the small-business job credit implemented in 2014. Cost estimates were taken from budget documents.
In the B.C. reports, the criterion for including a tax measure as a tax expenditure is that it be a reasonably close substitute for program spending. B.C. Treasury officials have the view that the small business deduction (or the special low rate for small business) does not meet this criterion. Nevertheless, Treasury officials provided an estimate for 2013, which was used to develop estimates for other years. The cost per percentage point of gap between the regular and small-business rates was applied to the gap in other years and then adjusted for growth in provincial output.
As mentioned above, refundable tax credits have been included in program spending in all jurisdictions since 2012. Nevertheless, refundable tax credits are also included for information purposes in most tax expenditure reports, the exception being Ontario.
3.3. Government business enterprises
The financial reporting entity of the federal government includes all entities that it controls. This includes Crown corporations, other government business enterprises and a number of not-for-
17 Department of Finance Budget 2015, page 440.18 For additional detail, see Lester (2017b)19 The federal measure affects provincial tax bases.
9
profit organizations. If the controlled entity requires ongoing financial support from the federal government to fund its operations, its financial activities are included on a line-by-line basis in the government’s consolidated financial reports. If the controlled enterprise is substantially self-sustaining after a block of government equity investment or loans, only the government’s share of profits and interest received on loans are included in government revenues.
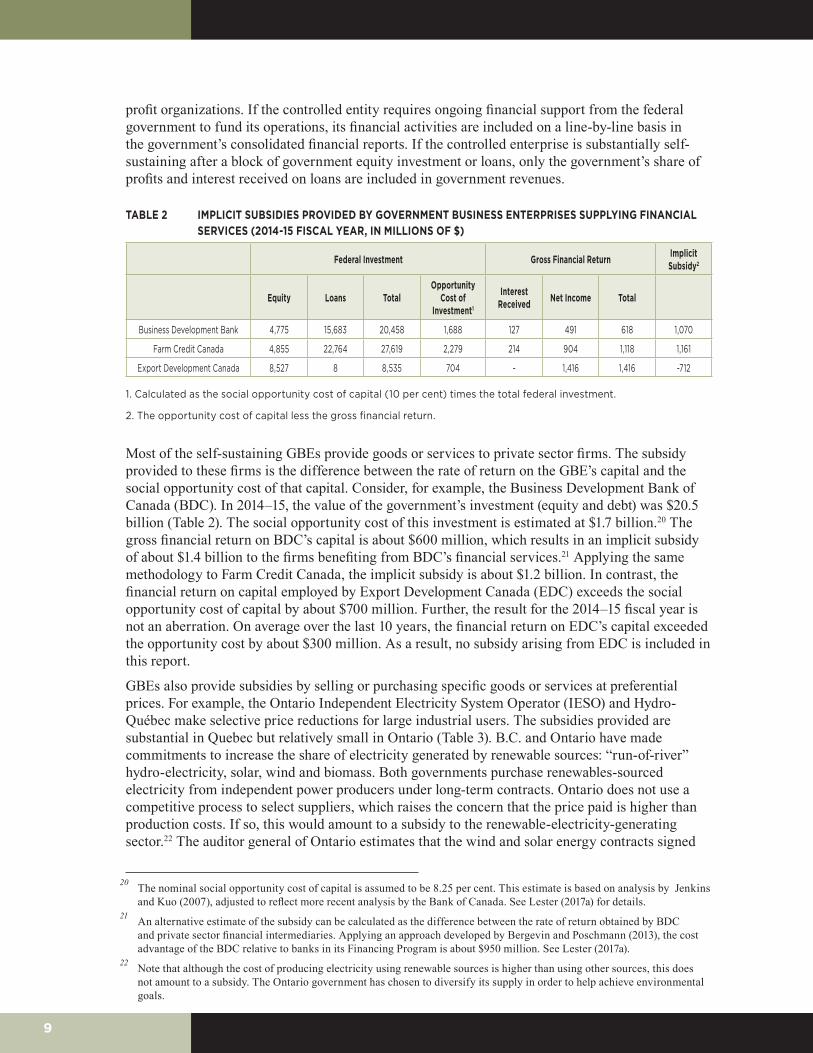
TABLE 2 IMPLICIT SUBSIDIES PROVIDED BY GOVERNMENT BUSINESS ENTERPRISES SUPPLYING FINANCIAL SERVICES (2014-15 FISCAL YEAR, IN MILLIONS OF $)
Federal Investment Gross Financial Return Implicit Subsidy2
Equity Loans TotalOpportunity
Cost of Investment1
Interest Received Net Income Total
Business Development Bank 4,775 15,683 20,458 1,688 127 491 618 1,070
Farm Credit Canada 4,855 22,764 27,619 2,279 214 904 1,118 1,161
Export Development Canada 8,527 8 8,535 704 - 1,416 1,416 -712
1. Calculated as the social opportunity cost of capital (10 per cent) times the total federal investment.
2. The opportunity cost of capital less the gross financial return.
Most of the self-sustaining GBEs provide goods or services to private sector firms. The subsidy provided to these firms is the difference between the rate of return on the GBE’s capital and the social opportunity cost of that capital. Consider, for example, the Business Development Bank of Canada (BDC). In 2014–15, the value of the government’s investment (equity and debt) was $20.5 billion (Table 2). The social opportunity cost of this investment is estimated at $1.7 billion.20 The gross financial return on BDC’s capital is about $600 million, which results in an implicit subsidy of about $1.4 billion to the firms benefiting from BDC’s financial services.21 Applying the same methodology to Farm Credit Canada, the implicit subsidy is about $1.2 billion. In contrast, the financial return on capital employed by Export Development Canada (EDC) exceeds the social opportunity cost of capital by about $700 million. Further, the result for the 2014–15 fiscal year is not an aberration. On average over the last 10 years, the financial return on EDC’s capital exceeded the opportunity cost by about $300 million. As a result, no subsidy arising from EDC is included in this report.
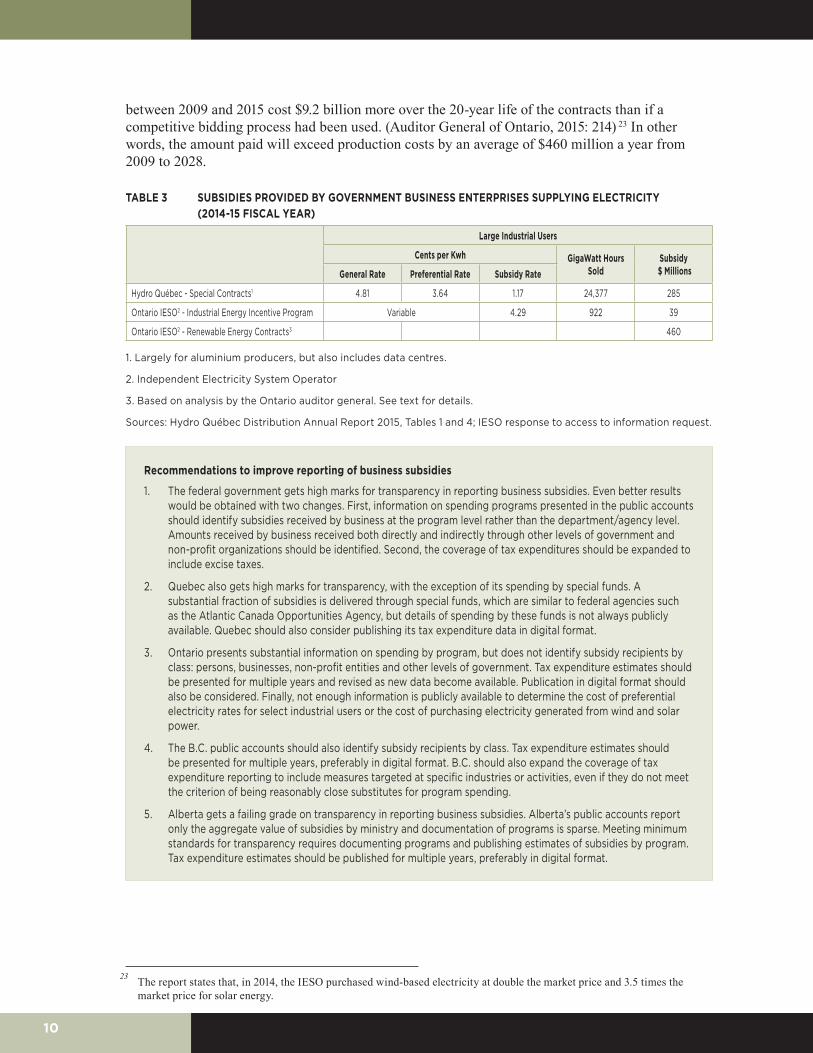
GBEs also provide subsidies by selling or purchasing specific goods or services at preferential prices. For example, the Ontario Independent Electricity System Operator (IESO) and Hydro-Québec make selective price reductions for large industrial users. The subsidies provided are substantial in Quebec but relatively small in Ontario (Table 3). B.C. and Ontario have made commitments to increase the share of electricity generated by renewable sources: “run-of-river” hydro-electricity, solar, wind and biomass. Both governments purchase renewables-sourced electricity from independent power producers under long-term contracts. Ontario does not use a competitive process to select suppliers, which raises the concern that the price paid is higher than production costs. If so, this would amount to a subsidy to the renewable-electricity-generating sector.22 The auditor general of Ontario estimates that the wind and solar energy contracts signed
20 The nominal social opportunity cost of capital is assumed to be 8.25 per cent. This estimate is based on analysis by Jenkins and Kuo (2007), adjusted to reflect more recent analysis by the Bank of Canada. See Lester (2017a) for details.
21 An alternative estimate of the subsidy can be calculated as the difference between the rate of return obtained by BDC and private sector financial intermediaries. Applying an approach developed by Bergevin and Poschmann (2013), the cost advantage of the BDC relative to banks in its Financing Program is about $950 million. See Lester (2017a).
22 Note that although the cost of producing electricity using renewable sources is higher than using other sources, this does not amount to a subsidy. The Ontario government has chosen to diversify its supply in order to help achieve environmental goals.
10
between 2009 and 2015 cost $9.2 billion more over the 20-year life of the contracts than if a competitive bidding process had been used. (Auditor General of Ontario, 2015: 214) 23 In other words, the amount paid will exceed production costs by an average of $460 million a year from 2009 to 2028.
TABLE 3 SUBSIDIES PROVIDED BY GOVERNMENT BUSINESS ENTERPRISES SUPPLYING ELECTRICITY (2014-15 FISCAL YEAR)
Large Industrial Users
Cents per Kwh GigaWatt Hours Sold
Subsidy $ MillionsGeneral Rate Preferential Rate Subsidy Rate
Hydro Québec - Special Contracts1 4.81 3.64 1.17 24,377 285
Ontario IESO2 - Industrial Energy Incentive Program Variable 4.29 922 39
Ontario IESO2 - Renewable Energy Contracts3 460
1. Largely for aluminium producers, but also includes data centres.
2. Independent Electricity System Operator
3. Based on analysis by the Ontario auditor general. See text for details.
Sources: Hydro Québec Distribution Annual Report 2015, Tables 1 and 4; IESO response to access to information request.
Recommendations to improve reporting of business subsidies
1. The federal government gets high marks for transparency in reporting business subsidies. Even better results would be obtained with two changes. First, information on spending programs presented in the public accounts should identify subsidies received by business at the program level rather than the department/agency level. Amounts received by business received both directly and indirectly through other levels of government and non-profit organizations should be identified. Second, the coverage of tax expenditures should be expanded to include excise taxes.
2. Quebec also gets high marks for transparency, with the exception of its spending by special funds. A substantial fraction of subsidies is delivered through special funds, which are similar to federal agencies such as the Atlantic Canada Opportunities Agency, but details of spending by these funds is not always publicly available. Quebec should also consider publishing its tax expenditure data in digital format.
3. Ontario presents substantial information on spending by program, but does not identify subsidy recipients by class: persons, businesses, non-profit entities and other levels of government. Tax expenditure estimates should be presented for multiple years and revised as new data become available. Publication in digital format should also be considered. Finally, not enough information is publicly available to determine the cost of preferential electricity rates for select industrial users or the cost of purchasing electricity generated from wind and solar power.
4. The B.C. public accounts should also identify subsidy recipients by class. Tax expenditure estimates should be presented for multiple years, preferably in digital format. B.C. should also expand the coverage of tax expenditure reporting to include measures targeted at specific industries or activities, even if they do not meet the criterion of being reasonably close substitutes for program spending.
5. Alberta gets a failing grade on transparency in reporting business subsidies. Alberta’s public accounts report only the aggregate value of subsidies by ministry and documentation of programs is sparse. Meeting minimum standards for transparency requires documenting programs and publishing estimates of subsidies by program. Tax expenditure estimates should be published for multiple years, preferably in digital format.
23 The report states that, in 2014, the IESO purchased wind-based electricity at double the market price and 3.5 times the market price for solar energy.

11
4. SNAPSHOT OF BUSINESS SUBSIDIES IN 2014–15This section presents and compares business subsidies for the 2014–15 fiscal year, the most recent year that data are available for all five jurisdictions. In this section, I compare overall subsidy levels, delivery methods, and targeting by sector and activity. I also present a classification of subsidies by rationale for intervention.
4.1. Delivery methods and targeting
In 2014–15, the federal government provided approximately $14 billion in business subsidies, or about $390 per person. Subsidies in the four largest provinces amounted to $14.6 billion, averaging about $480 per capita. These measures have to be financed by higher taxes or by reduced spending on other programs. Federal and provincial subsidies combined represented almost half of corporate income tax revenue, seven per cent of total tax revenues and 5.2 per cent of program spending in the five jurisdictions.
FIGURE 1 BUSINESS SUBSIDIES RELATIVE TO TAX REVENUE AND POPULATION
0
0.02
0.04
0.06
0.08
0.1
0.12
0.14
0
100
200
300
400
500
600
700
Alberta Quebec Ontario Federal B.C.
Per capita (left scale) Percentage of Tax Revenue

12
FIGURE 2 DISTRIBUTION OF BUSINESS SUBSIDIES BY DELIVERY INSTRUMENT
0%
10%
20%
30%
40%
50%
60%
70%
80%
Tax Expenditures Spending Programs Government BusinessEnterprises
Equity and Loans
B.C. Alberta Ontario Quebec Federal
Expressed relative to GDP, business subsidies were highest in Quebec at 1.2 per cent. The share in the other jurisdictions varied in a narrow range around 0.75 per cent. In contrast, business subsidies expressed both relative to population and tax revenue were highest in Alberta (Chart 1), reflecting a high level of GDP per capita and a low aggregate tax ratio.24 Per capita subsidies were about 15 per cent lower in Quebec and were 35 to 40 per cent lower in the other three jurisdictions than in Alberta. B.C. had the lowest level of subsidies per capita and relative to program spending. Subsidies in B.C. were the second lowest relative to GDP.
The tax system is the preferred instrument for delivering subsidies in all jurisdictions except Quebec, with the share ranging from just under half federally to about two-thirds in B.C. (Chart 2). In Quebec, about half of business subsidies are delivered through spending programs, although refundable tax credits account for about 85 per cent of this spending. Across all jurisdictions, about 15 per cent of subsidies were delivered through government business enterprises (GBEs). B.C. stands out with only about four per cent of subsidies delivered through GBEs. Only Ontario and the federal government subsidized businesses by taking an equity position (e.g., investing in General Motors) or directly making loans at concessionary rates.
Subsidies are highly concentrated by sector in all jurisdictions except Quebec (Chart 3). In jurisdictions other than Quebec, small businesses25 receive at least 40 per cent of subsidies, which
24 The relationship between per capita and GDP measures breaks down for Alberta because GDP per capita is 74- to 100-per-cent higher in Alberta than in the other three provinces. The high capital intensity of oil production is an important contributor to this result. Alberta has by far the lowest ratio of tax revenue to GDP among the jurisdictions included in the comparison: 5.6 per cent compared to an average of 11.1 per cent. Tax revenue excludes mineral royalties.
25 Small business is generally defined as those businesses qualifying for the small business deduction. At the federal level, firms with less than $10 million in assets qualify for a reduced tax rate on $500,000 of active business income. Provincial governments have similar qualification criteria.

13
is high relative to the small-business share of investment and economy-wide wages.26 Agriculture accounts for a particularly large share of subsidies provided by Alberta, boosting the subsidy share of small business and agriculture to 79 per cent. The federal government allocates about two-thirds of subsidies to small business and agriculture. In B.C., the combined share of small business and exports — primarily support for foreign location shooting of films and videos, which is an export of services — is 76 per cent. In Ontario, small business, agriculture and manufacturing accounted for just over half of business subsidies in 2014–15. Although less concentrated than in other jurisdictions, three sectors in Quebec — small business, agriculture, information and e-commerce — account for 46 per cent of total subsidies.
FIGURE 3 DISTRIBUTION OF BUSINESS SUBSIDIES BY SECTOR 2014-15
0%
10%
20%
30%
40%
50%
60%
70%
B.C. Alberta Ontario Quebec Federal
A small number of programs account for a large share of business subsidies in all jurisdictions. The top-five share ranges from about half in Ontario and Quebec to almost 90 per cent in B.C. The small business deduction is the largest program in all jurisdictions except Quebec, where it is second to the Scientific Research and Experimental Development (SR&ED) incentive program (Table 4). SR&ED incentives were in the top three in all jurisdictions except Alberta, where they ranked fourth. Other programs making it into the top five in at least three jurisdictions are agricultural insurance programs and the lifetime capital gains exemption for small-business shares. Tables showing the most important programs in each jurisdiction are presented in Annex 2.
26 Information presented in Finance Canada’s 2013 Tax Expenditure Report (Chart 7) suggests that small business accounts for about 15 per cent of capital investment by corporations and just over a quarter of wages and salaries paid by corporations in Canada.
14
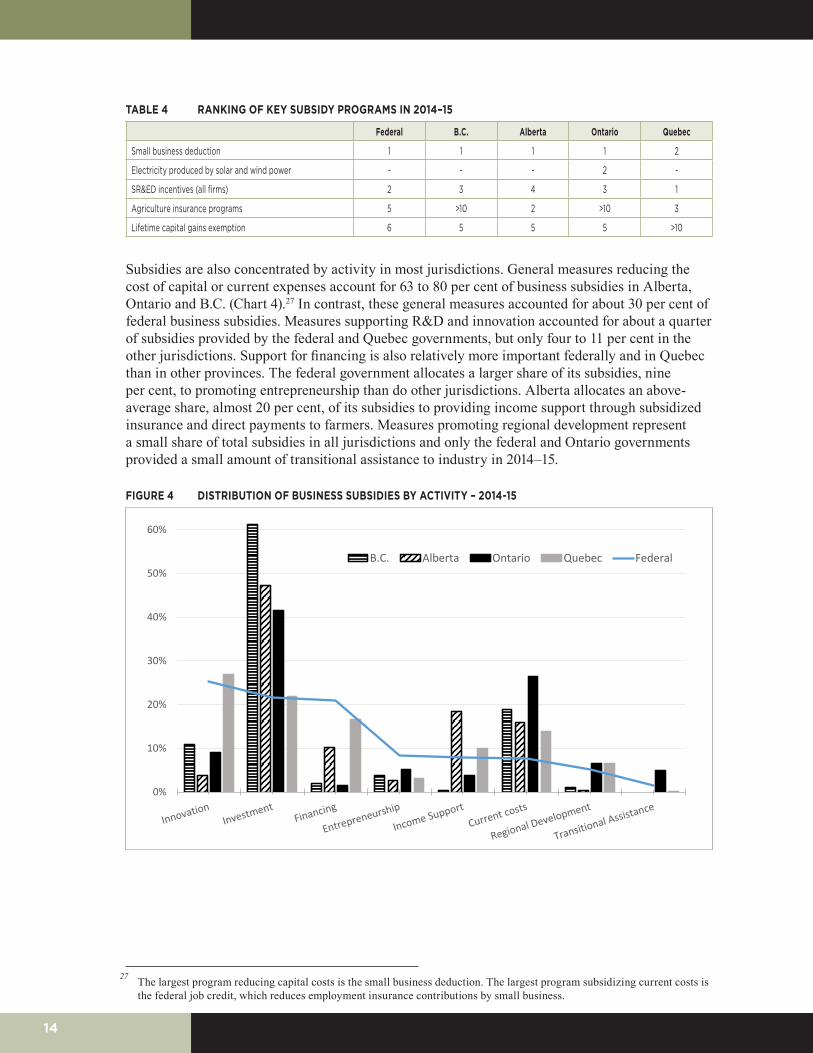
TABLE 4 RANKING OF KEY SUBSIDY PROGRAMS IN 2014–15
Federal B.C. Alberta Ontario Quebec
Small business deduction 1 1 1 1 2
Electricity produced by solar and wind power - - - 2 -
SR&ED incentives (all firms) 2 3 4 3 1
Agriculture insurance programs 5 >10 2 >10 3
Lifetime capital gains exemption 6 5 5 5 >10
Subsidies are also concentrated by activity in most jurisdictions. General measures reducing the cost of capital or current expenses account for 63 to 80 per cent of business subsidies in Alberta, Ontario and B.C. (Chart 4).27 In contrast, these general measures accounted for about 30 per cent of federal business subsidies. Measures supporting R&D and innovation accounted for about a quarter of subsidies provided by the federal and Quebec governments, but only four to 11 per cent in the other jurisdictions. Support for financing is also relatively more important federally and in Quebec than in other provinces. The federal government allocates a larger share of its subsidies, nine per cent, to promoting entrepreneurship than do other jurisdictions. Alberta allocates an above-average share, almost 20 per cent, of its subsidies to providing income support through subsidized insurance and direct payments to farmers. Measures promoting regional development represent a small share of total subsidies in all jurisdictions and only the federal and Ontario governments provided a small amount of transitional assistance to industry in 2014–15.
FIGURE 4 DISTRIBUTION OF BUSINESS SUBSIDIES BY ACTIVITY – 2014-15
0%
10%
20%
30%
40%
50%
60%
70%
B.C. Alberta Ontario Quebec Federal
27 The largest program reducing capital costs is the small business deduction. The largest program subsidizing current costs is the federal job credit, which reduces employment insurance contributions by small business.
15
4.2. Classification of subsidy programs by rationale
I have reviewed the subsidies offered by governments and classified them by the rationale, explicit or implicit, for intervention (Chart 5). The motivations for intervention identified earlier comprise market failures due to externalities and capital market imperfections, industrial policy, tax policy efficiency and income support. I have also divided income-support measures into explicit and implicit subcategories; if a measure does not fit into any of the other categories, then its implicit objective is to transfer income.
There are numerous grey areas in classifying programs. For example, the rationale for the small business deduction, which is the largest subsidy program in all jurisdictions except Quebec, is to mitigate a capital-market failure. However, while there is general agreement that young and innovative firms have difficulty accessing capital, there is no consensus that all small firms have difficulty accessing external financing. Nevertheless, I have included the small business deduction in the capital-market-failure category. This point also applies to lending by Farm Credit Canada and the Business Development Bank’s Financing Program, which supports small and medium-sized business. Classifying programs as contributing to an industrial policy also raises some issues. Measures targeted at specific industries known to pay relatively high wages would qualify. On the other hand, while the manufacturing sector pays above-average wages, there is considerable variance within the sector. 28 Nevertheless, I have included measures providing support to the overall manufacturing sector, partly on the grounds that policy-makers believe, or believed, such programs to be growth-enhancing.
Considering all five jurisdictions, about 70 per cent of subsidies by value address a market failure, promote high-wage, high-productivity industries, or improve the efficiency of the tax system. In other words, 70 per cent of business subsidies meet the necessary condition for improving economic performance or promoting economic development. Note, however, that if the small business deduction is excluded, this ratio falls to about 45 per cent and if industrial policy measures are excluded, it falls to 38 per cent.
Capital-market failures dominate the motivation for intervention by the federal government, B.C. and Alberta (Chart 5). Subsidies are distributed substantially more uniformly in Quebec and Ontario. At the federal level, the subsidies provided by Farm Credit Canada and the Business Development Bank along with the small business deduction, are the key programs addressing capital-market failures. The Business Development Bank provides conventional and high-risk loans to small and medium-sized business as well as risk-capital financing for innovative firms. Alberta and Quebec also provide subsidized loans to farmers. All provincial governments have a number of small programs supporting the risk-capital market.
Externalities, where the case for government intervention is strong, account for about a quarter of federal subsidies. In the other jurisdictions, this share ranges from nine per cent (Alberta) to 16 per cent (Quebec). Federal and provincial incentives for SR&ED are the key measures addressing externalities, although a number of other programs promoting the development of energy-saving technology and clean energy are included, as are labour-market training incentives.
Measures implemented to promote tax efficiency account for 10 per cent of federal subsidies, approximately double the share in other jurisdictions. The key measures in this category are the lifetime capital gains exemptions for small-business shares and farming and fishing property and flow-through shares for mineral exploration.
About two per cent of federal subsidies could be viewed as implementing an industrial strategy to promote high-wage, high-productivity industries. The three top beneficiaries were the aerospace
28 Over the five years ending in 2015, the average weekly wage in manufacturing was 12.5-per-cent higher than the all-industry average. However, about 40 per cent of the 21 three-digit industries making up the manufacturing sector paid wages below the all-industry average.
16
industry, film and video production services and the auto sector. Alberta does even less of this type of targeting than the federal government does, but the other provinces are substantially more active. All jurisdictions promote the film and video production services industry, which accounts for a quarter of subsidies in this category. Ontario, Quebec and B.C. promote the “digital media” industry; subsidies to that industry account for about a seventh of total industrial policy subsidies. Ontario and Quebec also provide general support for the manufacturing industry, which pays above-average wages. Quebec offers preferential electricity rates to selected large industrial users, primarily in the aluminum industry, but data centres are growing in importance.
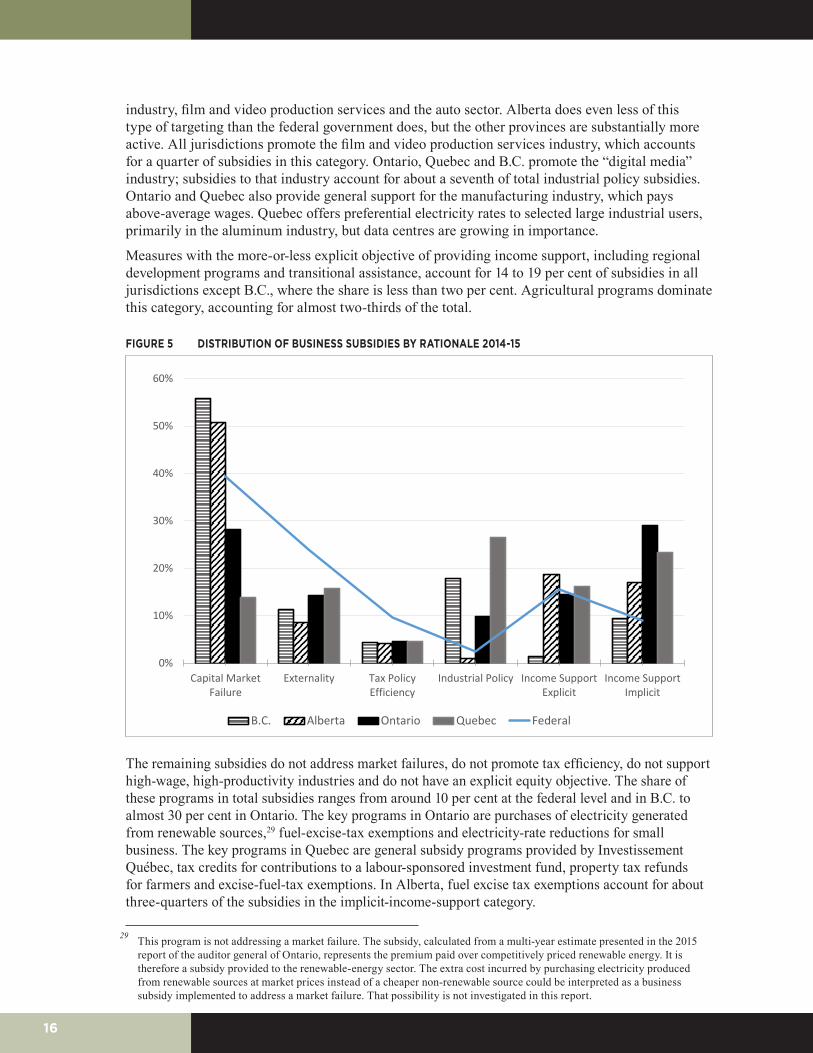
Measures with the more-or-less explicit objective of providing income support, including regional development programs and transitional assistance, account for 14 to 19 per cent of subsidies in all jurisdictions except B.C., where the share is less than two per cent. Agricultural programs dominate this category, accounting for almost two-thirds of the total.
FIGURE 5 DISTRIBUTION OF BUSINESS SUBSIDIES BY RATIONALE 2014-15
0%
10%
20%
30%
40%
50%
60%
Capital MarketFailure
Externality Tax PolicyEfficiency
Industrial Policy Income SupportExplicit
Income SupportImplicit
B.C. Alberta Ontario Quebec Federal
The remaining subsidies do not address market failures, do not promote tax efficiency, do not support high-wage, high-productivity industries and do not have an explicit equity objective. The share of these programs in total subsidies ranges from around 10 per cent at the federal level and in B.C. to almost 30 per cent in Ontario. The key programs in Ontario are purchases of electricity generated from renewable sources,29 fuel-excise-tax exemptions and electricity-rate reductions for small business. The key programs in Quebec are general subsidy programs provided by Investissement Québec, tax credits for contributions to a labour-sponsored investment fund, property tax refunds for farmers and excise-fuel-tax exemptions. In Alberta, fuel excise tax exemptions account for about three-quarters of the subsidies in the implicit-income-support category.
29 This program is not addressing a market failure. The subsidy, calculated from a multi-year estimate presented in the 2015 report of the auditor general of Ontario, represents the premium paid over competitively priced renewable energy. It is therefore a subsidy provided to the renewable-energy sector. The extra cost incurred by purchasing electricity produced from renewable sources at market prices instead of a cheaper non-renewable source could be interpreted as a business subsidy implemented to address a market failure. That possibility is not investigated in this report.
17
5. RECENT DEVELOPMENTS Recent developments suggest that the level of business subsidies will remain relatively stable until the 2018 fiscal year in B.C. and Quebec. Increases in the six- to eight-per-cent range are likely in Ontario and at the federal level. Increases in Alberta will be more substantial, particularly when measured on an accrual basis.
Quebec announced cutbacks to business subsidies delivered through the tax system in its 2014 budget. These measures, along with an increase in the eligibility threshold for R&D tax credits, were estimated to reduce subsidies by about $375 million in 2015–16 and $475 million in 2016–17. They were, however, offset by about $75 million (2015–16 ) and $100 million (2016–17) in new initiatives, including a tax-rate reduction for manufacturing SMEs and a holiday from contributions to the health services fund for all SMEs. Further, the 2016 budget announced business-support initiatives costing about $300 million in 2016–17. These new initiatives target manufacturing, small business, innovative startups and innovation in selected sectors. They also promote the government’s digital strategy. The net result is a reduction in business subsidies of about $300 million in 2015–16 and $100 million in 2016–17. These changes represent about seven and two per cent of the level of business subsidies in 2014–15. Increased funding for Plan Nord, Quebec’s northern development fund, may further reduce the savings. The 2017 budget announced new measures amounting to about $175 million, which should leave the overall level of business subsidies in 2017–18 close to their level in 2014–15.
In B.C., new initiatives in the 2015 and 2016 budgets raised business subsidies by about $20 million in 2015–16 and about $35 million in 2016–17. The 2016–17 increase is, however, approximately offset by reductions to credits for foreign location shooting of films and the digital-animation and visual-effects tax credit that took effect halfway through the fiscal year. The full-year effect in 2017–18 would result in a net reduction of about $35 million. B.C. also introduced a new venture capital fund, the B.C. Tech Fund, that focuses on emerging technology companies in B.C., primarily in information and communications technology, digital media, clean tech and life science/health care. The size of the subsidy provided will be small. There were no new measures announced in the 2017 budget or the update presented in September 2017.
There is likely to be a sizable net increase in federal subsidies arising from actions taken since the 2014 budget. The key measures in 2015 were introduction of the small-business job credit, a two-percentage-point reduction in the small-business corporate income tax rate, phased in over four years, and accelerated capital cost allowances for machinery and equipment used in manufacturing. These measures would have increased business subsidies by about $300 million in 2015–16 and about $600 million in 2016–17, although only the small-business tax rate was a completely new initiative. The 2016 federal budget restricted the reduction in the small-business tax rate to 0.5 percentage points but introduced a number of new measures costing approximately $100 million in 2016–17. The increases in 2015–16 and 2016–17 represent approximately two per cent and 4.5 per cent, respectively, of federal business subsidies in 2014–15. The 2017 budget announced a large number of new initiatives, many of which were reallocations of existing funding. New funding amounted to about $180 million for the 2018 fiscal year, bringing the increase relative to fiscal 2015 to about six per cent. The Fall Economic Statement announced that the small-business tax rate would be reduced by a further 1.5 percentage points, starting in 2018. The federal government has also announced substantial increases in funding for the Business Development Bank to facilitate financing of innovative companies, but the subsidy involved is likely to be around $25 million a year.
The Ontario government launched a systematic review of program spending in its 2015 budget. The objective was to avoid across-the-board spending cuts during a period of fiscal consolidation. All program spending was to be reviewed to identify programs that are not achieving their objectives, no longer consistent with government priorities or no longer serving a clear public interest. With respect to business subsidies, the review has resulted in reductions in the generosity
18
of the tax credits for apprenticeship training, interactive digital media, foreign location shooting and computer-assisted special effects. Total savings in 2015–16 and 2016–17 are $80 million and $160 million respectively. The intention is to use some of these savings to finance similar but more effective programs. Ontario also announced a new 10-year jobs and prosperity fund in 2015, with total funding of $2.7 billion. Spending from the fund in each of the 2016 and 2017 fiscal years was about $175 million. A number of small-business support measures were announced in the 2016 budget while the 2017 budget announced new measures costing about $140 million. The net impact on business subsidies appears to have been small in the 2016 and 2017 fiscal years, but more substantial in 2018, amounting to $400 to $500 million, which would be about 7.5 per cent of the level of business subsidies in 2014–15.
Alberta made commitments to increase business subsidies substantially in an October 2015 fiscal update and in the 2016 budget, collectively referred to as the Alberta Jobs Plan. The Jobs Plan allocates an additional $150 million in 2016–17 and 2017–18 to business subsidies. Two new tax credits were introduced. The Alberta Investor Tax Credit encourages the supply of capital to small firms operating in technology-intensive sectors. The Capital Investment Tax Credit is a 10-per-cent non-refundable credit for capital investment, capped at $5 million per claim. These two measures are expected to cost $29 million and $42 million, respectively, in 2017. Additional funding was provided for the Alberta Enterprise Corporation, regional development initiatives and apprenticeships and training. The government also reduced the small-business tax rate from three per cent to two per cent, which is expected to reduce revenues by $45 million in 2016–17 and $175 million in 2017–18. The largest commitments, however, are for increases that will take place in four to five years. Under the petro-chemicals diversification fund, $500 million in royalty credits were made available for investing in facilities producing methanol and plastics. The fund is fully committed and the credits will be claimed when the two subsidized facilities start production in 2021. No new subsidies were announced in the 2017 budget. Business subsidies amounted to $2.6 billion in 2014–15. The additional spending in fiscal 2018 represents about 12.5 per cent of the 2014–15 level; the liability incurred by the petro-chemicals diversification fund raises this percentage to 31 per cent.
6. LONGER-RUN PERSPECTIVE ON BUSINESS-SUBSIDY PROGRAMSThe availability of data on tax expenditures is the key constraint on presenting longer-run comparisons of business subsidies by jurisdiction. The federal government, Quebec and B.C. have published tax expenditure estimates since at least 1999, but the Ontario estimates are available starting in 2005 and Alberta only began publishing tax expenditure estimates in 2013. As a result, I compare the evolution of business subsidies provided by the federal, B.C., Ontario and Quebec governments over the 10-year period ending in 2014–15.
Measured in real per capita terms, the federal government and Quebec increased business subsidies during the economic downturn and reduced them substantially thereafter (Chart 6). Over the 10 years ending in 2014–15, federal real per capita business subsidies rose $130 to 2010–11 but fell $170 over the following four years, resulting in a net decline of nine per cent. In Quebec, real per capita subsidies rose $260 by 2011–12 and then fell $150 by 2014–15, leaving them 25-per-cent higher at the end of the 10-year period. In contrast, real business subsidies rose strongly in Ontario until 2012–13 and fell only slightly thereafter, leaving them 43 per cent higher at the end of the period. Real per capita subsidies were stable in B.C. from 2006–07 to 2011–12, but increased by almost a quarter in the following three years.

19
FIGURE 6 EVOLUTION OF BUSINESS SUBSIDIES IN QUEBEC, ONTARIO, B.C. AND THE FEDERAL GOVERNMENT (2014$ PER CAPITA)
0
100
200
300
400
500
600
700
800
2005-06 2006-07 2007-08 2008-09 2009-10 2010-11 2011-12 2012-13 2013-14 2014-15
Federal Ontario Quebec B.C.
The net increase in Ontario subsidies over the 10-year period was approximately $2.1 billion (in 2014 dollars). However, a substantial number of programs were either scaled back or eliminated during the 10 years, causing the sum of the absolute changes to reach $4.2 billion. Agricultural-support payments accounted for about a fifth of the summed absolute changes, but the net change in agricultural spending over the period was close to zero. A further 35 per cent of the gross change can be explained by developments in eight programs. Economic growth and changes in program parameters increased the real cost of the small business deduction by about $525 million. The largest new program was the purchase, at above-market prices, of electricity produced from renewable sources. Based on analysis by the Ontario auditor general (2015), the annual cost of this program will be about $450 million a year from 2009 to 2017. Provision of transitional support to General Motors and introduction of the Ontario R&D Tax Credit each added about $175 million to subsidy payments. Implementation of the Northern Electricity Rate Program, the Clean Energy Benefit for small business and additional support for the horse-racing industry each accounted for an additional $100 million in subsidy payments. Outside of agricultural programs, the only sizable cutback was a reduction in the excise tax exemption for fuels, which lowered subsidies by $300 million over the 10-year period.
Subsidies in B.C. rose approximately $370 million (2014 dollars) over their 2006–07 to 2011–12 average in the three years ending in 2014–15. Enrichment of the small business deduction and the tax credit for foreign location shooting along with increased take-up of the mining exploration tax credit account for all of the increase.30
In Quebec, the real value of subsidies rose $1.9 billion from 2005-06 to 2011-12. However, a substantial number of programs were either scaled back or eliminated during this period, so the sum of the absolute changes by program was almost $3 billion. The largest change arose from enrichment
30 The mining exploration tax-credit rate was also increased from 20 per cent to 30 per cent for exploration activities undertaken in areas affected by the pine beetle infestation.
20
of the small business deduction, which increased the real cost of subsidies by $475 million. Substantial changes to agricultural-support programs resulted in a net increase in payments of $360 million. Increased lending by Investissement Québec31 added $270 million to the cost of business subsidies. Quebec introduced two large programs over the 10 years: the Economic Development Fund, a general development program, and a refundable tax credit promoting the development of e-business. These programs added about $440 million and $310 million, respectively, to the cost of subsidies. Quebec reduced measured subsidies by about $320 million when preferences available under the capital tax were eliminated along with the tax itself in 2012–13.
The net decline in Quebec’s real business subsidies from their peak in 2011–12 to 2014–15 was $1.1 billion. The sum of the absolute changes by program was about $200-million higher. The declines were broad-based, but three measures made a substantial contribution. The subsidy arising from the lending activities of Investissement Québec fell approximately $225 million over the three years. Hydro Québec subsidies provided to large industrial users, largely aluminum producers, declined a similar amount. And the subsidy provided for the construction of forest-access roads declined $150 million. Quebec’s 2014–15 budget announced a 20-per-cent cut in most tax-based business subsidies and the elimination or the reduction in the generosity of several others. Savings in 2014–15 were estimated at about $150 million.
The real value of federal business subsidies rose $5.2 billion from 2005–06 to 2010–11 but virtually the same amount in the following four years. Increases in the financing subsidies provided by the Business Development Bank and Farm Credit Canada32 each accounted for about a quarter of the rise. Increased generosity of the small business deduction and higher agricultural income-support payments each contributed 13 per cent to the upswing to 2010–11. The largest contributors to the subsequent decline were the small business deduction (26 per cent), declining agricultural-support payments (nine per cent) and lower SR&ED investment tax credits (six per cent), reflecting reduced activity and policy changes. Notable increases during the period of overall decline came from the hiring/job tax credit implemented in 2012, new Quebec regional development subsidies, also implemented in 2012, and losses on the equity investment in General Motors.
A small number of programs experienced substantial and sustained changes over the 10-year period. The real value of flow-through shares declined almost 70 per cent ($360 million), and the real value of the Atlantic investment tax credit fell approximately by half, or $250 million, largely due to reduced take-up, although access by the oil and gas industry was restricted in 2014 and eliminated in 2016. Payments to Bombardier to support the C Series were eliminated, for a saving of about $190 million, and payments under the SR&ED tax incentive fell $170 million, reflecting policy changes and lower take-up in recent years. The Technology Partnerships Canada program was also eliminated, for a saving of $330 million, but was effectively replaced by the Strategic Aerospace and Defence Initiative with spending of $173 million in 2014–15. The lifetime capital gains exemption for farming and fishing property rose by three-quarters over the period ($225 million), largely reflecting a series of enrichments to the measure.33
The way federal subsidies were delivered changed substantially from 2001–02 to 2014–15 (Chart 7). Two changes are notable. First, the share of spending programs rose almost 20 percentage points in 2003–04, largely due to increased agricultural income-support payments. Second, after roughly covering the social costs of their lending activities up to 2006–07, the federal Business Development Bank (BDC) and Farm Credit Canada began providing subsidized financing. This
31 Investissement Québec was created in 2011, but represents a continuation of the Société générale de financement, which was active in 2005–06.
32 For both the Business Development Bank and Farm Credit Canada, the subsidy provided was near zero in 2005–06 and 2006–07.
33 Fishing property was added in 2006 and the lifetime limit was increased in 2007 from $500,000 to $750,000 and to $800,000 in 2013. See Finance Canada (2016)
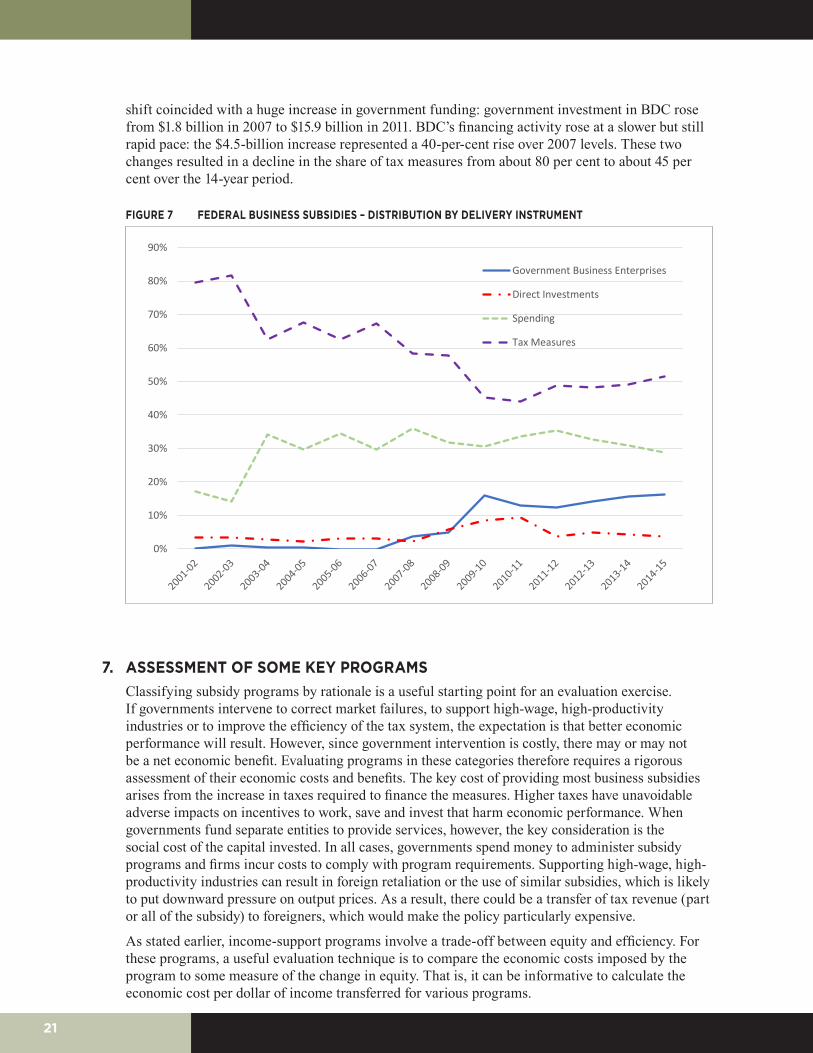
21
shift coincided with a huge increase in government funding: government investment in BDC rose from $1.8 billion in 2007 to $15.9 billion in 2011. BDC’s financing activity rose at a slower but still rapid pace: the $4.5-billion increase represented a 40-per-cent rise over 2007 levels. These two changes resulted in a decline in the share of tax measures from about 80 per cent to about 45 per cent over the 14-year period.
FIGURE 7 FEDERAL BUSINESS SUBSIDIES – DISTRIBUTION BY DELIVERY INSTRUMENT
0%
10%
20%
30%
40%
50%
60%
70%
80%
90%
Government Business Enterprises
Direct Investments
Spending
Tax Measures
7. ASSESSMENT OF SOME KEY PROGRAMSClassifying subsidy programs by rationale is a useful starting point for an evaluation exercise. If governments intervene to correct market failures, to support high-wage, high-productivity industries or to improve the efficiency of the tax system, the expectation is that better economic performance will result. However, since government intervention is costly, there may or may not be a net economic benefit. Evaluating programs in these categories therefore requires a rigorous assessment of their economic costs and benefits. The key cost of providing most business subsidies arises from the increase in taxes required to finance the measures. Higher taxes have unavoidable adverse impacts on incentives to work, save and invest that harm economic performance. When governments fund separate entities to provide services, however, the key consideration is the social cost of the capital invested. In all cases, governments spend money to administer subsidy programs and firms incur costs to comply with program requirements. Supporting high-wage, high-productivity industries can result in foreign retaliation or the use of similar subsidies, which is likely to put downward pressure on output prices. As a result, there could be a transfer of tax revenue (part or all of the subsidy) to foreigners, which would make the policy particularly expensive.
As stated earlier, income-support programs involve a trade-off between equity and efficiency. For these programs, a useful evaluation technique is to compare the economic costs imposed by the program to some measure of the change in equity. That is, it can be informative to calculate the economic cost per dollar of income transferred for various programs.
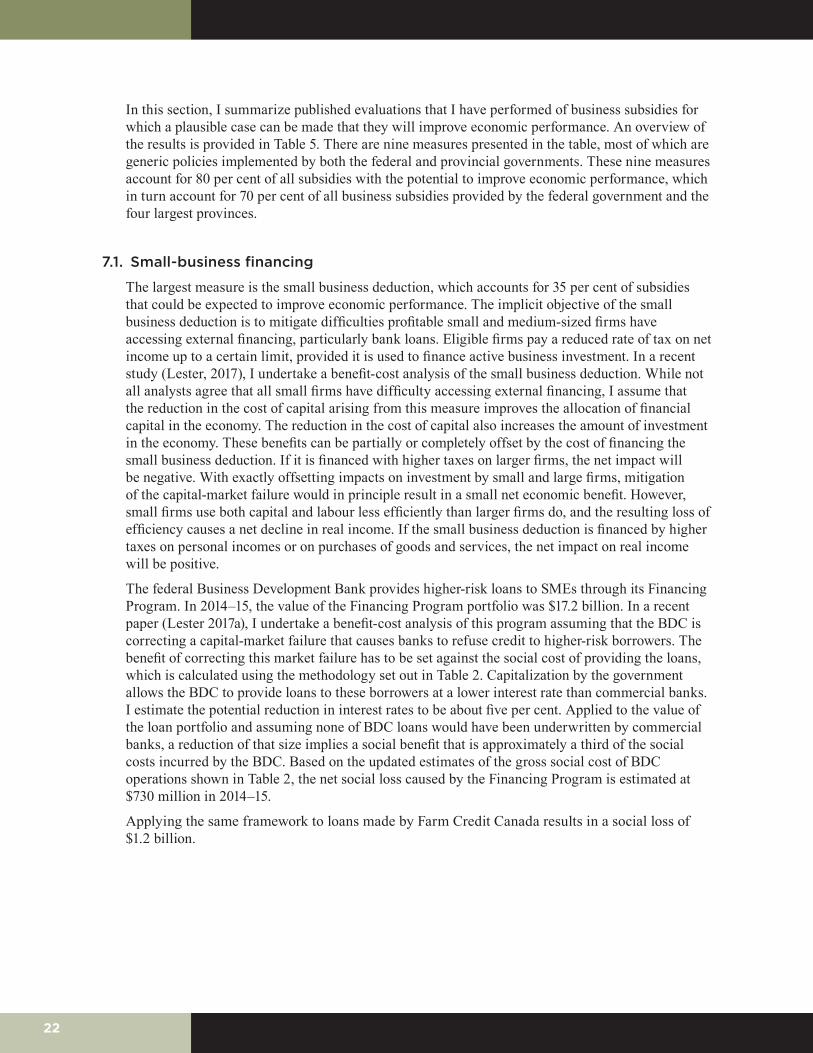
22
In this section, I summarize published evaluations that I have performed of business subsidies for which a plausible case can be made that they will improve economic performance. An overview of the results is provided in Table 5. There are nine measures presented in the table, most of which are generic policies implemented by both the federal and provincial governments. These nine measures account for 80 per cent of all subsidies with the potential to improve economic performance, which in turn account for 70 per cent of all business subsidies provided by the federal government and the four largest provinces.
7.1. Small-business financing
The largest measure is the small business deduction, which accounts for 35 per cent of subsidies that could be expected to improve economic performance. The implicit objective of the small business deduction is to mitigate difficulties profitable small and medium-sized firms have accessing external financing, particularly bank loans. Eligible firms pay a reduced rate of tax on net income up to a certain limit, provided it is used to finance active business investment. In a recent study (Lester, 2017), I undertake a benefit-cost analysis of the small business deduction. While not all analysts agree that all small firms have difficulty accessing external financing, I assume that the reduction in the cost of capital arising from this measure improves the allocation of financial capital in the economy. The reduction in the cost of capital also increases the amount of investment in the economy. These benefits can be partially or completely offset by the cost of financing the small business deduction. If it is financed with higher taxes on larger firms, the net impact will be negative. With exactly offsetting impacts on investment by small and large firms, mitigation of the capital-market failure would in principle result in a small net economic benefit. However, small firms use both capital and labour less efficiently than larger firms do, and the resulting loss of efficiency causes a net decline in real income. If the small business deduction is financed by higher taxes on personal incomes or on purchases of goods and services, the net impact on real income will be positive.
The federal Business Development Bank provides higher-risk loans to SMEs through its Financing Program. In 2014–15, the value of the Financing Program portfolio was $17.2 billion. In a recent paper (Lester 2017a), I undertake a benefit-cost analysis of this program assuming that the BDC is correcting a capital-market failure that causes banks to refuse credit to higher-risk borrowers. The benefit of correcting this market failure has to be set against the social cost of providing the loans, which is calculated using the methodology set out in Table 2. Capitalization by the government allows the BDC to provide loans to these borrowers at a lower interest rate than commercial banks. I estimate the potential reduction in interest rates to be about five per cent. Applied to the value of the loan portfolio and assuming none of BDC loans would have been underwritten by commercial banks, a reduction of that size implies a social benefit that is approximately a third of the social costs incurred by the BDC. Based on the updated estimates of the gross social cost of BDC operations shown in Table 2, the net social loss caused by the Financing Program is estimated at $730 million in 2014–15.
Applying the same framework to loans made by Farm Credit Canada results in a social loss of $1.2 billion.
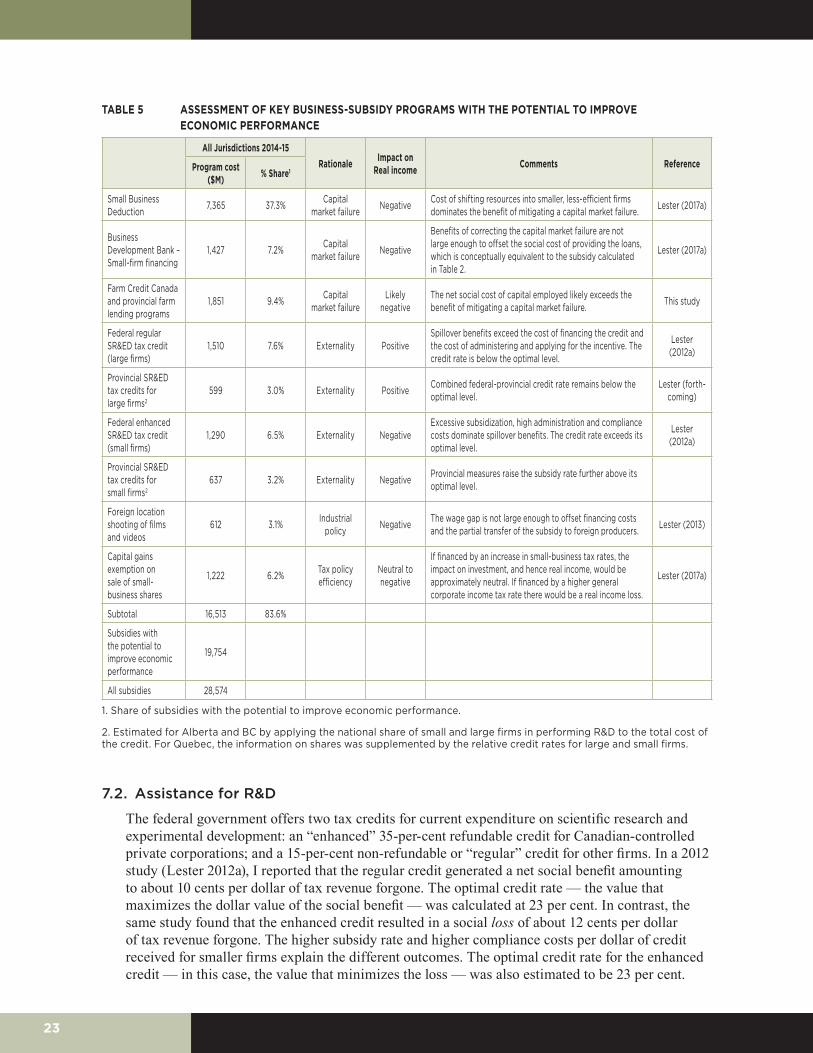
23
TABLE 5 ASSESSMENT OF KEY BUSINESS-SUBSIDY PROGRAMS WITH THE POTENTIAL TO IMPROVE ECONOMIC PERFORMANCE
All Jurisdictions 2014-15
Rationale Impact on Real income Comments ReferenceProgram cost
($M) % Share1
Small Business Deduction 7,365 37.3% Capital
market failure Negative Cost of shifting resources into smaller, less-efficient firms dominates the benefit of mitigating a capital market failure. Lester (2017a)
Business Development Bank – Small-firm financing
1,427 7.2% Capital market failure Negative
Benefits of correcting the capital market failure are not large enough to offset the social cost of providing the loans, which is conceptually equivalent to the subsidy calculated in Table 2.
Lester (2017a)
Farm Credit Canada and provincial farm lending programs
1,851 9.4% Capital market failure
Likely negative
The net social cost of capital employed likely exceeds the benefit of mitigating a capital market failure. This study
Federal regular SR&ED tax credit (large firms)
1,510 7.6% Externality PositiveSpillover benefits exceed the cost of financing the credit and the cost of administering and applying for the incentive. The credit rate is below the optimal level.
Lester (2012a)
Provincial SR&ED tax credits for large firms2
599 3.0% Externality Positive Combined federal-provincial credit rate remains below the optimal level.
Lester (forth-coming)
Federal enhanced SR&ED tax credit (small firms)
1,290 6.5% Externality NegativeExcessive subsidization, high administration and compliance costs dominate spillover benefits. The credit rate exceeds its optimal level.
Lester (2012a)
Provincial SR&ED tax credits for small firms2
637 3.2% Externality Negative Provincial measures raise the subsidy rate further above its optimal level.
Foreign location shooting of films and videos
612 3.1% Industrial policy Negative The wage gap is not large enough to offset financing costs
and the partial transfer of the subsidy to foreign producers. Lester (2013)
Capital gains exemption on sale of small-business shares
1,222 6.2% Tax policy efficiency
Neutral to negative
If financed by an increase in small-business tax rates, the impact on investment, and hence real income, would be approximately neutral. If financed by a higher general corporate income tax rate there would be a real income loss.
Lester (2017a)
Subtotal 16,513 83.6%
Subsidies with the potential to improve economic performance
19,754
All subsidies 28,574
1. Share of subsidies with the potential to improve economic performance.
2. Estimated for Alberta and BC by applying the national share of small and large firms in performing R&D to the total cost of the credit. For Quebec, the information on shares was supplemented by the relative credit rates for large and small firms.
7.2. Assistance for R&D
The federal government offers two tax credits for current expenditure on scientific research and experimental development: an “enhanced” 35-per-cent refundable credit for Canadian-controlled private corporations; and a 15-per-cent non-refundable or “regular” credit for other firms. In a 2012 study (Lester 2012a), I reported that the regular credit generated a net social benefit amounting to about 10 cents per dollar of tax revenue forgone. The optimal credit rate — the value that maximizes the dollar value of the social benefit — was calculated at 23 per cent. In contrast, the same study found that the enhanced credit resulted in a social loss of about 12 cents per dollar of tax revenue forgone. The higher subsidy rate and higher compliance costs per dollar of credit received for smaller firms explain the different outcomes. The optimal credit rate for the enhanced credit — in this case, the value that minimizes the loss — was also estimated to be 23 per cent.
24
In a more recent study (Lester 2017a), I perform a simplified benefit-cost analysis of overall federal-provincial R&D investment tax credits. Note that among the provinces, only Ontario provides different rates by firm size. The federal-provincial weighted-average effective SR&ED statutory tax credit for SMEs was about 43 per cent in 2014.34 Since the federal rate is above the calculated optimal subsidy rate, overlaying provincial subsidies necessarily increases the social loss. In addition, provincial variations in credit rates harm economic efficiency by shifting R&D investment across provincial boundaries, although this impact was not captured in the simplified benefit-cost analysis. In contrast, since the federal regular credit rate is below its optimal value, provincial programs raise the net social benefit from investment tax credits.
7.3. Foreign location shooting of films
In a 2013 paper (Lester 2013), I performed a benefit-cost analysis of the film and video production services tax credits, often described as tax credits for foreign location shooting, provided by the federal government and most provincial governments. The benefits included in the analysis were the additional tax revenue collected on non-resident performers and production services workers, along with cost savings realized on domestic production of films and videos due to increased scale of the industry. These benefits were overwhelmed by the costs imposed by raising taxes to finance the incentive, the transfer of part of the subsidy to foreign producers and the loss of efficiency caused by using subsidies to shift capital and labour into the film and video industry. The loss associated with the transfer of tax revenue to foreign producers is unusually large because all of the subsidized output is exported. This large terms-of-trade loss is a key factor raising the overall net social loss to almost 100 per cent of the tax revenue forgone.
A number of rationales are given for subsidizing foreign location shooting of films and videos. For example, the objectives of Ontario’s program are to “attract investment, increase job creation and help build a high-value domestic film and television production sector.”35 The first two objectives could be claimed for any targeted incentive. Assuming market forces are sufficiently strong to allocate labour and capital to their most efficient uses, all such incentives would reduce real income, as was demonstrated by the benefit-cost analysis summarized above.
The third objective — to create a high-value industry — implicitly rejects the assumption that capital and quality-adjusted labour earn the same return in all applications. As discussed in Section 2, there is evidence to support this view. However, while the necessary condition for industrial policy to be effective exists, government intervention is costly, so inter-industry differences in productivity would have to be substantial to realize a net benefit. In the case of the film-production-services industry, the productivity of labour and capital (total factor productivity) would have to be almost two-thirds higher than the all-industry average for the policy to generate a net social benefit. While estimates of total factor productivity by detailed industry are not available, such a large productivity advantage is highly unlikely given relative wages in a slightly more broadly defined industry. Statistics Canada data show that on average over the five years ending in 2015, wages in the motion picture and video industry were approximately equal to the economy-wide average.36
34 Provincial tax credits are deducted from the base for the federal tax credit, so the federal-provincial effective rate is lower than the statutory rate.
35 Quoted in “Report of the Expert Panel Examining Ontario’s Business Support Programs,” June 30, 2014.36 Cansim Table 281-0047.
25
7.4. Capital gains exemptions on the sale of small-business shares
The federal and all provincial governments provide a lifetime limited exemption for capital gains realized on the sale of small-business shares. As discussed in Section 2, taxation of capital gains on business shares can give rise to double taxation. If an innovation raises expected profitability of a firm, both the increase in the value of the shares and the additional income arising from the innovation will be taxed. The partial effect of exempting the sale of small-business shares from capital gains taxation is therefore to raise economic efficiency by encouraging investment.
This benefit should be compared to the cost of raising the tax revenue to finance the exemption. If the financing source is an increase in the tax rate applied to small-business income, the negative impact on investment would be approximately the same as the positive impact arising from the exemption. On the other hand, a plausible case can be made that the quality of the investment stimulated by the capital gains exemption would be higher than the investment lost through a higher income-tax rate. If the financing source is an increase in the general corporate income-tax rate, the net impact on investment would still be small, but the overall impact on efficiency would likely be negative for two reasons. First, the change in relative tax rates would shift capital from large firms to smaller, less-efficient firms. Second, a higher general corporate income-tax rate would induce international profit shifting out of Canada, so preserving revenue neutrality would involve a larger tax-rate increase than if the exemption is financed by raising the small-business tax rate. The net impact would be positive if the financing source is the personal-income or value-added tax rate, but the corporate income tax is a more natural source of financing since it keeps the overall tax burden on capital constant.
Of the seven measures reviewed in this section that address a standard market failure, only two clearly improve economic outcomes. These two programs — federal and provincial support for R&D performed by larger firms — account for about 11 per cent of the total funding for programs that could reasonably be expected to improve economic performance. The five other programs fail a benefit-cost test because of relatively small benefits from correcting market failures, high costs of intervention or too-high subsidy rates. The single industrial policy measure considered fails a benefit-cost test because the wage gap in the subsidized industry is not large enough to offset the costs of providing the subsidy. Capital gains exemptions on the sale of small-business shares have at best a neutral impact on real income, assuming the source of financing is higher corporate income taxes.
8. CONCLUSIONThis paper has presented unique information on business subsidies in Canada. Considering all delivery methods — program spending, the tax system, direct investment and the activities of government business enterprises — subsidies at the federal level and the four largest provinces were about $870 per person. Surprisingly, per capita subsidies were highest in Alberta, which is also the least transparent in reporting subsidies. Further, recent announcements suggest that real per capita subsidies will grow at a faster pace in Alberta than in other jurisdictions.
The analysis undertaken in this paper indicates that well over half of the spending on subsidies is of questionable value. About 70 per cent of spending on business subsidies is used to address market failures, to improve the trade-off between efficiency and protecting the revenue base when designing the tax system or to pursue industrial policy objectives. A plausible case can be made for expecting measures in these categories to raise real income. However, because government intervention is costly, at least two-thirds of spending in this category — or just under half of overall business subsidies — fails to improve economic performance. Another 11 per cent of subsidies have neither an explicit income objective nor a convincing efficiency rationale, which raises the share of questionable spending to almost 60 per cent of the total.
26
ANNEX 1: DATA SOURCES FOR TAX EXPENDITURESFinance Canada, Report on Federal Tax Expenditures — Concepts, Estimates and Evaluations 2016. (http://www.fin.gc.ca/taxexp-depfisc/2016/taxexp16-eng.asp)
Ministère des finances du Quebec, Dépenses fiscales 2015 (published only in French). http://www.finances.gouv.qc.ca/documents/autres/fr/AUTFR_DepensesFiscales2015.pdf
Ontario Finance Ministry, Transparency in Taxation 2015, available only online. http://www.fin.gov.on.ca/en/budget/fallstatement/2015/transparency.html.
Alberta Ministry of Finance, Fiscal Plan 2016-19, Tax Plan Annex. http://finance.alberta.ca/publications/budget/budget2016/fiscal-plan-complete.pdf.
B.C. Ministry of Finance, Budget and Fiscal Plan, Appendix A1. http://bcbudget.gov.bc.ca/2015/bfp/2015_budget_and_fiscal_plan.pdf.
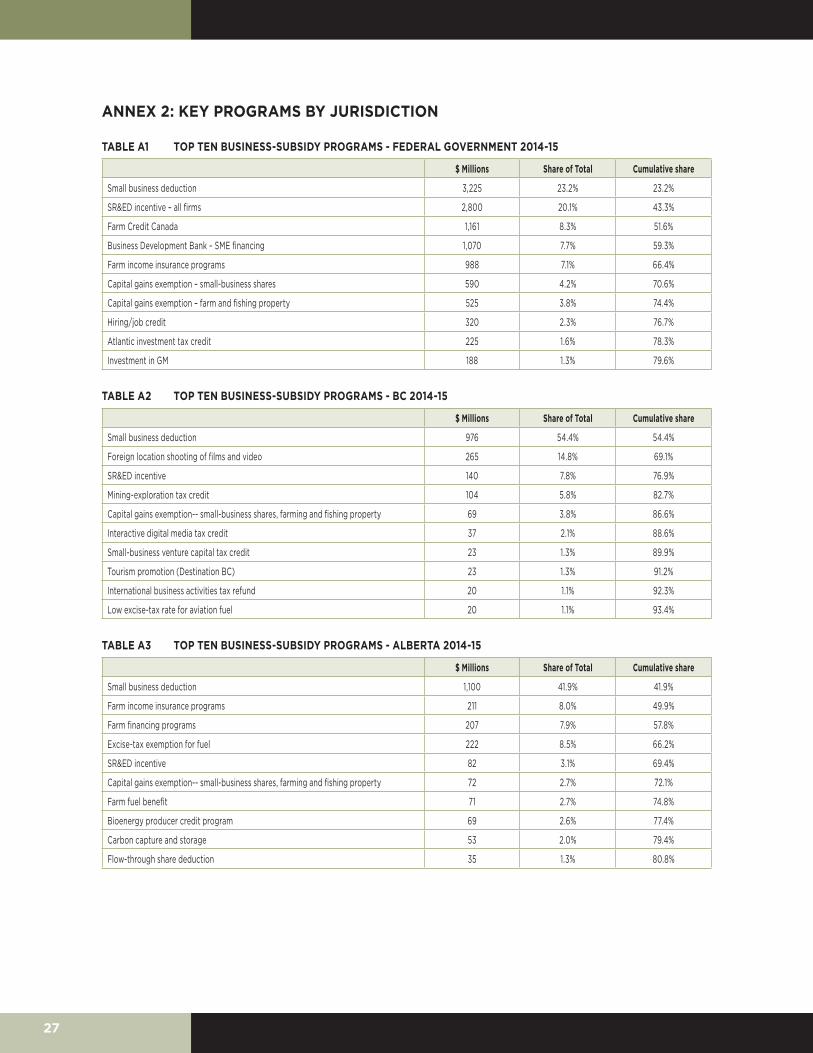
27
ANNEX 2: KEY PROGRAMS BY JURISDICTION
TABLE A1 TOP TEN BUSINESS-SUBSIDY PROGRAMS - FEDERAL GOVERNMENT 2014-15
$ Millions Share of Total Cumulative share
Small business deduction 3,225 23.2% 23.2%
SR&ED incentive – all firms 2,800 20.1% 43.3%
Farm Credit Canada 1,161 8.3% 51.6%
Business Development Bank – SME financing 1,070 7.7% 59.3%
Farm income insurance programs 988 7.1% 66.4%
Capital gains exemption – small-business shares 590 4.2% 70.6%
Capital gains exemption – farm and fishing property 525 3.8% 74.4%
Hiring/job credit 320 2.3% 76.7%
Atlantic investment tax credit 225 1.6% 78.3%
Investment in GM 188 1.3% 79.6%
TABLE A2 TOP TEN BUSINESS-SUBSIDY PROGRAMS - BC 2014-15
$ Millions Share of Total Cumulative share
Small business deduction 976 54.4% 54.4%
Foreign location shooting of films and video 265 14.8% 69.1%
SR&ED incentive 140 7.8% 76.9%
Mining-exploration tax credit 104 5.8% 82.7%
Capital gains exemption-- small-business shares, farming and fishing property 69 3.8% 86.6%
Interactive digital media tax credit 37 2.1% 88.6%
Small-business venture capital tax credit 23 1.3% 89.9%
Tourism promotion (Destination BC) 23 1.3% 91.2%
International business activities tax refund 20 1.1% 92.3%
Low excise-tax rate for aviation fuel 20 1.1% 93.4%
TABLE A3 TOP TEN BUSINESS-SUBSIDY PROGRAMS - ALBERTA 2014-15
$ Millions Share of Total Cumulative share
Small business deduction 1,100 41.9% 41.9%
Farm income insurance programs 211 8.0% 49.9%
Farm financing programs 207 7.9% 57.8%
Excise-tax exemption for fuel 222 8.5% 66.2%
SR&ED incentive 82 3.1% 69.4%
Capital gains exemption-- small-business shares, farming and fishing property 72 2.7% 72.1%
Farm fuel benefit 71 2.7% 74.8%
Bioenergy producer credit program 69 2.6% 77.4%
Carbon capture and storage 53 2.0% 79.4%
Flow-through share deduction 35 1.3% 80.8%
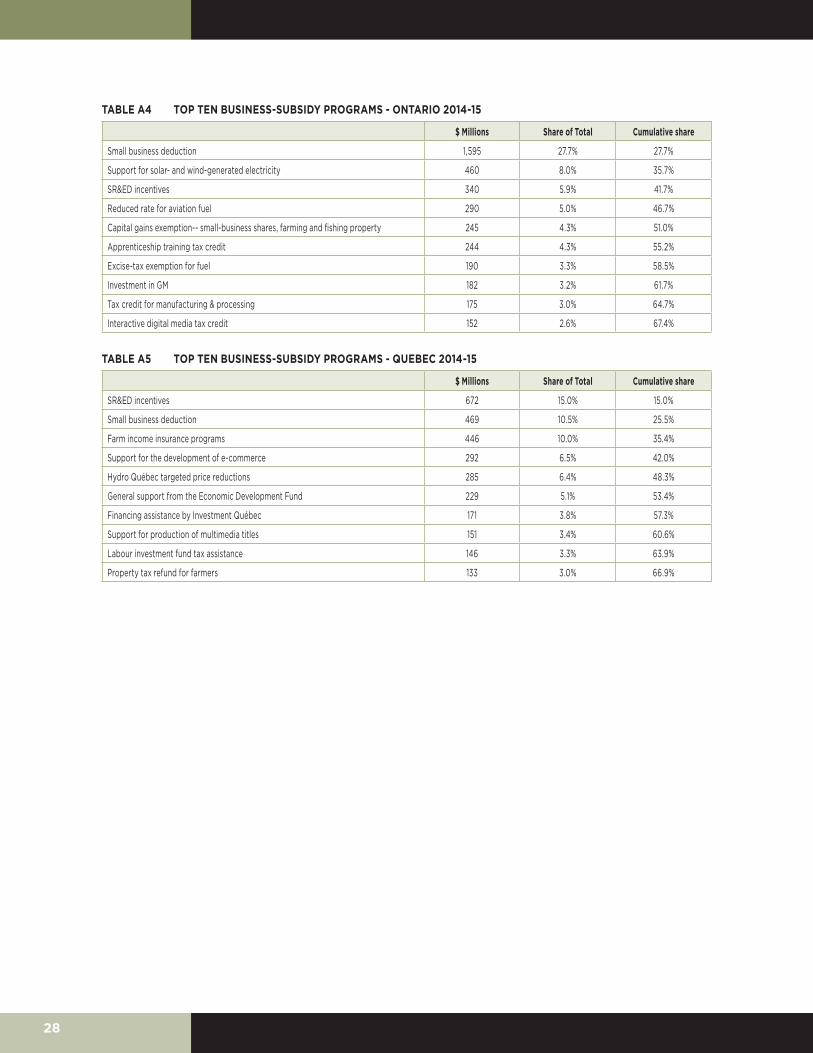
28
TABLE A4 TOP TEN BUSINESS-SUBSIDY PROGRAMS - ONTARIO 2014-15
$ Millions Share of Total Cumulative share
Small business deduction 1,595 27.7% 27.7%
Support for solar- and wind-generated electricity 460 8.0% 35.7%
SR&ED incentives 340 5.9% 41.7%
Reduced rate for aviation fuel 290 5.0% 46.7%
Capital gains exemption-- small-business shares, farming and fishing property 245 4.3% 51.0%
Apprenticeship training tax credit 244 4.3% 55.2%
Excise-tax exemption for fuel 190 3.3% 58.5%
Investment in GM 182 3.2% 61.7%
Tax credit for manufacturing & processing 175 3.0% 64.7%
Interactive digital media tax credit 152 2.6% 67.4%
TABLE A5 TOP TEN BUSINESS-SUBSIDY PROGRAMS - QUEBEC 2014-15
$ Millions Share of Total Cumulative share
SR&ED incentives 672 15.0% 15.0%
Small business deduction 469 10.5% 25.5%
Farm income insurance programs 446 10.0% 35.4%
Support for the development of e-commerce 292 6.5% 42.0%
Hydro Québec targeted price reductions 285 6.4% 48.3%
General support from the Economic Development Fund 229 5.1% 53.4%
Financing assistance by Investment Québec 171 3.8% 57.3%
Support for production of multimedia titles 151 3.4% 60.6%
Labour investment fund tax assistance 146 3.3% 63.9%
Property tax refund for farmers 133 3.0% 66.9%

29
REFERENCESBergevin, Philippe, and Finn Poschmann. 2013. “Reining in the Risks: Rethinking the Role of Crown
Financial Corporations in Canada.” CD Howe Institute Commentary 372. http://papers.ssrn.com/sol3/papers.cfm?abstract_id=2286869.
Finance Canada. Budget 2015.
———. Report on Federal Tax Expenditures — Concepts, Estimates and Evaluations 2016. Ottawa, Canada: Finance Canada, 2016.
———. 2016. Report on Federal Tax Expenditures - Concepts, Estimates and Evaluations 2016. Ottawa, Canada: Finance Canada.
Jenkins, Glenn, and Chun-Yan Kuo. 2007. “The Economic Opportunity Cost of Capital for Canada—An Empirical Update.” Queen’s Economics Department Working Paper, no. 1133. http://citeseerx.ist.psu.edu/viewdoc/download?doi=10.1.1.489.3929&rep=rep1&type=pdf.
Lester, John. Forthcoming. “Tax Incentives for Business Investment: Do They Work?” In Conference Proceedings “Reforming the Corporate Tax in a Changing World.” Canadian Tax Foundation.
———. 2012a. “Benefit-Cost Analysis of R&D Support Programs.” Canadian Tax Journal/Revue Fiscale Canadienne 60 (4). http://papers.ssrn.com/sol3/papers.cfm?abstract_id=2215681.
———. 2012b. “Managing Tax Expenditures and Government Program Spending: Proposals for Reform.” University of Calgary School of Public Policy Research Paper. http://papers.ssrn.com/sol3/papers.cfm?abstract_id=2321923.
———. 2013. “Tax Credits for Foreign Location Shooting of Films: No Net Benefit for Canada.” Canadian Public Policy 39 (3):451–472.
———. 2017a. “Policy Interventions Favouring Small Business: Rationales, Results and Recommendations.” University of Calgary School of Public Policy Research Paper 10 (11):55.
———. 2017b. “Reviewing Federal Tax Expenditures.” In Income Tax at 100 Years: Essays and Reflections on the Income War Tax Act, edited by Jinyan Li, Scott Wilkie, and Larry Chapman. Canadian Tax Foundation/L’Association Canadienne d’Etudes Fiscales.
Mintz, Jack, Robert Brown, James Cowan, Bev Dahlby, Wilfrid Lefebvre, Nancy Olewiler, Norm Promilow, and Stephen R. Richardson. 1997. Report of the Technical Committee on Business Taxation. Ottawa, Canada: Department of Finance.
Mintz, Jack, and Stephen R. Richardson. 1995. “The Lifetime Capital Gains Exemption: An Evaluation/L’exonération Cumulative Des Gains En Capital: Une Évaluation.” Canadian Public Policy/Analyse de Politiques 21:S1–S26.
Office of the Auditor General of Ontario. Annual Report 2015. Queen’s Printer for Ontario 2015, Chapter 3.04. http://www.auditor.on.ca/en/content/annualreports/arreports/en15/2015AR_en_final.pdf.
Pack, Howard, and Kamal Saggi. 2006. “Is There a Case for Industrial Policy? A Critical Survey.” The World Bank Research Observer 21 (2):267–297.

30
About the Author
John Lester is a former federal government economist who writes on public policy issues. Mr. Lester’s last public service assignment was as Director of Research for the Expert Panel Review of Federal Support to Research and Development. Prior to that, he managed the Tax Evaluations and Research Group at Finance Canada. Since leaving the public service, Mr. Lester has published papers with The School of Public Policy, the Canadian Tax Journal, Canadian Public Policy and the C.D. Howe Institute. His research and current interests include federal government’s expenditure management system (including evaluation policy), cost-benefit analysis of government programs, particularly those related to R&D and innovation, as well as market failures in the financing of innovative projects and entrepreneurship policy.
31
ABOUT THE SCHOOL OF PUBLIC POLICY
The School of Public Policy has become the flagship school of its kind in Canada by providing a practical, global and focused perspective on public policy analysis and practice in areas of energy and environmental policy, international policy and economic and social policy that is unique in Canada.
The mission of The School of Public Policy is to strengthen Canada’s public service, institutions and economic performance for the betterment of our families, communities and country. We do this by:
• Building capacity in Government through the formal training of public servants in degree and non-degree programs, giving the people charged with making public policy work for Canada the hands-on expertise to represent our vital interests both here and abroad;
• Improving Public Policy Discourse outside Government through executive and strategic assessment programs, building a stronger understanding of what makes public policy work for those outside of the public sector and helps everyday Canadians make informed decisions on the politics that will shape their futures;
• Providing a Global Perspective on Public Policy Research through international collaborations, education, and community outreach programs, bringing global best practices to bear on Canadian public policy, resulting in decisions that benefit all people for the long term, not a few people for the short term.
The School of Public Policy relies on industry experts and practitioners, as well as academics, to conduct research in their areas of expertise. Using experts and practitioners is what makes our research especially relevant and applicable. Authors may produce research in an area which they have a personal or professional stake. That is why The School subjects all Research Papers to a double anonymous peer review. Then, once reviewers comments have been reflected, the work is reviewed again by one of our Scientific Directors to ensure the accuracy and validity of analysis and data.
The School of Public PolicyUniversity of Calgary, Downtown Campus906 8th Avenue S.W., 5th FloorCalgary, Alberta T2P 1H9Phone: 403 210 3802
DISTRIBUTIONOur publications are available online at www.policyschool.ca.
DISCLAIMERThe opinions expressed in these publications are the authors' alone and therefore do not necessarily reflect the opinions of the supporters, staff, or boards of The School of Public Policy.
COPYRIGHTCopyright © Lester 2018. This is an open-access paper distributed under the terms of the Creative Commons license CC BY-NC 4.0, which allows non-commercial sharing and redistribution so long as the original author and publisher are credited.
ISSNISSN 2560-8312 The School of Public Policy Publications (Print) ISSN 2560-8320 The School of Public Policy Publications (Online)
DATE OF ISSUEJanuary 2018
MEDIA INQUIRIES AND INFORMATIONFor media inquiries, please contact Morten Paulsen at 403-220-2540. Our web site, www.policyschool.ca, contains more information about The School's events, publications, and staff.
DEVELOPMENTFor information about contributing to The School of Public Policy, please contact Paul Beaudry by telephone at 403-220-4624 or by e-mail at [email protected].
32
RECENT PUBLICATIONS BY THE SCHOOL OF PUBLIC POLICY
SOCIAL POLICY TRENDS: CALGARY FOOD BANK CLIENTS AND SOCIAL ASSISTANCE CASELOADShttps://www.policyschool.ca/wp-content/uploads/2017/12/Social-Trends-Food-Bank-December-2017.pdfMargarita Gres Wilkins and Ron Kneebone | December 2017
SOCIAL POLICY TRENDS- LABOUR FORCE PARTICIPATION RATE OF WOMEN WITH YOUNG CHILDRENhttps://www.policyschool.ca/wp-content/uploads/2017/11/Social-Policy-Trends-Womens-LF-Participation.pdfMargarita Gres Wilkins and Ron Kneebone | November 2017
IMPROVING OUR UNDERSTANDING OF UNMET NEEDS AMONG ADULTS WITH A DEVELOPMENTAL DISABILITYhttps://www.policyschool.ca/wp-content/uploads/2017/11/Developmental-Disability-Lai-Dunn-Zwicker.pdfJonathan Lai, Stephanie Dunn and Jennifer Zwicker | November 2017
WHETHER IT IS THE U.S. HOUSE OR SENATE TAX CUT PLAN – IT’S TROUBLE FOR CANADIAN COMPETITIVENESShttps://www.policyschool.ca/wp-content/uploads/2017/11/Final-Tax-Policy-Trends-Tax-Cuts-and-Jobs-Act.pdfJack Mintz and Philip Bazel | November 2017
BUSINESS CASES FOR MAJOR PUBLIC INFRASTRUCTURE PROJECTS IN CANADAhttps://www.policyschool.ca/wp-content/uploads/2017/12/Public-Infrastructure-Projects-Iacobacci-final.pdfMario Iacobacci | November 2017
TAXING FEEDLOTS IN ALBERTA: LETHBRIDGE COUNTY’S TAX ON CONFINED FEEDING OPERATIONShttps://www.policyschool.ca/wp-content/uploads/2017/11/Taxing-Feedlots-Dahlby-McMillan-Khanal.pdfBev Dahlby, Melville McMillan and Mukesh Khanal | November 2017
PUTTING THE ALBERTA BUDGET ON A NEW TRAJECTORYhttps://www.policyschool.ca/wp-content/uploads/2017/10/AB-Budget-New-Trajectory-MacKinnon-Mintz-final.pdfJanice MacKinnon and Jack Mintz | October 2017
INDIGENOUS POLICY CONFERENCE SUMMARY REPORT: BEYOND RECONCILIATIONhttps://www.policyschool.ca/wp-content/uploads/2017/10/Indigenous-Policy-Conference-Lorefice-Boyd-Caron.pdfSophie Lorefice, Brendan Boyd and Gaétan Caron | October 2017
TAX POLICY TRENDS: SMALL BUSINESS TAX CUT NOT ENOUGH – U.S. TAX REFORMS WILL MAKE U.S. MORE ATTRACTIVE FOR START-UPShttps://www.policyschool.ca/wp-content/uploads/2017/10/Tax-Policy-Trends-Small-Business-Tax-Changes_Final.pdfJack Mintz and V. Balaji Venkatachalam | October 2017
SOCIAL POLICY TRENDS: FEDERAL AND PROVINCIAL CONTRIBUTIONS TO SOCIAL ASSISTANCEhttps://www.policyschool.ca/wp-content/uploads/2017/10/Social-Trends-SA-October-Final.pdfMargarita Gres Wilkins and Ronald Kneebone | October 2017
TAX POLICY TRENDS: REPUBLICANS REVEAL PROPOSED TAX OVERHAULhttps://www.policyschool.ca/wp-content/uploads/2017/10/Tax-Policy-Trends-Bazel-and-Mintz-Final.pdfPhilip Bazel and Jack Mintz | October 2017
SOFTWOOD LUMBER – SOME LESSONS FROM THE LAST SOFTWOOD (LUMBER IV) DISPUTEhttps://www.policyschool.ca/wp-content/uploads/2017/10/Softwood-Lumber-Feldman.pdfElaine Feldman | October 2017
BIG AND LITTLE FEET: A COMPARISON OF PROVINCIAL LEVEL CONSUMPTION- AND PRODUCTION-BASED EMISSIONS FOOTPRINTShttps://www.policyschool.ca/wp-content/uploads/2017/09/Big-and-Little-Feet-Dobson-Fellows.pdfSarah Dobson and G. Kent Fellows | September 2017