Business Results & Forecast · SCREEN Holdings Co., Ltd. ... A ratio has been rounded off. ... Net...
34
IR / May 8, 2018 Business Results & Forecast The Fiscal Year Ended March 31, 2018 May 8, 2018 SCREEN Holdings Co., Ltd. President Chief Executive Officer Eiji Kakiuchi *Cautionary statement with respect to these materials; The earnings forecasts contained in these materials and communicated verbally, are made in accordance with currently available information and rational assumptions. SCREEN Holdings does not promise that the forecasts or estimates will be accurate. Therefore, it should be noted that actual results could differ significantly due to a variety of factors. *Figures have been rounded down to eliminate amounts less than 100 million JPY, except per share figures. A ratio has been rounded off.
Transcript of Business Results & Forecast · SCREEN Holdings Co., Ltd. ... A ratio has been rounded off. ... Net...

IR / May 8, 20180
Business Results & Forecast The Fiscal Year Ended March 31, 2018
May 8, 2018
SCREEN Holdings Co., Ltd.President
Chief Executive OfficerEiji Kakiuchi
*Cautionary statement with respect to these materials; The earnings forecasts containedin these materials and communicated verbally, are made in accordance with currentlyavailable information and rational assumptions. SCREEN Holdings does not promisethat the forecasts or estimates will be accurate. Therefore, it should be noted that actualresults could differ significantly due to a variety of factors.
*Figures have been rounded down to eliminate amounts less than 100 million JPY,except per share figures. A ratio has been rounded off.

IR / May 8, 2018
Key Points of FY2018 Business Results
1
Operating results for the FY2018 included an increase in sales and profit for five consecutive years due to the strong performance of the SE business, with sales and profit marking a record high.- In all business segments, FY2018 sales and profit increased YoY.
In light of the strong results in the FY2018, we plan to increase dividends.
The SE and FT segments maintained a high level of orders received in the 4Q.

IR / May 8, 2018
1. FY2018 Business Results
2. Business Situation in 4 Segments
3. Financial Situation
4. FY2019 Business Forecast
Agenda
2
5. Recent Topics

IR / May 8, 20183
1. FY2018 Business Results
2. Business Situation in 4 Segments
3. Financial Situation
4. FY2019 Business Forecast
5. Recent Topics

IR / May 8, 2018
FY2018 Business Results (Consolidated)
(Billions of JPY)
FY2017 FY2018 Difference YoY
1Q 2Q 3Q 4Q Full 1Q 2Q 3Q 4Q Full Full
Net sales 62.2 73.8 73.8 90.2 300.2 72.9 80.8 70.3 115.2 339.3 39.1 13.0%SE 41.2 50.3 50.6 63.7 206.0 46.5 53.2 45.5 81.8 227.1 21.0 10.2%GA 9.6 12.4 10.4 13.2 45.8 10.8 13.9 11.8 16.8 53.4 7.5 16.5%FT 9.3 8.6 10.8 9.3 38.1 12.9 9.9 9.1 13.2 45.2 7.1 18.8%PE 1.8 2.1 1.6 3.3 8.9 2.3 3.3 3.4 2.9 12.1 3.2 36.7%Other 0.1 0.2 0.3 0.5 1.2 0.2 0.3 0.4 0.3 1.3 0 3.1%Operating income 5.1 7.0 9.1 12.4 33.7 7.3 9.5 6.8 18.9 42.7 8.9 26.7%(to net sales ratio) 8.2% 9.6% 12.4% 13.7% 11.2% 10.1% 11.8% 9.8% 16.4% 12.6% - 1.4pt
SE 4.3 6.0 8.0 10.8 29.3 6.4 8.1 5.6 16.0 36.3 6.9 23.8%GA (0.2) 0.8 0.1 0.7 1.4 0.1 1.0 0.3 1.4 3.0 1.5 108.0%FT 1.2 0.5 1.1 1.4 4.3 1.1 0.7 0.4 2.2 4.5 0.1 4.5%PE 0.1 0.1 0.1 0.2 0.7 0 0.3 0.6 (0) 1.0 0.2 34.8%Other (0.3) (0.5) (0.3) (0.9) (2.1) (0.4) (0.7) (0.2) (0.8) (2.2) (0) -Ordinary income 5.0 6.6 9.0 11.2 32.0 7.5 8.9 6.5 18.3 41.3 9.3 29.1%Profit attributable toowners of parent 3.7 5.7 6.8 7.8 24.1 5.1 5.5 4.3 13.4 28.5 4.3 18.0%
4
SE: Semiconductor Equipment Business GA: Graphic Arts Equipment Business FT: Display Production Equipment and Coater Business PE: PCB-related Equipment Business
*From April 2017, PE has been made a reportable segment.

IR / May 8, 2018
Operating income
Net salesComparison (YoY)
FY2017 FY2018
FY2017 FY2018
FY2018 FY2018Difference
3Q 4Q
Net sales 70.3 115.2 44.8 63.8%
Operating income(to net sales ratio)
6.89.8%
18.916.4%
12.06.7pt
175.5%
Ordinary income 6.5 18.3 11.7 179.6%
Profit attributable toowners of parent 4.3 13.4 9.0 207.2%
FY2017 FY2018Difference
Full Full
Net sales 300.2 339.3 39.1 13.0%
Operating income(to net sales ratio)
33.711.2%
42.712.6%
8.91.4pt
26.7%
Ordinary income 32.0 41.3 9.3 29.1%
Profit attributable toowners of parent 24.1 28.5 4.3 18.0%
>>Comparison (QoQ)
>>Comparison (YoY)
FY2018 Business Results (Consolidated)
(Billions of JPY)
(Billions of JPY)
5
33.7
300.2
42.7
339.3
IR / May 8, 2018
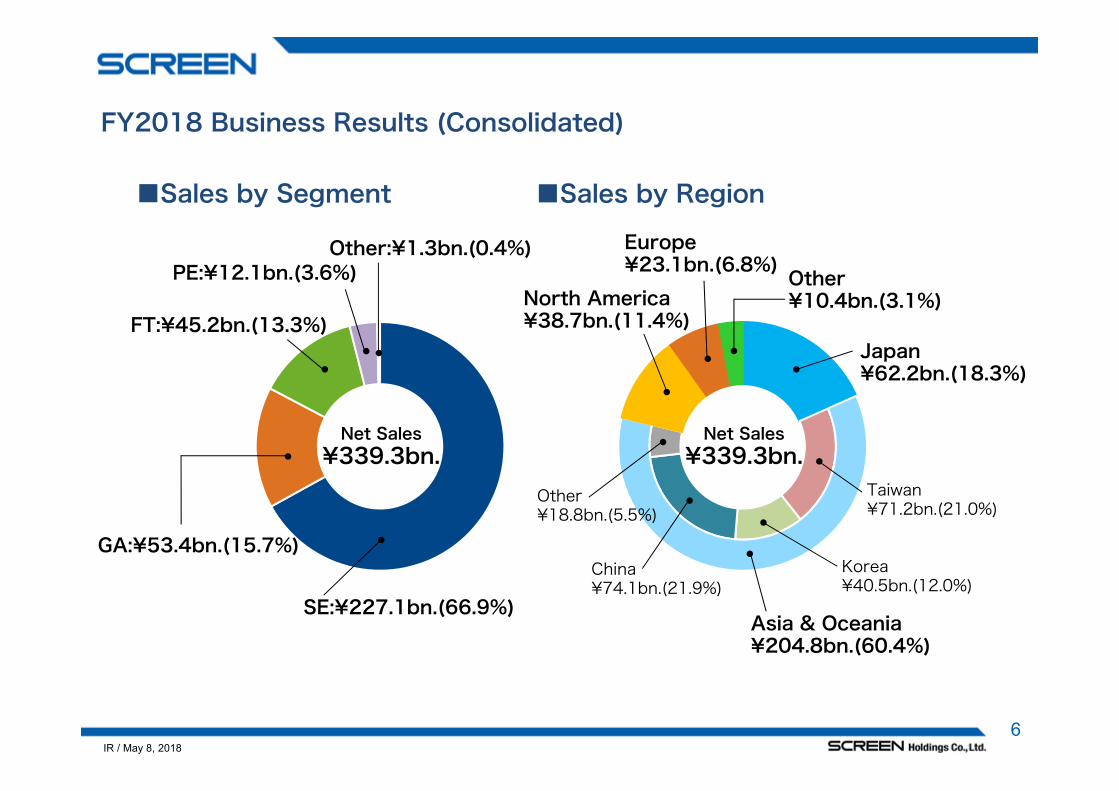
■Sales by Segment ■Sales by Region
Net Sales¥339.3bn.
GA:¥53.4bn.(15.7%)
PE:¥12.1bn.(3.6%)
FT:¥45.2bn.(13.3%)
Europe¥23.1bn.(6.8%)
Other¥10.4bn.(3.1%)
Japan¥62.2bn.(18.3%)
North America¥38.7bn.(11.4%)
Asia & Oceania¥204.8bn.(60.4%)
SE:¥227.1bn.(66.9%)
Other:¥1.3bn.(0.4%)
6
Net Sales¥339.3bn.
Taiwan¥71.2bn.(21.0%)
Korea¥40.5bn.(12.0%)
China¥74.1bn.(21.9%)
Other¥18.8bn.(5.5%)
FY2018 Business Results (Consolidated)

IR / May 8, 2018
4.37.5 6.8 9.3
5.910.2 7.9
11.28.2 9.6
12.413.7
10.111.8
9.8
16.4
‐10
0
10
20
0
50
100
150SE GA FT PE Other Operating…
(Billions of JPY)
FY2015 FY2016 FY2017 FY20181Q 2Q 3Q 4Q 1Q 2Q 3Q 4Q 1Q 2Q 3Q 4Q 1Q 2Q 3Q 4Q
Net sales 52.4 60.0 49.8 75.3 56.1 73.7 53.0 76.8 62.2 73.8 73.8 90.2 72.9 80.8 70.3 115.2SE 35.1 40.6 34.6 47.0 34.7 47.2 32.0 51.7 41.2 50.3 50.6 63.7 46.5 53.2 45.5 81.8GA 10.2 12.7 10.4 13.3 12.6 14.0 12.4 13.0 9.6 12.4 10.4 13.2 10.8 13.9 11.8 16.8FT 4.9 4.0 2.8 11.9 6.3 9.6 6.9 8.7 9.3 8.6 10.8 9.3 12.9 9.9 9.1 13.2PE 1.9 2.3 1.7 2.8 2.0 2.5 1.3 3.0 1.8 2.1 1.6 3.3 2.3 3.3 3.4 2.9Other 0.1 0.1 0.1 0.1 0.3 0.2 0.2 0.2 0.1 0.2 0.3 0.5 0.2 0.3 0.4 0.3
Operating income 2.2 4.4 3.3 7.0 3.2 7.5 4.1 8.5 5.1 7.0 9.1 12.4 7.3 9.5 6.8 18.9Operating income ratio(%)
4.3 7.5 6.8 9.3 5.9 10.2 7.9 11.2 8.2 9.6 12.4 13.7 10.1 11.8 9.8 16.4
7
Quarterly Net Sales and Operating Income (Consolidated)Net Sales(Billions of JPY) Operating Income Ratio(%)Operating Income Ratio
IR / May 8, 2018
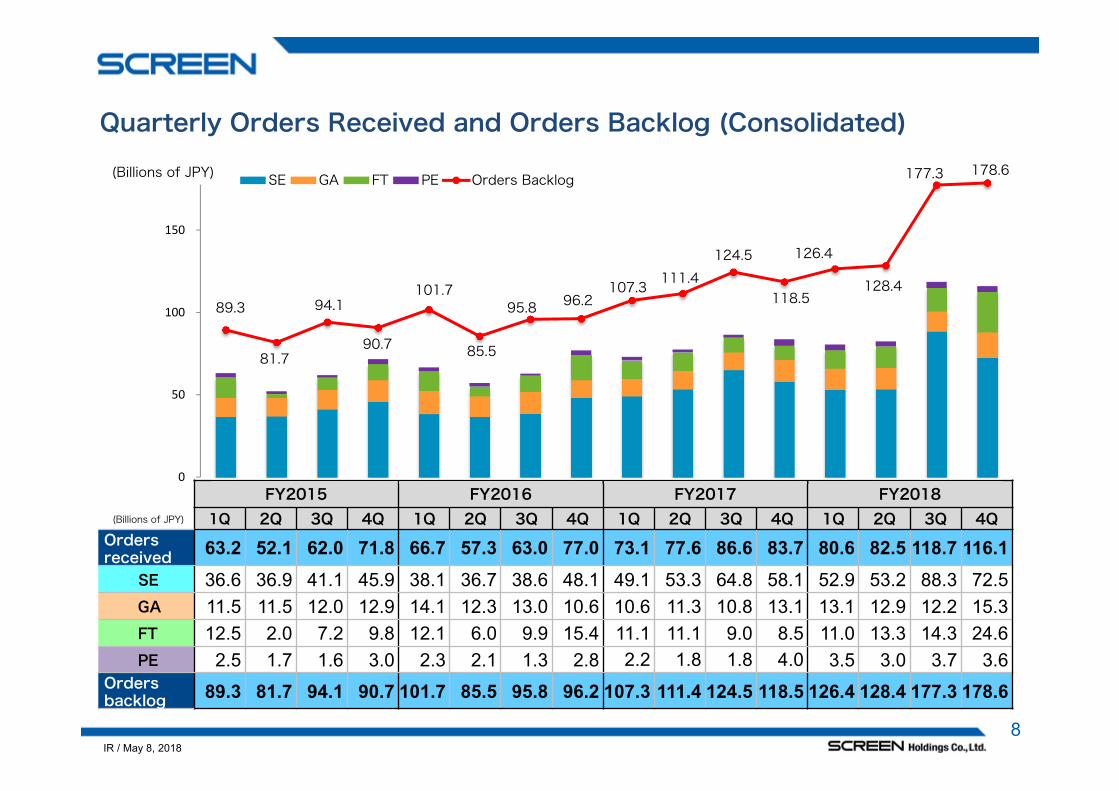
(Billions of JPY)
FY2015 FY2016 FY2017 FY20181Q 2Q 3Q 4Q 1Q 2Q 3Q 4Q 1Q 2Q 3Q 4Q 1Q 2Q 3Q 4Q
Ordersreceived 63.2 52.1 62.0 71.8 66.7 57.3 63.0 77.0 73.1 77.6 86.6 83.7 80.6 82.5 118.7 116.1
SE 36.6 36.9 41.1 45.9 38.1 36.7 38.6 48.1 49.1 53.3 64.8 58.1 52.9 53.2 88.3 72.5GA 11.5 11.5 12.0 12.9 14.1 12.3 13.0 10.6 10.6 11.3 10.8 13.1 13.1 12.9 12.2 15.3FT 12.5 2.0 7.2 9.8 12.1 6.0 9.9 15.4 11.1 11.1 9.0 8.5 11.0 13.3 14.3 24.6PE 2.5 1.7 1.6 3.0 2.3 2.1 1.3 2.8 2.2 1.8 1.8 4.0 3.5 3.0 3.7 3.6
Ordersbacklog 89.3 81.7 94.1 90.7 101.7 85.5 95.8 96.2 107.3 111.4 124.5 118.5 126.4 128.4 177.3 178.6
8
Quarterly Orders Received and Orders Backlog (Consolidated)
89.3
81.7
94.1
90.7
101.7
85.5
95.8 96.2 107.3 111.4
124.5
118.5
126.4
128.4
177.3 178.6
0
50
100
150
SE GA FT PE Orders Backlog(Billions of JPY)
IR / May 8, 20189
1. FY2018 Business Results
2. Business Situation in 4 Segments
3. Financial Situation
4. FY2019 Business Forecast
5. Recent Topics

IR / May 8, 2018
Net sales
Operating income
Comparison (YoY)FY2017 FY2018
DifferenceFull Full
Net sales 206.0 227.1 21.0 10.2%
Operating income(to net sales ratio)
29.314.2%
36.316.0%
6.91.8pt
23.8%
FY2018 FY2018Difference
3Q 4Q
Net sales 45.5 81.8 36.3 79.9%
Operating income(to net sales ratio)
5.612.5%
16.019.6%
10.37.2pt
183.2%
(Billions of JPY)
>>Comparison (YoY)
SE >> Business Environment
>>Comparison (QoQ)
10
(Billions of JPY)
FY2017 FY2018
FY2017 FY2018
Sales and profit increased YoY and QoQ. Full-year net sales and operating income marked a new record high. 4Q Sales (¥81.8 bn.) and 4Q profit (¥16.0 bn.) were the highest for a single quarter.
Sales for the full year, although demand from foundries decreased, investment from memory and logic chip manufacturers remained strong. As for batch-type cleaning equipment, demand for FRONTIER lineup for 200 mmwafers expanded.
206.0227.1
29.336.3

IR / May 8, 2018
FY2017 FY2018
Japan
Taiwan
China
Korea
North America
Europe
Other11%
11
■Sales by Application Device(Nonconsolidated)
■Sales by Region (Consolidated)
¥206.0bn¥227.1bn
12%14%
42%
13%
28%
17%
13%
5%
7%
8%7%11% 12%
SE >> Business Environment(Comparison YoY)
14% 15%2% 5%12%
15%16%
23%8%
12%
48%
30%
0%
50%
100%
FY2017 FY2018
Foundry
Logic
Flash
DRAM
Imaging Device
Other
IR / May 8, 2018
14 1611 10 14 18 18 16 17
2 2
1 24
512
3 19 9 19 21 10
2115
1521
29
15 7
16
15
14
31
23
29
16
89
4 18
10
6
18
11
30
51 5347
4032
1826
21
0%
50%
100%
FY20164Q
FY20171Q 2Q 3Q 4Q
FY20181Q 2Q 3Q 4Q
12
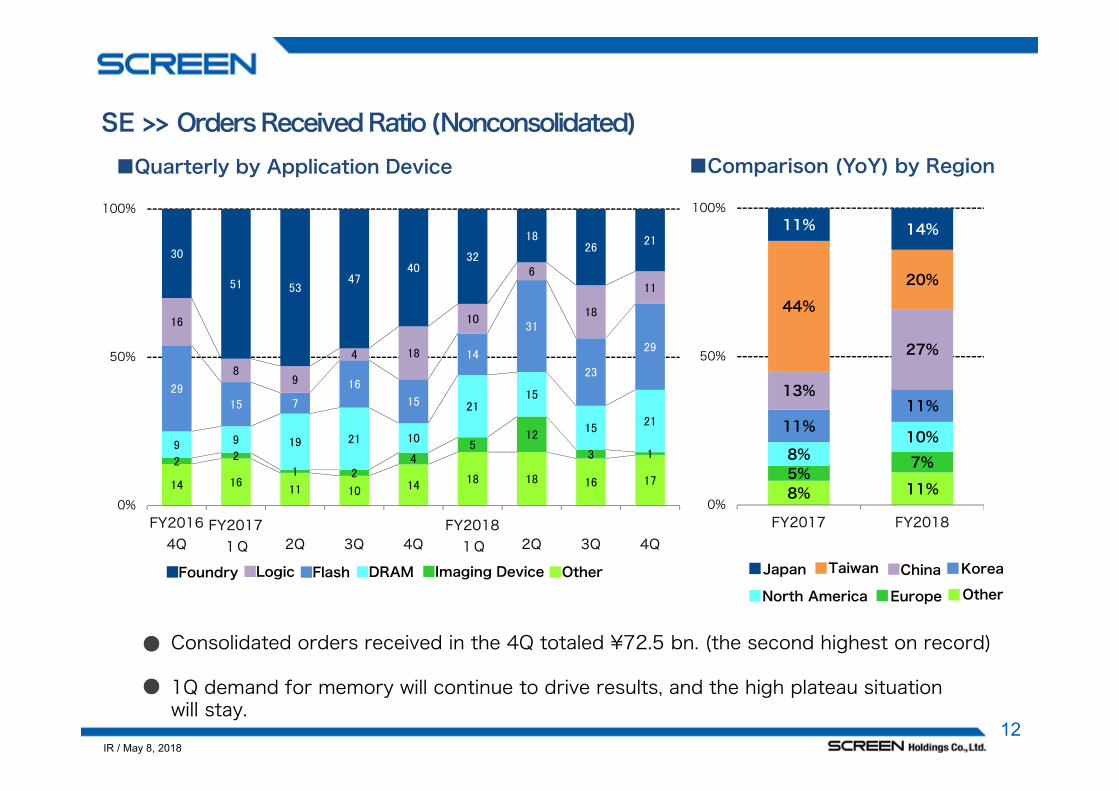
SE >> Orders Received Ratio (Nonconsolidated)
OtherLogic DRAMFoundry Imaging DeviceFlash
Consolidated orders received in the 4Q totaled ¥72.5 bn. (the second highest on record)
1Q demand for memory will continue to drive results, and the high plateau situation will stay.
■Comparison (YoY) by Region ■Quarterly by Application Device
8% 11%5%
7%8%10%
11%11%
13%
27%
44%
20%
11% 14%
0%
50%
100%
FY2017 FY2018
Europe
KoreaJapan China
North America
Taiwan
Other

IR / May 8, 2018
Net sales
Operating income
Comparison (YoY)FY2017 FY2018
DifferenceFull Full
Net sales 45.8 53.4 7.5 16.5%
Operating income(to net sales ratio)
1.43.2%
3.05.7%
1.52.5pt
108.0%
FY2018 FY2018Difference
3Q 4Q
Net sales 11.8 16.8 4.9 42.4%
Operating income(to net sales ratio)
0.33.1%
1.48.4%
1.05.4%
289.7%
(Billions of JPY)
>>Comparison (YoY)
>>Comparison (QoQ)
GA >> Business Environment
13
(Billions of JPY)
Sales and profit increased YoY and QoQ.- Sales of POD equipment and ink expanded.
FY2017 FY2018
FY2017 FY2018
45.853.4
1.43.0
IR / May 8, 2018
Net sales
Operating income
Comparison (YoY)FY2017 FY2018
DifferenceFull Full
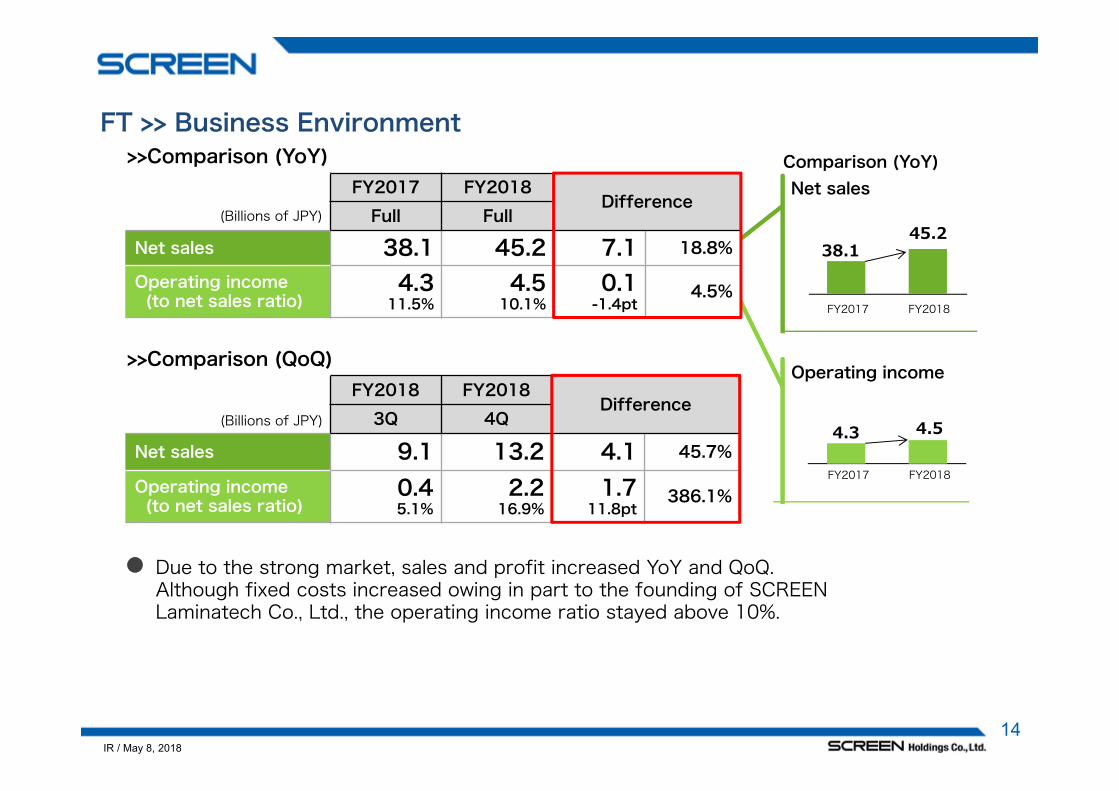
Net sales 38.1 45.2 7.1 18.8%
Operating income(to net sales ratio)
4.311.5%
4.510.1%
0.1-1.4pt
4.5%
FY2018 FY2018Difference
3Q 4Q
Net sales 9.1 13.2 4.1 45.7%
Operating income(to net sales ratio)
0.45.1%
2.216.9%
1.711.8pt
386.1%
>>Comparison (YoY)
>>Comparison (QoQ)
FT >> Business Environment
14
(Billions of JPY)
(Billions of JPY)
Due to the strong market, sales and profit increased YoY and QoQ. Although fixed costs increased owing in part to the founding of SCREEN Laminatech Co., Ltd., the operating income ratio stayed above 10%.
FY2017 FY2018
FY2017 FY2018
38.145.2
4.3 4.5

IR / May 8, 2018
0%
50%
100%
FY20164Q
FY20171Q 2Q 3Q 4Q
FY20181Q 2Q 3Q 4Q
Over G8
G7
G6
G5
G4
Under G3
Other
FT >> Quarterly Orders Received by Generation (Nonconsolidated)
15
Consolidated orders received in the 4Q (¥24.6 bn.) remained high, especially for large sized products.
Although we expect a temp drop in the 1Q, we prospect orders received to recover from the 2Q onward.
IR / May 8, 2018
Net sales
Operating income
Comparison (YoY)
PE >> Business Environment
16
>>Comparison (YoY)
>>Comparison (QoQ)
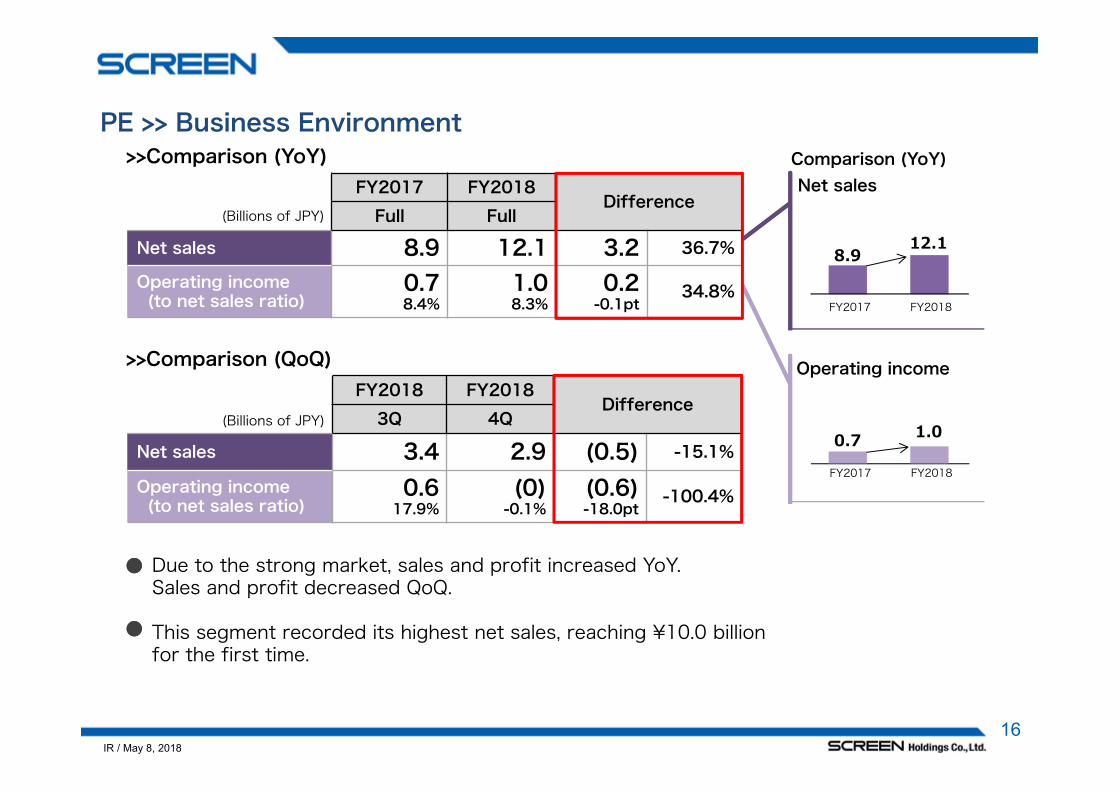
FY2017 FY2018Difference
Full Full
Net sales 8.9 12.1 3.2 36.7%
Operating income(to net sales ratio)
0.78.4%
1.08.3%
0.2-0.1pt
34.8%
FY2018 FY2018Difference
3Q 4Q
Net sales 3.4 2.9 (0.5) -15.1%
Operating income(to net sales ratio)
0.617.9%
(0)-0.1%
(0.6)-18.0pt
-100.4%
(Billions of JPY)
(Billions of JPY)
Due to the strong market, sales and profit increased YoY. Sales and profit decreased QoQ.
This segment recorded its highest net sales, reaching ¥10.0 billion for the first time.
FY2017 FY2018
FY2017 FY2018
8.912.1
0.7 1.0

IR / May 8, 201817
1. FY2018 Business Results
2. Business Situation in 4 Segments
3. Financial Situation
4. FY2019 Business Forecast
5. Recent Topics

IR / May 8, 2018
46.5 38.1 43.7 55.7
42.6 43.3 41.7 48.9
9.3 11.9 15.4 16.6
70.3 76.6 91.7
106.3 55.0 67.5
59.1
85.4
25.6 32.3
48.8
53.1
0
100
200
300
400
2015/3 2016/3 2017/3 2018/3
Cash & timedeposits
Notes & accountsreceivable
Inventories
Other currentasset
Property,plant& equipment
Intangible assets/investment
111.5 120.2 142.9
170.8
9.6 7.4 9.0
12.6
26.2 32.7
46.7
54.3
39.6 39.6
17.5
13.1
62.3 70.0
84.3
115.1
0
100
200
300
400
2015/3 2016/3 2017/3 2018/3
Notes & accountspayable
Interest-bearing debt
Other currentliabilities
Other noncurrentliabilities
Net assets
18
Equity Ratio : 47.5% (2017/3) 46.7% (2018/3)
Trend in B/S (Consolidated)>>Assets >>Liabilities & Net Assets
(Billions of JPY) (Billions of JPY)
270.0300.6
249.5
366.1
270.0300.6
249.5
366.1
IR / May 8, 201819
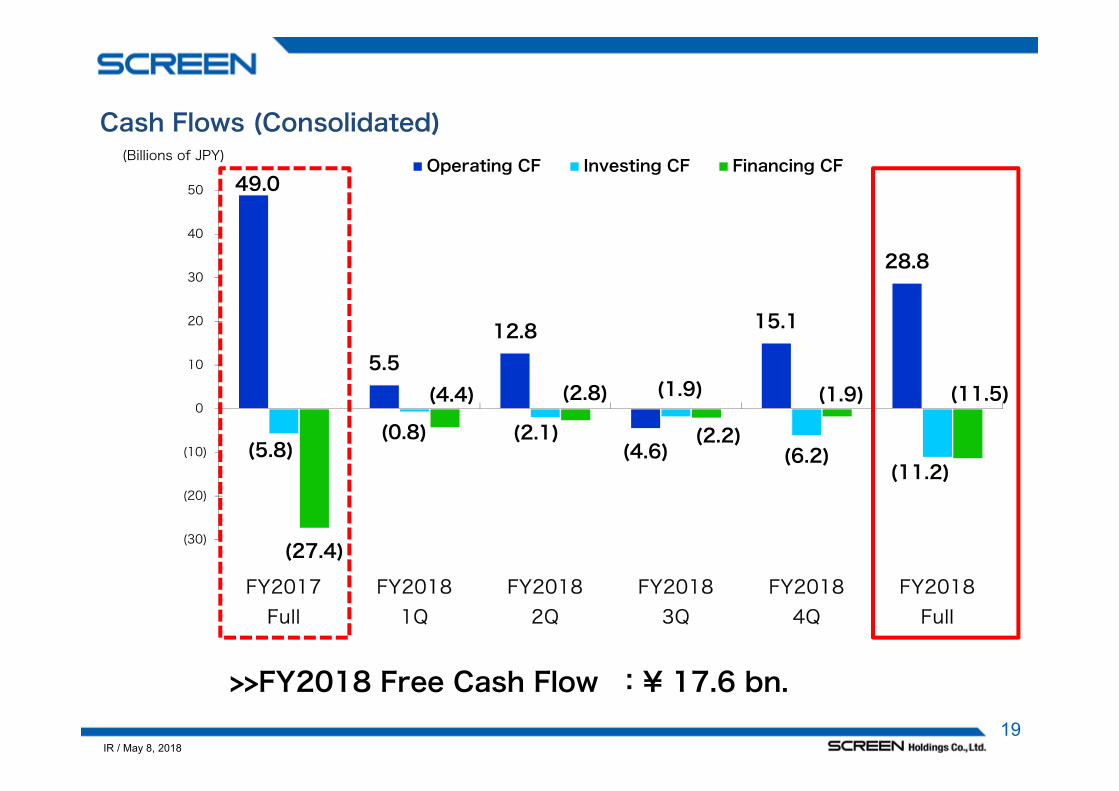
49.0
5.5 12.8
(4.6)
15.1
28.8
(5.8)(0.8) (2.1)
(1.9)
(6.2)(11.2)
(27.4)
(4.4) (2.8)
(2.2)
(1.9) (11.5)
(30)
(20)
(10)
0
10
20
30
40
50
FY2017Full
FY20181Q
FY20182Q
FY20183Q
FY20184Q
FY2018Full
Operating CF Investing CF Financing CF
>>FY2018 Free Cash Flow :¥ 17.6 bn.
(Billions of JPY)
Cash Flows (Consolidated)

IR / May 8, 201820
1. FY2018 Business Results
2. Business Situation in 4 Segments
3. Financial Situation
4. FY2019 Business Forecast
5. Recent Topics

IR / May 8, 2018
(Billions of JPY)
FY2017 FY2018 FY2019 DifferenceYoYFull Result Forecast
Result 1H 2H Full 1H 2H FullNet sales 300.2 153.8 185.5 339.3 176.0 208.0 384.0 44.6 13.2%
SE 206.0 99.8 127.3 227.1 115.5 144.5 260.0 32.8 14.4%GA 45.8 24.8 28.6 53.4 27.0 29.0 56.0 2.5 4.8%FT 38.1 22.8 22.3 45.2 25.0 25.0 50.0 4.7 10.5%PE 8.9 5.7 6.4 12.1 7.0 7.0 14.0 1.8 14.8%Other 1.2 0.5 0.7 1.3 1.5 2.5 4.0 2.6 202.1%
Operating income 33.7 16.9 25.8 42.7 21.0 32.0 53.0 10.2 24.0%(to net sales ratio) 11.2% 11.0% 13.9% 12.6% 11.9% 15.4% 13.8% - 1.2pt
SE 29.3 14.5 21.7 36.3 17.5* 27.5* 45.0* - -GA 1.4 1.2 1.7 3.0 1.5* 2.5* 4.0* - -FT 4.3 1.8 2.7 4.5 3.0* 2.5* 5.5* - -PE 0.7 0.3 0.6 1.0 0.5* 0.5* 1.0* - -Other (2.1) (1.1) (1.0) (2.2) (1.5)* (1.0)* (2.5)* - -
Ordinary income 32.0 16.4 24.8 41.3 20.0 31.0 51.0 9.6 23.4%Profit attributable toowners of parent 24.1 10.6 17.8 28.5 13.5 23.5 37.0 8.4 29.8%
Business Forecast for FY2019 (Consolidated)
21Assumed Exchange Rate>> USD1 = ¥105 EUR1 = ¥130
*Forecast operating income by segment: approximate numbers per 0.5 bn.
IR / May 8, 201822
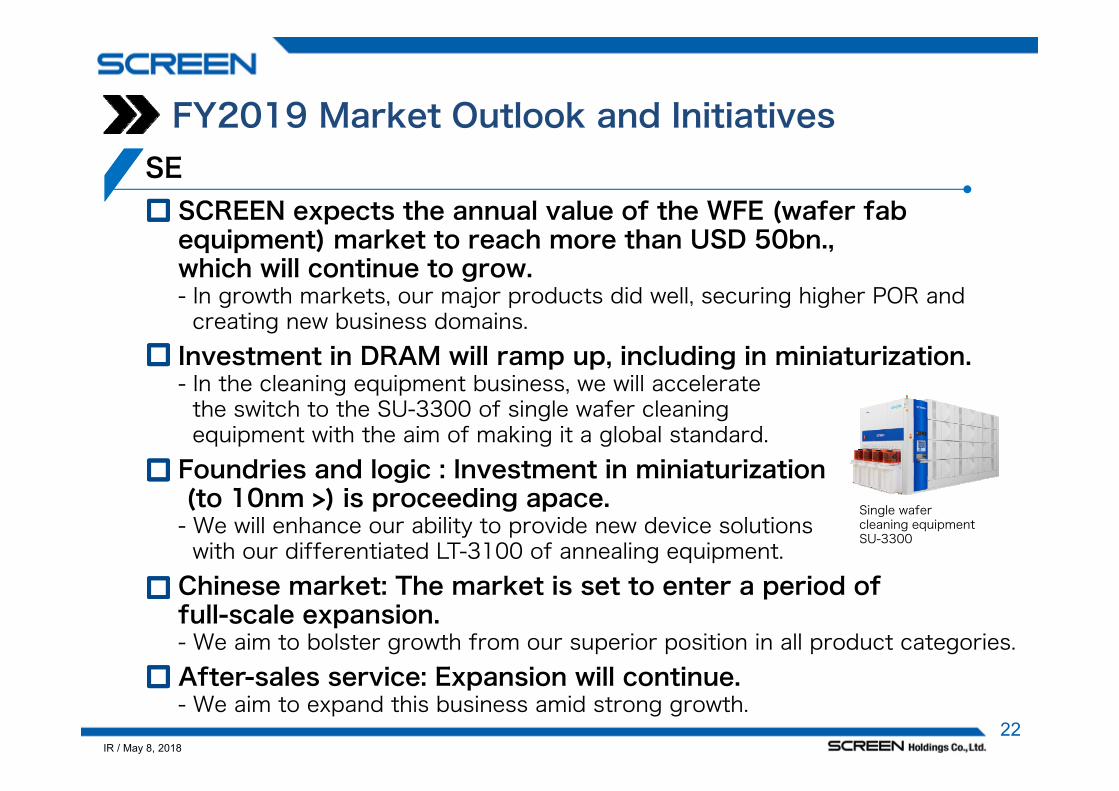
SE
FY2019 Market Outlook and Initiatives
SCREEN expects the annual value of the WFE (wafer fab equipment) market to reach more than USD 50bn., which will continue to grow.- In growth markets, our major products did well, securing higher POR and creating new business domains.Investment in DRAM will ramp up, including in miniaturization.- In the cleaning equipment business, we will accelerate the switch to the SU-3300 of single wafer cleaning equipment with the aim of making it a global standard.Foundries and logic : Investment in miniaturization(to 10nm >) is proceeding apace.- We will enhance our ability to provide new device solutions with our differentiated LT-3100 of annealing equipment.Chinese market: The market is set to enter a period of full-scale expansion.- We aim to bolster growth from our superior position in all product categories.After-sales service: Expansion will continue.- We aim to expand this business amid strong growth.
Single wafer cleaning equipmentSU-3300

IR / May 8, 201823
We will shift to a high earnings structure.- We will strengthen our earnings power by raising sales of POD equipment and expanding our after-sales businesses (ink and services).
GA
We aim to ensure the sustainability of our business portfolio and expand our business scale.- In the display business, we will expand our productlineup, including for G10 products and above.- In new business fields, we aim to expand salesand profits, including for polyimide (PI) coatersfor flexible substrates and coater/dryers for lithium-ion batteries.
FT
Coater/developerSK Series
Digital printing equipment Truepress Jet520NX

IR / May 8, 201824
Heighten our market presence by expanding sales.- We aim to expand our sales and earnings by bolsteringour product lineup of automotive inspection equipmentand direct imaging equipment capable of high-speedprocessing for copper circuit patterning for high-performance HDI substrates.
PE
Direct imaging equipmentLedia 6
- We aim to raise sales and expand our product lineup while firming up our customer base.
New Business: Move on to the sales growth phase
Automated Forged parts inspection systemIM-3200

IR / May 8, 201825
王35
6087 110
155
13.720.4
25.2 25.1
-40
-30
-20
-10
0
10
20
30
0
100
200
300
400
FY2015 FY2016 FY2017 FY2018(Forecast)
FY2019(Forecast)
Cash dividend forecast -Left axis Total consolidated shareholder return ratio -Right axis
(%)
*2 Dividend amounts shown above are calculated reflecting the share consolidation (a one-for-five consolidation ) implemented on October 1, 2016.
Total Consolidated Shareholder Return Ratio:Aim for 25% or above
(JPY)
*1 Cash dividends on FY2018 will be distributed to the upcoming 77th ordinary general meetingof shareholders scheduled on June 26, 2018.
We expect to increase per-share dividends by ¥110, in light of the strong resultsin the fiscal year ended March 31, 2018. * Forecasts announced in January: ¥100Taking into consideration results forecasts for the fiscal year ending March 31, 2019,we expect to pay out per-share dividends of ¥155.
Approximately+40%YoY
Approximately+40%YoY
IR / May 8, 2018
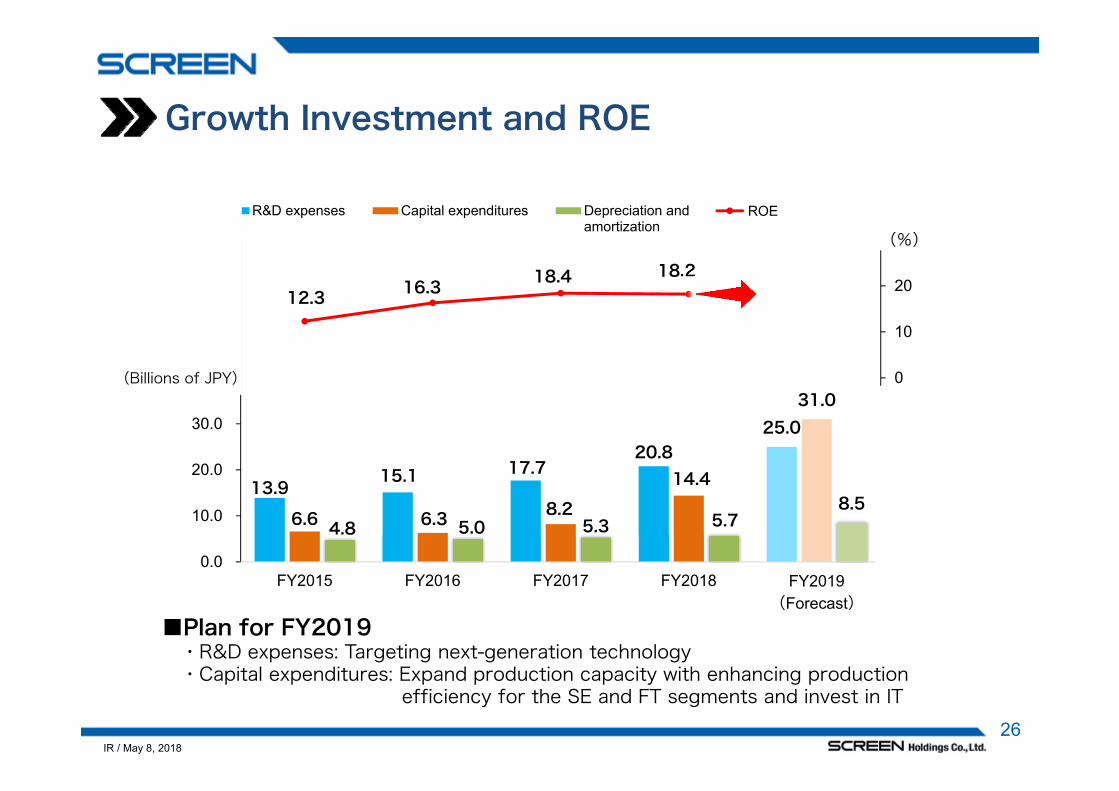
Growth Investment and ROE
26
13.9 15.1 17.7
20.8 25.0
6.6 6.3 8.2
14.4
31.0
4.8 5.0 5.3 5.7 8.5
12.3 16.3 18.4 18.2
-40
-30
-20
-10
0
10
20
30
0.0
10.0
20.0
30.0
40.0
50.0
60.0
70.0
FY2015 FY2016 FY2017 FY2018 FY2019(Forecast)
R&D expenses Capital expenditures Depreciation andamortization
¥ ROE
(%)
(Billions of JPY)
■Plan for FY2019・R&D expenses: Targeting next-generation technology・Capital expenditures: Expand production capacity with enhancing production
efficiency for the SE and FT segments and invest in IT

IR / May 8, 2018
First Year Starts off on a Good Note,achievable the target on Operating income to net sales ratio one year ahead.
Achieve fiscal year net sales of approximately ¥300 bn. Expand sales
22
11
33 Achieve ROE of approximately 15%Maintain and improve capital efficiency
Achieve an operating income to net sales ratio of 13% or above in the final fiscal year of the planMaintain and improve profitability
The above forward-looking numerical amounts are goals for organic growth.
27
Progress on Three-Year Medium-Term Management Plan “Challenge 2019”
Operating incometo net sales ratio: 13.8%
Net sales : ¥384bn.- Net sales exceeded ¥300 bn.for 3 consecutive years for the first time.
ROE : 15% or above

IR / May 8, 201828
1. FY2018 Business Results
2. Business Situation in 4 Segments
3. Financial Situation
4. FY2019 Business Forecast
5. Recent Topics

IR / May 8, 2018
Recent Topics
29
HD>>・Certified “Health and Productivity Management OrganizationRecognition Program 2018 - White 500 ‒ “
・Joins One-Stop Bioresource Project in Kyoto University
SE>>・Distribution and Support Agreement on Purion Ion Implant Platform to Japan Market with Axcelis Technologies, Massachusettsin US.
・Partners with Taiwan's National Tsing Hua University
GA>>・Receives 2018 Technology Award from Japanese Society of Printing Science and Technology
FT>>・We Plan to Build New Manufacturing Facility in Hikone for Display Production and Coating Equipment‒ Expand production capacity with enhancing production efficiency and profitability

IR / May 8, 201830
ESG-Related Initiatives
>>6 High-Materiality Tasks
The SCREEN Group recognizes significant similarities between its Corporate Philosophy and the UN’s Sustainable Development Goals (SDGs). In line with this recognition, the Group places emphasis on and is proactively taking on the initiatives particular 6 High-Materiality Tasks listed below among 17 goals. The Group is thus helping to create a peaceful and prosperous society in which no one is left behind while supporting sustainable growth in regions around the globe.
World agreement “Goals for Sustainable Development" to 2030
・Evaluation of the Board of Directors’ Effectiveness- The results are posted on our website under IR information.
・Strengthening of our engagement with shareholdersand other investors- In September and February, we conducted surveys of investors and analysts regarding the Company's IR activities. The average of all scores was 4.3 out of 5. We will give serious consideration to the valuable opinions that everyone provided and aim to reflect them in management, such as by holding dialogues with voting rights holders and otherwise enhancing our engagement with investors going forward.
IR / May 8, 201831
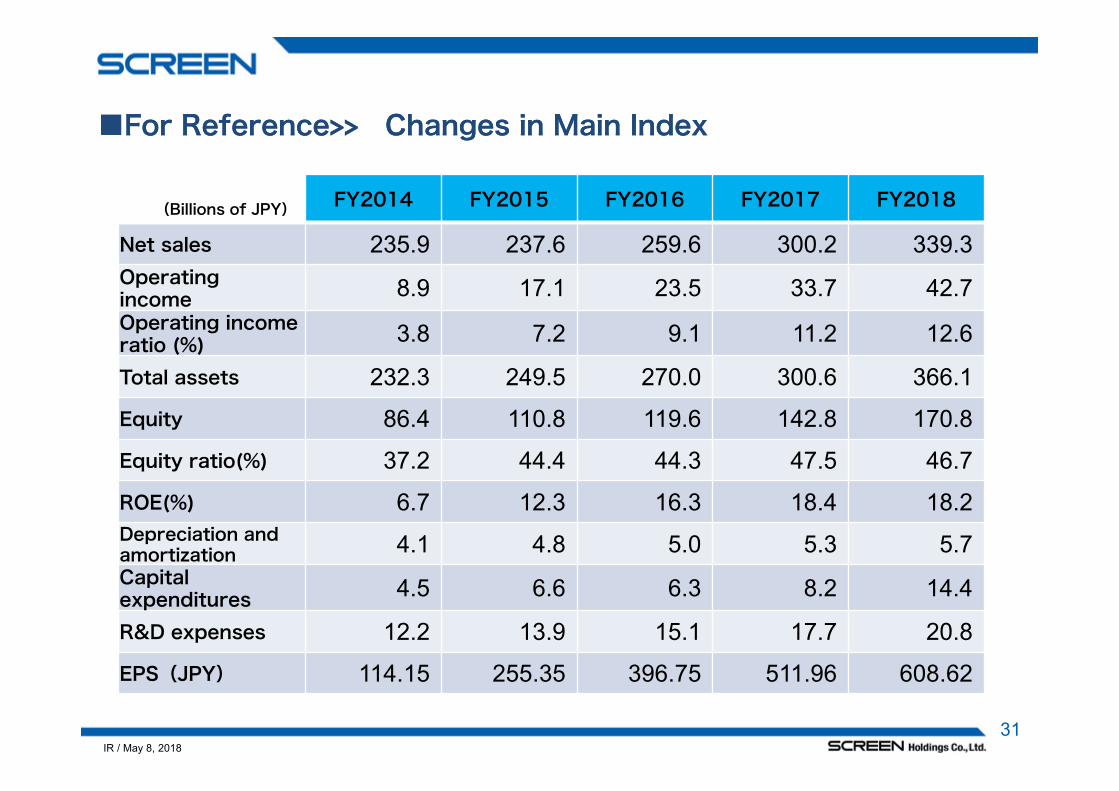
■For Reference>> Changes in Main Index■For Reference>> Changes in Main Index
(Billions of JPY) FY2014 FY2015 FY2016 FY2017 FY2018
Net sales 235.9 237.6 259.6 300.2 339.3Operatingincome 8.9 17.1 23.5 33.7 42.7Operating incomeratio (%) 3.8 7.2 9.1 11.2 12.6
Total assets 232.3 249.5 270.0 300.6 366.1
Equity 86.4 110.8 119.6 142.8 170.8
Equity ratio(%) 37.2 44.4 44.3 47.5 46.7
ROE(%) 6.7 12.3 16.3 18.4 18.2Depreciation and amortization 4.1 4.8 5.0 5.3 5.7Capital expenditures 4.5 6.6 6.3 8.2 14.4
R&D expenses 12.2 13.9 15.1 17.7 20.8
EPS(JPY) 114.15 255.35 396.75 511.96 608.62