Impact of mechanization of cassava and yam chip processing on

BUSINESS PLAN ON
VILLAGE LEVEL INTEGRATED
CASSAVA CHIP AND FLOUR PRODUCING
ENTERPRISE
PREPARED BY: E. O. BOATENG, NBSSI, UNDER THE
NRI/FRI/NBSSI/MOFA/FORIG/UNIVERSITY OF GHANA COLLABORATIVE PROJECT ON “NEW MARKETS FOR CASSAVA”

i.
TABLE OF CONTENTS PAGE
EXECUTIVE SUMMARY ii
1.0 INTRODUCTION 1
2.0 BUSINESS BACKGROUND 1
3.0 PROJECT FINANCE 2
4.0 MARKET ANALYSIS 2
5.0 WORKPLAN 3
6.0 MANAGEMENT 4
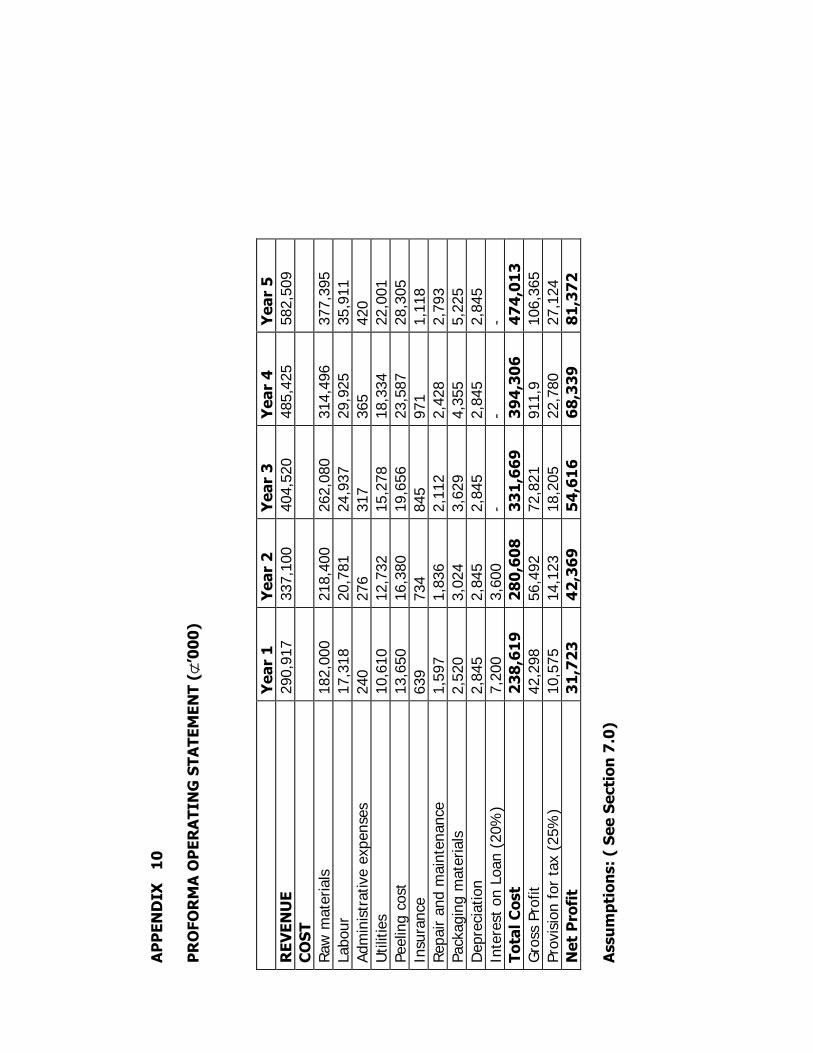
7.0 ASSUMPTIONS 4
8.0 FINANCIAL ANALYSIS 4
9.0 RECOMMENDATIONS 5
APPENDICES 6-15
i.
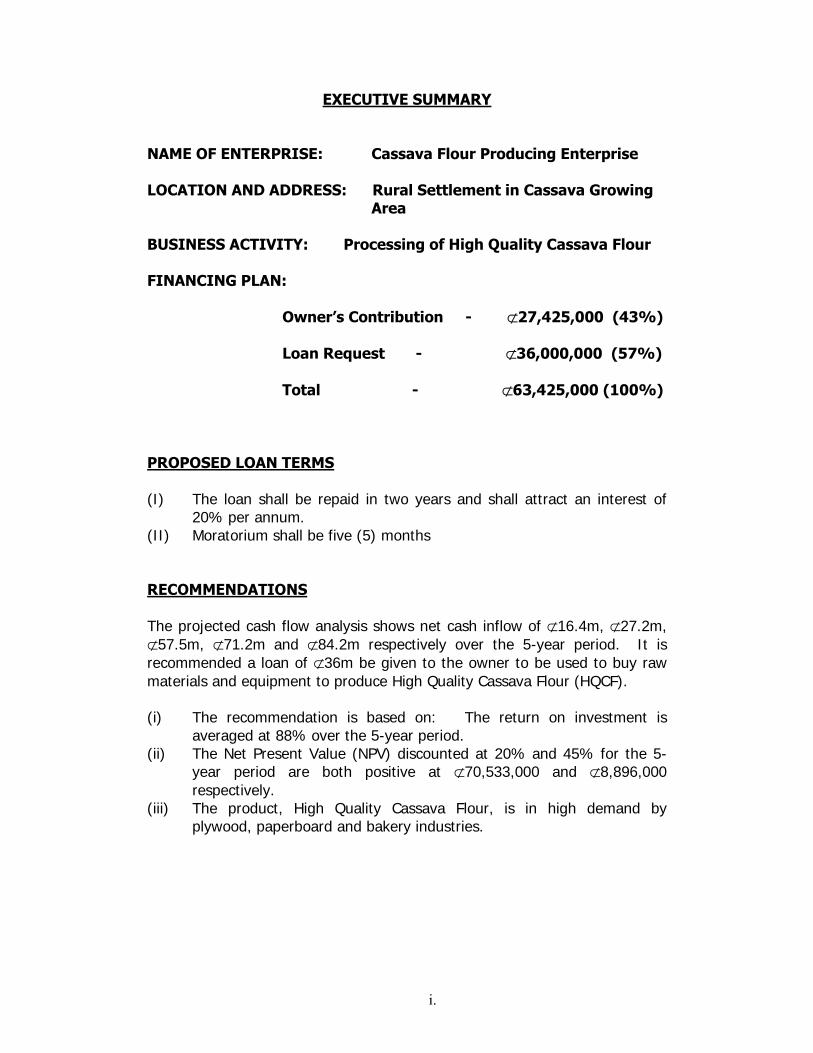
EXECUTIVE SUMMARY
NAME OF ENTERPRISE: Cassava Flour Producing Enterprise LOCATION AND ADDRESS: Rural Settlement in Cassava Growing Area BUSINESS ACTIVITY: Processing of High Quality Cassava Flour FINANCING PLAN:
Owner’s Contribution - ⊄27,425,000 (43%)
Loan Request - ⊄36,000,000 (57%)
Total - ⊄63,425,000 (100%) PROPOSED LOAN TERMS (I) The loan shall be repaid in two years and shall attract an interest of
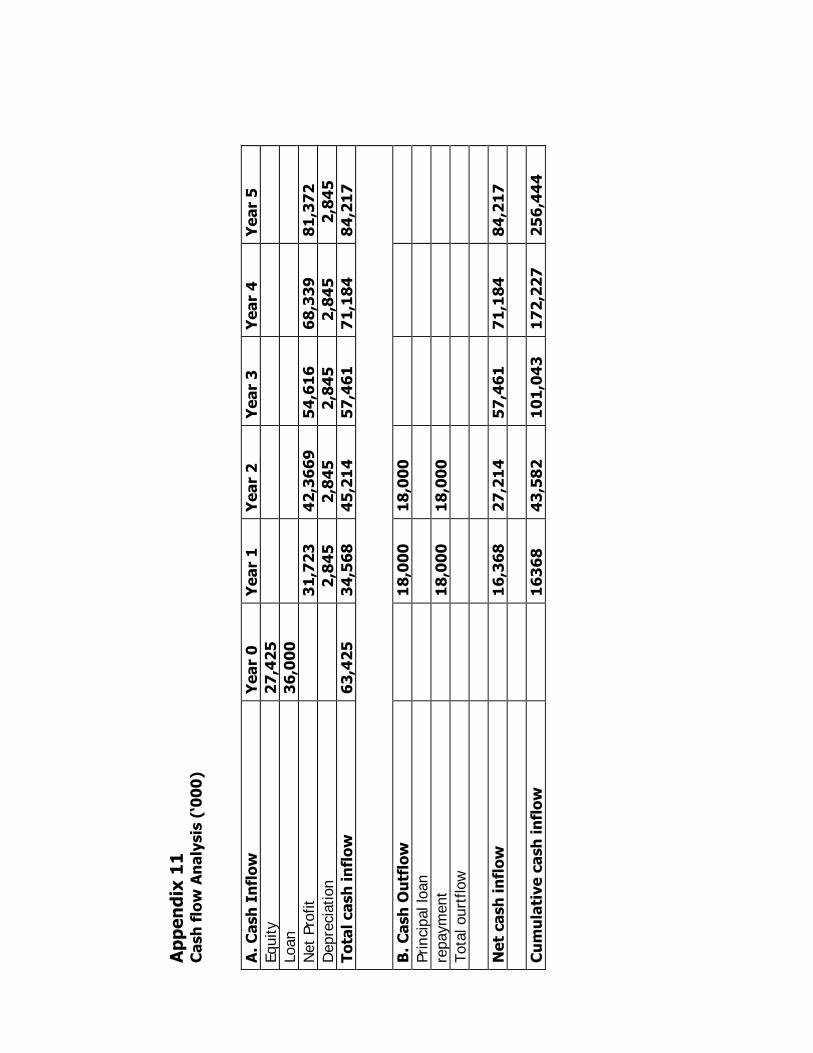
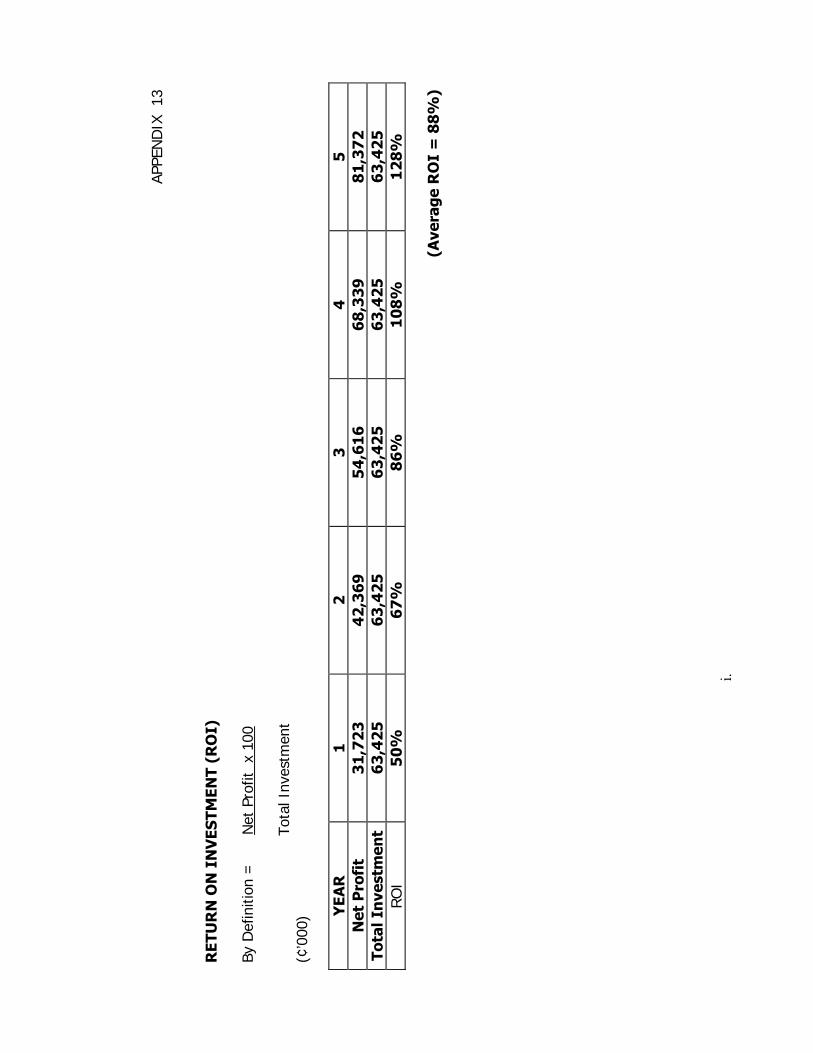
20% per annum. (II) Moratorium shall be five (5) months RECOMMENDATIONS The projected cash flow analysis shows net cash inflow of ⊄16.4m, ⊄27.2m, ⊄57.5m, ⊄71.2m and ⊄84.2m respectively over the 5-year period. It is recommended a loan of ⊄36m be given to the owner to be used to buy raw materials and equipment to produce High Quality Cassava Flour (HQCF). (i) The recommendation is based on: The return on investment is
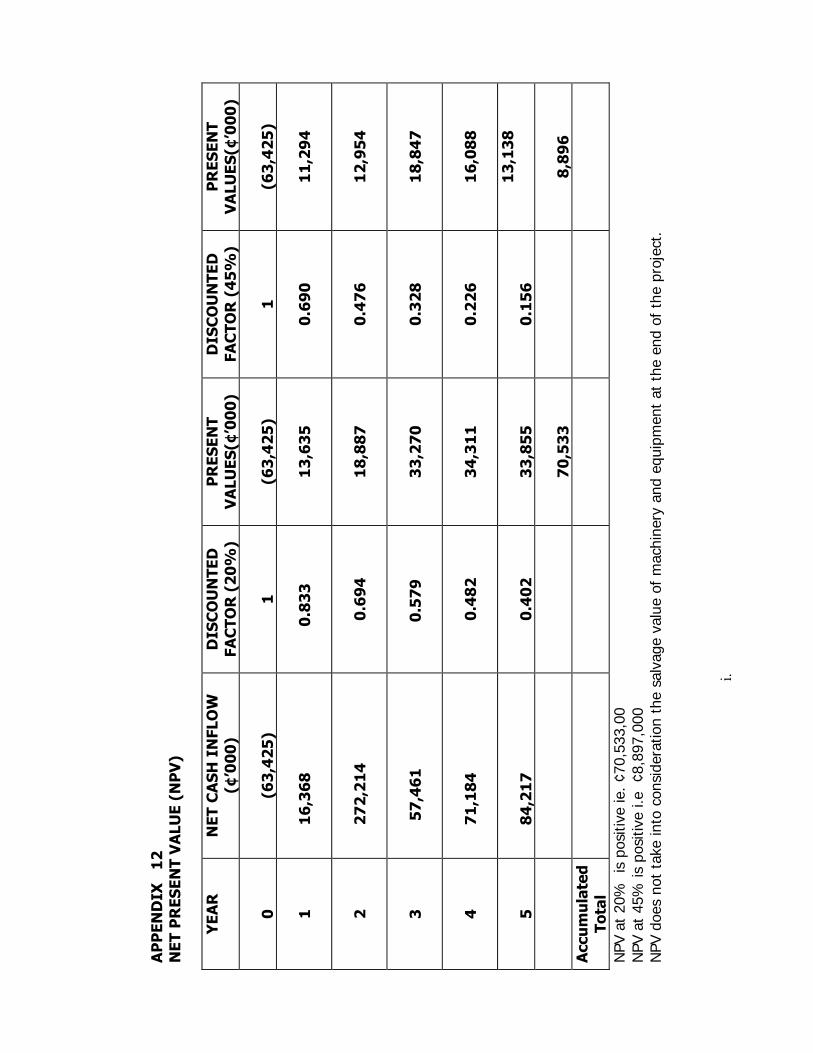
averaged at 88% over the 5-year period. (ii) The Net Present Value (NPV) discounted at 20% and 45% for the 5-
year period are both positive at ⊄70,533,000 and ⊄8,896,000 respectively.
(iii) The product, High Quality Cassava Flour, is in high demand by plywood, paperboard and bakery industries.
i.
BUSINESS PLAN 1. INTRODUCTIION Cassava is the most important root crop in Ghana. Apart from being a staple food in both rural and urban households cassava is also a major source of income to cassava farmers and processors in the rural areas. Cassava alone contributes about 22% of agricultural GDP in Ghana for food or domestic purposes but its industrial processing and utilisation has been very limited. There is the great potential of High Quality Cassava Flour replacing imported food item like wheat flour, which is used in bakery products and as extenders in glue for plywood and paperboard manufacturing in Ghana. Past and on-going research carried out by Food Research Institute (FRI) of Ghana and the Forest Research Institute of Ghana (FORIG) has proved that it is feasible to produce High Quality Cassava flour as a substitute for the above industrial purposes. This business plan is to examine the financial viability or otherwise in the production of High Quality Cassava Flour (HQCF) in the rural area. 2.0 BUSINESS BACKGROUND
2.1 Type of Business The enterprise is a sole proprietorship engaged in the production of High Quality Cassava Flour for industrial use in the bakery, plywood and paperboard industries. 2.2 Location of Business The business is located in a village in a cassava growing area. 2.3 Access to utilities and other facilities The enterprise has access to clean water and reliable electricity. There is a good road network connecting the location to marketing centres. 2.4 Aims/Objectives of the Business The main aim of the enterprise is to make High Quality Cassava Flour available to bakers and industries engaged in plywood and paperboard manufacturing. The production of HQCF will offer rural cassava farmers ready market for their produce, help reduce post-harvest losses, and also reduce the importation of wheat flour for use in industry. The enterprise also intends to create jobs for people in the rural areas.
i.
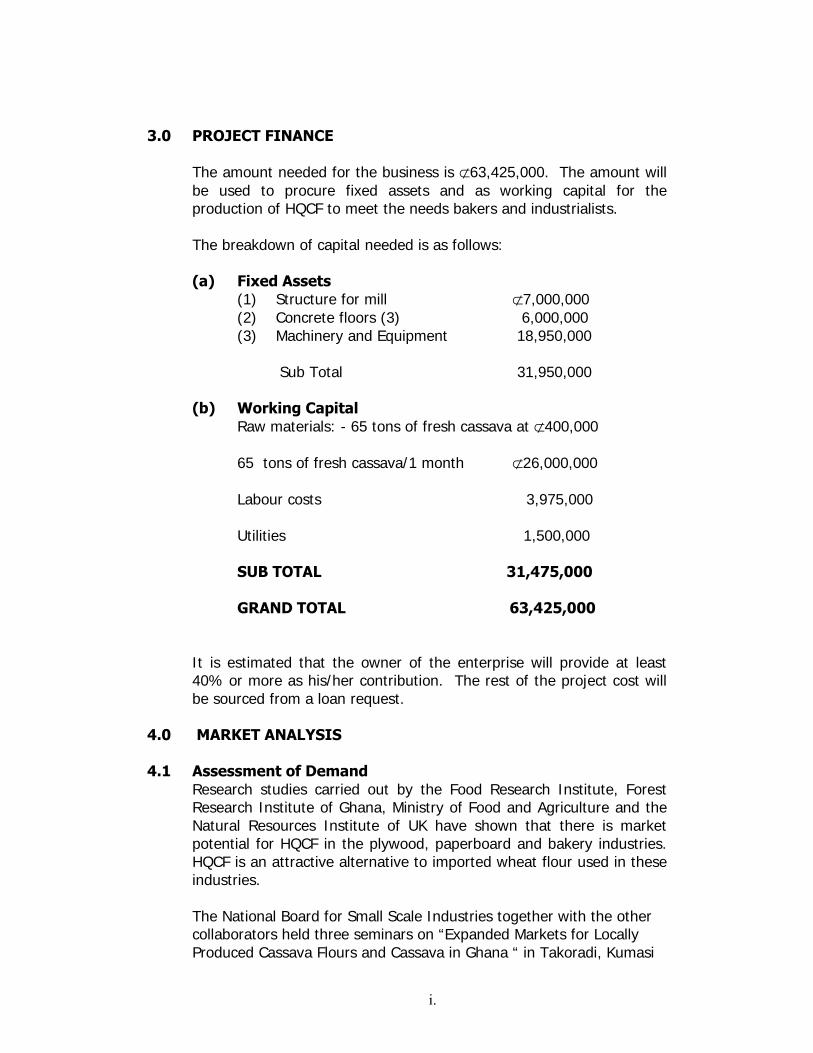
3.0 PROJECT FINANCE
The amount needed for the business is ⊄63,425,000. The amount will be used to procure fixed assets and as working capital for the production of HQCF to meet the needs bakers and industrialists. The breakdown of capital needed is as follows: (a) Fixed Assets
(1) Structure for mill ⊄7,000,000 (2) Concrete floors (3) 6,000,000 (3) Machinery and Equipment 18,950,000 Sub Total 31,950,000
(b) Working Capital Raw materials: - 65 tons of fresh cassava at ⊄400,000 65 tons of fresh cassava/1 month ⊄26,000,000 Labour costs 3,975,000 Utilities 1,500,000 SUB TOTAL 31,475,000 GRAND TOTAL 63,425,000
It is estimated that the owner of the enterprise will provide at least 40% or more as his/her contribution. The rest of the project cost will be sourced from a loan request.
4.0 MARKET ANALYSIS 4.1 Assessment of Demand
Research studies carried out by the Food Research Institute, Forest Research Institute of Ghana, Ministry of Food and Agriculture and the Natural Resources Institute of UK have shown that there is market potential for HQCF in the plywood, paperboard and bakery industries. HQCF is an attractive alternative to imported wheat flour used in these industries. The National Board for Small Scale Industries together with the other collaborators held three seminars on “Expanded Markets for Locally Produced Cassava Flours and Cassava in Ghana “ in Takoradi, Kumasi
i.
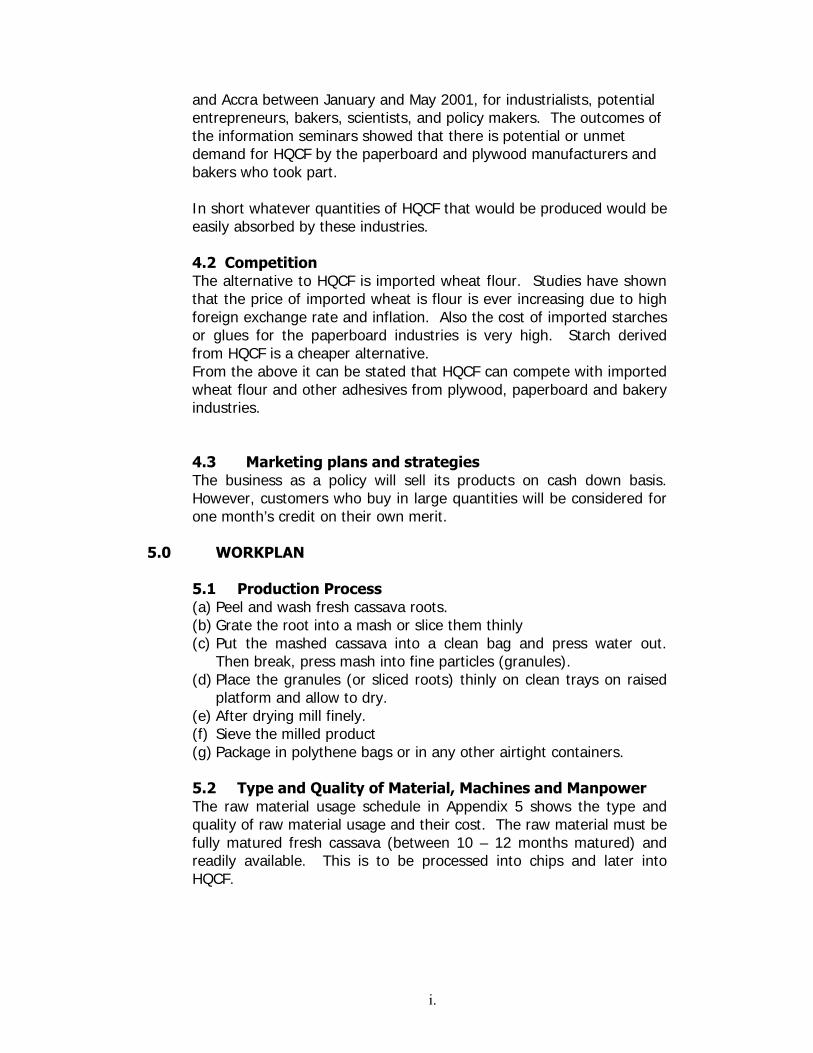
and Accra between January and May 2001, for industrialists, potential entrepreneurs, bakers, scientists, and policy makers. The outcomes of the information seminars showed that there is potential or unmet demand for HQCF by the paperboard and plywood manufacturers and bakers who took part. In short whatever quantities of HQCF that would be produced would be easily absorbed by these industries. 4.2 Competition The alternative to HQCF is imported wheat flour. Studies have shown that the price of imported wheat is flour is ever increasing due to high foreign exchange rate and inflation. Also the cost of imported starches or glues for the paperboard industries is very high. Starch derived from HQCF is a cheaper alternative. From the above it can be stated that HQCF can compete with imported wheat flour and other adhesives from plywood, paperboard and bakery industries. 4.3 Marketing plans and strategies The business as a policy will sell its products on cash down basis. However, customers who buy in large quantities will be considered for one month’s credit on their own merit.
5.0 WORKPLAN
5.1 Production Process (a) Peel and wash fresh cassava roots. (b) Grate the root into a mash or slice them thinly (c) Put the mashed cassava into a clean bag and press water out.
Then break, press mash into fine particles (granules). (d) Place the granules (or sliced roots) thinly on clean trays on raised
platform and allow to dry. (e) After drying mill finely. (f) Sieve the milled product (g) Package in polythene bags or in any other airtight containers. 5.2 Type and Quality of Material, Machines and Manpower The raw material usage schedule in Appendix 5 shows the type and quality of raw material usage and their cost. The raw material must be fully matured fresh cassava (between 10 – 12 months matured) and readily available. This is to be processed into chips and later into HQCF.
i.
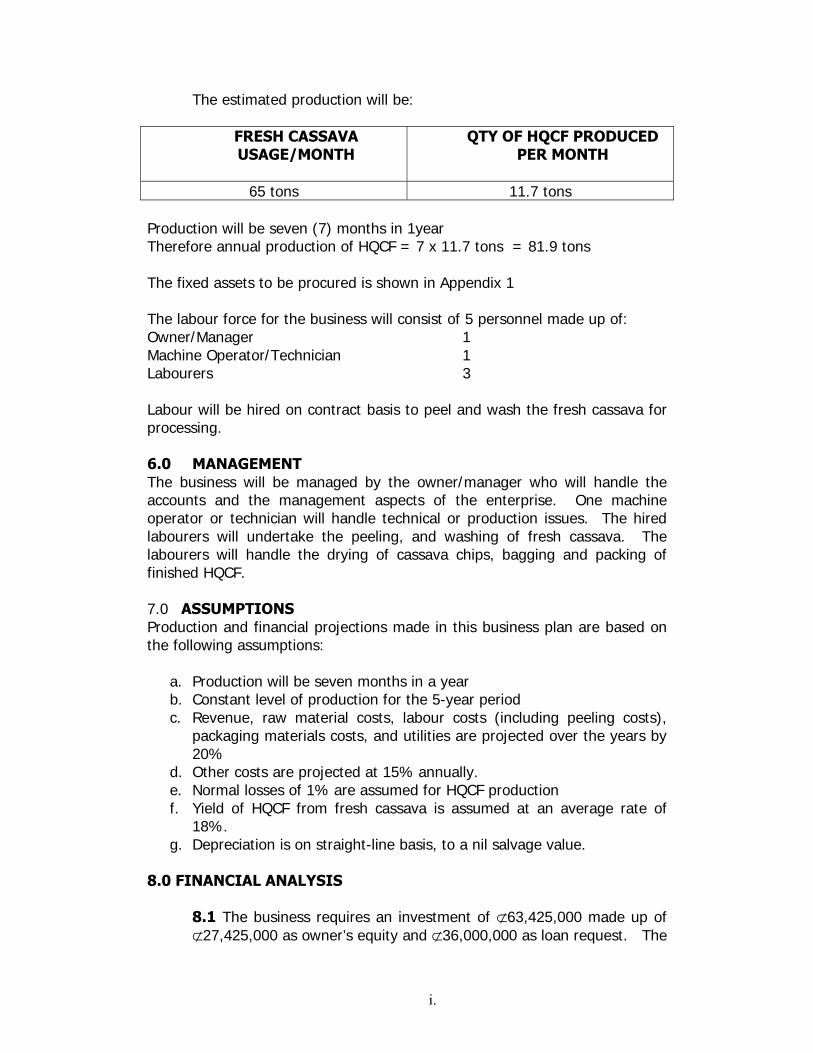
The estimated production will be:
FRESH CASSAVA USAGE/MONTH
QTY OF HQCF PRODUCED PER MONTH
65 tons 11.7 tons
Production will be seven (7) months in 1year Therefore annual production of HQCF = 7 x 11.7 tons = 81.9 tons The fixed assets to be procured is shown in Appendix 1 The labour force for the business will consist of 5 personnel made up of: Owner/Manager 1 Machine Operator/Technician 1 Labourers 3 Labour will be hired on contract basis to peel and wash the fresh cassava for processing. 6.0 MANAGEMENT The business will be managed by the owner/manager who will handle the accounts and the management aspects of the enterprise. One machine operator or technician will handle technical or production issues. The hired labourers will undertake the peeling, and washing of fresh cassava. The labourers will handle the drying of cassava chips, bagging and packing of finished HQCF. 7.0 ASSUMPTIONS Production and financial projections made in this business plan are based on the following assumptions:
a. Production will be seven months in a year b. Constant level of production for the 5-year period c. Revenue, raw material costs, labour costs (including peeling costs),
packaging materials costs, and utilities are projected over the years by 20%
d. Other costs are projected at 15% annually. e. Normal losses of 1% are assumed for HQCF production f. Yield of HQCF from fresh cassava is assumed at an average rate of
18%. g. Depreciation is on straight-line basis, to a nil salvage value.
8.0 FINANCIAL ANALYSIS
8.1 The business requires an investment of ⊄63,425,000 made up of ⊄27,425,000 as owner’s equity and ⊄36,000,000 as loan request. The

i.
loan will be used to procure a month’s raw materials supply, utilities, labour costs and part of equipment (see appendices 2 & 3).
8.2 Profit and Loss
Projections show net profit of ⊄31.7 million, ⊄42.4 million, ⊄54.6 million, ⊄68.3 million and ⊄81.4 million for the respective 5 years period (Refer to appendix 10).
8.3 Cash Flow Analysis
For the 5-year period positive net cash inflows of ⊄16.4 million, ⊄27.2 million, ⊄57.5 million, ⊄71.2 million, and ⊄84.2 million have been projected see Appendix 11)
9.0 RECOMMENDATIONS The report on the village level integrated cassava chip and flour producing enterprise shows that the business is viable. The business will significantly reduce post harvest losses of cassava at the village level. It will also increase income for cassava farmers in the rural areas. The production of HQCF will give local substitutes for imported wheat flour, which is used by industrialists in the plywood, paperboard and bakery industries:
It is therefore recommended that: (i) A loan of ⊄36,000,000 be granted to an applicant or an
entrepreneur for the purposes stated in this report. (ii) The interest charged on the loan shall be 20% per annum (iii) The loan shall be repaid in two (2) year with five months moratorium. (iv) The fixed assets purchased together with personal guarantors or
landed property may be used as collateral to secure the loan.
i.
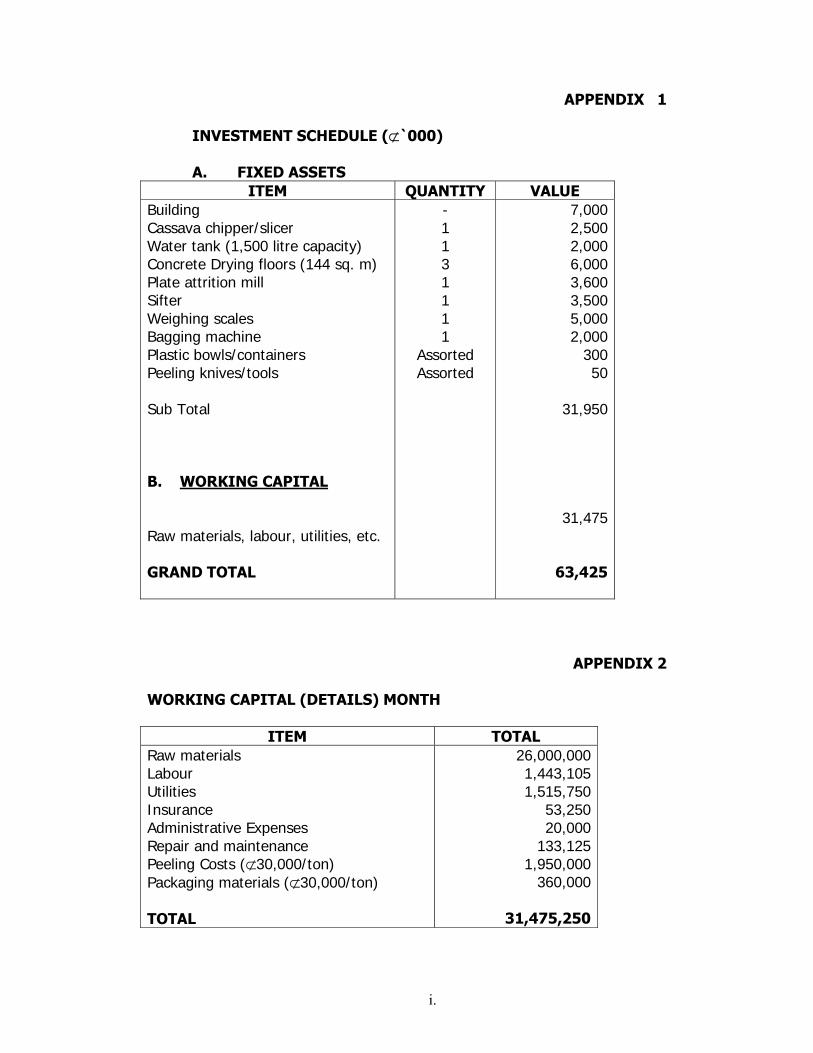
APPENDIX 1 INVESTMENT SCHEDULE (⊄`000) A. FIXED ASSETS
ITEM QUANTITY VALUE Building Cassava chipper/slicer Water tank (1,500 litre capacity) Concrete Drying floors (144 sq. m) Plate attrition mill Sifter Weighing scales Bagging machine Plastic bowls/containers Peeling knives/tools Sub Total B. WORKING CAPITAL Raw materials, labour, utilities, etc. GRAND TOTAL
- 1 1 3 1 1 1 1
Assorted Assorted
7,000 2,500 2,000 6,000 3,600 3,500 5,000 2,000
300 50
31,950
31,475
63,425
APPENDIX 2
WORKING CAPITAL (DETAILS) MONTH
ITEM TOTAL Raw materials Labour Utilities Insurance Administrative Expenses Repair and maintenance Peeling Costs (⊄30,000/ton) Packaging materials (⊄30,000/ton) TOTAL
26,000,000 1,443,105 1,515,750
53,250 20,000
133,125 1,950,000
360,000
31,475,250
i.
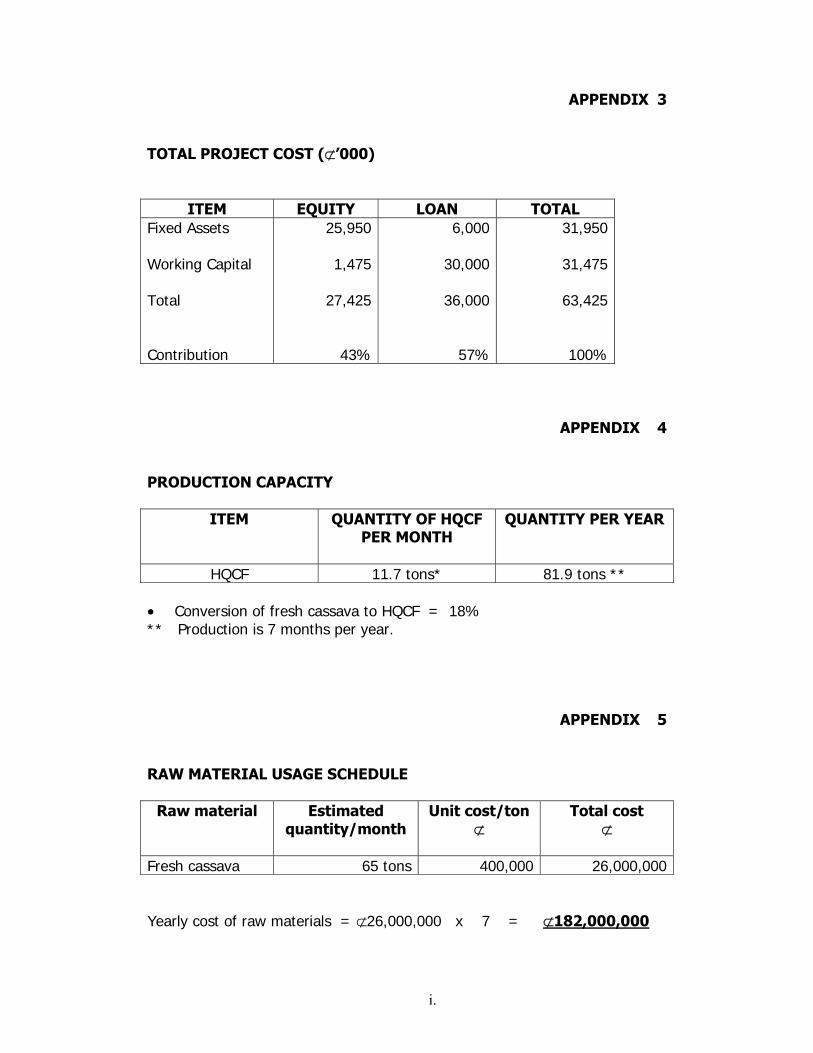
APPENDIX 3 TOTAL PROJECT COST (⊄’000)
ITEM EQUITY LOAN TOTAL Fixed Assets Working Capital Total Contribution
25,950
1,475
27,425
43%
6,000
30,000
36,000
57%
31,950
31,475
63,425
100%
APPENDIX 4 PRODUCTION CAPACITY
ITEM QUANTITY OF HQCF PER MONTH
QUANTITY PER YEAR
HQCF 11.7 tons* 81.9 tons ** • Conversion of fresh cassava to HQCF = 18% ** Production is 7 months per year.
APPENDIX 5 RAW MATERIAL USAGE SCHEDULE
Raw material Estimated quantity/month
Unit cost/ton ⊄
Total cost ⊄
Fresh cassava 65 tons 400,000 26,000,000 Yearly cost of raw materials = ⊄26,000,000 x 7 = ⊄182,000,000

i.
APPENDIX 6 ESTIMATED REVENUE
ITEM UNIT PRICE/TON
⊄
QUANTITY/ MONTH
MONTHLY REVENUE
⊄ High Quality Cassava Flour (HQCF)
3,500,000 11.7 tons 40,950,000
Sub Total Less 2% Sales Expenses Less 1%Flour losses Net monthly revenue
40,950,000
409,500409,500
40,131,000 Net Yearly Revenue = ⊄ 40,131,000 x 7 = ⊄280,917,000
APPENDIX 7
LABOUR COST
PERSONNEL NO. SALARY PER MONTH
⊄
TOTAL PER MONTH
⊄
TOTAL PER YEAR ⊄
500,000167,000162,500
500,000 167,000 487,500
1,154,500
288,625
1,443,125
6,000,000167,000
5,850,000
13,854,000
3,463,500
17,317,500
i.
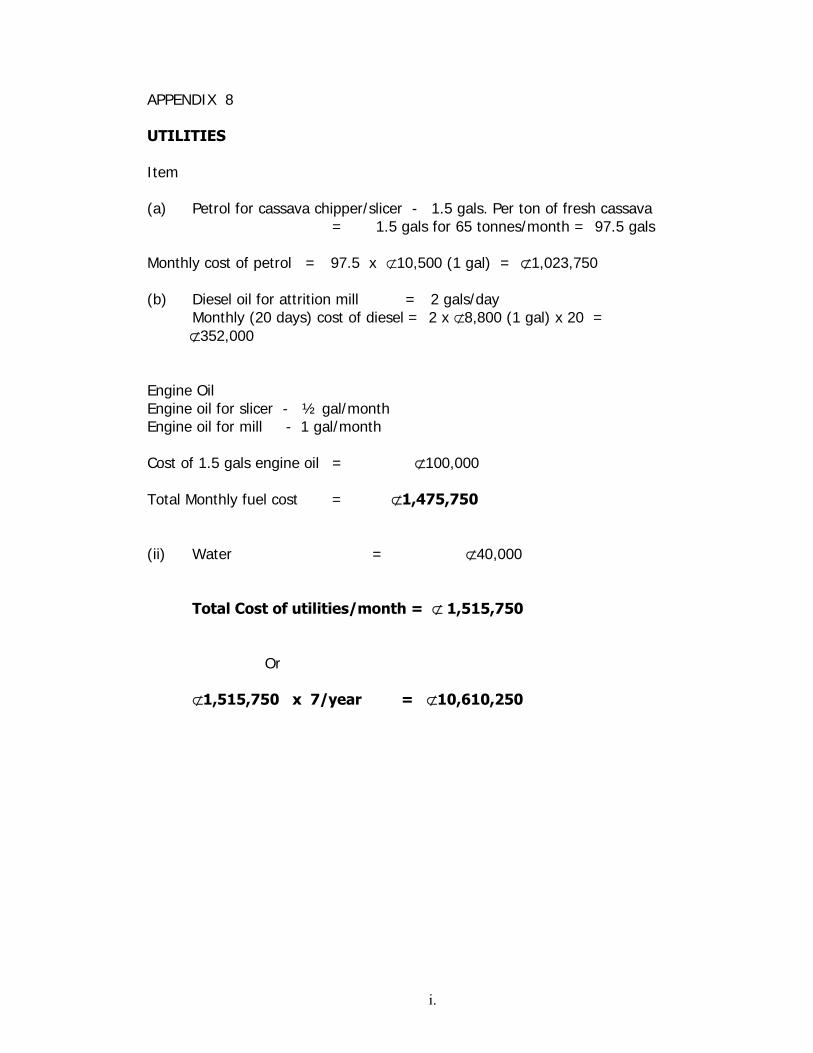
APPENDIX 8 UTILITIES Item (a) Petrol for cassava chipper/slicer - 1.5 gals. Per ton of fresh cassava = 1.5 gals for 65 tonnes/month = 97.5 gals Monthly cost of petrol = 97.5 x ⊄10,500 (1 gal) = ⊄1,023,750 (b) Diesel oil for attrition mill = 2 gals/day Monthly (20 days) cost of diesel = 2 x ⊄8,800 (1 gal) x 20 = ⊄352,000 Engine Oil Engine oil for slicer - ½ gal/month Engine oil for mill - 1 gal/month Cost of 1.5 gals engine oil = ⊄100,000 Total Monthly fuel cost = ⊄1,475,750 (ii) Water = ⊄40,000 Total Cost of utilities/month = ⊄ 1,515,750 Or ⊄1,515,750 x 7/year = ⊄10,610,250
i.
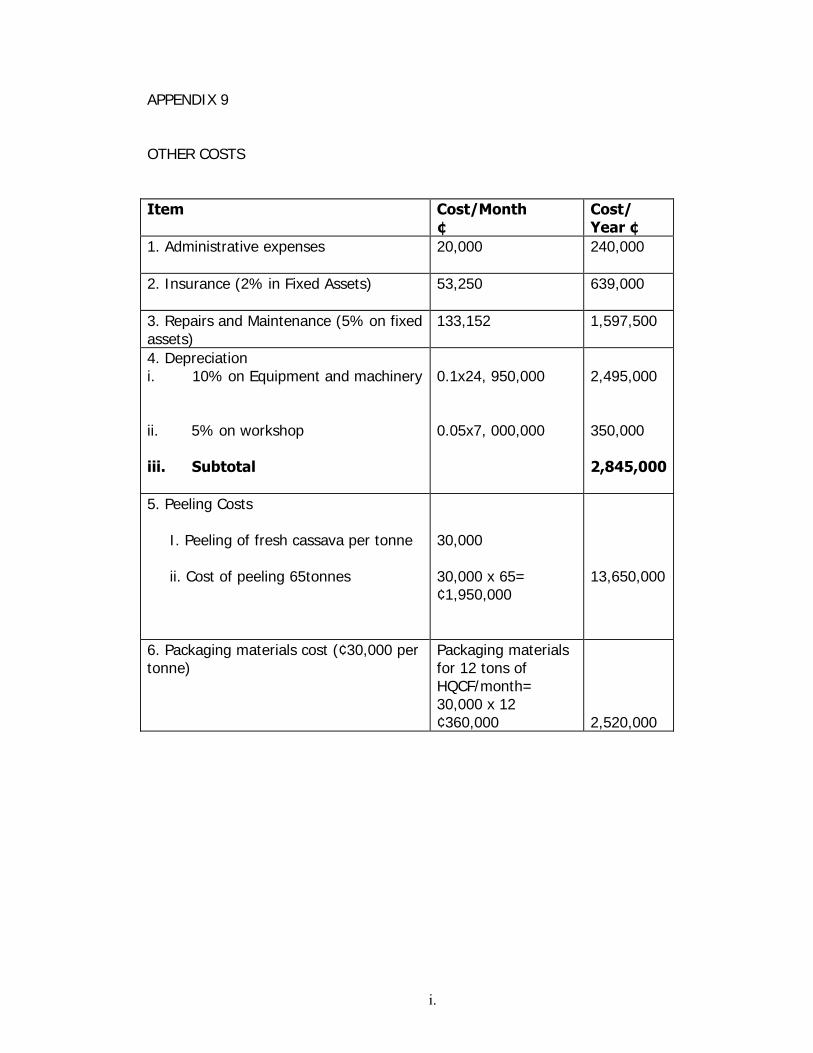
APPENDIX 9 OTHER COSTS Item Cost/Month
¢ Cost/ Year ¢
1. Administrative expenses
20,000 240,000
2. Insurance (2% in Fixed Assets)
53,250 639,000
3. Repairs and Maintenance (5% on fixed assets)
133,152 1,597,500
4. Depreciation i. 10% on Equipment and machinery ii. 5% on workshop iii. Subtotal
0.1x24, 950,000 0.05x7, 000,000
2,495,000 350,000 2,845,000
5. Peeling Costs
I. Peeling of fresh cassava per tonne ii. Cost of peeling 65tonnes
30,000 30,000 x 65= ¢1,950,000
13,650,000
6. Packaging materials cost (¢30,000 per tonne)
Packaging materials for 12 tons of HQCF/month= 30,000 x 12 ¢360,000
2,520,000

AP
PEN
DIX
1
0
PR
OFO
RM
A O
PER
ATI
NG
STA
TEM
ENT
(⊄’0
00
)
Yea
r 1
Y
ear
2
Yea
r 3
Y
ear
4
Yea
r 5
R
EVEN
UE
290,
917
337,
100
404,
520
485,
425
582,
509
CO
ST
Ra
w m
ater
ials
18
2,00
0 21
8,40
0 26
2,08
0 31
4,49
6 37
7,39
5 La
bour
17
,318
20
,781
24
,937
29
,925
35
,911
Ad
min
istr
ativ
e ex
pens
es
240
276
317
365
420
Util
ities
10
,610
12
,732
15
,278
18
,334
22
,001
Pe
elin
g co
st
13,6
50
16,3
80
19,6
56
23,5
87
28,3
05
Insu
ranc
e 63
9 73
4 84
5 97
1 1,
118
Repa
ir an
d m
aint
enan
ce
1,59
7 1,
836
2,11
2 2,
428
2,79
3 Pa
ckag
ing
mat
eria
ls
2,52
0 3,
024
3,62
9 4,
355
5,22
5 D
epre
ciat
ion
2,84
5 2,
845
2,84
5 2,
845
2,84
5 In
tere
st o
n Lo
an (
20%
) 7,
200
3,60
0 -
- -
Tota
l Cos
t 2
38,6
19
2
80
,60
8
33
1,6
69
3
94,3
06
4
74
,01
3
Gro
ss P
rofit
42
,298
56
,492
72
,821
91
1,9
106,
365
Prov
isio
n fo
r ta
x (2
5%)
10,5
75
14,1
23
18,2
05
22,7
80
27,1
24
Net
Pro
fit
31,
723
4
2,3
69
5
4,6
16
6
8,3
39
81
,37
2
Ass
um
ptio
ns:
( S
ee S
ecti
on 7
.0)

App
endi
x 1
1
Cas
h f
low
An
alys
is (
‘00
0)
A. C
ash
In
flow
Y
ear
0
Yea
r 1
Y
ear
2
Yea
r 3
Y
ear
4
Yea
r 5
Eq
uity
2
7,4
25
Lo
an
36,
000
Net
Pro
fit
3
1,7
23
42
,36
69
5
4,6
16
68,
339
8
1,3
72
D
epre
ciat
ion
2
,84
5
2,8
45
2,8
45
2
,84
5
2
,84
5
Tota
l cas
h in
flow
6
3,4
25
34,
568
4
5,2
14
5
7,4
61
71,
184
8
4,2
17
B
. Cas
h O
utf
low
18,
000
1
8,0
00
Prin
cipa
l loa
n
re
paym
ent
1
8,0
00
18
,00
0
To
tal o
urtf
low
Net
cas
h in
flow
16,
368
2
7,2
14
5
7,4
61
71,
184
8
4,2
17
Cu
mu
lati
ve c
ash
infl
ow
1
636
8
43
,58
2
101
,04
3
172
,22
7
25
6,4
44
i.
AP
PEN
DIX
1
2
NET
PR
ESEN
T V
ALU
E (N
PV
)
YEA
R
NET
CA
SH I
NFL
OW
(¢
’000
) D
ISC
OU
NTE
D
FAC
TOR
(2
0%)
PR
ESEN
T V
ALU
ES(¢
’00
0)
DIS
CO
UN
TED
FA
CTO
R (
45%
) P
RES
ENT
VA
LUES
(¢’0
00)
0
(6
3,4
25)
1
(6
3,4
25)
1
(6
3,4
25)
1
1
6,3
68
0.8
33
1
3,6
35
0
.69
0
1
1,29
4
2
2
72
,21
4
0
.694
18
,887
0.4
76
12,
954
3
5
7,4
61
0.5
79
3
3,2
70
0
.32
8
1
8,84
7
4
7
1,1
84
0
.482
34
,311
0.2
26
16,
088
5
8
4,2
17
0.4
02
3
3,8
55
0
.15
6
13,
138
70
,533
8
,896
A
ccu
mu
late
d To
tal
NPV
at
20%
is
pos
itive
ie. ¢
70,5
33,0
0
N
PV a
t 45
% is
pos
itive
i.e
¢8,
897,
000
N
PV d
oes
not
take
into
con
side
ratio
n th
e sa
lvag
e va
lue
of m
achi
nery
and
equ
ipm
ent
at t
he e
nd o
f th
e pr
ojec
t.
i.
APPE
ND
IX
13
RET
UR
N O
N I
NV
ESTM
ENT
(RO
I)
By D
efin
ition
=
Net
Pro
fit
x 10
0
Tot
al I
nves
tmen
t (¢
’000
)
YEA
R
1
2
3
4
5
Net
Pro
fit
31,
723
4
2,3
69
54,
616
6
8,3
39
81,
372
To
tal I
nve
stm
ent
63,
425
6
3,4
25
63,
425
6
3,4
25
63,
425
RO
I 5
0%
67
%
86
%
108%
1
28%
(Ave
rage
RO
I =
88%
)
i.
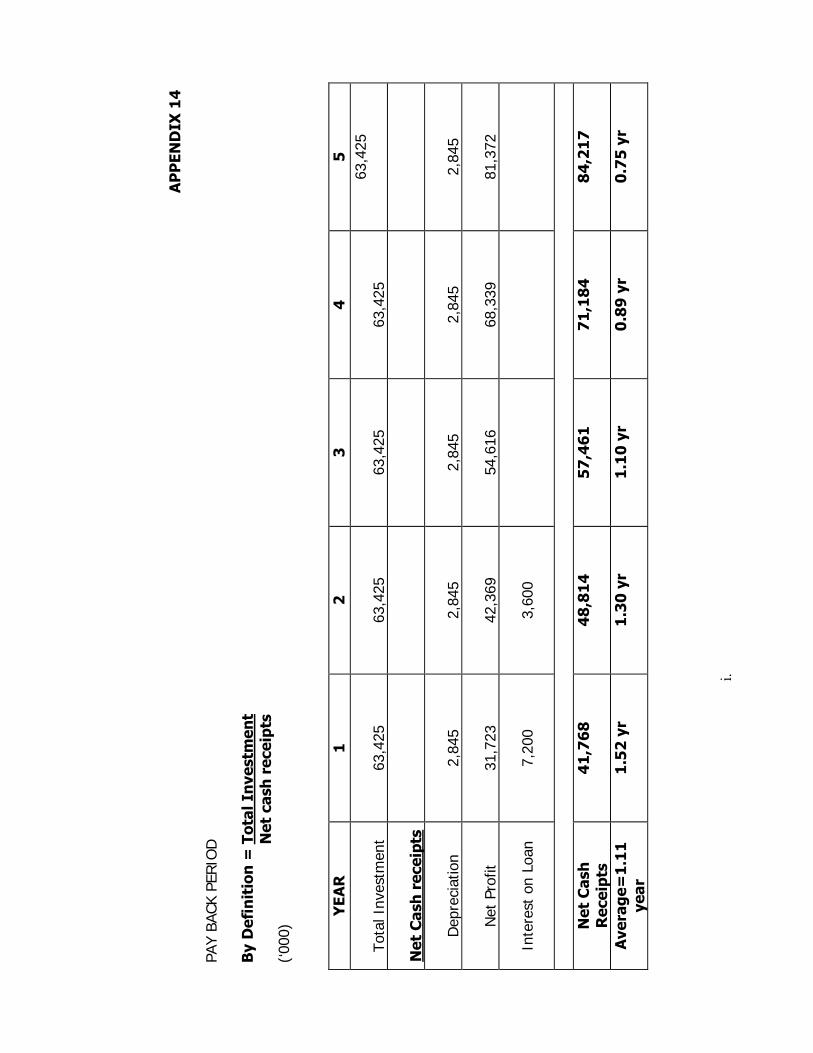
A
PP
END
IX 1
4
PAY
BACK
PER
IOD
B
y D
efin
itio
n =
Tot
al I
nve
stm
ent
N
et c
ash
rec
eipt
s (‘0
00)
Y
EAR
1
2
3
4
5
Tota
l Inv
estm
ent
63
,425
63,4
25
63
,425
63,4
25
63,4
25
N
et C
ash
rec
eipt
s
D
epre
ciat
ion
2,
845
2,
845
2,
845
2,
845
2,
845
N
et P
rofit
31,7
23
42
,369
54,6
16
68
,339
81,3
72
In
tere
st o
n Lo
an
7,
200
3,
600
N
et C
ash
R
ecei
pts
41,
768
4
8,8
14
57,
461
7
1,1
84
84,
217
Ave
rage
=1
.11
ye
ar
1.5
2 y
r 1
.30
yr
1.1
0 y
r 0
.89
yr
0.7
5 y
r
i.
Say
13
mon
ths