BUSINESS PLAN ON VILLAGE LEVEL CASSAVA CHIP PRODUCING ... · village level cassava chip producing...
19
BUSINESS PLAN ON VILLAGE LEVEL CASSAVA CHIP PRODUCING ENTERPRISE PREPARED BY: E. O. BOATENG, NBSSI, under the NRI/FRI/NBSSI/MOFA/FORIG/UNIVERSITY OF GHANA COLLABORATIVE PROJECT ON “NEW MARKETS FOR CASSAVA”
Transcript of BUSINESS PLAN ON VILLAGE LEVEL CASSAVA CHIP PRODUCING ... · village level cassava chip producing...

BUSINESS PLAN ON VILLAGE LEVEL CASSAVA CHIP
PRODUCING ENTERPRISE
PREPARED BY: E. O. BOATENG, NBSSI, under the NRI/FRI/NBSSI/MOFA/FORIG/UNIVERSITY OF
GHANA COLLABORATIVE PROJECT ON “NEW MARKETS FOR CASSAVA”

TABLE OF CONTENT
PAGE
EXECUTIVE SUMMARY ii 1.0 INTRODUCTION 1
2.0 BUSINESS BACKGROUND 1
3.0 FINANCING PLAN 2
4.0 MARKET ANALYSIS 2
5.0 WORK PLAN 3
6.0 MANAGEMENT 3
7.0 RESOURCES ANALYSIS 4
8.0 ASSUMPTIONS 4
9.0 FINANCIAL ANALYSIS 4
10.0 RECOMMENDATIONS 5
APPENDICES 6-16
i.

EXECUTIVE SUMMARY
NAME OF ENTERPRISE: Cassava Chips Producing Enterprise LOCATION OF BUSINESS: Rural Settlement In Cassava Growing Area FINANCING PLAN: Owners Contribution: ¢24,247,000 (38%) Loan Request: ¢40,000,000 (62%) PROPOSED LOAN TERMS:
(i) The loan shall be repaid in 3 years and shall attract an interest of 20% per annum.
(ii) Moratorium shall be 5 months. RECOMMENDATIONS: The projected cash flow analysis shows a net inflow of ¢9.7m, 17..9m, ¢26.1m, ¢51.3m and ¢62.1m over the 5-year period. It is recommended that a loan of ¢40 million be given to the promoter for the business by a government institution or financial institution for the purpose stated in this report. The recommendation is based on:
(i) The Return on Investment is averaged at 61% over the 5-year period. (ii) The Net Present Value is discounted at 20% and 45% for the 5-year
period are positive, ¢41,581,000 and negative - ¢4,105,000 respectively. (iii) The product of the business high quality cassava chips is in demand
from secondary processors by High Quality Cassava Flour (HQCF) based in the urban centres.
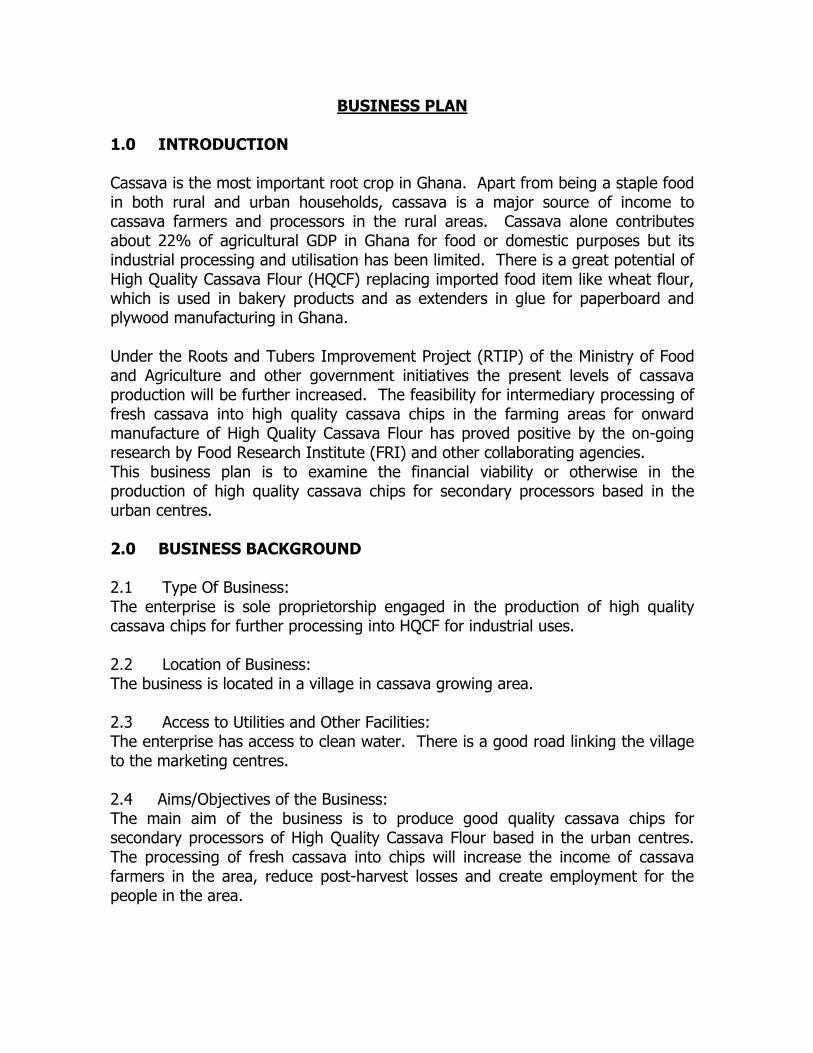
BUSINESS PLAN 1.0 INTRODUCTION Cassava is the most important root crop in Ghana. Apart from being a staple food in both rural and urban households, cassava is a major source of income to cassava farmers and processors in the rural areas. Cassava alone contributes about 22% of agricultural GDP in Ghana for food or domestic purposes but its industrial processing and utilisation has been limited. There is a great potential of High Quality Cassava Flour (HQCF) replacing imported food item like wheat flour, which is used in bakery products and as extenders in glue for paperboard and plywood manufacturing in Ghana. Under the Roots and Tubers Improvement Project (RTIP) of the Ministry of Food and Agriculture and other government initiatives the present levels of cassava production will be further increased. The feasibility for intermediary processing of fresh cassava into high quality cassava chips in the farming areas for onward manufacture of High Quality Cassava Flour has proved positive by the on-going research by Food Research Institute (FRI) and other collaborating agencies. This business plan is to examine the financial viability or otherwise in the production of high quality cassava chips for secondary processors based in the urban centres. 2.0 BUSINESS BACKGROUND 2.1 Type Of Business: The enterprise is sole proprietorship engaged in the production of high quality cassava chips for further processing into HQCF for industrial uses. 2.2 Location of Business: The business is located in a village in cassava growing area. 2.3 Access to Utilities and Other Facilities: The enterprise has access to clean water. There is a good road linking the village to the marketing centres. 2.4 Aims/Objectives of the Business: The main aim of the business is to produce good quality cassava chips for secondary processors of High Quality Cassava Flour based in the urban centres. The processing of fresh cassava into chips will increase the income of cassava farmers in the area, reduce post-harvest losses and create employment for the people in the area.

3.0 FINANCING PLAN The Total capital outlay for the business is ¢64,247,000. The amount will be used to procure fixed assets for working capital for the processing of high quality cassava chips. The breakdown of the finance needed for the business is as follows:
(a) FIXED ASSETS
1. Structure/building ¢7,000,000 2. Concrete Floors (4) 8,000,000 3 Machinery and equipment 13,600,00 4. Sub Total 28,600,000
(b) WORKING CAPITAL Raw materials: 80 tons of fresh cassava at ¢350,000/ton
1. 80 tons of fresh cassava for 1 month
¢28,000,000
2. Labour costs 4,087,5003. Utilities 1,352,5004. Transport and other costs 2,207,000 Sub-total 35,647,000 GRAND TOTAL 64,247,000
4.0 MARKET ANALYSIS 4.1 Assessment of Demand Research studies carried out by the Food Research Institute (FRI), forest Research Institute of Ghana (FORIG), Ministry of Food and Agriculture and the Natural Resources Institute of UK have shown that there is an untapped or an unserviced market for High Quality Cassava Flour in plywood, paperboard and bakery industries. During the awareness seminars held in Takoradi, Kumasi and Accra on “Expanded Markets for Locally Produced Cassava Flour and starches in Ghana” between January and May, 2001, some secondary processors based in the urban areas expressed interest in processing HQCF on large scale provided there is the availability of high quality cassava chips at economic prices. It could be said that

both users and processors of HQCF have unmet needs which could be satisfied by this business venture. 4.2 Competition The alternative of HQCF is imported wheat flour. Studies have shown that the price of imported flour is ever increasing due to high foreign exchange rate and inflation. Also the cost of imported starches of glues for the paper boar d industries is very high and starch derived from HQCF is a cheaper alternative. From the above it can be stated that HQCF is a cheaper alternative.
From the above it can be stated that HQCF can compete with imported wheat flour and other adhesives from plywood, paper board and bakery industries.
4.3 Marketing Plans and Strategies The business will produce high quality cassava chips and sell to secondary processors on cash down basis.
5.0 WORKPLAN 5.1 Production Capacity The business will operate 5 days in a week. The proposed monthly production will be 14.4 tons of chips from 80 tons of fresh cassava. The yearly production will be seven months in a year. The proposed yearly production will be approximately 101 tons of the high quality cassava chips.
5.2 Production Process (a) Peel and wash cassava roots (b) Slice them thinly (c) Place the sliced roots thinly on clean trays raised on platform and allow to
dry well. (d) After drying package the chips in polythene bags or other airtight
containers.
6.0 MANAGEMENT
The business will be managed by the owner/manager who will keep records and direct operations. The owner will be assisted technically by a machine operator and four labourers.

7.0 RESOURCES ANALYSIS 7.1 Raw Materials - Type and Quality The main raw material used is fresh cassava. The fresh cassava must be fully matured (between 10-12 months). This is processed under clean and hygienic conditions into high quality cassava chips.
7.2 Machinery and Equipment The required machinery and equipment are listed in Appendix 7
7.3 Utilities Clean water will be readily available.
7.4 Manpower The workforce for the business will be six (6). It will be made up of the owner/manager and 5 skilled workers.
8.0 ASSUMPTIONS: Production and financial projections made in this business plan are based on the following assumptions: - Production will be 7 months in a year. - Constant level of production for the 5-year period - There will be constant yearly increases in production of fresh cassava in terms
of acreages under cultivation and yield per acre as a result of government initiatives.
- Revenue, raw material costs, labour costs (including peeling costs) packaging material costs and utilities are project over the years by 20%.
- Other costs are projected at 15% annually. - Normal losses of 1% are assumed for high quality cassava chips - Yield from chips from fresh cassava is assumed at an average rate of 18%. - Depreciation is on straight-line basis to a nil salvage value. - The cost of basic raw material, fresh cassava, is ¢350,000 per ton.
9.0 FINANCING ANALYSIS 9.1 Total Investment The business plan requires an investment of ¢64,247,000 made up of the owners equity of ¢24,247,000 and a loan of ¢40,000,000. The loan will be used to procure fixed assets and raw materials (see appendices 1,2 and 3).

9.2 Profit and Loss Projection shows that net profit of ¢20.2 million, ¢28.4 million, ¢37.6 million, ¢48.7 million, and ¢59.6 million for the respective years over a 5-year period. These are based on the assumptions at section 8.0 above. Appendix 10 refers.
9.3 Cash Flow Analysis Over the 5-year period positive net cash inflow of ¢9.7 m, ¢17.9m, ¢26.2m, ¢51.3m and ¢62.1m have been projected. (See Appendix 11).
10.0 RECOMMENDATIONS This business plan on the operations of a high quality cassava chips producing enterprise in a rural area shows that such a business is viable financially and worth supporting. The cassava chips produced will be used as basic raw material for secondary High Quality Cassava Flour processors based in the urban areas. It is therefore recommended that: (a) A loan of ¢40 million be granted to the promoter by a government or financial
institution for the purpose stated in the report. (b) The loan shall be secured with personal guarantors and lien on fixed assets. (c) The interest on the loan shall be 20%. (d) The loan shall be repaid in three (3) years with five (5) months moratorium.
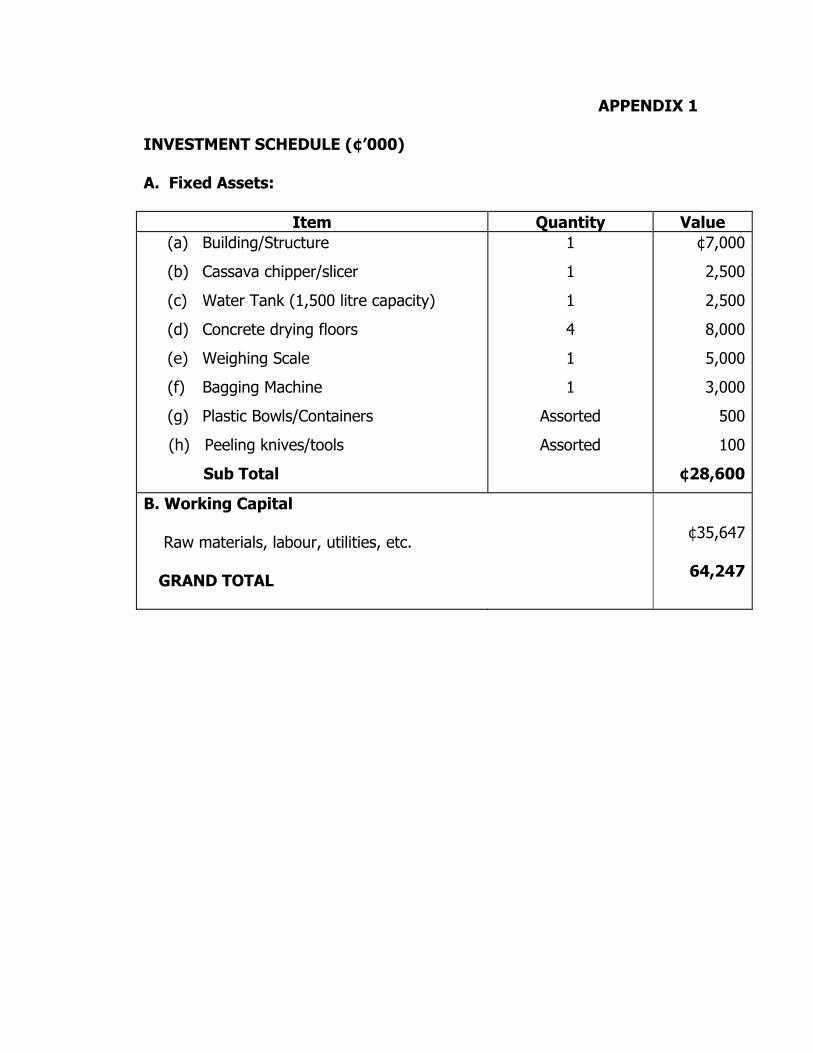
APPENDIX 1 INVESTMENT SCHEDULE (¢’000) A. Fixed Assets:
Item Quantity Value (a) Building/Structure
(b) Cassava chipper/slicer
(c) Water Tank (1,500 litre capacity)
(d) Concrete drying floors
(e) Weighing Scale
(f) Bagging Machine
(g) Plastic Bowls/Containers
(h) Peeling knives/tools
Sub Total
1
1
1
4
1
1
Assorted
Assorted
¢7,000
2,500
2,500
8,000
5,000
3,000
500
100
¢28,600
B. Working Capital Raw materials, labour, utilities, etc.
GRAND TOTAL
¢35,647
64,247

APPENDIX 2
Working Capital Per Month (Details)
Item Total Cost/Month (¢)
Raw Materials
Labour
Transport
Utilities
Insurance
Administrative Expenses
Repair and Maintenance
Peeling Costs
Packaging Costs
TOTAL
¢28,000,000
1,687,500
1,600,000
1,352,500
47,667
20,000
119,167
2,400,000
420,000
35,646,834

APPENDIX 3
Total Project Cost (¢’000)
ITEM EQUITY LOAN TOTAL Fixed Assets
Working Capital
Total
Contribution
23,600
647
24,247
38%
5,000
35,000
40,000
62%
28,600
35,647
64,247
100%
APPENDIX 4
Production Capacity
Item Quantity per Month
Quantity per Year
High quality cassava chips
14.4 tonnes
100.8 tonnes
Conversion of fresh cassava to chips = 18% Production is 7 months per year
APPENDIX 5
Raw Material Usage Schedule
Raw Material Estimated Quantity per
Month
Unit Cost/Ton
¢
Total Cost/Month
¢
Fresh Cassava 80 tons 350,000
28,000,000 Cost of Raw Material Per Year - ¢28,000,000 x 7 = ¢196,000,000
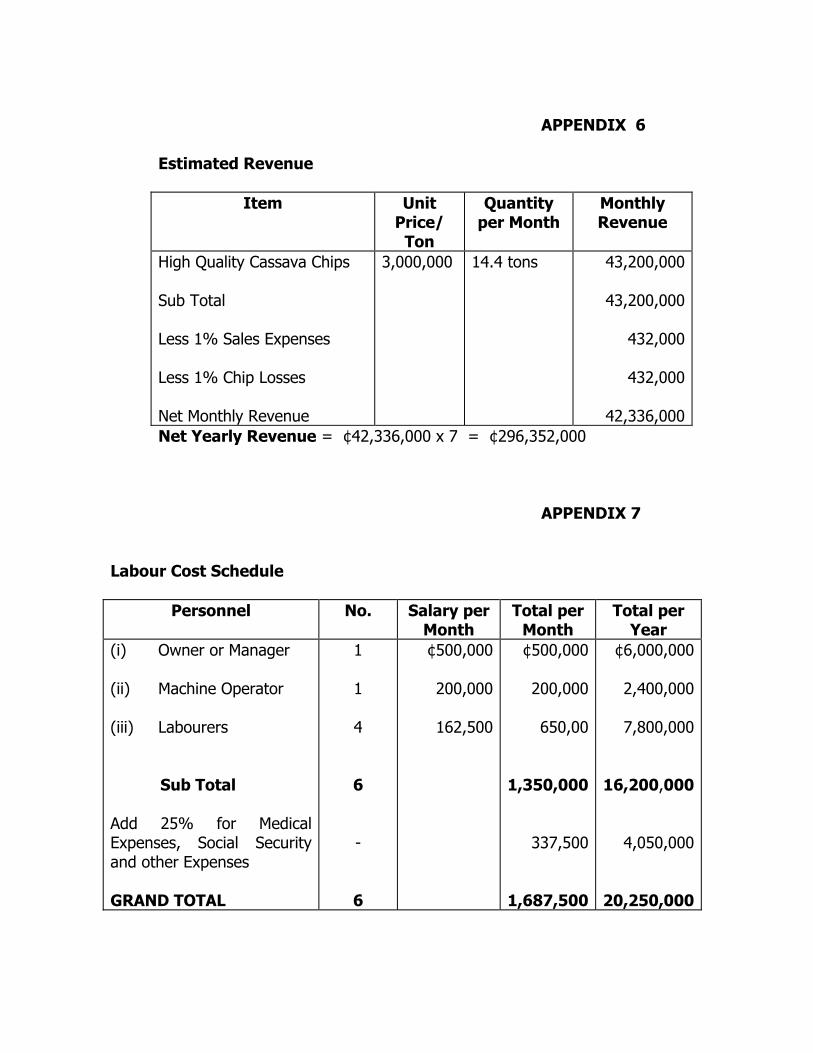
APPENDIX 6
Estimated Revenue
Item Unit
Price/ Ton
Quantity per Month
Monthly Revenue
High Quality Cassava Chips Sub Total Less 1% Sales Expenses Less 1% Chip Losses Net Monthly Revenue
3,000,000 14.4 tons 43,200,000
43,200,000
432,000
432,000
42,336,000 Net Yearly Revenue = ¢42,336,000 x 7 = ¢296,352,000
APPENDIX 7 Labour Cost Schedule
Personnel No. Salary per Month
Total per Month
Total per Year
(i) Owner or Manager
(ii) Machine Operator
(iii) Labourers
Sub Total Add 25% for Medical Expenses, Social Security and other Expenses GRAND TOTAL
1
1
4
6 -
6
¢500,000
200,000
162,500
¢500,000
200,000
650,00
1,350,000
337,500
1,687,500
¢6,000,000
2,400,000
7,800,000
16,200,000
4,050,000
20,250,000
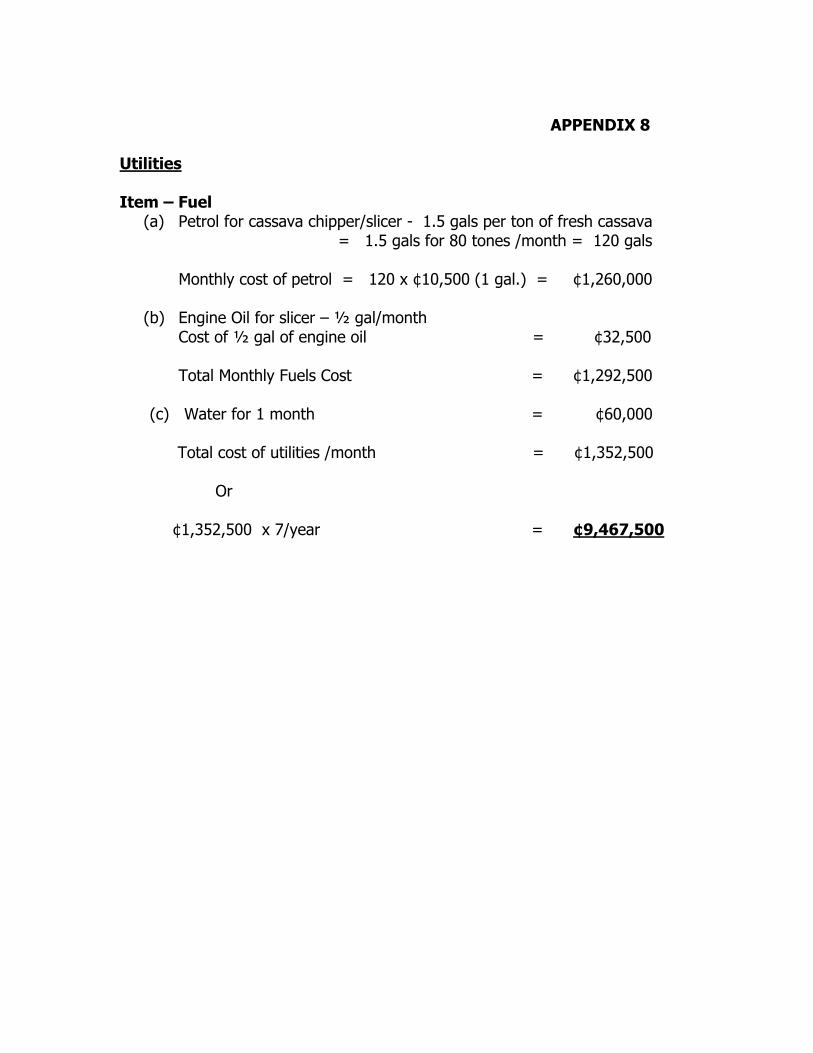
APPENDIX 8
Utilities Item – Fuel
(a) Petrol for cassava chipper/slicer - 1.5 gals per ton of fresh cassava = 1.5 gals for 80 tones /month = 120 gals Monthly cost of petrol = 120 x ¢10,500 (1 gal.) = ¢1,260,000 (b) Engine Oil for slicer – ½ gal/month
Cost of ½ gal of engine oil = ¢32,500 Total Monthly Fuels Cost = ¢1,292,500
(c) Water for 1 month = ¢60,000 Total cost of utilities /month = ¢1,352,500 Or ¢1,352,500 x 7/year = ¢9,467,500

APPENDIX 9 Other Costs
Item Cost/Month Total Cost/Year
1. Transportation of fresh cassava to site at ¢20,000/ton (80 tons/month) 2. Administrative cost 3. Insurance (2% 0n Fixed Assets) 4. Repairs and Maintenance (5% on
Fixed Assets) 5. Depreciation
(a) 10% on equipment and machinery
(b) 5% on Building structure
TOTAL
6. Peeling Costs
Peeling cost of fresh cassava per tonne = ¢30,000 Peeling costs of 80 tons/month
7. Packaging Materials Cost Packaging materials for 1 tonne of chips = ¢30,000 packaging materials for 14 tons/month
¢1,600,000 (80 tons)
¢20,000
¢2,400,000
¢420,000
¢11,200,000
240,000
0.02 x ¢28,600,000 =¢572,000
0.05 x ¢28,600,000 =¢1,430,000
0.1 X 21,600,000 = ¢2,160,000
0.05 X ¢7,000,00
= ¢350,000
= ¢2,510,000
¢16,800,000 yearly
¢2,940,000 yearly

APPENDIX 10 Proforma Operating Statement (¢’000) Item Year 1 Year 2 Year 3 Year 4 Year 5 Revenue
Costs
Raw materials
Labour
Transport
Utilities
Insurance
Administrative Expenses
Repair and Maintenance
Peeling costs
Packaging costs
Depreciation
Interest on loan
Total Costs
Gross Profit
Provision for Tax (25%)
Net Profit
296,352
196,000
20,250
11,200
9,468
572
240
1,430
16,800
2,940
2,510
8,000
269,410
26,942
6,736
20,206
355,622
235,200
24,300
12,880
11,362
658
276
1,645
20,160
3,528
2,510
5,200
317,719
37,903
9,476
28,427
426,747
282,240
29,160
14,812
13,634
756
317
1,891
24,192
4,234
2,510
2,800
376,546
50,201
12,550
37,651
512,096
338,688
34,992
17,034
16,361
870
365
2,175
29,030
5,080
2,510
-
47,105
64,991
16,248
48,743
614,516
406,426
41,990
19,589
19,633
1,000
420
2,501
34,836
6,096
2,510
-
53,500
79,515
19,879
59,636
Assumptions (See Section 8)

APPENDIX 11
Cash Flow Analysis (¢’000) A. CASH INFLOW YEAR
O YEAR
1 YEAR
2 YEAR
3 YEAR
4 YEAR
5 Equity
Loan
Net Profit
Depreciation
Total Cash Inflow B. CASH OUTFLOW Principal Loan payment Total Outflow Net Cash Inflow Cumulative Cash Inflow
24,247
40,000
-
-
64,247
-
20,206
-
2,510
22,716
13,000
13,000
9,716
9,716
-
28,427
-
2,510 30,937
13,000
13,000
17,937
27,653
-
37,651
-
2,510
40,161
14,000
14,000
26,161
53,814
-
48,743
-
2,510
51,253
-
-
51,253
105,067
-
59,636
-
2,510
62,146
-
-
62,146
167,213

APPENDIX 12 NET PRESENT VALUE (NPV) Year Net Cash
Inflow (’000)
Discounted factor 20%
Net Present Value (¢’000)
Discounted Factor (45%)
Net Present Value (¢’000)
0
1
2
3
4
5
Accumulated Total
(64,247)
20,206
28,427
37,651
48,743
59,636
1
0.833
0.694
0.579
0.482
0.402
(64,247)
16,832
19,728
21,800
23,494
23,974
41,581
1
0.690
0.476
0.328
0.226
0.156
(64,247)
13,942
13,531
12,350
11,016
9,303
(4,105)
NPV at 20% is positive i.e. ¢41,581,000 NPV at 45% is negative i.e. - ¢4,105,000 NPV does not take into consideration the salvage value of machinery and equipment at the end of the project.
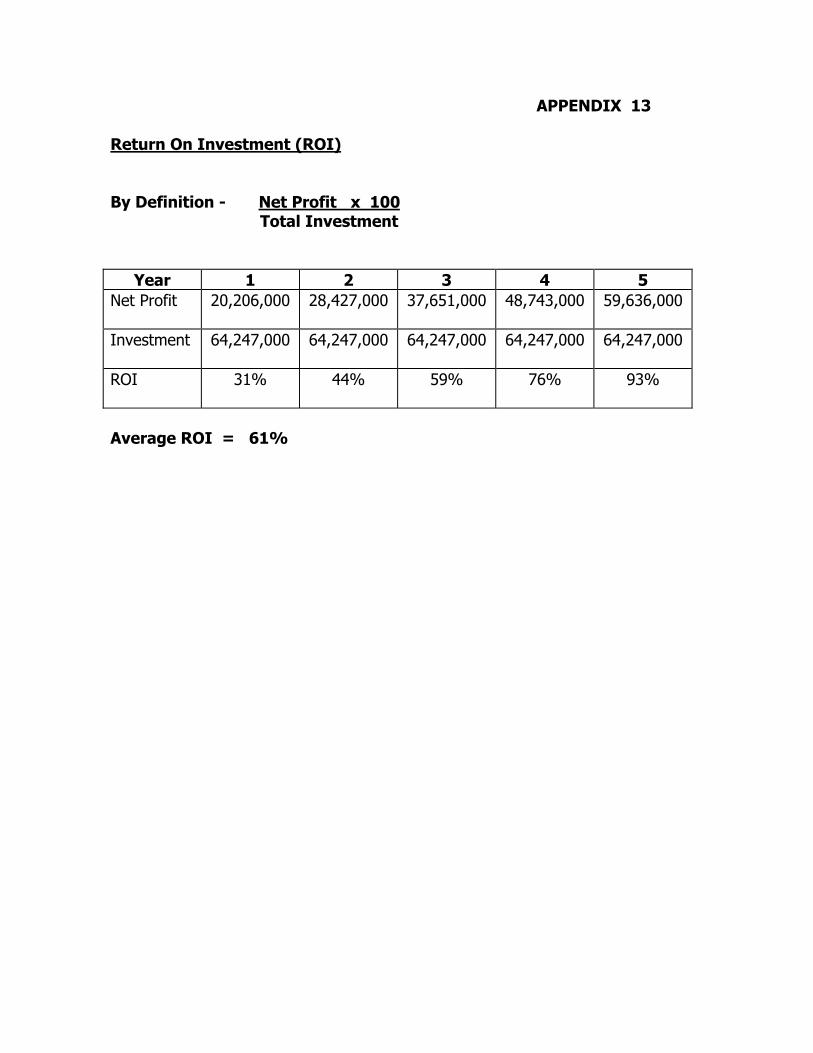
APPENDIX 13 Return On Investment (ROI) By Definition - Net Profit x 100 Total Investment
Year 1 2 3 4 5 Net Profit 20,206,000 28,427,000 37,651,000 48,743,000 59,636,000
Investment 64,247,000 64,247,000 64,247,000 64,247,000 64,247,000
ROI 31% 44% 59% 76% 93%
Average ROI = 61%
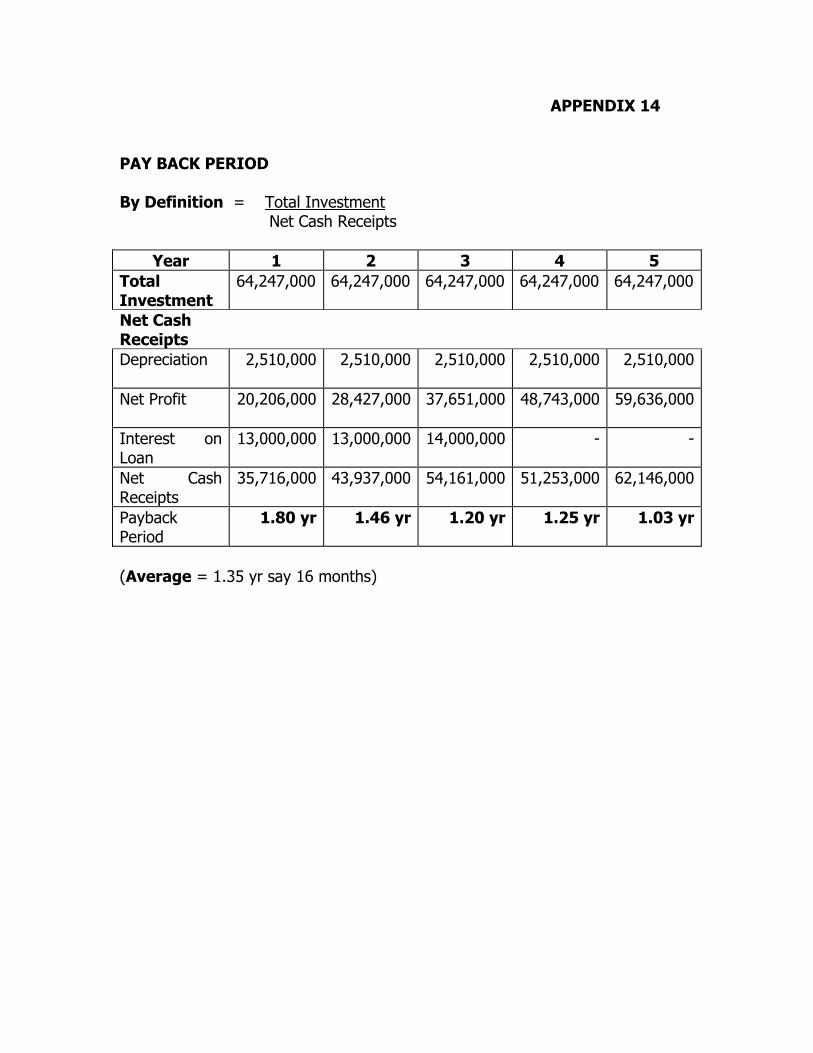
APPENDIX 14 PAY BACK PERIOD By Definition = Total Investment Net Cash Receipts
Year 1 2 3 4 5 Total Investment
64,247,000 64,247,000 64,247,000 64,247,000 64,247,000
Net Cash Receipts
Depreciation 2,510,000 2,510,000 2,510,000 2,510,000 2,510,000
Net Profit 20,206,000 28,427,000 37,651,000 48,743,000 59,636,000
Interest on Loan
13,000,000 13,000,000 14,000,000 - -
Net Cash Receipts
35,716,000 43,937,000 54,161,000 51,253,000 62,146,000
Payback Period
1.80 yr 1.46 yr 1.20 yr 1.25 yr 1.03 yr
(Average = 1.35 yr say 16 months)