
BUSINESS INTELLIGENCE SSAS - SQL Server Analysis...
38
BUSINESS INTELLIGENCE SSAS - SQL Server Analysis Services Business Informatics Degree
Transcript of BUSINESS INTELLIGENCE SSAS - SQL Server Analysis...
BUSINESS INTELLIGENCE
SSAS - SQL Server Analysis Services
Business Informatics Degree

BI Architecture2

SSAS: SQL Server Analysis Services
It is both an OLAP Server and a Data Mining Server
Distinct from the RDBMS engine
Can access ODBC, OLE DB, CSV, XML data sources
Most OLAP concepts are covered Dimensions, hierarchies, measures, attributes, calculated metrics, key
performance indexes, actions (URL links, drill-through, report launch), …
Query language (MDX) for querying data cubes
Docs and samples Documentation
http://msdn.microsoft.com/en-us/library/bb522607.aspx
Tutorial from Books on Line
http://msdn.microsoft.com/en-us/library/ms170208.aspx
3
Business Intelligence Lab

SSAS architetture4
Business Intelligence Lab
XMLA – XML for Analysis

SSAS projects
Developing environment is SSDT
Project type: Analysis services multidimensional and data mining
IMPORTANT!
Name of SSAS projects must be prefixed by your account
<account>_<name>
5
Business Intelligence Lab

SSAS Server for deployment
Right click on project name
Properties Deployment
6
Business Intelligence Lab

SSAS project folders
Data source
Sets the data sources
Use your login and password to SQL Server
Use OLE DB for SQL Server if client/server are different versions(eg., you are using a version < SQL 2016)
Impersonification credentials
Specify ‘Use the service account’
Data source view (DSV)
A view of data sources
Disconnected access to data sources
Names of attributes/tables can be changed (without affecting the source!)
Calculated attributes and tables (without affecting the source!)
External keys (without affecting the source!)
7

SSAS project folders
Dimensions
Type: standard / time
Time is useful to derive hierarchies directly from a ‘datetime’ attribute
Create new wizard
Select existing table
Key column: primary key (surrogate key)
Name column: descriptive key
Attributes
Select none at the wizard stage
Organize attributes into hierarchies
in the dimension structure pane
8
Business Intelligence Lab

Useful attribute properties
AttributeHierarchyVisible
Flat hiearchies with only the attribute is visibile
This is by default
OrderBy
Default ordering method in visualization
DiscretizationMethod
Discretization of continuous attributes into bins
Type
Leave ‘regular’
Usage
Modes: key, regular and parent
9

Build-deploy-processing
Build
Syntactic check of correctness of the SSAS project
Run by the SSDT client enviroment
Deploy
The project is copied on the deployment SSAS server
Data cubes are not re-processed
Nevertheless, features that do not depend on data re-processing are updated, eg., formatting of numbers, calculated metrics
Processing
The deployment server re-computes the data cubes by accessing the data sources
10
Business Intelligence Lab

Build-deploy-processing
Issue with current SQL server installation:
A delay of about 30 seconds is experienced at each
deploy and at each process operations
Hope it will be solved with a future service pack.
Be patient!
Business Intelligence
11

Data exploration
Panel: browsing
Pivot table + filters
Since SQL Server 2012
Data exploration in Excel
12
Business Intelligence Lab

Calculated members
Calculated metrics: Net sales
Margin
Sum year to date
Average sale amount per customer
Average sale amount per sale
Rank of products wrt sales
…
Calculated members:
Top 5 selling products
…
They do not exist on the data cube They are calculated at run-time
13
MultiDimensional eXpressionsLanguage for querying OLAP cubes
and for defining calculated members
Standard de-facto

Drill-through actions
(rightclick -> ‘show details’ in Excel)14
Business Intelligence Lab

Data cube storage model
ROLAP (Relational OLAP)
relational engine enhanced with CUBE BY and analytic SQL materialized views + bitmap/columnstore indexes + star-join optimization
performance
scalability
MOLAP (Multidimensional OLAP)
multidimensional array store on disk/memory in binary format
very efficient for a small number of hierarchies
do not scale well on space data
HOLAP (Hybrid OLAP)
trade-off between the previous two solutions
most accessed cuboids on MOLAP, others on ROLAP
15
data cube
DATA
WAREHOUSE
OLAP
SERVER

The ROLAP case16

Storage model
Can be set for whole cube or for single dimensions
17

Proactive caching
Proactive caching
Latence time for refresh
Silence time (after refresh)
18

Other features of SSAS
KPI – Key performance index
Metrics with target values shown
Perspectives
Subsets of objects, e.g., sub-cubes for product manager, store manager ..
Roles
Access rights management
...
Self-service Business Intelligence
PowerPivot for Excel/SharePoint
Tabular data model (evolution of PowerPivot)
Different instance of SSAS, different SSDT project type, different query language (DAX – Data Analysis eXpressions)
19

BUSINESS INTELLIGENCE LABORATORY
SSAS Practice
Business Informatics Degree

Data analysts: final user
Explore a report produced from a multidimensional
view, using:
a reporting tool
Browser, Excel, Microstrategy, …
only data exploration primitives:
Drill down and roll-up over pre-defined hierarchies
Existing calculated measures
Slide and dice
Filter and sort
Business Intelligence Lab
21

Q0 on foodmart
What is the distribution of sales
by quarter?
and by customer city?
in absolute value
in percentage wrt the total
in percentage wrt the country of residence of customers
Business Intelligence Lab
22

Q1 on foodmart
What are the 5 best product categories
as per total sales?
as per number of items sold?
as per number of distinct customers?
in each quarter of 1998 and gender?
in the CA state?
Business Intelligence Lab
23

Q1 on foodmart
What are the 5 best product categories
as per total sales?
as per number of items sold?
as per number of distinct customers?
in each quarter of 1998 and gender?
in the CA state?
Business Intelligence Lab
24

Data analysts: OLAP designer
Design data cubes and reports
by defining
existing hierarchies from the DW
existing metrics from the DW
calculated members
and reprocessing data cubes
using a tool for OLAP design
with read-only rights on the DW
Business Intelligence Lab
25

Q2 on foodmart
Which stores are the most profitable
mean profit wrt customers
= (total sales – total cost ) / number of customers
mean profit wrt baskets
= (total sales – total cost ) / number of baskets
evaluated
in each quarter of 1998 and gender?
in the CA state?
in each month wrt previous month?
Business Intelligence Lab
26

Q2 on foodmart
Which stores are the most profitable
mean profit wrt customers
= (total sales – total cost ) / number of customers
mean profit wrt baskets
= (total sales – total cost ) / number of baskets
evaluated
in each quarter of 1998 and gender?
in the CA state?
in each month wrt previous month?
Business Intelligence Lab
27

Q3 on foodmart
Which are the 5 product categories with the best
margin
for each age-range of customers?
evaluated
in each quarter of 1998 and gender?
in the CA state?
in each month wrt previous month?
Business Intelligence Lab
28

Data analysts: DW designer
Design and maintain the DW to satisfy new
requirements
by re-designing conceptual and logical shemata
adding new dimensions and attributes
adding new data marts
and managing the population of data
using ETL tools
Business Intelligence Lab
29

Q4 on foodmart
What quantity (in Kg) has been sold
in each quarter of 1998 and gender?
in the CA state?
in each month wrt previous month?
Business Intelligence Lab
30

Q5 on foodmart
In September 1998, store 7 changed its type
from ‘Supermarket’ to ‘Deluxe Supermarket’
with new store_id = 25, but it is the same store!
Which stores are the most profitable
in each quarter of 1998?
Business Intelligence Lab
31

BUSINESS INTELLIGENCE LABORATORY
MultiDimensional eXpressions (MDX)
Business Informatics Degree
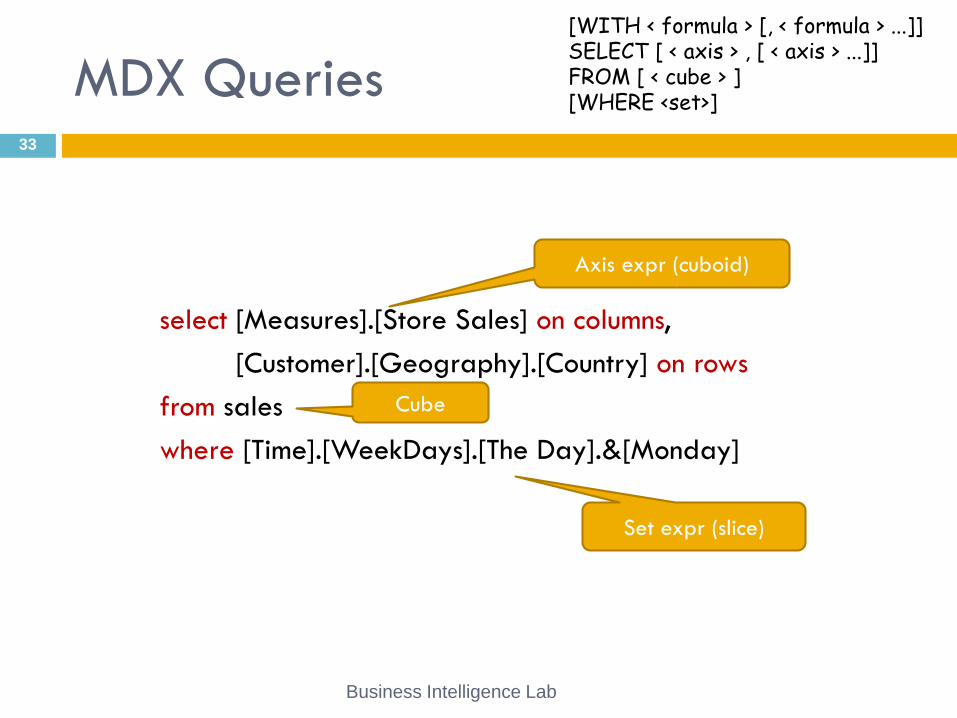
MDX Queries
select [Measures].[Store Sales] on columns,
[Customer].[Geography].[Country] on rows
from sales
where [Time].[WeekDays].[The Day].&[Monday]
Business Intelligence Lab
33
Axis expr (cuboid)
Cube
Set expr (slice)
[WITH < formula > [, < formula > ...]]SELECT [ < axis > , [ < axis > ...]]FROM [ < cube > ][WHERE <set>]

Syntax: [DimensionName].[HierarchyName].[LevelName].[MemberName]
Example: [Store].[Time].[Quarter].&[Quarter 1]
Syntax: [DimensionName].[HierarchyName].[Path from root]
Example: [Store].[Time]. [All].[2004].[Quarter 1]
Members of hierarchies & nav. functions34
Hierarchy
Parent
Of Quarter 1
Siblings
Children of
Quarter 4
Ancestors
of Dec
Descendants
of 2004
Cousins

Axis axis ::= [NONEMPTY] Set ON (alias| AXIS(number) | number)
aliases COLUMNS, ROWS, PAGES, SECTIONS, and CHAPTERS
Sets Set ::= tuple | {tuple, …, tuple} | set + set | set – set |
set_function(parameters)
Denotes a set of members/tuples
Tuples Tuple ::= Member | (Member, …, Member)
Denotes a data cube cell by its coordinates
No two members over the same hierarchy Two member over the same dimension is OK
Cube
subselects are admitted
Tuples, Sets, Axis
Business Intelligence Lab
35
[WITH < formula > [, < formula > ...]]SELECT [ < axis > , [ < axis > ...]]FROM [ < cube > ][WHERE <set>]

Calculations
Calculated member
Formula ::= MEMBER alias_name AS mdx_expr
Named set formula
Formula ::= SET alias_name AS set
Syntax of MDX expressions
mdx_expr ::= Numeric | ( Tuple, Numeric )
Numeric ::= [Measures].[measure name]
| numeric_function(Parameters)
| Numeric + Numeric | Numeric - Numeric
| Numeric / Numeric | Numeric * Numeric
Meaning:
Numeric: the expression Numeric is evaluated on the current cell
( Tuple, Numeric ): the expression Numeric is evaluated on the cell Tuple
Business Intelligence Lab
36
[WITH < formula > [, < formula > ...]]SELECT [ < axis > , [ < axis > ...]]FROM [ < cube > ][WHERE <set>]

Calculations in SSDT + Excel37

Exercise on the FoodMart cube
Re-do the explorative data analysis exercise
(queries Q0-Q3) using MDX instead of Excel/BIDS
Extra queries
Q1extra: top 5 categories wrt sales since 1 Jan 1998
in CA in March 1998
extra: how many cities per sales region had more than
4.000 dollars of total sales in March 1998
Business Intelligence
38


![[SSAS] 다차원 프로세싱](https://static.fdocuments.net/doc/165x107/55958d451a28abe7798b46cd/ssas-.jpg)