
Business Intelligence Intelligent Business - Amazon S3 Intelligence Intelligent Business Cameron...
56
Business Intelligence Intelligent Business Cameron Cox, III, MHA, FACMPE CEO, MSOC Health
Transcript of Business Intelligence Intelligent Business - Amazon S3 Intelligence Intelligent Business Cameron...
Business Intelligence
Intelligent Business Cameron Cox, III, MHA, FACMPE
CEO, MSOC Health

Learning Objectives 1. Definitions: (Big) Data, Dashboard, Analytics 2. Review effective dashboard principles 3. Understand important differences between
data, analysis and presentation 4. Recognize differences in analytics 5. Review Financial Metrics, Analytics in a
practice setting
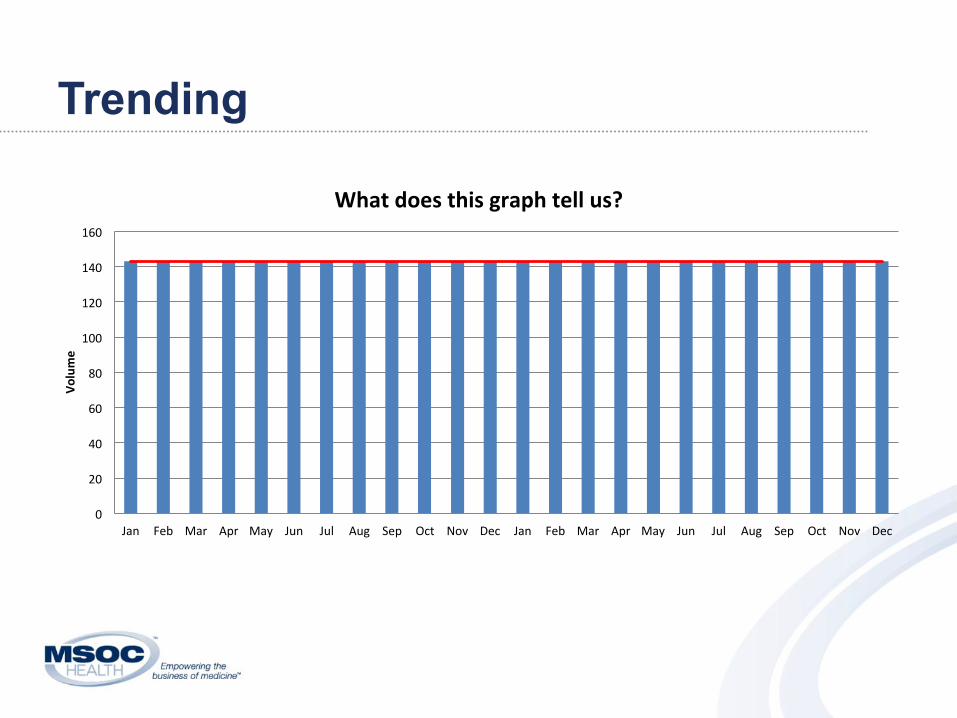
Trending
0
20
40
60
80
100
120
140
160
Jan Feb Mar Apr May Jun Jul Aug Sep Oct Nov Dec Jan Feb Mar Apr May Jun Jul Aug Sep Oct Nov Dec
Volume
What does this graph tell us?

Success! Full plane

What will happen in the following scenario? • I am driving 80 mph in my Camaro with the
windows down and sunroof open, the music blaring and my cool sunglasses on.
• A State Trooper has a radar gun. • The radar gun is pointed directly at my
Camaro. • The State Trooper is also wearing cool
sunglasses.

Nothing….I’m in Montana

Cam’s Personal Dashboard
0
50
100
150
200
250
300
350
1970
19
71
1972
19
73
1974
19
75
1976
19
77
1978
19
79
1980
19
81
1982
19
83
1984
19
85
1986
19
87
1988
19
89
1990
19
91
1992
19
93
1994
19
95
1996
19
97
1998
19
99
2000
20
01
2002
20
03
2004
20
05
2006
20
07
2008
20
09
2010
20
11
2012
20
13
2014
20
15
2016
Cam's Life
Cute/Sexy Smart Funny
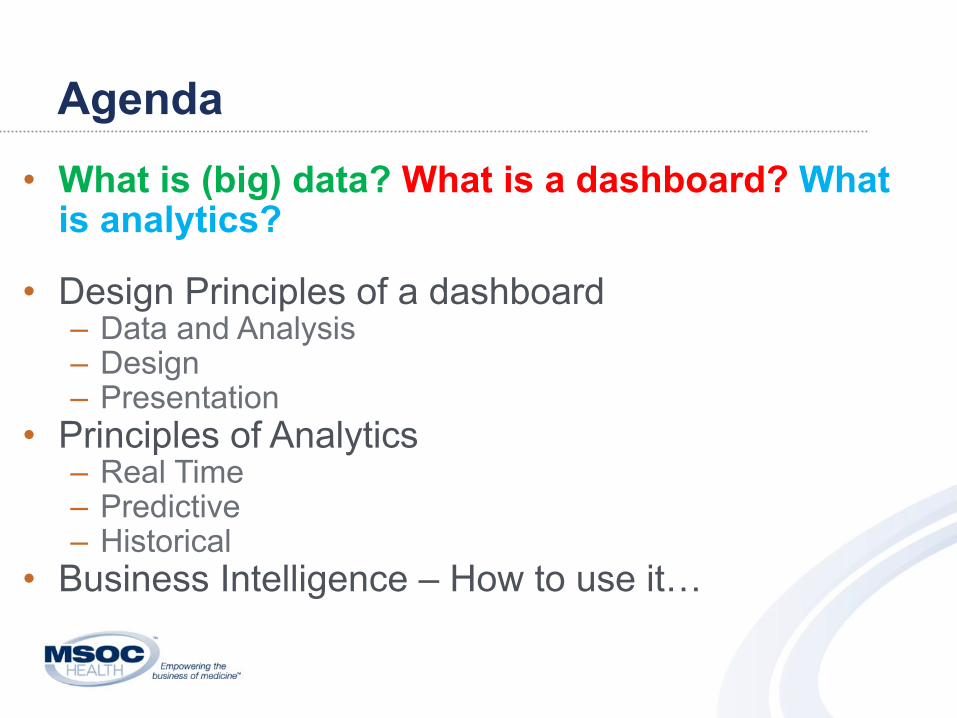
Agenda • What is (big) data? What is a dashboard? What
is analytics?
• Design Principles of a dashboard – Data and Analysis – Design – Presentation
• Principles of Analytics – Real Time – Predictive – Historical
• Business Intelligence – How to use it…

What is (big) data?

Latest Buzzword

Who better to explain than the internet?

Big Data at work…

What is a dashboard?

It’s hard to drive without a dashboard
Keep your eyes on the road but…..

What is not a dashboard? • Report • Just because it’s on-line
or web based • Just because it’s real time • Balanced Scorecard • Tool to dive into detail • Just because it has
gauges and graphs

A dashboard is …
… a visual display of the most important information needed to achieve one or more objectives, consolidated and arranged on a
single screen so the information can be monitored at a glance.

Dashboards The Chosen Tool for Consolidating Data Simply

Please count the # of 7’s in this array:
59374304814959730493
70241382710993183453
59474942479103587494

Now count the # of 7’s:
59374304814959730493
70241382710993183453
59474942479103587494

This….not that

A Dashboard’s Hierarchy of Needs
Clear Presentation
Formulated Analysis
Large Data Set

Data

Analysis

Presentation

What is the purpose of dashboard? • Mission Statement • Audience • Performance Measures (KPI & Metrics) • What logical groupings will organize the info
best? • What comparisons should be made? • How frequently will it be updated? • What actions might be taken?

WATCH OUT! Potential gap ahead…
Time…understand it in your analysis. Real Time versus Time Trends • Airline Pilot or ICU physician or Call Center • Retail, Financial, Manufacturing • Closer to real time better • Understanding secular/historical trends
important also

Trends • Hour by Hour, Day by Day, Week by Week • Month by Month, Quarter by Quarter • Compare to prior hour, day, week, month,
quarter, year • Month to Date, Quarter to Date, Year to Date

Context/Comparisons add Perspective • Historical
– Last period – Last period 1 year ago
• Benchmark • Goals or Budgets • Relative to other providers • Forecast

You Need Good, Unfiltered Data • Available-Who did you have to toss under the
bus to find this information? • Reliable -Do you believe these #’s? • Relevant • Timely-Last years data is too late. • Simple, simple, SIMPLE

What is analytics?

Structured Breakdown with purpose Detailed examination of the elements
– Identifying the elements – Separating the elements into constituent
elements – Measuring the elements

Analytic Continuum
Descriptive- What happened?
Diagnostic- Why did it happen?
Predictive-What will happen?
VALU
E
DIFFICULTY

Real Time Analytics

How does this work?

Okay…how does this work in healthcare?

Predictive Analytics

How does it work?

How does it work in healthcare?
Increase Marketing Dollars during end of season
Have more open scheduling slots during
end of season

Another example
0 1 2 3 4 5 6 7 8 9 10 11 12 13 14 15 16 17 18 19 20 21 22 23 24 25 26 27 28 29 Total 26
3 475
323
336
350
393
450
852
384
301
252
188
168
179
387
172
109
87 79 68 108
276
75 54 57 60 50 77 396
71
0 100 200 300 400 500 600 700 800 900
No
Sho
ws
# of days between Booking Date and Appt Date
No Shows: Days from Booking Date
Group one week follow-up slot times; advertise
walk in availability at same times
Double book one week follow-ups with other appointments to keep
utilization high
Change booking pattern; encourage
patients to self-schedule follow ups

Data – What do we want to measure…analyze…present

Types of Data
I. Volume A. Productivity (patients,
encounters, days worked)
B. Activities (procedures, labs, x-ray, calls)
C. Hours/Shifts
II. Quality & Clinical A. Clinical Quality B. Patient Satisfaction
III. Billing & Financial A. Charge Capture &
Gross Revenue B. Costs C. Collections D. Profit/Loss
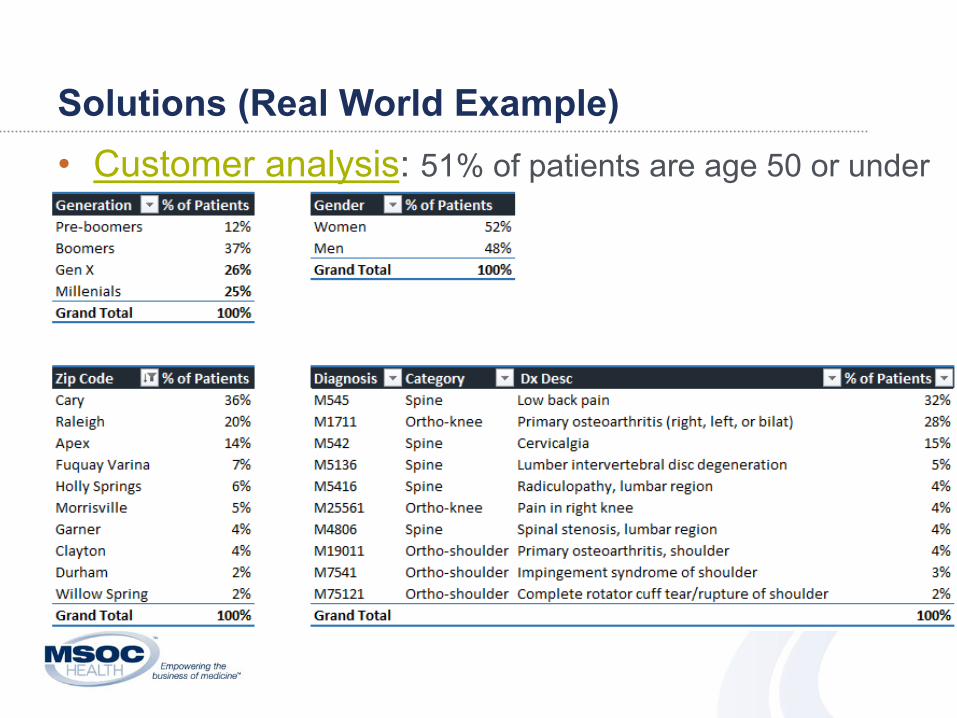
Solutions (Real World Example) • Customer analysis: 51% of patients are age 50 or under
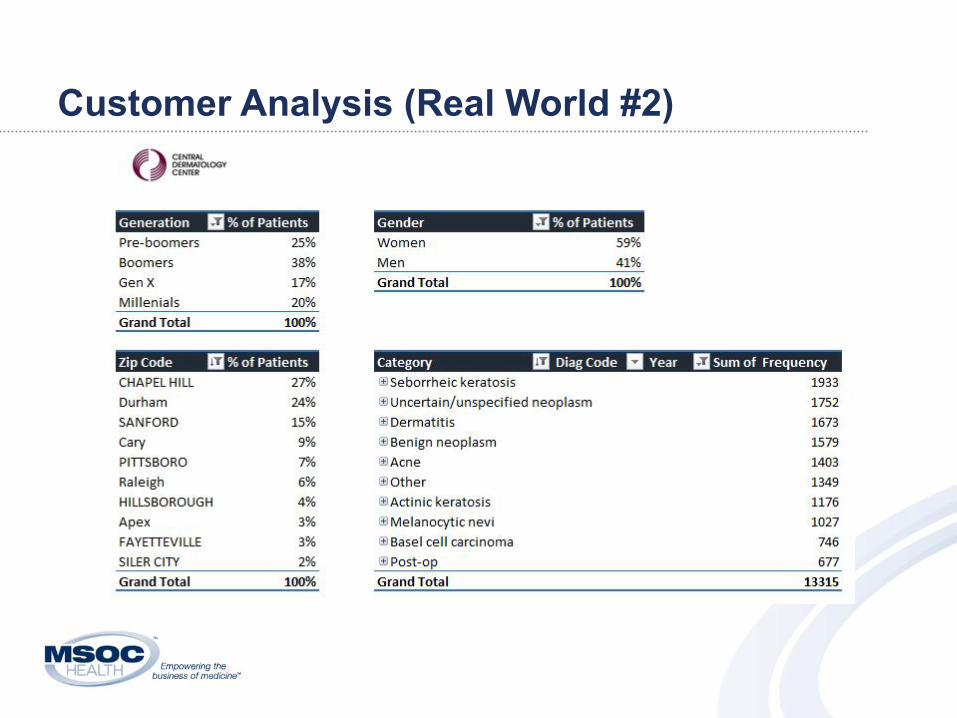
Customer Analysis (Real World #2)

Customer Analysis by Location
• Cary location sees more Millennials than other locations.
• Sanford has the oldest patient population.

Opportunity cost • Compare commercial contract proposals to
other payors; is participating worth the effort?

Contract Value • Consider all product lines…dropping out
means loss of Medicare Advantage patients

Variance Analysis • Review payments to ensure payor
compliance with contracted rates, identify denial trends or performance issues

I. Volumes • Patient Encounters per day/provider/group • Procedures per E&M • Year to Year trends/ Seasonality • Admits/Discharges • By Financial Class • Day of Week • By CPT Code • By ICD-9 (soon -10)

II. Quality & Clinical • X-rays per ICD-10 • Scripts per encounter • Volume of Preventative
Well Visits • Vaccinations to total
practice population • Core Measures
• Nurse calls • Lab Response Times • Patient Education
Delivery • Recall rates • Patient satisfaction • Wait Times

III. Billing & Financial • RVU per encounter • Cost per procedure/category • Code Distributions • Patient Responsibility per encounter • Patients by Payer Class • Accounts Receivable > 90 days • PQRS Capture • Insurance Denials

Don’t Let Tools Confuse You The Best Tool is Your Brain

Always Remember: A Dashboard is a Presentation of the Data Analytics is an interpretation of the Data Basics to not forget!!!
– P&L – A/R Analysis – Revenue Flow – Financial Classification

Connect with us www.facebook.com/MSOCHealth www.linkedin.com/company/MSOC-Health http://www.msochealth.com/blog/

Thank You MSOC Health (866) 347-0001 200 Timber Hill Place Suite 221 Chapel Hill, NC 27514 www.msochealth.com
Thank You


