BUSINESS FINANCE ASSIGNMENT - …€¦ · In this assignment, learner has calculated the beta...
15
1 BUSINESS FINANCE ASSIGNMENT
-
Upload
vuongkhuong -
Category
Documents
-
view
214 -
download
0
Transcript of BUSINESS FINANCE ASSIGNMENT - …€¦ · In this assignment, learner has calculated the beta...

1
BUSINESS FINANCE ASSIGNMENT

2
Table of Contents Introduction: .................................................................................................................................... 3
Literature Review: .......................................................................................................................... 3
Results from the Analysis: .............................................................................................................. 6
Discussion on the issue in connection with the literature: ............................................................ 12
Conclusion: ................................................................................................................................... 13
Reference list: ............................................................................................................................... 14

3
Introduction:
In the high competitive word, the main aim of many companies is to maximize their return and
minimize the risk of the investment. As per the report of Online Sales Industry Outlook (2015)
by Criteo, the global e-commerce saw an impressive growth in 2014 with goods and services
worth $1.5 billion. The advertiser’s increases spending on the proportion of their marketing
budgets on internet advertising. It is essential to decide the amount of risk the company can take
while remaining comfortable with the investments.
The higher the risk, the higher return is the general understanding of many businesses. However,
it is not a necessity because the risk means higher potential return as well as higher potential of
the losses. In the essay the learner analyses the risk and return relationship of various online sales
company considering the CAPM model. For analysis total ten companies were selected-
NASDAQ, Amazon, Amer.woodmark, 1-800- Flower.Com ‘A’, Book-A- Million, Costo
Wholesale, EBay, Stamps.Com, United Online, Livedeal And Panera Bread ‘A’ which deals in
online sales business. The main issues of the study relates to the criticism of the CAPM model.
The Beta value preferred generally by the companies is based on proxy and this made the
assessment of actual risk related to investment difficult.
Literature Review:
The literature review describes the concept of risk and relationship of the risk and return
explaining the concept of the models. Many historical philosophers and management
professional have enlightened the concept of risk and return relationship. The risk return
relationship enables the business to assess the potential of the company by considering the
assessment of their investment projects. The study considers the CAPM model besides Single
Index Model. As stated by Alquier & Biau (2013 the CAPM model is evolved from the criticism
of the single index model.
Single Index Model

4
The single index model is a simple asset pricing model that is used to measure the risk and return
of a stock and commonly used in the finance industry.
Lopez (2009) stated the main assumption of this model is that most stocks have a positive
covariance because they all respond similarly to macroeconomic factors. However, some firms
are more sensitive to these factors and the firm-specific variances is typically denoted by its beta
β which measure its variance compared to the market or one or more economic factors.
CAPM model
According to Gaiffas & Lecue (2010), the Capital asset pricing model (CAPM) describes the
relationship between the expected risk and expected return. This model is also used in the pricing
of risky stocks and securities.
The various assumption and implications of Capital Asset Pricing model stated that:
Security markets are perfectly competitive: there are many small investors and all the
investors are price takers.
Markets are frictionless means there are no taxes or transaction costs
The investors are myopic means all investors have only one and same holding period.
The investments are limited to publicly traded assets with unlimited borrowing and
lending at fixed rate: asset excludes human capital is not the part of investment
opportunity set.
The investors are all rational mean-variance optimizers referring that everyone uses the
Markowitz portfolio method.
They markets are served with perfect information that means all the investors have the
same access to information and all the investors analyzes the information in a similar
manner.
Everyone in the market has quadratic utility or has homogenous beliefs concerning the
distribution of security returns that means everyone uses the same estimates of expected
return and the same variance covariance matrix (Khan et al. 2012).
In addition to the above assumptions there is no transaction cost, no personal income taxes and
no inflation in the economy.

5
The derivation of the capital asset pricing model is represented as follows
E (ri) =rf+β(rf-rm)
Where E (ri) = return required on financial asset, rf= risk-free rate of return β = beta value
for the financial asset i and E (rm )= average return on the capital market.
For the analysis purpose β value is calculated through regression analysis. In the regression
analysis, the slope of the intercept gives the β value.
However, there are various criticism of the CAPM model which includes
The commonly accepted rate used for the rf is yield the short term government securities
causing changes in the stock price.
For instance if the stock price of any organisation is low and the return on short term
government securities is also low investors may not invest in the particular corporation
considering it as low profile for actual yield.
The return on market is influenced by the capital gains and dividends of the market and
the return are backward-looking and may not be representative of future market return.
The model is based on the assumption that strongly pictures the unrealistic real world.
The beta value used in CAPM model is generally proxy based and does not assess the
risk related to the projects
Background of the industry
In the Retail Industry according to Hanif & Bhatti (2010), the overall online retail shopping
values at $171. 12 billion in the financial year ended 2010. The results shows that consumer
are seeking greater value in their purchase, greater variety voices of goods, widespread usage
of online products and services, increasing level of sophistication and comfort amongst
consumers’ across all age groups. Hui & Christopher (2008) stated that in terms of economy.
In the words of Eatzaz & Attiya, (2008), with the expansion of the increase in demand of
products and services the main aim of the industry is to deliver the products and services
timely to the customers or consumers across the country.

6
The report also declared that during the period of recession the retail industry of UK was
affected severely. The factors which affect sales are people’s purchasing ability and
willingness to spend. During recession due to the downfall in the disposal income and
customer spending the retail sales was declined to 3 percent in year 2009. This resulted in the
decline of profitability for many retailers as the promotional expenses were huge. However
with the optimism as the strategy the industry is planning to recover with several ways.
The various segments of the retail industry include mega mall retail stores, wholesale
business owners and small distributors. In recent years, the retail industry also added a new
segment, the online sale market. The online sale market general deals with tangible goods
rather than intangible services. The goods are delivered to the customers at their door step.
This market made the use of internet technology and deals with customer via computer,
laptops and mobile phones. Leung & Arnt (2015) stated that e Commerce in the boon in the
retail industry and has consistently outperformed because most consumer are valuing low and
transparent prices for the good and services.
Results from the Analysis:
The beta analysis of a stock determines the riskiness of the individual stock. Beta can be
calculated either through regression analysis or through the method of covariance.
In the regression analysis the market returns and the expected returns of the individual stock. The
intercept determines the beta value. Beta is considered to be the measure of volatility of a
particular stock. The market beta value is 1 and the deviation of the individual stock from the
market beta value determines the movement of the stocks in the market. If the beta value is found
to be more than one then the stock is more deviated from the market. On the other hand, if the
beta value of the individual stocks is less than one then this imply that the stock moves lesser
than the market.
Higher beta value implies that the riskiness of the stock is very high and lower beta values imply
that the stocks have low risk. However, since there exist a linear relationship between the risk
and the return of the stock, higher return is expected with higher beta values. In other words, the
higher the risk involved in the individual stock higher will be the market return.
7
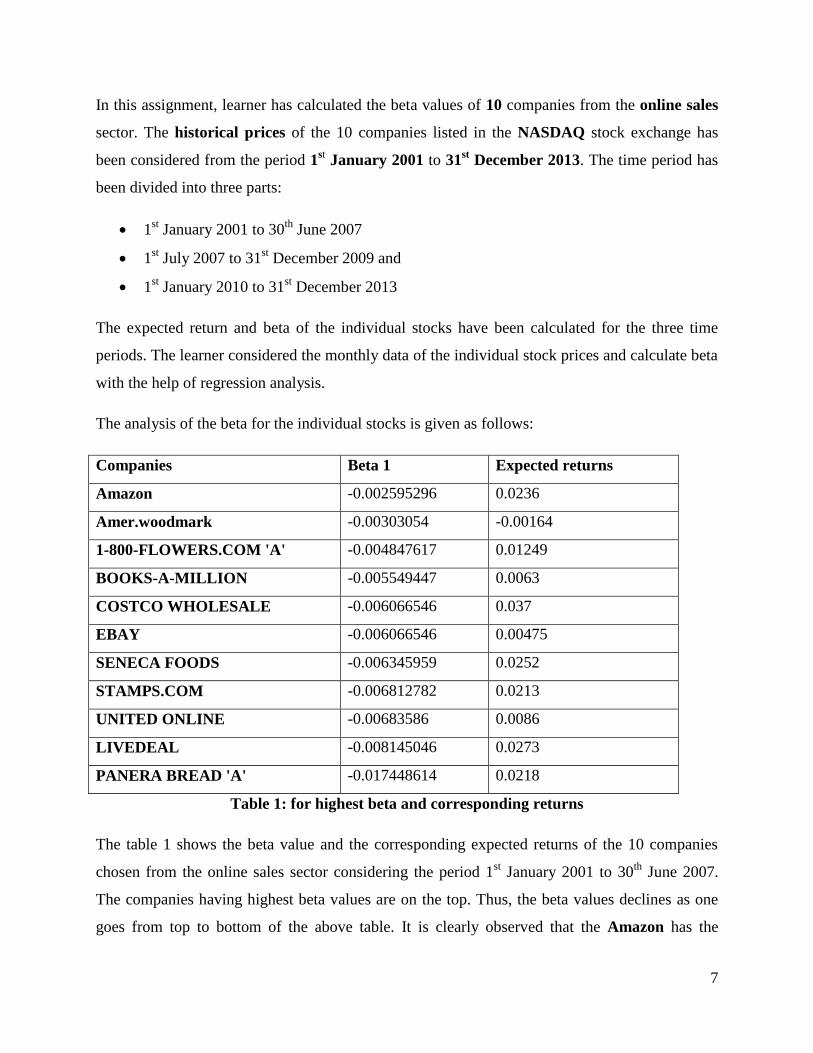
In this assignment, learner has calculated the beta values of 10 companies from the online sales
sector. The historical prices of the 10 companies listed in the NASDAQ stock exchange has
been considered from the period 1st January 2001 to 31
st December 2013. The time period has
been divided into three parts:
1st January 2001 to 30
th June 2007
1st July 2007 to 31
st December 2009 and
1st January 2010 to 31
st December 2013
The expected return and beta of the individual stocks have been calculated for the three time
periods. The learner considered the monthly data of the individual stock prices and calculate beta
with the help of regression analysis.
The analysis of the beta for the individual stocks is given as follows:
Companies Beta 1 Expected returns
Amazon -0.002595296 0.0236
Amer.woodmark -0.00303054 -0.00164
1-800-FLOWERS.COM 'A' -0.004847617 0.01249
BOOKS-A-MILLION -0.005549447 0.0063
COSTCO WHOLESALE -0.006066546 0.037
EBAY -0.006066546 0.00475
SENECA FOODS -0.006345959 0.0252
STAMPS.COM -0.006812782 0.0213
UNITED ONLINE -0.00683586 0.0086
LIVEDEAL -0.008145046 0.0273
PANERA BREAD 'A' -0.017448614 0.0218
Table 1: for highest beta and corresponding returns
The table 1 shows the beta value and the corresponding expected returns of the 10 companies
chosen from the online sales sector considering the period 1st January 2001 to 30
th June 2007.
The companies having highest beta values are on the top. Thus, the beta values declines as one
goes from top to bottom of the above table. It is clearly observed that the Amazon has the

8
highest beta value, though it is lower than the market beta value which depicts that Amazon’s
stock proves show lower deviation from the market. The corresponding return of Amazon is
0.0236. Thus, with highest risk, the market return of the stock is higher. However, Livedeal has
the second lowest beta value but it has the highest expected market return. Thus, in this period,
even though investing in the Amazon stock prices were highly risky with more than moderate
return, the investment in the Livedeal stocks prove be the best investing option as it has lower
risk and highest return. Thus the risk averse individual would be highly benefitted by investing in
the Livedeal stocks.
The second tables show the relative risk and the expected return of the same companies in the
time period 1st July 2007 to 31
st December 2009. The analysis of the risk return trade off between
the companies is done as follows:
Companies beta 2 Expected return
PANERA BREAD 'A' 0.01153469 -0.05105
BOOKS-A-MILLION 0.00554343 0.0193
SENECA FOODS 0.00497618 0.00049
STAMPS.COM 0.00473988 -0.00065
Amazon 0.00473834 0.0197
Amer.woodmark 0.00471288 0.0369
EBAY 0.0043434 0.0079
LIVEDEAL 0.00062561 -0.012
UNITED ONLINE 0.00032875 0.03013
COSTCO WHOLESALE -0.0007955 0.00202
1-800-FLOWERS.COM 'A' -0.0096368 0.0143
Table 2: for highest beta and corresponding returns
From the above table it is evident that PANERA BREAD A has the highest risk of 0.0115, which
is lower than the market value of beta. This implies that the stock has been deviating less with
the market trend. The previous period dealt with Amazon being the riskiest stock. But in this
period Amazon’s risk is decreased but not to a very high extent. The corresponding expected

9
return of the riskiest stock that is of the PANERA BREAD is the lowest. Thus, investing in the
PANERA BREAD stocks would give the lowest return. Amazon, on the other hand, has
moderately high risk and moderately high return. The highest return is attained by investing in
the stocks of Amer.woodmark. However, the riskiness of the company is moderately higher but
lower than that of Amazon. Thus the risk lover would invest in the Amer.Woodmark to attain
higher return.
The third table show the relative risk and the expected return of the same companies in the time
period 1st January 2010 to 31
st December 2013. The analysis of the risk return trade off between
the companies is done as follows:
Companies beta 3 Expected returns
PANERA BREAD 'A' 0.016448 0.004554
BOOKS-A-MILLION 0.012966 0.0262
SENECA FOODS 0.011275 0.0279
STAMPS.COM 0.00992 0.0156
Amazon 0.009236 0.0205
Amer.woodmark 0.009137 0.0093
EBAY 0.007285 0.012
LIVEDEAL 0.006664 0.013
UNITED ONLINE 0.005967 0.0222
COSTCO WHOLESALE 0.003641 0.012
1-800-FLOWERS.COM 'A' 0.003558 0.0347
Table 3: for highest beta and corresponding returns
In this period, the PANERA BREAD continues to be the riskiest stock with relatively higher
return as compared to the previous period. However, the riskiness of Amazon has declined
sharply yielding moderate return from its stock prices. The 1800-Flower.com remains to be the
lowest risky stock yielding highest return. Thus risk averse individuals will be highly benefitted
by investing in this stock.
The next set of observation depicts the stocks yielding highest return with its corresponding
associated risk. The following table shows the return and risk in the first period.

10
Companies Beta 1 Expected returns
COSTCO WHOLESALE -0.00607 0.037
LIVEDEAL -0.00815 0.0273
SENECA FOODS -0.00635 0.0252
Amazon -0.0026 0.0236
PANERA BREAD 'A' -0.01745 0.0218
STAMPS.COM -0.00681 0.0213
1-800-FLOWERS.COM 'A' -0.00485 0.01249
UNITED ONLINE -0.00684 0.0086
BOOKS-A-MILLION -0.00555 0.0063
EBAY -0.00607 0.00475
Amer.woodmark -0.00303 -0.00164
Table 4: for highest return and corresponding beta
The above analysis depicts that COSTCO WHOLESALE yields the highest return with highest
risk involved in it. The risk averse investors would choose to invest in this security because it has
the highest return with lower risk. The Amer.Woodmark would yield a very low return with very
low risk. Amazon will yield moderate return with moderate risk. The risk lovers will invest in the
risky securities that in this case in PANERA BREAD A which yields moderate return.
The next table shows the data relating to the expected return and the risk in the next period.
Companies beta 2 Expected returns
1-800-FLOWERS.COM 'A' -0.00964 0.0369
PANERA BREAD 'A' 0.011535 0.03013
Amer.woodmark 0.004713 0.0197
BOOKS-A-MILLION 0.005543 0.0193
Amazon 0.004738 0.0143
EBAY 0.004343 0.0079
COSTCO WHOLESALE -0.0008 0.002
UNITED ONLINE 0.000329 0.00049
LIVEDEAL 0.000626 -0.00065
11
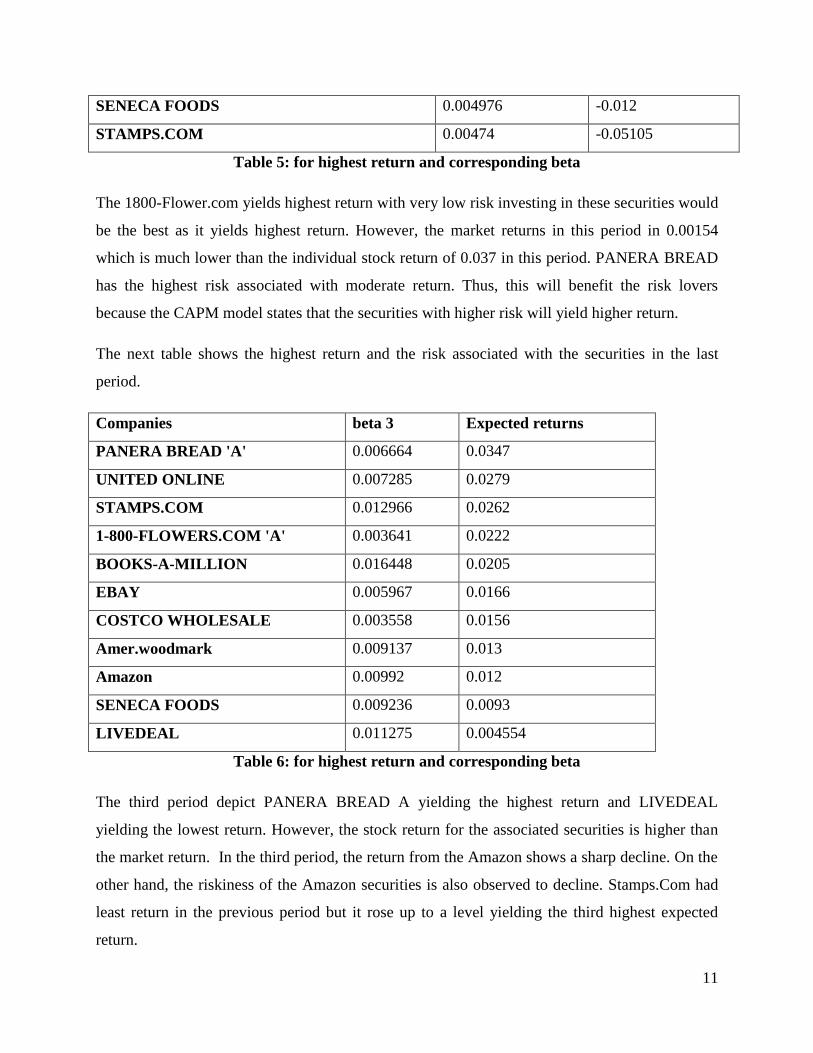
SENECA FOODS 0.004976 -0.012
STAMPS.COM 0.00474 -0.05105
Table 5: for highest return and corresponding beta
The 1800-Flower.com yields highest return with very low risk investing in these securities would
be the best as it yields highest return. However, the market returns in this period in 0.00154
which is much lower than the individual stock return of 0.037 in this period. PANERA BREAD
has the highest risk associated with moderate return. Thus, this will benefit the risk lovers
because the CAPM model states that the securities with higher risk will yield higher return.
The next table shows the highest return and the risk associated with the securities in the last
period.
Companies beta 3 Expected returns
PANERA BREAD 'A' 0.006664 0.0347
UNITED ONLINE 0.007285 0.0279
STAMPS.COM 0.012966 0.0262
1-800-FLOWERS.COM 'A' 0.003641 0.0222
BOOKS-A-MILLION 0.016448 0.0205
EBAY 0.005967 0.0166
COSTCO WHOLESALE 0.003558 0.0156
Amer.woodmark 0.009137 0.013
Amazon 0.00992 0.012
SENECA FOODS 0.009236 0.0093
LIVEDEAL 0.011275 0.004554
Table 6: for highest return and corresponding beta
The third period depict PANERA BREAD A yielding the highest return and LIVEDEAL
yielding the lowest return. However, the stock return for the associated securities is higher than
the market return. In the third period, the return from the Amazon shows a sharp decline. On the
other hand, the riskiness of the Amazon securities is also observed to decline. Stamps.Com had
least return in the previous period but it rose up to a level yielding the third highest expected
return.

12
Discussion on the issue in connection with the literature:
The CAPM model is one of the best models to be considered while calculating the risk and the
expected return of a security. The CAPM model helps in analysing the riskiness of the security in
respect to the market risk. This analysis helps the investor in deciding upon the companies in
which the investors wants to invest. The risk averse, the risk lovers and the risk neutrals consider
different factors while investing in the securities. The CAPM model helps the investors in
determining the risk and the associated returns.
However, Bugeja & Czernkowski & Moran (2010) is of the view that the CAPM model is based
on certain assumptions which are considered to be unrealistic. The assumptions of the CAPM
model is that the investors hold diversified portfolios. It means that the investors would require
return on the systematic return but in practice the unsystematic risk is also considered while
calculating the return from the securities. The unsystematic risk arises out of the inflation rate
and sudden changes in the market.
Secondly, the other assumption is that the CAPM model calculates the risk and return of the
securities in respect to a single period. However, the risk and return of a month cannot be
compared to that of the whole period. This is because the market return and risk changes over
time due to change in the markets trends. (Capital Asset Pricing Model, 2009)
Thirdly, Carlina & Mayerb (2009) is of the view that the CAPM model assumes a perfect capital
market that is all the information regarding the securities are readily available to the investor.
However, in practise, the data information is not readily available. Even if the information’s are
available, the data is filtered. That is the prices of the stock do not consider the taxes or the
transaction costs. This information is not true and this creates a lot of difficulty in applying
CAPM model in the calculation of the risk and return of the securities.
Fourthly, the assumption that there exists a risk free rate on interest is not true. The model also
reveals that the investors hold market portfolio. However, it is in practical not possible for an
individual to hold the whole market portfolio as it is very expensive and difficult as well to hold
the whole market portfolio.

13
Conclusion:
The learner in this essay explained the concept of risk and return relationship stating that
businesses make use of this concept to analyze the risk associated with the investment and the
yield of the business. The literature review displays the models of risk return relationship- Single
index model and Capital Asset Pricing Model (CAPM). The learner also stated the assumption
and criticism of the models. The learner uses the CAPM deviation formula for ascertain the risk
associated with the investment. While analysing, the learner critically evaluated the risk factor of
ten companies using the beta value of the CAPM model. The issues also critically analyses the
issues mentioned in the literature review.
With the help of analyses the learner presented the real scenario. The learner analyses that the
securities with high risk yield higher return and vice versa. However, the application of the
CAPM model in determining the risk and the return associated is difficult because of the
assumptions of the CAPM model which is unrealistic in the practical world.

14
Reference list:
Journals:
Alquier, P. & Biau, G. (2013). “Sparse Single-Index Model”, Journal of Machine Learning
Research, 14 (3), pp. 243-280
Bugeja, M. & Czernkowski, R. & Moran. (2010) “The Impact of the Managemen Approach on
Segment Reporting”, Journal of Business Finance & Accounting ,42(1), pp. 310-336
Carlina W. & Mayerb C. (2009). ‘Finance, investment, and growth’, Journal of Financial
Economics , 69 , pp. 191–226
Eatzaz & Attiya, (2008), “Testing Multifactor Capital Asset Pricing Model in case of Pakistani
Market”, International Research Journal of Finance and Economics, 25(8), pp. 114-138
Edith Leung & Arnt Verriest (2015). ‘The Impact of IFRS 8 on Geographical Segment
Information, Journal of Business Finance & Accounting, 42, pp. 273-309
Hanif & Bhatti, (2010). “Validity of Capital Assets Pricing Model: Evidence from KSE-
Pakistan”, European Journal of Economics, Finance and Administrative Sciences, 20(6), pp.
140-153
Hui & Christopher, (2008), “Return Volatility Is Priced in Equities”, Financial Management
Association International, 37(4), pp. 769-790
Khan, M.I., Gul, M., Khan, N.M., NAwaz, B. & Sanaullah. (2012). “Assessing and Testing the
Capital Asset Pricing Model (CAPM): A Study Involving KSE-Pakistan”, Global Journal of
Management and Business Research, 12(10), pp. 33-37
Lopez, O. (2009). “Single-index regression models with right-censored responses”, Journal of
Statistical Planning and Inference, 139(6), pp. 1082–1097
S. Ga¨ıffas &G. Lecue. (2010). “Optimal rates and adaptation in the single-index model using
aggregation”, ´ Electronic Journal of Statistics, 1(8), pp. 538–573

15
Shleifer A. & Vishny R., 1997. ‘A survey of corporate governance’, Journal of Finance 52, pp.
1131–1150.
Wachtel P. (2011). ‘Growth and finance: what do we know and how do we know it?’
International Finance 4, pp. 335–362.
Websites:
Capital Asset Pricing Model (2009). www. columbia.edu Retrieve from:
http://www.columbia.edu/~ks20/FE-Notes/4700-07-Notes-CAPM.pdf


![Gov.cz · 54.116 [ms-I] 1.623 [m3.s-1] 0.115 Beztlakový režim kóta na za¿.. kóta na konci: délka: 0.3 m 0.012 - materiál. ocel Manningova drsnost 0.012 Tlakový režim 291.85](https://static.fdocuments.net/doc/165x107/5f8ebf2f3dafaa59472213e4/govcz-54116-ms-i-1623-m3s-1-0115-beztlakov-reim-kta-na-za-kta.jpg)


![Solid Tantalum Surface Mount Chip Capacitors ANTAMOUNT ... · V 7343-20 0.287 ± 0.012 [7.3 ± 0.30] 0.169 ± 0.012 [4.3 ± 0.30] 0.079 max [2.0 max] 0.051 ± 0.012 [1.3 ± 0.30]](https://static.fdocuments.net/doc/165x107/5fb399b2033ed705fe72d607/solid-tantalum-surface-mount-chip-capacitors-antamount-v-7343-20-0287-0012.jpg)