Business Expectations Survey - Bangko Sentral Ng Pilipinas · Business Expectations Survey 1 ......
13
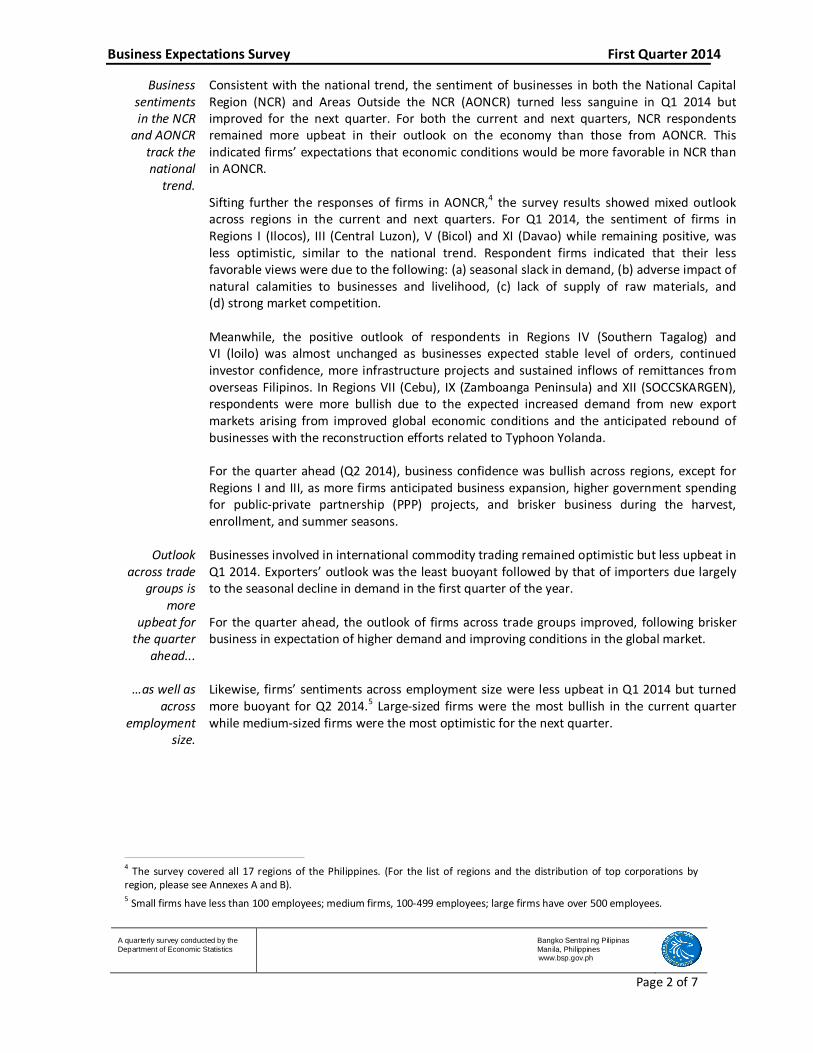
Business Expectations Survey 1 First Quarter 2014 2/27/2014 4:29 PM A quarterly survey conducted by the Department of Economic Statistics Bangko Sentral ng Pilipinas Manila, Philippines www.bsp.gov.ph Page 1 of 7 Business Outlook Remains Favorable in Q1 2014; Turns More Optimistic in the Next Quarter Overall Business Outlook on the Macroeconomy 1 Overall Business Confidence Index Q2 2001 – Q1 2014 41.5 52.3 37.8 56.4 40.7 50.8 -40 -30 -20 -10 0 10 20 30 40 50 60 70 Q2 2001 Q3 Q4 Q1 2002 Q2 Q3 Q4 Q1 2003 Q2 Q3 Q4 Q1 2004 Q2 Q3 Q4 Q1 2005 Q2 Q3 Q4 Q1 2006 Q2 Q3 Q4 Q1 2007 Q2 Q3 Q4 Q1 2008 Q2 Q3 Q4 Q1 2009 Q2 Q3 Q4 Q1 2010 Q2 Q3 Q4 Q1 2011 Q2 Q3 Q4 Q1 2012 Q2 Q3 Q4 Q1 2013 Q2 Q3 Q4 Q1 2014 Current Quarter Next Quarter Business confidence moderates but continues to be optimistic in Q1 2014. Businesses’ outlook on the economy continued to be favorable in Q1 2014, with the overall confidence index (CI) 2 at 37.8 percent. The current quarter’s CI was lower, however, compared to the 52.3 percent CI recorded in the Q4 2013 survey. This indicates that the number of optimists declined but continued to be greater than the number of pessimists during the quarter. Respondents attributed their less upbeat quarter-on-quarter outlook to the following: (a) usual slowdown in business activity and moderation of consumer demand after Christmas, (b) peso depreciation which would hurt importers, (c) adverse effects of Typhoon Yolanda on crop production and businesses, 3 (d) rising prices of oil and other utilities, (e) strong market competition, and (f) lack of supply of raw materials. The sentiment of businesses in the Philippines mirrored the less sanguine business outlook in Singapore and China, and was in contrast to the more buoyant views of those in the UK, Germany, Hong Kong SAR, India and New Zealand and the steady outlook in the US and South Korea. For the next quarter (Q2 2014), business outlook turned more optimistic, with the next quarter CI rising to 50.8 percent from 40.7 percent in the last survey. Respondents cited the following factors as reasons behind their more bullish outlook: (a) anticipated increase in demand during the secondary harvest season, graduation and enrollment periods, and summer season (with the expected influx of both local and foreign tourists), (b) brisker business arising from companies’ improved marketing strategies, and (c) new construction projects (public and private), boosted by rehabilitation efforts from Typhoon Yolanda. 1 The Business Expectations Survey (BES) is a quarterly survey of firms drawn at random from the combined list of the Securities and Exchange Commission’s Top 7,000 Corporations in 2010 and Business World’s Top 1,000 Corporations in 2012. Results of the BES provide advance indication of the direction of the change in the overall business activity in the economy and in the various measures of companies’ operations as well as in selected economic indicators. 2 The CI is computed as the percentage of firms that answered in the affirmative less the percentage of firms that answered in the negative with respect to their views on a given indicator. A positive CI indicates a favorable view, except for the inflation rate and the peso-borrowing rate, where a positive CI indicates the opposite. 3 Typhoon Yolanda happened last 8 November 2013 and affected Regions IV to X and CARAGA.
Transcript of Business Expectations Survey - Bangko Sentral Ng Pilipinas · Business Expectations Survey 1 ......

Business Expectations Survey 1
First Quarter 2014 2/27/2014 4:29 PM
A quarterly survey conducted by the Department of Economic Statistics
Bangko Sentral ng Pilipinas Manila, Philippines
www.bsp.gov.ph
Page 1 of 7
Business Outlook Remains Favorable in Q1 2014;
Turns More Optimistic in the Next Quarter
Overall Business Outlook on the Macroeconomy1
Overall Business Confidence Index
Q2 2001 – Q1 2014
41.5
52.3
37.8
56.4
40.7
50.8
-40
-30
-20
-10
0
10
20
30
40
50
60
70
Q22001
Q3 Q4 Q12002
Q2 Q3 Q4 Q12003
Q2 Q3 Q4 Q12004
Q2 Q3 Q4 Q12005
Q2 Q3 Q4 Q12006
Q2 Q3 Q4 Q12007
Q2 Q3 Q4 Q12008
Q2 Q3 Q4 Q12009
Q2 Q3 Q4 Q12010
Q2 Q3 Q4 Q12011
Q2 Q3 Q4 Q12012
Q2 Q3 Q4 Q12013
Q2 Q3 Q4 Q12014
Current Quarter
Next Quarter
Business
confidence
moderates
but
continues to
be
optimistic in
Q1 2014.
Businesses’ outlook on the economy continued to be favorable in Q1 2014, with the overall
confidence index (CI)2 at 37.8 percent. The current quarter’s CI was lower, however,
compared to the 52.3 percent CI recorded in the Q4 2013 survey. This indicates that the
number of optimists declined but continued to be greater than the number of pessimists
during the quarter. Respondents attributed their less upbeat quarter-on-quarter outlook to
the following: (a) usual slowdown in business activity and moderation of consumer demand
after Christmas, (b) peso depreciation which would hurt importers, (c) adverse effects of
Typhoon Yolanda on crop production and businesses,3 (d) rising prices of oil and other
utilities, (e) strong market competition, and (f) lack of supply of raw materials. The sentiment
of businesses in the Philippines mirrored the less sanguine business outlook in Singapore and
China, and was in contrast to the more buoyant views of those in the UK, Germany, Hong
Kong SAR, India and New Zealand and the steady outlook in the US and South Korea.
For the next quarter (Q2 2014), business outlook turned more optimistic, with the next
quarter CI rising to 50.8 percent from 40.7 percent in the last survey. Respondents cited the
following factors as reasons behind their more bullish outlook: (a) anticipated increase in
demand during the secondary harvest season, graduation and enrollment periods, and
summer season (with the expected influx of both local and foreign tourists), (b) brisker
business arising from companies’ improved marketing strategies, and (c) new construction
projects (public and private), boosted by rehabilitation efforts from Typhoon Yolanda.
1 The Business Expectations Survey (BES) is a quarterly survey of firms drawn at random from the combined list of the Securities
and Exchange Commission’s Top 7,000 Corporations in 2010 and Business World’s Top 1,000 Corporations in 2012. Results of the
BES provide advance indication of the direction of the change in the overall business activity in the economy and in the various
measures of companies’ operations as well as in selected economic indicators. 2 The CI is computed as the percentage of firms that answered in the affirmative less the percentage of firms that answered in the
negative with respect to their views on a given indicator. A positive CI indicates a favorable view, except for the inflation rate and
the peso-borrowing rate, where a positive CI indicates the opposite. 3 Typhoon Yolanda happened last 8 November 2013 and affected Regions IV to X and CARAGA.
Business Expectations Survey First Quarter 2014
A quarterly survey conducted by the Department of Economic Statistics
Bangko Sentral ng Pilipinas Manila, Philippines
www.bsp.gov.ph
Page 2 of 7
Business
sentiments
in the NCR
and AONCR
track the
national
trend.
Consistent with the national trend, the sentiment of businesses in both the National Capital
Region (NCR) and Areas Outside the NCR (AONCR) turned less sanguine in Q1 2014 but
improved for the next quarter. For both the current and next quarters, NCR respondents
remained more upbeat in their outlook on the economy than those from AONCR. This
indicated firms’ expectations that economic conditions would be more favorable in NCR than
in AONCR.
Sifting further the responses of firms in AONCR,4 the survey results showed mixed outlook
across regions in the current and next quarters. For Q1 2014, the sentiment of firms in
Regions I (Ilocos), III (Central Luzon), V (Bicol) and XI (Davao) while remaining positive, was
less optimistic, similar to the national trend. Respondent firms indicated that their less
favorable views were due to the following: (a) seasonal slack in demand, (b) adverse impact of
natural calamities to businesses and livelihood, (c) lack of supply of raw materials, and
(d) strong market competition.
Meanwhile, the positive outlook of respondents in Regions IV (Southern Tagalog) and
VI (loilo) was almost unchanged as businesses expected stable level of orders, continued
investor confidence, more infrastructure projects and sustained inflows of remittances from
overseas Filipinos. In Regions VII (Cebu), IX (Zamboanga Peninsula) and XII (SOCCSKARGEN),
respondents were more bullish due to the expected increased demand from new export
markets arising from improved global economic conditions and the anticipated rebound of
businesses with the reconstruction efforts related to Typhoon Yolanda.
For the quarter ahead (Q2 2014), business confidence was bullish across regions, except for
Regions I and III, as more firms anticipated business expansion, higher government spending
for public-private partnership (PPP) projects, and brisker business during the harvest,
enrollment, and summer seasons.
Outlook
across trade
groups is
more
upbeat for
the quarter
ahead...
Businesses involved in international commodity trading remained optimistic but less upbeat in
Q1 2014. Exporters’ outlook was the least buoyant followed by that of importers due largely
to the seasonal decline in demand in the first quarter of the year.
For the quarter ahead, the outlook of firms across trade groups improved, following brisker
business in expectation of higher demand and improving conditions in the global market.
…as well as
across
employment
size.
Likewise, firms’ sentiments across employment size were less upbeat in Q1 2014 but turned
more buoyant for Q2 2014.5 Large-sized firms were the most bullish in the current quarter
while medium-sized firms were the most optimistic for the next quarter.
4 The survey covered all 17 regions of the Philippines. (For the list of regions and the distribution of top corporations by
region, please see Annexes A and B).
5 Small firms have less than 100 employees; medium firms, 100-499 employees; large firms have over 500 employees.

Business Expectations Survey First Quarter 2014
A quarterly survey conducted by the Department of Economic Statistics
Bangko Sentral ng Pilipinas Manila, Philippines
www.bsp.gov.ph
Page 3 of 7
Sectoral Outlook
Current Quarter Business Outlook Index by Sector
Q2 2001 – Q1 2014
Industry Sector
29.4
41.7 34.3
Construction Sector
50.5 49.646.1
-60
-50
-40
-30
-20
-10
0
10
20
30
40
50
60
70
80
Q22001
Q3 Q4 Q12002
Q2 Q3 Q4 Q12003
Q2 Q3 Q4 Q12004
Q2 Q3 Q4 Q12005
Q2 Q3 Q4 Q12006
Q2 Q3 Q4 Q12007
Q2 Q3 Q4 Q12008
Q2 Q3 Q4 Q12009
Q2 Q3 Q4 Q12010
Q2 Q3 Q4 Q12011
Q2 Q3 Q4 Q12012
Q2 Q3 Q4 Q12013
Q2 Q3 Q4 Q12014
41.7
59.4
31.9
Services Sector52.0
55.0
47.1
-50
-40
-30
-20
-10
0
10
20
30
40
50
60
70
80
Q22001
Q3Q4 Q12002
Q2Q3Q4 Q12003
Q2Q3Q4 Q12004
Q2Q3Q4 Q12005
Q2Q3Q4 Q12006
Q2Q3Q4 Q12007
Q2Q3Q4 Q12008
Q2Q3Q4 Q12009
Q2Q3Q4 Q12010
Q2Q3Q4 Q12011
Q2Q3Q4Q1 Q22012
Q3Q4 Q12013
Q2Q3Q4Q1
Wholesale and Retail
Trade Sector
Business
outlook
across
sectors
weakens
in Q1 2014
but
generally
improves in
Q2 2014.
Across sectors, business sentiment weakened but remained positive in Q1 2014 compared to
the previous quarter’s survey as the number of optimists declined relative to the pessimists
during the quarter. For the next quarter (Q2 2014), however, firms in the industry, wholesale
and retail trade and services sectors were more optimistic while those in the construction
sector were less upbeat.
Looking at the specific sub-sectors, firms in the industry sector, namely, manufacturing, and
electricity, gas and water, and firms in the services sector, such as financial intermediation,
hotels and restaurants, real estate, and transportation, had less favorable outlook in Q1 2014
compared to a quarter ago. Firms in the electricity, gas and water sub-sector cited the peso
depreciation (that increases the price of imported inputs for power generation) and annual
scheduled maintenance that would affect normal plant operations, as reasons for their less
favorable outlook. Meanwhile, firms in the manufacturing sub-sector attributed their less
optimistic views to lower demand and increase in prices of raw materials. Respondents’ views
from the services sector were weighed down by the usual slowdown in business activity after
the Christmas season and expectations of the potential adverse effects of Typhoon Yolanda
on their businesses.

Business Expectations Survey First Quarter 2014
A quarterly survey conducted by the Department of Economic Statistics
Bangko Sentral ng Pilipinas Manila, Philippines
www.bsp.gov.ph
Page 4 of 7
In contrast, there were specific sub-sectors that had more favorable business sentiment for
the current quarter. These include firms in the industry sector, such as mining and quarrying
and agriculture, fishery and forestry, and firms in the services sector, such as other business
activities (e.g., BPOs and manpower providers, customer/technical support) and community
and social services (e.g., health care, schools, entertainment and amusement). Respondents in
the mining and quarrying sub-sector said that their more optimistic sentiment was due to the
higher price fetched by nickel in the world market as a result of the Indonesian government’s
ban on the exportation of nickel. Meanwhile, those in agriculture, fishery and forestry,
business and community and social services said that the improving and stable economy as
well as good governance boosted their business confidence in the current quarter.
For the next quarter (Q2 2014), business confidence turned broadly buoyant across sectors.
This is with the exception of firms in the construction sector which had a less optimistic
outlook compared to that of a quarter ago.
All sub-sectors had more favorable business sentiment for the next quarter, except those in
financial intermediation, and hotels and restaurants services. The reading for the next
quarter’s business outlook was highest for agriculture, fishery and forestry at 57.8 percent
since Q4 2010 and for community and social services at 52.7 percent since Q2 2011. Firms in
the agriculture, fishery and forestry sub-sector attributed their positive outlook in Q1 2014 to
the recovery and rehabilitation efforts from the recent Typhoon Yolanda and good prospects
at the beginning of the fishing season. Meanwhile, firms in the community and social services
sub-sector cited expectations of more business opportunities arising from the increase in the
number of school enrollees and the reconstruction/renovation of school facilities as reasons
for their optimistic outlook for the next quarter.
Business Confidence on Own Operations6
Current Quarter Business Confidence Index by Sector
Q2 2001 – Q1 2014
Industry Sector
14.814.516.8
Construction Sector
33.7
33.9
38.5
-60
-50
-40
-30
-20
-10
0
10
20
30
40
50
60
Q22001
Q3Q4Q12002
Q2Q3Q4Q12003
Q2Q3Q4Q12004
Q2Q3Q4Q12005
Q2Q3Q4Q12006
Q2Q3Q4Q12007
Q2Q3Q4Q12008
Q2Q3Q4Q12009
Q2Q3Q4Q12010
Q2Q3Q4Q12011
Q2Q3Q4Q12012
Q2Q3Q4Q12013
Q2Q3Q4Q12014
6 Business outlook on own operations is computed as the combination of indices for the current quarter (i.e., total order
book, volume of stocks, business conditions) and the next quarter (i.e., volume of business activity, number of employees,
business conditions).

Business Expectations Survey First Quarter 2014
A quarterly survey conducted by the Department of Economic Statistics
Bangko Sentral ng Pilipinas Manila, Philippines
www.bsp.gov.ph
Page 5 of 7
Wholesale and Retail
Trade Sector
21.5
11.5
13.5
Services Sector
38.1
39.8
39.2
-30
-20
-10
0
10
20
30
40
50
60
Q22001
Q3Q4Q12002
Q2Q3Q4Q12003
Q2Q3Q4Q12004
Q2Q3Q4Q12005
Q2Q3Q4Q12006
Q2Q3Q4Q12007
Q2Q3Q4Q12008
Q2Q3Q4Q12009
Q2Q3Q4Q12010
Q2Q3Q4Q12011
Q2Q3Q4Q1Q22012
Q3Q4Q12013
Q2Q3Q4Q1
Firms are
upbeat
about their
own
operations.
Despite the less favorable overall outlook on the macroeconomy, the outlook of firms across
sectors on their business operations was generally upbeat in Q1 2014. Notably, the outlook of
firms engaged in the agriculture, fishery and forestry and electricity, gas and water
sub-sectors was the most robust among those in the industry sector, while the stronger
sentiment in services was driven by the financial intermediation, business activities and
transportation sub-sectors.
Average
capacity
utilization
remains
steady.
The average capacity utilization for the current quarter was unchanged from a quarter ago at
75.2 percent, indicating sustained volume of business activity in the current quarter.
Access to Credit and Financial Conditions7
Firms expect
easy access
to credit
and tighter
financial
conditions.
Firms were of the view that their liquidity requirements could be met through available credit
as more respondents continued to report easy access to credit compared to those that said
otherwise, but the number that said so declined compared to that a quarter ago.
Meanwhile, except for those in the construction sector, more firms reported a deterioration
in their financial conditions during the current quarter. The financial condition outlook
weakened most in the business activities, agriculture, fishery and forestry, mining and
quarrying, and manufacturing sub-sectors. Respondents indicated that their financial
conditions were affected by high operating costs and the reconstruction expenses in the
aftermath of Typhoon Yolanda.
Volume of Business Activity
Business
activity
declines in
Q1 2014 but
improves in
Q2 2014.
The outlook on volume of business activity was less upbeat in the current quarter but turned
more optimistic for the next quarter, consistent with the trend in the overall business outlook.
7 Financial conditions refer to the firm’s general cash position, taking into account the level of cash and other cash items and
repayments terms on loans. On the other hand, access to credit refers to the environment external to the firm, such as the
availability of credit from the banking system and other financial institutions.

Business Expectations Survey First Quarter 2014
A quarterly survey conducted by the Department of Economic Statistics
Bangko Sentral ng Pilipinas Manila, Philippines
www.bsp.gov.ph
Page 6 of 7
Employment and Expansion Plans
Employment
outlook is
mixed.
The employment outlook index for the next quarter remained steady at 23.3 percent from
23.6 percent last quarter, indicating sustained favorable economic conditions. By sector, the
employment outlook of firms in the services and construction sectors improved, those in
industry remained steady while that of wholesale and retail trade sector declined.
The number
of firms with
expansion
plans
increases.
Another indicator providing support to expectations of sustained growth in the current
quarter is the percentage of businesses with expansion plans in the industry sector. This
increased in Q2 2014 to 32.9 percent from 30.5 percent in the previous quarter. Across
sub-sectors, firms in mining and quarrying recorded the strongest expansion plans, followed
by those in the electricity, gas and water, agriculture, fishery and forestry and manufacturing
sub-sectors.
Business Constraints
Domestic
competition
and weak
demand are
the major
risks to
business.
The major business constraints identified by respondents in Q1 2014 were domestic
competition (cited by 57.9 percent of the total number of respondents) and insufficient
demand (leading to low sales volume, cited by 31.6 percent of the total number of
respondents).
However, the percentage of businesses that identified the above-mentioned constraints
continued to show a broadly declining trend. The easing of these business constraints could
indicate that business conditions were improving.
Expectations on Key Economic Indicators8
Inflation is
expected to
settle at
around
3.4 percent
in Q1 2014
and
3.5 percent
in
Q2 2014.
Expectations
on the
exchange
rate are
mixed while
interest
rates are
expected to
increase.
More respondents expected inflation to go up compared to those that held the opposite view
in the current and next quarters. Businesses expected the inflation rate to settle at
3.4 percent in Q1 2014 and 3.5 percent in Q2 2014 (higher than 2.9 percent and 3.0 percent,
respectively, in the previous quarter’s survey results). This is consistent with inflation
expectations based on forecast surveys of private sector economists by the BSP and by
Consensus Economics, indicating that inflation expectations will continue to track the inflation
target range in 2014-2015. Stronger inflationary pressures were expected to emanate from
higher-than-expected increases in utility rates and the volatility in the exchange rate.
Meanwhile, more respondents expected the peso to appreciate in Q1 and Q2 2014. Their
views were driven by the expected steady growth of overseas Filipinos’ remittances, BPO
services receipts and foreign investments amid continued favorable macroeconomic
fundamentals and as global uncertainty subsides. However, the outlook for a stronger peso
was shared by fewer respondents in Q1 2014 compared to the last quarter’s survey (i.e., the
peso dollar exchange rate index declined to 3.9 percent in the current quarter from
12.3 percent in the previous quarter). The perception of those that said otherwise could have
been influenced in part by the recent weakening of the peso against the dollar (average peso
per dollar rate during the week 3-20 February 2014 was P45). Interest rates were also
expected to increase in the current and next quarters as respondents that expected higher
interest rates continued to outnumber those that said otherwise.
8 The expectations on key economic indicators are expressed in terms of confidence indices (CIs), which are computed as the
percentage of firms that answered “up” less the percentage of firms that answered “down” with respect to their views on a
given key economic indicator. A positive CI indicates a favorable view, except for the inflation rate and the peso-borrowing
rate, where a positive CI indicates the opposite.

Business Expectations Survey First Quarter 2014
A quarterly survey conducted by the Department of Economic Statistics
Bangko Sentral ng Pilipinas Manila, Philippines
www.bsp.gov.ph
Page 7 of 7
About the Survey
Survey
response
rate is
83.1
percent.
The Q1 2014 BES was conducted during the period 9 January – 20 February 2014. There were
1,525 firms surveyed nationwide. Respondents were drawn from the combined list of the
Securities and Exchange Commission’s Top 7,000 Corporations in 2010 and Business World’s
Top 1000 Corporations in 2012, consisting of 607 companies in NCR and 918 firms in AONCR,
covering all 17 regions nationwide. The survey response rate for this quarter was similar to
the previous quarter’s 83.1 percent. Likewise, the response rates were both steady for NCR at
80.2 percent (from 80.4 percent in the previous quarter) and for AONCR at 85 percent (from
84.8 percent in Q4 2013).
A breakdown of responses by type of business showed that 17.2 percent were importers,
6.6 percent were exporters, and 19.1 percent were both importers and exporters. About
57.1 percent of the respondents were neither importers nor exporters, or did not specify their
firm type.
The BES uses the stratified random sampling design covering corporations from the combined
list of SEC’s Top 7,000 Corporations and Business World’s Top 1000 Corporations (ranked
based on gross revenues) as sampling units. The combined top corporations were subdivided
into 192 strata classified by regionNCR and Areas Outside NCR (the other 15 regions of the
country)9and by industry sub-groups, namely: (a) Group 1: Industry, which consists of
manufacturing, mining and quarrying, electricity, gas and water, and agriculture, fishery and
forestry; (b) Group II: Construction; (c) Group III: Services, which consists of financial
intermediation, real estate, renting and business activities, hotels and restaurants, transport,
storage and communications and community, social and personal services; and (d) Group IV:
Wholesale and Retail Trade. Beginning Q1 2012, industry classification of companies shifted
from the 1994 Philippine Standard Industrial Classification (PSIC) to the 2000 PSIC.
9 In the sampling design, Regions 4A and 4B were combined into one region.

Annexes: Business Expectations Survey (BES) Report Q1 2014
Population
SECTOR/SUB-SECTOR Region 1 Region 2 Region 3 Region 4 Region 5 Region 6 Region 7 Region 8 Region 9 Region 10 Region 11 Region 12 CARAGA ARMM CAR NCR
Agriculture 0 0 5 8 1 6 4 0 5 5 36 10 1 0 0 36
Business 1 2 21 35 1 1 22 0 1 0 8 3 0 0 0 504
Community 6 1 14 27 0 9 8 0 1 2 5 1 0 1 0 153
Construction 0 1 24 32 8 4 24 3 2 0 4 1 1 0 0 216
EGW 4 1 18 11 0 3 17 0 0 0 3 0 0 0 1 51
Finance 0 3 7 11 1 4 17 0 1 1 16 2 2 0 0 391
Hotels 6 0 11 8 3 7 14 1 0 0 8 0 0 0 0 135
Manufacturing 4 4 167 589 7 10 109 10 4 8 40 9 0 3 3 914
Mining 0 0 0 4 0 0 3 0 0 0 2 0 1 0 0 45
Real Estate 0 0 11 39 1 3 15 0 1 1 7 2 0 0 0 241
Trade 19 15 207 266 43 62 138 15 22 13 97 20 0 1 0 1591
Transportation 1 0 22 29 1 2 15 0 3 0 16 2 0 0 0 264
Services Sector 14 6 86 149 7 26 91 1 7 4 60 10 2 1 0 1688
Industry Sector 8 5 190 612 8 19 133 10 9 13 81 19 2 3 4 1046
Grand Total 41 27 507 1059 66 111 386 29 40 30 242 50 5 5 4 4541
Number of Samples
SECTOR/SUB-SECTOR Region 1 Region 2 Region 3 Region 4 Region 5 Region 6 Region 7 Region 8 Region 9 Region 10 Region 11 Region 12 CARAGA ARMM CAR NCR
Agriculture 3 5 1 5 3 5 3 15 9 1 9
Business 1 2 4 5 1 1 8 1 4 1 1 53
Community 6 1 5 5 8 4 1 2 2 1 1 31
Construction 1 7 6 8 4 7 3 1 2 1 1 69
EGW 4 1 3 4 3 3 1 1 22
Finance 2 2 2 1 4 5 1 1 5 2 2 66
Hotels 5 4 2 3 7 5 1 3 28
Manufacturing 4 4 36 104 7 6 46 9 2 2 18 4 5 3 75
Mining 0 0 2 2 1 0 18
Real Estate 1 4 1 3 7 1 2 1 1 57
Trade 18 14 7 45 36 56 48 15 21 11 28 2 1 130
Transportation 1 59 6 1 2 8 3 7 20 49
Services Sector 13 5 75 24 7 25 37 1 7 3 23 25 2 3 283
Industry Sector 8 5 42 115 8 14 54 9 7 5 35 13 1 5 4 124
GRAND TOTAL 39 25 131 190 59 99 146 28 36 19 88 41 4 9 4 607
Annex A. Distribution of Combined List of 2010 SEC's Top 7000 Corporations and 2012 Business World's Top 1000 Corporations by Region

Annexes: Business Expectations Survey (BES) Report Q1 2014
Annex B. Regions and Provinces of the Philippines
Regions Provinces
I-Ilocos Ilocos Norte, Ilocos Sur, La Union and Pangasinan
II-Cagayan Valley Batanes, Cagayan, Isabela, Nueva Vizcaya and Quirino
III-Central Luzon Aurora, Bataan, Bulacan, Nueva Ecija, Pampanga, Tarlac and Zambales
IV-Southern Tagalog Cavite, Laguna, Batangas, Marinduque, Occidental Mindoro, Oriental , Mindoro, Palawan, Quezon, Rizal and Romblon
V-Bicol Albay, Camarines Norte, Camarines Sur, Catanduanes, Masbate and Sorsogon
VI-Western Visayas Aklan, Antique, Capiz, Guimaras, Iloilo and Negros Occidental
VII-Central Visayas Cebu, Bohol, Negros Oriental and Siquijor
VIII-Eastern Visayas Biliran, Eastern Samar, Leyte, Northern Samar, Samar and Southern Leyte
IX-Zamboanga Peninsula Zamboanga del Norte, Zamboanga del Sur, Zamboanga Sibugay, Isabela City and Zamboanga City
X-Northern Mindanao Bukidnon, Camiguin, Lanao del Norte, Misamis Occidental and Misamis Oriental
XI-Davao Compostela Valley, Davao del Norte, Davao del Sur and Davao Oriental
XII-SOCCSKARGEN Cotabato, Sultan Kudarat, South Cotabato and Sarangani
Cordillera Administrative Region (CAR) Abra, Apayao, Benguet, Ifugao, Kalinga and Mountain Province
Autonomous Region of Muslim Mindanao ( ARMM)
Basilan (excluding Isabela City), Lanao del Sur, Maguindanao, Sulu and Tawi-Tawi
Caraga Agusan del Norte, Agusan Del Sur, Dinagat Islands, Surigao del Norte and Surigao del Sur
National Capital Region (NCR)1 Caloocan, Las Piñas, Makati, Malabon, Mandaluyong, Manila, Marikina, Muntinlupa, Navotas, Parañaque,
Pasay, Pasig, Pateros, Quezon City, San Juan, Taguig and Valenzuela
1 NCR is composed of 16 highly-urbanized cities and one municipality (Pateros).

BUSINESS EXPECTATIONS SURVEY *
2001 - 2014
2014
Q1 Q2 Q3 Q4 Q1 Q2 Q3 Q4 Q1 Q2 Q3 Q4 Q1 Q2 Q3 Q4 Q1 Q2 Q3 Q4 Q1 Q2 Q3 Q4 Q1 Q2 Q3 Q4 Q1
Confidence Index: All Sectors
Current Quarter 44.9 46.4 40.9 48.0 29.9 12.6 -12.9 -6.8 -23.9 -2.6 18.4 22.0 39.1 43.9 45.0 50.6 47.5 31.8 34.1 38.7 40.5 44.5 42.5 49.5 41.5 54.9 42.8 52.3 37.8
NCR 53.0 53.1 44.9 55.1 34.0 11.4 -16.1 -9.6 -25.4 -3.6 20.3 24.2 42.4 50.1 51.6 55.7 54.4 35.2 38.4 38.5 46.1 49.3 48.9 54.5 45.6 60.6 49.9 58.7 40.6
AONCR 30.6 34.6 34.0 35.6 21.4 15.2 -6.2 -1.0 -21.1 -0.9 15.0 18.0 33.8 34.0 34.2 42.4 35.7 26.1 26.6 39.1 31.1 36.4 31.9 41.1 34.5 45.1 30.7 41.5 33.0
Next Quarter 49.4 44.7 53.0 40.9 41.0 16.6 16.6 -0.5 -6.5 13.7 33.7 34.0 52.6 46.3 59.2 51.0 59.4 33.0 53.9 36.1 55.4 44.6 59.6 43.8 56.4 46.2 60.0 40.7 50.8
NCR 53.3 48.2 57.1 44.6 42.2 12.4 17.6 -4.7 -9.6 14.7 35.0 37.3 57.2 51.4 63.1 54.9 62.3 35.6 55.0 37.5 59.0 48.1 64.5 47.7 60.9 47.8 68.3 42.3 52.7
AONCR 42.2 37.2 44.8 33.7 37.6 24.7 14.8 8.1 -0.7 11.9 30.9 27.7 44.6 37.2 52.0 44.4 53.6 28.1 51.4 32.9 48.1 37.9 50.3 36.6 48.8 43.4 45.8 38.1 47.3
Industry Sector 30.0 45.7 35.6 39.2 17.7 9.1 -11.9 -5.8 -30.1 -7.6 18.8 14.7 36.4 40.1 49.6 44.9 48.1 31.9 31.1 39.6 37.8 46.2 39.2 35.8 29.4 47.1 43.0 41.7 34.3
Construction Sector 50.0 35.9 53.1 52.5 42.4 25.5 -10.5 6.6 2.2 3.0 37.3 6.1 48.0 46.9 41.9 41.0 55.8 41.9 39.7 49.7 47.9 56.9 49.4 50.4 50.5 60.2 41.9 49.6 46.1
Wholesale and Retail Trade 40.6 36.5 35.1 46.5 28.3 5.4 -23.2 -9.8 -22.8 -3.1 12.8 19.5 34.4 40.9 37.4 45.3 44.6 23.9 30.4 37.8 38.4 36.9 38.3 51.9 41.7 54.1 36.4 59.4 31.9
Serv ices Sector 68.5 61.6 53.3 60.3 42.1 22.4 -2.8 -6.3 -23.2 1.0 20.2 31.9 45.5 50.3 50.3 63.4 48.9 39.3 40.2 37.3 44.7 49.9 49.7 60.3 52.0 62.7 50.3 55.0 47.1
of which:
Financial Intermediation 90.8 74.3 61.3 71.0 60.5 -6.5 -28.9 -46.6 -44.1 -6.2 29.7 47.7 68.2 72.2 77.1 83.6 74.5 45.0 51.7 32.0 58.8 56.7 77.3 75.5 81.3 89.4 61.0 76.7 47.4
Hotels and Restaurants 86.4 39.7 59.7 92.2 50.1 29.9 9.8 40.2 -18.5 14.1 23.0 49.9 35.6 45.7 41.7 62.3 57.2 37.9 33.3 66.4 47.7 45.8 0.0 64.2 41.8 58.9 37.4 79.6 51.6
Business Activities 60.8 53.8 54.1 59.3 22.8 28.3 2.2 -10.2 -39.3 -9.0 11.9 16.3 47.5 49.2 47.7 72.8 41.0 42.8 40.3 33.8 35.6 55.0 49.9 51.9 43.7 64.7 43.0 44.8 50.2
Real Estate 59.0 76.2 54.8 69.4 46.5 36.1 6.7 5.3 -14.2 -18.1 -4.7 10.3 43.6 44.7 51.9 53.1 44.9 36.2 36.1 38.3 54.0 45.0 49.1 68.5 64.4 68.6 60.4 56.3 52.1
Community and Social Services 44.9 37.4 54.3 30.7 48.1 16.3 0.2 -21.3 9.8 7.0 27.7 31.4 40.9 44.6 40.7 46.5 41.1 34.7 45.3 21.6 35.5 43.4 56.0 42.5 36.4 46.5 49.3 34.3 42.8
Transportation 67.0 69.6 38.1 46.7 42.5 30.1 -1.6 14.7 -13.8 16.0 30.5 41.2 27.4 39.4 34.8 46.5 35.9 32.9 29.4 43.2 38.5 43.7 38.8 58.1 34.4 33.2 47.6 43.8 37.0
Industry Sector 46.5 39.3 41.4 32.3 32.5 16.8 6.6 -1.3 -10.4 10.4 27.1 26.3 50.5 44.8 55.5 51.3 57.9 34.9 47.9 26.1 52.8 41.0 49.2 34.4 53.8 39.7 48.2 31.7 47.5
Construction Sector 39.9 59.0 63.8 54.0 54.3 30.6 29.5 9.1 2.8 20.0 27.7 43.0 47.9 44.4 51.3 54.1 65.2 38.7 55.2 48.3 55.1 55.6 52.9 48.2 43.9 56.2 58.5 56.3 52.4
Wholesale and Retail Trade 43.6 35.7 51.6 36.1 35.2 8.4 16.4 -5.1 -10.0 10.3 32.4 32.3 50.9 41.8 57.3 44.3 58.4 24.1 54.0 42.2 56.0 44.0 66.6 44.3 57.1 40.2 66.9 41.5 47.9
Serv ices Sector 62.1 60.7 68.1 55.8 54.2 23.6 25.2 3.9 -1.8 18.2 41.0 40.3 57.3 53.0 65.9 58.2 60.8 40.6 59.2 36.3 57.2 47.3 62.7 51.8 60.1 58.1 63.7 46.3 57.1
of which:
Financial Intermediation 75.4 73.0 79.5 73.3 57.0 14.4 7.9 -22.1 -22.0 19.6 52.8 70.9 71.8 74.9 88.3 76.8 72.8 46.5 68.8 45.3 57.8 61.8 73.2 66.8 75.2 83.8 73.2 58.7 53.9
Hotels and Restaurants 56.8 28.5 81.2 28.2 64.0 1.9 73.6 20.6 12.5 17.9 51.3 62.6 56.8 41.7 72.0 62.3 62.9 24.8 77.1 29.3 53.1 31.9 72.3 49.5 52.6 54.8 74.1 59.9 47.7
Business Activities 68.6 67.7 64.9 63.8 49.4 31.7 25.0 4.0 -11.4 6.0 30.6 36.6 66.7 57.6 66.9 52.7 63.1 39.1 53.7 29.0 64.9 43.5 55.4 39.9 47.9 55.9 60.6 38.8 59.7
Real Estate 55.1 73.8 71.6 67.4 49.2 31.7 15.8 11.8 -11.3 8.9 8.7 33.9 43.6 50.0 50.5 56.3 49.3 47.7 55.7 43.7 65.9 51.8 73.4 66.6 71.0 52.3 68.7 51.2 64.2
Community and Social Services 52.0 42.9 54.3 32.3 58.4 27.4 10.1 2.8 3.3 19.9 21.1 21.2 50.6 45.2 53.6 45.0 58.1 42.9 41.3 23.5 43.3 49.6 41.5 44.0 51.0 45.7 38.3 31.4 52.7
Transportation 52.4 52.2 58.8 42.6 55.1 22.0 32.7 14.7 15.0 31.0 60.1 29.8 42.5 35.1 58.8 55.2 53.5 37.0 64.1 44.5 46.7 38.6 60.9 46.1 62.3 45.4 63.4 41.6 58.6
Industry Sector 17.4 16.8 15.9 13.5 10.8 2.5 -4.4 -9.3 -18.3 -6.1 4.9 10.3 18.7 18.8 20.9 14.7 20.1 16.7 17.6 14.9 20.3 17.0 16.5 13.8 14.8 17.6 16.6 14.5 16.8
Construction Sector 11.9 34.3 43.8 33.8 25.6 19.5 18.4 12.0 -2.6 -7.4 23.4 10.9 27.6 23.5 28.2 26.8 36.9 31.0 27.8 34.6 37.6 36.0 28.3 29.7 33.7 40.9 35.6 33.9 38.5
Wholesale and Retail Trade 13.9 3.9 16.8 7.2 12.2 -1.6 -4.1 -8.1 -9.0 -1.9 13.7 3.9 17.2 13.5 20.1 16.5 18.6 3.0 19.6 11.5 18.7 10.7 21.2 16.7 21.5 15.3 19.3 11.5 13.5
Serv ices Sector 42.2 43.8 43.5 45.1 35.0 22.0 18.8 3.9 -8.0 3.7 21.8 24.0 36.8 38.2 44.6 45.3 38.3 32.1 36.2 29.7 38.9 39.9 47.0 42.0 38.1 43.9 44.9 39.8 39.2
Financial Intermediation 53.3 56.3 53.5 59.9 46.4 40.3 8.9 -14.1 -6.0 14.3 31.5 48.9 59.4 59.7 63.6 65.2 55.1 48.1 56.4 40.8 53.4 48.3 67.2 57.6 61.0 66.1 57.0 57.7 47.4
Hotels and Restaurants 34.8 40.5 35.1 52.9 38.9 23.1 46.6 32.7 -0.2 19.9 33.8 37.0 29.2 25.0 43.9 39.4 37.8 18.4 41.0 35.4 36.3 25.9 42.6 50.1 26.8 31.8 45.1 47.3 35.8
Business Activities 47.1 48.3 54.7 46.0 31.2 15.5 16.7 0.5 -26.0 -5.4 18.2 18.8 34.0 43.5 49.0 49.8 39.8 36.6 33.8 35.6 39.5 47.8 47.5 32.1 31.9 42.3 46.5 35.2 40.1
Real Estate 28.2 49.7 49.7 41.2 29.9 34.8 22.1 3.3 -4.0 -3.3 12.4 17.2 32.1 31.6 39.9 40.3 29.1 30.3 31.5 30.6 35.1 37.7 44.6 44.9 40.7 47.3 51.0 43.0 31.0
Community and Social Services 36.4 34.2 31.8 35.7 31.5 14.1 11.1 -1.6 -6.8 -12.1 17.5 4.1 30.4 26.0 29.5 31.4 20.1 25.2 17.3 11.9 23.0 32.0 26.3 34.2 29.9 43.0 27.8 22.9 34.0
Transportation 41.4 25.9 23.8 32.3 33.2 19.5 17.6 15.1 1.6 8.6 21.7 20.6 29.4 27.3 31.0 32.8 36.7 18.8 29.4 14.2 35.1 31.2 39.8 37.6 29.6 23.0 32.8 29.0 39.9
Volume of Business Activ ity Index 22.6 35.7 27.3 39.3 15.8 16.2 -1.5 -0.3 -26.3 1.7 15.9 22.0 24.6 35.6 34.9 42.8 23.8 24.1 29.5 37.1 22.5 36.7 38.9 40.8 25.1 43.5 38.7 43.8 22.7
Volume of Total Order Book Index 17.1 27.7 22.9 31.2 8.0 13.7 -3.1 -1.4 -27.3 -1.2 14.5 16.8 19.5 30.5 30.2 37.7 19.3 21.5 25.8 33.1 17.6 31.4 31.0 33.9 20.0 37.2 32.8 38.0 20.0
Credit Access Index 10.1 9.0 10.4 7.3 6.6 3.0 -1.6 -7.4 -12.8 -7.2 -0.8 0.1 5.4 9.2 10.1 10.0 11.3 6.1 10.3 8.9 9.6 13.4 14.8 16.9 16.0 18.1 15.8 16.8 15.0
Financial Condition -8.8 -11.0 -5.1 -7.8 -11.6 -17.8 -29.1 -29.9 -32.9 -26.8 -17.4 -15.5 -7.9 -5.0 -2.6 -1.1 -3.6 -10.8 -6.9 -6.8 -2.9 -0.9 -1.9 2.4 -1.5 1.3 -1.9 -0.5 -2.1
Av erage Capacity Utilization (in percent) 73.7 75.5 76.1 75.4 76.2 76.5 74.8 72.8 71.5 69.2 68.8 69.8 72.0 74.1 74.7 74.1 75.3 75.1 76.1 74.5 74.8 76.2 74.4 74.1 73.0 74.0 74.9 75.2 75.2
Volume of Business Activ ity Index 48.1 40.4 49.5 34.0 44.1 25.3 24.8 1.6 2.1 14.2 36.2 27.9 54.3 46.6 59.2 45.8 53.5 33.6 51.6 32.5 54.7 46.1 56.3 39.7 51.1 45.2 55.7 36.8 51.1
Employment Outlook Index 16.6 17.3 21.1 16.6 21.7 11.4 8.3 -1.4 -8.2 -6.4 9.4 8.7 22.0 19.9 24.0 21.1 23.0 14.5 23.2 16.8 24.0 22.1 27.4 22.0 23.0 24.1 31.7 23.6 23.3
20132008 20112007 2009 2010 2012
1. Ov erall Business Outlook on the Macroeconomy
2. Business Outlook Index on the Macroeconomy by Sector: Current Quarter
3. Business Outlook Index on the Macroeconomy by Sector: Next Quarter
4. Business Confidence Index on Own Operations by Sector
5. Business Outlook index on Own Operations: Current Quarter
6. Business Outlook Index on Own Operations: Next Quarter
1

BUSINESS EXPECTATIONS SURVEY
2001 - 2014
###
Q1 Q2 Q3 Q4 Q1 Q2 Q3 Q4 Q1 Q2 Q3 Q4 Q1 Q2 Q3 Q4 Q1 Q2 Q3 Q4 Q1 Q2 Q3 Q4 Q1 Q2 Q3 Q4 Q1
All Industry Sector 27.2 31.1 28.7 33.7 37.8 23.1 25.0 30.4 17.8 16.0 17.4 23.7 19.9 25.0 27.0 25.7 33.9 24.7 26.6 27.0 28.8 29.1 27.8 28.9 29.6 28.7 32.1 30.5 32.9
Mining Quarrying 66.7 42.9 42.9 52.4 41.9 26.2 45.1 27.0 31.6 9.2 13.0 38.5 33.2 36.7 45.0 34.7 47.3 41.8 62.6 41.1 47.3 35.2 49.7 41.0 40.0 45.0 42.3 55.0 50.9
Manufacturing 23.7 28.1 27.1 32.0 37.8 22.3 23.7 29.5 15.7 14.6 15.3 20.3 18.8 24.1 25.4 24.7 32.5 24.2 24.9 24.9 27.9 28.6 27.2 28.0 28.4 27.5 31.2 29.2 31.5
Electricity, Gas and Water 48.5 54.0 42.8 33.5 39.0 45.4 37.0 59.2 34.6 30.5 36.6 44.3 10.5 16.7 28.2 20.4 38.5 23.8 34.4 41.0 32.2 31.3 26.2 38.2 42.3 40.2 35.3 38.7 48.6
Agriculture, Fishery and Forestry 62.2 64.0 42.4 59.6 35.0 21.3 30.6 28.0 32.5 30.0 37.4 54.6 37.4 39.7 43.4 41.6 45.3 24.3 31.7 41.9 31.5 31.7 30.1 29.7 33.3 30.1 40.3 33.9 33.3
High Interest Rate 23.0 23.6 23.7 21.3 22.1 23.7 29.8 29.5 26.9 24.1 24.4 20.5 21.2 20.5 20.9 17.4 19.8 19.9 20.1 19.8 14.6 13.8 10.8 9.9 8.7 8.1 7.4 7.3 9.1
Unclear Economic Laws 27.6 27.2 24.5 27.1 25.9 27.1 27.1 25.7 25.1 23.3 21.7 14.2 13.0 13.0 20.9 18.7 21.2 21.6 21.9 24.2 18.5 17.8 18.1 15.8 13.4 14.1 13.8 11.6 12.0
Lack of Equipment 17.1 17.9 16.0 19.4 16.3 16.0 15.6 17.7 16.6 15.5 17.3 15.5 16.4 17.5 17.9 15.1 16.1 16.0 17.3 16.7 10.9 10.2 9.9 7.7 11.1 7.0 7.7 6.8 7.1
Insufficient Demand 51.6 49.8 46.8 46.3 44.1 46.7 49.6 51.9 54.8 59.0 54.2 53.4 46.1 44.4 43.6 39.2 42.2 44.0 43.7 44.4 36.5 36.5 36.5 34.5 32.0 33.5 35.7 34.9 31.6
Access to Credit 19.1 19.6 18.9 20.1 16.9 17.0 17.5 20.5 20.9 19.3 19.3 19.2 18.5 16.6 17.7 16.7 17.8 18.4 18.6 18.6 11.7 10.5 9.4 8.2 9.4 8.5 6.8 6.2 6.7
Financial Problems 27.2 26.0 24.7 23.6 26.4 23.4 25.3 27.9 30.1 29.9 26.4 26.8 28.1 25.8 27.3 22.9 22.6 24.4 21.7 22.9 16.9 15.9 13.2 11.6 16.1 12.8 10.9 10.6 10.8
Competition 62.6 66.0 62.2 63.0 57.9 60.4 58.6 61.1 59.4 62.0 61.8 63.4 64.4 64.5 65.8 66.6 68.8 65.5 68.1 66.4 60.6 62.9 60.7 61.3 60.0 59.8 59.6 58.5 57.9
Labor Problems 20.3 18.6 19.7 20.1 19.4 19.3 20.8 20.2 20.6 18.8 19.0 17.6 18.1 19.4 18.9 17.0 19.3 21.6 20.4 18.5 13.4 12.5 11.8 11.0 13.7 11.4 10.7 8.6 9.6
Lack of Materials Input 22.3 20.1 19.0 20.6 19.7 19.4 19.8 19.6 18.5 16.5 18.5 18.1 16.7 18.8 18.9 15.9 18.4 19.1 19.0 18.4 12.4 12.5 11.2 9.4 8.1 8.9 9.4 8.4 6.5
Others 17.4 16.8 17.5 20.7 20.8 20.4 19.9 23.5 20.4 18.6 18.8 24.2 18.6 19.2 18.0 19.0 21.1 23.6 22.2 25.7 23.0 25.3 22.9 22.5 21.0 22.4 22.3 23.4 22.9
None 5.4 6.9 7.9 6.5 7.4 5.8 5.4 4.9 5.7 5.4 6.5 6.7 6.0 5.9 8.2 8.6 6.0 7.9 5.7 7.5 8.0 7.6 9.3 9.1 13.2 11.8 8.2 8.2 10.1
P/$ Exchange Rate 31.1 34.3 35.0 44.8 39.9 0.9 -19.0 -21.5 -12.0 -10.2 -4.2 18.7 6.4 14.6 14.2 35.3 15.0 19.4 29.3 14.9 11.7 19.3 29.8 32.0 35.1 16.9 -2.4 12.3 3.9
Inflation Rate -13.9 -5.1 -2.3 6.3 14.4 47.9 61.5 43.0 14.0 14.1 4.4 28.2 23.3 20.9 9.5 2.4 21.3 38.7 32.1 28.3 16.8 15.4 5.4 3.3 1.1 10.4 22.8 25.0 43.0
Peso Borrowing Rate -23.5 -15.4 -3.2 -9.6 -15.9 13.5 37.8 29.7 6.9 1.9 -2.7 2.6 5.5 3.1 4.4 -5.4 4.0 13.9 11.1 5.7 -2.1 1.1 -4.5 -11.1 -10.8 -14.4 -3.0 -0.9 11.4
Inflation Rate Expectations (in %) 3.3 3.2 2.9 3.4
P/$ Exchange Rate 11.2 21.9 37.9 34.8 29.0 -0.3 -3.4 -19.5 -13.2 -11.6 4.1 4.2 4.7 6.7 24.7 20.8 14.1 16.3 31.5 9.8 12.8 16.0 26.7 17.4 26.5 18.0 14.6 10.9 13.1
Inflation Rate 4.1 5.5 9.5 3.0 17.3 42.3 48.8 25.2 12.2 15.0 15.7 25.1 22.6 18.6 12.3 6.5 23.5 34.8 29.2 18.2 14.1 18.3 11.5 5.2 9.0 15.3 22.5 18.0 32.0
Peso Borrowing Rate -4.9 -2.3 3.2 -3.2 -8.3 15.9 32.3 23.0 7.3 4.6 5.8 12.8 15.5 10.2 8.8 2.3 11.7 16.5 12.8 7.0 1.1 4.8 -0.8 -5.0 -4.6 -4.8 2.4 5.7 16.8
Inflation Rate Expectations (in %) 3.3 3.3 3.0 3.5
Small (<100) 33.9 34.2 33.7 32.9 35.6 36.4 35.9 36.2 41.6 41.6 39.9 39.9 41.2 40.8 40.2 40.8 39.2 40.0 39.3 37.0 36.1 34.2 34.0 34.3 36.3 36.8 34.4 34.2 32.6
Medium (100-<500) 37.1 33.2 35.0 34.6 35.8 34.9 32.7 32.9 33.5 33.3 32.9 34.5 34.7 35.6 34.9 34.2 34.8 35.1 36.4 36.2 35.8 37.4 36.1 38.4 35.6 36.2 38.5 35.7 34.4
Large (500 & up) 17.0 18.0 20.1 19.6 16.1 14.6 16.8 17.7 13.6 13.7 13.9 14.1 13.2 13.6 14.4 14.9 15.1 13.8 13.5 15.0 15.5 16.1 17.4 13.6 16.8 17.4 16.8 18.5 16.9
No Response 12.0 14.7 11.2 13.0 12.5 14.1 14.7 13.1 11.3 11.4 13.3 11.6 11.0 10.0 10.4 10.1 10.8 11.0 10.8 11.8 12.7 12.3 12.5 13.7 11.2 9.6 10.3 11.6 16.1
All Sectors 765 757 732 772 864 891 928 936 1062 1094 1059 1046 1215 1225 1219 1225 1275 1307 1244 1235 1248 1264 1175 1183 1247 1290 1294 1288 1267
Industry 287 279 292 281 327 321 344 327 323 338 321 325 325 341 335 348 376 378 366 359 384 375 338 353 380 400 401 386 377
Mining Quarrying 6 6 6.0 5 7 9 8 8 12 12 11 10 11 16 20 18 17 19 16 17 19 17 16 17 17 20 19 20 20
Manufacturing 250 244 255.0 246 273 267 282 269 260 275 255 266 253 259 242 262 280 273 265 257 280 273 246 253 282 297 297 289 278
Electricity, Gas and Water 14 14 11.0 12 15 16 17 15 19 19 23 22 21 23 28 25 27 30 27 29 37 34 31 34 35 37 36 34 31
Agriculture, Fishery and Forestry 17 15 20.0 18 32 29 37 35 32 32 32 27 40 43 45 43 52 56 58 56 48 51 45 49 46 46 49 43 48
Construction 22 20 20 22 33 40 37 50 53 58 51 53 61 73 65 70 75 88 71 79 74 86 85 84 87 83 84 87 93
Wholesale and Retail Trade 265 262 237 270 279 297 317 323 374 377 377 358 428 416 424 415 428 429 405 388 421 415 387 372 405 408 407 423 413
Services 191 196 183 199 225 233 230 236 312 321 310 310 401 395 395 392 396 412 402 409 369 388 365 374 375 399 402 392 384
Financial Intermediation 48 48 46 50 51 50 52 54 64 62 59 62 69 81 77 81 76 84 85 84 80 81 72 72 72 83 80 80 80
Hotels and Restaurants 17 16 13 15 18 19 21 19 32 32 35 30 50 53 51 54 62 63 59 62 48 47 52 49 54 54 52 48 47
Renting and Business ActivitiesBusiness Activities 45 38 34 41 52 55 54 55 65 69 76 69 83 79 78 76 69 75 69 68 75 78 70 67 71 73 73 70 60
Real Estate and Renting 29 30 29 28 35 37 33 34 43 45 35 42 70 60 62 61 64 62 61 70 51 60 50 61 57 67 70 65 64
Community and Social Services 24 26 24 25 32 32 32 29 34 35 30 32 60 56 64 60 60 62 63 61 54 55 58 58 58 59 60 60 60
Transportation 28 38 37 40 37 40 38 45 74 78 75 75 69 66 63 60 65 66 65 64 61 67 63 67 63 63 67 69 73
A quarterly survey conducted by the Bangko Sentral ng Pilipinas
Department of Economic Statistics Manila, Philippines
www.bsp.gov.ph
* From 2001 to 2003, survey respondents came from a random sample of firms in SEC's Top 5000 Corporations in the Philippines which are located in the NCR. Beginning Q4 2003, the survey was expanded
to include those areas which are located outs ide NCR specifically Regions I, VII & XI. Finally in Q4 2006, the BES was further expanded to become a nationwide survey of firms in the top 5000 corporations.
in affirmative less the percentage of firms that answered in the negative with respect to their v iews on a given indicator.
Note: Unless otherwise stated, all numbers are in diffusion indices, i.e., Confidence Index (CI) is computed as the percentage of firms that answered in affirmative less the percentage of firms that answered
2010
Feb 28, 2014 5:10:02 PM
2007
10. Business Expectations Index on Selected Economic Indicators: Next Quarter
11. Percentage Distribution of Respondent Firms by Employment Size
12. Distribution of Respondent Firms by Sector
2008
7. Companies with Expansion Plans (in percent of total respondents): Next Quarter
8. Business Constraints (in percent to total respondents): Current Quarter
9. Business Expectations Index on Selected Economic Indicators: Current Quarter
20122009 2011 2013
2

Business Expectations Survey
Business Outlook Index on the Macroeconomyby Type of Business
2014Q1 Q2 Q3 Q4 Q1 Q2 Q3 Q4 Q1 Q2 Q3 Q4 Q1 Q2 Q3 Q4 Q1 Q2 Q3 Q4 Q1 Q2 Q3 Q4 Q1 Q2 Q3 Q4 Q1
Importer 39.5 49.4 47.5 45.1 36.8 15.6 -17.4 0.7 -26.1 -6.7 10.9 15.2 43.2 37.4 38.7 53.2 50.3 36.5 39.6 47.8 44.0 47.9 44.4 52.0 39.7 55.2 33.8 50.0 33.9Exporter 24.4 37.5 4.2 24.2 3.5 8.6 -6.8 3.3 -39.8 -6.1 7.2 13.6 33.7 46.6 43.2 24.2 45.3 36.0 26.1 17.1 19.1 37.2 12.7 22.4 26.9 35.2 31.0 31.5 24.1Both (Importer and Exporter) 38.9 50.0 41.5 36.8 9.3 0.7 -5.4 -4.1 -24.7 -8.4 21.8 20.8 37.1 52.4 48.8 40.7 42.5 26.3 32.0 24.8 30.6 39.1 38.5 26.2 30.7 46.7 41.8 45.5 43.0Neither Importer nor Exporter 49.0 45.9 40.4 54.4 35.7 16.4 -20.3 -12.7 -16.2 2.9 23.0 29.3 42.5 40.6 39.7 56.6 40.5 29.7 28.1 33.9 39.3 43.3 40.1 56.3 45.5 54.7 39.6 51.0 39.9
Number of Respondentsby Type of Business
2014Q1 Q2 Q3 Q4 Q1 Q2 Q3 Q4 Q1 Q2 Q3 Q4 Q1 Q2 Q3 Q4 Q1 Q2 Q3 Q4 Q1 Q2 Q3 Q4 Q1 Q2 Q3 Q4 Q1
Importer 81 87 99 111 125 122 109 138 119 119 110 105 162 147 150 156 181 189 169 157 218 211 187 175 189 192 195 312 218Exporter 41 40 48 66 85 81 88 92 83 82 83 81 89 88 88 95 86 86 69 76 68 94 71 76 93 91 84 92 83Both (Importer and Exporter) 90 86 106 117 140 141 147 145 162 178 156 159 175 166 168 177 179 171 175 161 206 202 195 191 215 227 232 233 242Neither Importer nor Exporter 194 209 245 228 328 329 340 316 451 413 387 379 595 584 612 553 592 644 584 552 534 589 596 629 650 570 671 537 546Not Specified 359 335 234 250 186 218 244 245 247 302 323 322 194 240 201 244 237 217 247 289 222 168 126 112 100 210 112 114 178
Total 765 757 732 772 864 891 928 936 1062 1094 1059 1046 1215 1225 1219 1225 1275 1307 1244 1235 1248 1264 1175 1183 1247 1290 1294 1288 1267
Business Outlook Index on the Macroeconomyby Size of Employment
2014Q1 Q2 Q3 Q4 Q1 Q2 Q3 Q4 Q1 Q2 Q3 Q4 Q1 Q2 Q3 Q4 Q1 Q2 Q3 Q4 Q1 Q2 Q3 Q4 Q1 Q2 Q3 Q4 Q1
Small (<100) 41.7 43.2 33.6 43.2 29.2 10.5 -19.2 -5.9 -19.0 -4.8 16.8 16.3 32.8 31.7 34.5 43.4 37.8 27.5 30.4 33.0 32.7 38.4 34.6 46.6 35.8 44.4 33.3 42.5 35.1Medium (100-<500) 41.5 37.8 42.2 45.8 22.0 16.4 -5.6 6.8 -19.9 3.6 19.5 23.8 40.0 45.3 41.8 55.6 44.6 29.2 29.0 38.7 37.1 44.4 41.5 46.9 41.0 52.9 41.0 51.3 35.8Large (500 & up) 42.3 54.4 39.5 53.0 30.9 15.4 -5.1 -20.5 -29.2 2.0 20.4 32.7 50.6 53.3 59.1 61.0 56.0 43.1 40.5 39.5 47.2 53.6 45.4 52.8 49.5 66.5 46.8 55.2 46.0
Number of Respondentsby Size of Employment
2007 2008 2014Q1 Q2 Q3 Q4 Q1 Q2 Q3 Q4 Q1 Q2 Q3 Q4 Q1 Q2 Q3 Q4 Q1 Q2 Q3 Q4 Q1 Q2 Q3 Q4 Q1 Q2 Q3 Q4 Q1
Small (<100) 259 259 247 254 308 324 333 339 442 455 423 417 500 499 490 500 500 523 484 457 450 427 399 406 453 475 445 438 427Medium (100-<500) 284 251 256 267 309 311 303 308 356 364 348 361 420 437 426 419 444 459 451 447 447 455 424 454 444 467 498 462 452Large (500 & up) 130 136 147 151 139 130 156 166 144 150 147 147 160 167 176 182 193 181 168 185 193 196 205 161 210 224 218 241 226Not Specified 92 111 82 100 108 126 136 123 120 125 141 121 135 122 127 124 138 144 141 146 158 186 147 162 140 124 133 147 162
Total 765 757 732 772 864 891 928 936 1062 1094 1059 1046 1215 1225 1219 1225 1275 1307 1244 1235 1248 1264 1175 1183 1247 1290 1294 1288 1,267
Feb-28-2014 5:10 PM
3
Current Quarter2007 2008 2009 2010 2011 2012 2013
2007 2008 2009 2010 2011
Current Quarter2007 2008 2009 2010 2011 2012
2013
2013
20132009 2010 2011 2012
2012

Business Expectations Survey
Business Outlook Index on the Macroeconomyby Type of Business
2007 2008 2009 2010 2011 2012 2013 2014Q1 Q2 Q3 Q4 Q1 Q2 Q3 Q4 Q1 Q2 Q3 Q4 Q1 Q2 Q3 Q4 Q1 Q2 Q3 Q4 Q1 Q2 Q3 Q4 Q1 Q2 Q3 Q4 Q1
Importer 40.7 44.8 59.6 43.2 50.4 9.8 26.6 0.0 -9.2 16.8 43.6 31.4 50.0 46.3 55.3 49.4 62.4 39.2 55.0 42.7 56.0 46.9 62.0 44.0 52.9 39.1 56.4 38.5 53.2Exporter 39.0 37.5 6.3 31.8 22.4 33.3 6.8 8.7 -10.8 6.1 6.0 19.8 57.3 60.2 44.3 31.6 55.8 48.8 34.8 27.6 42.6 44.7 39.4 25.0 44.1 47.3 29.8 38.0 45.8Both (Importer and Exporter) 51.1 44.2 42.5 37.6 19.6 13.7 14.5 10.1 -7.4 9.0 33.3 35.2 50.3 54.8 60.1 49.7 62.0 36.3 50.9 32.9 54.9 45.5 50.3 35.1 54.4 48.9 41.8 37.3 51.2Neither Importer nor Exporter 50.0 41.1 58.4 46.5 49.7 20.4 11.5 -0.6 1.1 14.5 44.4 35.1 52.4 39.7 62.1 53.7 56.1 27.8 58.6 42.6 52.2 39.4 60.4 47.4 54.9 49.6 61.1 43.2 52.2
Number of Respondentsby Type of Business
2007 2008 2009 2010 2011 2012 2013 2014Q1 Q2 Q3 Q4 Q1 Q2 Q3 Q4 Q1 Q2 Q3 Q4 Q1 Q2 Q3 Q4 Q1 Q2 Q3 Q4 Q1 Q2 Q3 Q4 Q1 Q2 Q3 Q4 Q1
Importer 10.6 11.5 13.5 14.4 14.5 13.7 11.7 14.7 11.2 10.9 10.4 10.0 13.3 13.3 12.3 12.7 14.2 14.5 13.6 12.7 17.5 16.7 15.9 14.8 15.2 14.9 15.1 24.2 17.2Exporter 5.4 5.3 6.6 8.5 9.8 9.1 9.5 9.8 7.8 7.5 7.8 7.7 7.3 7.3 7.2 7.8 6.7 6.6 5.5 6.2 5.4 7.4 6.0 6.4 7.5 7.1 6.5 7.1 6.6Both (Importer and Exporter) 11.8 11.4 14.5 15.2 16.2 15.8 15.8 15.5 15.3 16.3 14.7 15.2 14.4 14.4 13.8 14.4 14.0 13.1 14.1 13.0 16.5 16.0 16.6 16.1 17.2 17.6 17.9 18.1 19.1Neither Importer nor Exporter 25.4 27.6 33.5 29.5 38.0 36.9 36.6 33.8 42.5 37.8 36.5 36.2 49.0 49.0 50.2 45.1 46.4 49.3 46.9 44.7 42.8 46.6 50.7 53.2 52.1 44.2 51.9 41.7 43.1Not Specified 46.9 44.3 32.0 32.4 21.5 24.5 26.3 26.2 23.3 27.6 30.5 30.8 16.0 16.0 16.5 19.9 18.6 16.6 19.9 23.4 17.8 13.3 10.7 9.5 8.0 16.3 8.7 8.9 14.0Total 100.0 100.0 100.0 100.0 100.0 100.0 100.0 100.0 100.0 100.0 100.0 100.0 100.0 100.0 100.0 100.0 100.0 100.0 100.0 100.0 100.0 100.0 100.0 100.0 100.0 100.0 100.0 100.0 100.0
Business Outlook Index on the Macroeconomyby Size of Employment
2007 2008 2009 2010 2011 2012 2013 2014Q1 Q2 Q3 Q4 Q1 Q2 Q3 Q4 Q1 Q2 Q3 Q4 Q1 Q2 Q3 Q4 Q1 Q2 Q3 Q4 Q1 Q2 Q3 Q4 Q1 Q2 Q3 Q4 Q1
Small (<100) 51.7 43.2 53.8 43.2 39.9 17.3 14.1 -2.1 1.6 19.1 34.3 30.5 46.4 40.5 55.3 50.4 53.0 29.8 53.3 39.4 46.9 39.3 56.1 42.9 45.0 42.5 54.2 41.1 45.4Medium (100-<500) 44.4 43.8 48.8 40.7 39.2 24.1 15.2 8.8 -7.9 14.3 37.9 32.4 51.4 44.6 57.0 53.2 58.8 31.4 56.5 40.5 53.7 41.8 55.2 41.6 56.5 46.5 54.4 37.7 54.9Large (500 & up) 50.0 43.4 55.1 44.4 46.0 29.2 18.6 -3.0 -4.2 5.3 32.7 40.8 57.5 56.3 69.9 50.0 69.4 41.4 56.5 38.4 59.1 53.6 62.4 49.7 66.7 57.1 55.0 51.0 51.8
Number of Respondentsby Size of Employment
2007 2008 2009 2010 2011 2012 2013 2014Q1 Q2 Q3 Q4 Q1 Q2 Q3 Q4 Q1 Q2 Q3 Q4 Q1 Q2 Q3 Q4 Q1 Q2 Q3 Q4 Q1 Q2 Q3 Q4 Q1 Q2 Q3 Q4 Q1
Small (<100) 33.9 34.2 33.7 32.9 35.6 36.4 35.9 36.2 41.6 41.6 39.9 39.9 41.2 41.2 40.2 40.8 39.2 40.0 38.9 37.0 36.1 33.8 34.0 34.3 36.3 36.8 34.4 34.0 33.7Medium (100-<500) 37.1 33.2 35.0 34.6 35.8 34.9 32.7 32.9 33.5 33.3 32.9 34.5 34.6 34.6 34.9 34.2 34.8 35.1 36.3 36.2 35.8 36.0 36.1 38.4 35.6 36.2 38.5 35.9 35.7Large (500 & up) 17.0 18.0 20.1 19.6 16.1 14.6 16.8 17.7 13.6 13.7 13.9 14.1 13.2 13.2 14.4 14.9 15.1 13.8 13.5 15.0 15.5 15.5 17.4 13.6 16.8 17.4 16.8 18.7 17.8Not Specified 12.0 14.7 11.2 13.0 12.5 14.1 14.7 13.1 11.3 11.4 13.3 11.6 11.1 11.1 10.4 10.1 10.8 11.0 11.3 11.8 12.7 14.7 12.5 13.7 11.2 9.6 10.3 11.4 12.8Total 100.0 100.0 100.0 100.0 100.0 100.0 100.0 100.0 100.0 100.0 100.0 100.0 100.0 100.0 100.0 100.0 100.0 100.0 100.0 100.0 100.0 100.0 100.0 100.0 100.0 100.0 100.0 100.0 100.0
Feb-28-2014 5:10 PM
4
Percent to Total
Percent to Total
Next Quarter
Next Quarter