
Business Employment Dynamics David M. Talan Branch Chief, Quarterly Census of Employment and Wages...
36
Business Employment Dynamics David M. Talan Branch Chief, Quarterly Census of Employment and Wages (QCEW) Program The Council for Community and Economic Research (C2ER) 52 ND Annual Conference Oklahoma City, Oklahoma Thursday June 7, 2012
-
Upload
stewart-joseph -
Category
Documents
-
view
216 -
download
0
Transcript of Business Employment Dynamics David M. Talan Branch Chief, Quarterly Census of Employment and Wages...

Business Employment Dynamics
David M. TalanBranch Chief, Quarterly Census of Employment and
Wages (QCEW) Program
The Council for Community and Economic Research (C2ER)
52ND Annual ConferenceOklahoma City, Oklahoma
Thursday June 7, 2012

Outline
Background Quarterly Census of
Employment Wages (QCEW) Data
Business Employment Dynamics (BED) Data

Quarterly Census of Employment and Wages
Quarterly census of employers covered under UI and federal employers covered under UCFE
95.3 percent of civilian wage and salary employment

QCEW – Quarterly Census of Employment and
Wages
Quarterly data (frequent) Released 6 months after reference
period - timely 9.1 million records and growing 130 million in employment Units, employment and wages 6 digit NAICS and county, ownership
20 million data series available on the BLS website
UI based, mandatory collections to run UI Wages - 94% reported data Employment - 98% reported data Units - 90% reported data
4

UI Tax Rate, Actuarial Analysis and UI Benefit Rates
UI-Covered Employment
Local Area Unemployment Stats
Personal Income (BEA) - U.S., State, County
Gross Domestic Product (BEA)
Economic Forecasting
Current Employment Statistics
Occupational Employment Statistics
Job Creation/Destruction• Size Class Dynamics• Business Survival Rates
Geocoded Establishments
Occupational Employment Statistics
Occupational Safety and Health Statistics
Current Employment Statistics
National Compensation Survey
Industrial Price Program
Occupational Safety and Health Statistics
Programmatic Uses
Benchmarking(Employment Base)
General Economic Uses
Quarterly Census of Employment & Wages Data (QCEW/ES-202)
Analytical Uses Sampling
Mass Layoff Statistics: linkages
State Revenue Projections (BEA)
JOLTS and Green Goods and Services
JOLTS and Green Goods and Services and State Job Vacancy Surveys…..and other federal govt surveys
Local Economic Development Indicators
• Cluster Analysis• Shift Share• Industry Diversity Indexes• Location Quotients
Federal Funds Allocation$250 Billion(HUD, USDA, HCFA/CHIP)
Minimum Wage Studies
Uses of Quarterly Census of Employment and Wages Data (QCEW/ES-202)
Local Economic Impact Response Planning
Local Government Services Planning
Census Bureau• Improve Economic Census• Improve CPS each decennial
population Census• LEHD / LED• Industry Code Sharing (3.3 M)• County Business Patterns
Local Transportation Planning
Social Security AdministrationUpdated as of 6/14/2011
Quarterly Press Releases, Annual Employment & Wages
REMI and Input-Output Tables
State/local industry employment & wages

Employment and Wage Data
Number of establishments, monthly employment, and quarterly wages
Available by: geographical area industry code size
WAGES
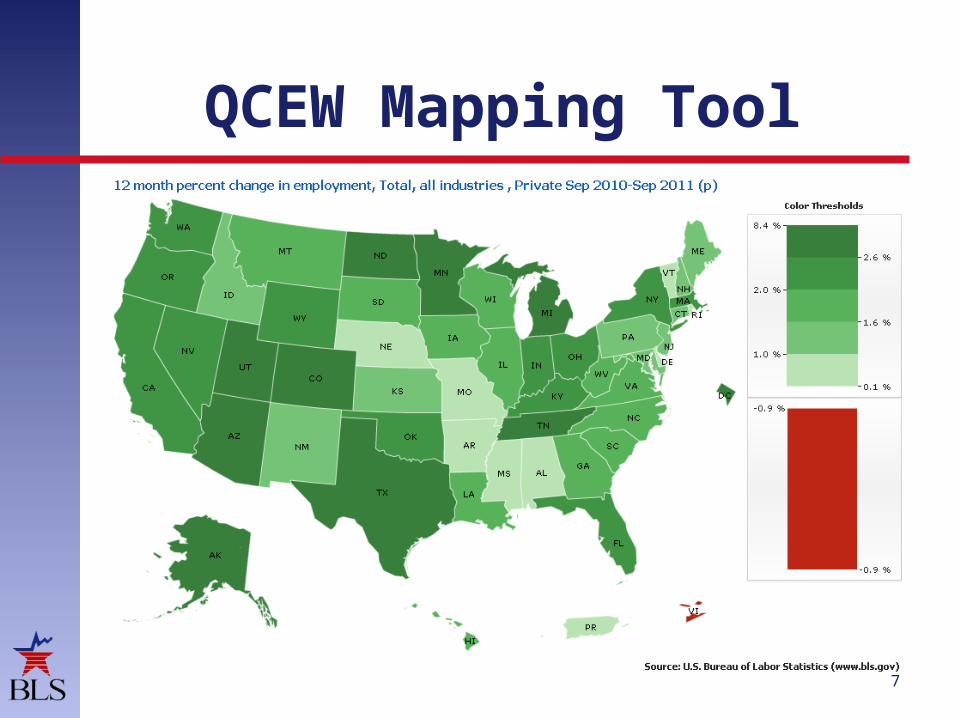
QCEW Mapping Tool
7

QCEW Mapping Tool
8

What are the BED?
BED are longitudinally linked QCEW microdata
– Unit of analysis is the Establishment BED Scope
– Private sector, excludes private households
• 6.8 million establishments• 107 million employment
BED reveals the dynamics of the labor market
BED data show gross job flows as well as net employment changes

What are the BED?
A set of statistics measuring changes in employment at the establishment level on a quarterly basis Job churn Creative destruction

What are the BED?
Gross Job Gains– Expansions – Openings
• Births
BED statistics break down the underlying dynamics of net employment change into the numbers and rates of gross jobs gained and gross jobs lost:
Gross Job Losses– Contractions – Closings
• Deaths
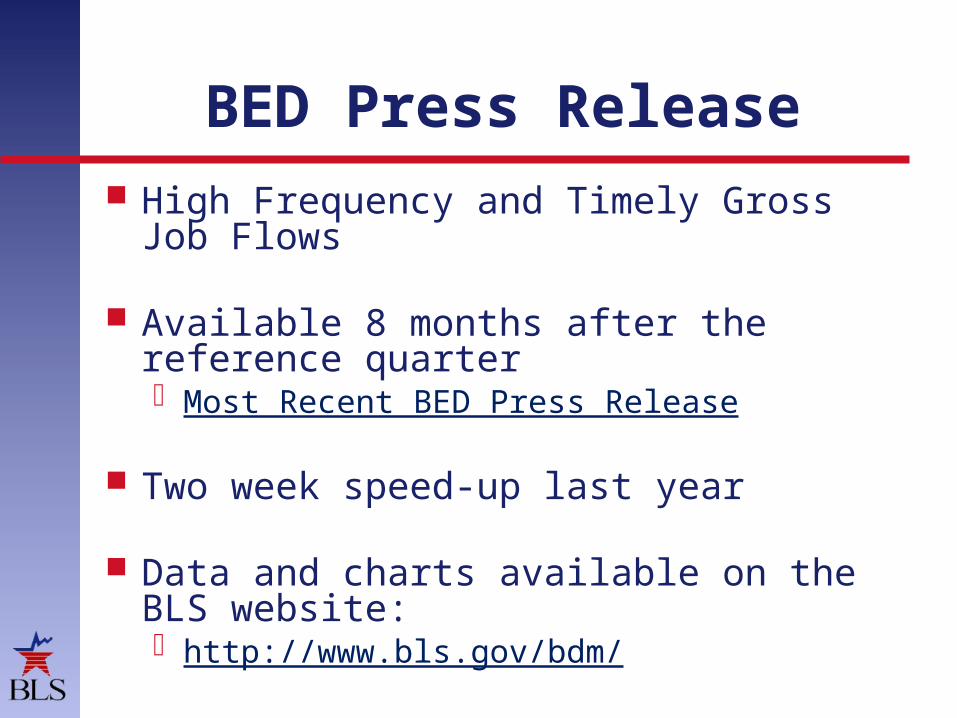
BED Press Release High Frequency and Timely Gross Job
Flows
Available 8 months after the reference quarter Most Recent BED Press Release
Two week speed-up last year
Data and charts available on the BLS website: http://www.bls.gov/bdm/

13
Business Employment Dynamics
National Total Private National NAICS Sector National Firm Size State Total Private National Size of Employment
Change Annual (National/State) Birth Death National/State) 3 Digit national data Age and survival National and State 2 digit
September 2003 May 2004 December 2005 August 2007 September 2008 May 19, 2009 May 19, 2009 May 20, 2010 August 19, 2010 February 1, 2012

Gross Job Gains and Losses
Gross job gains
Gross job losses
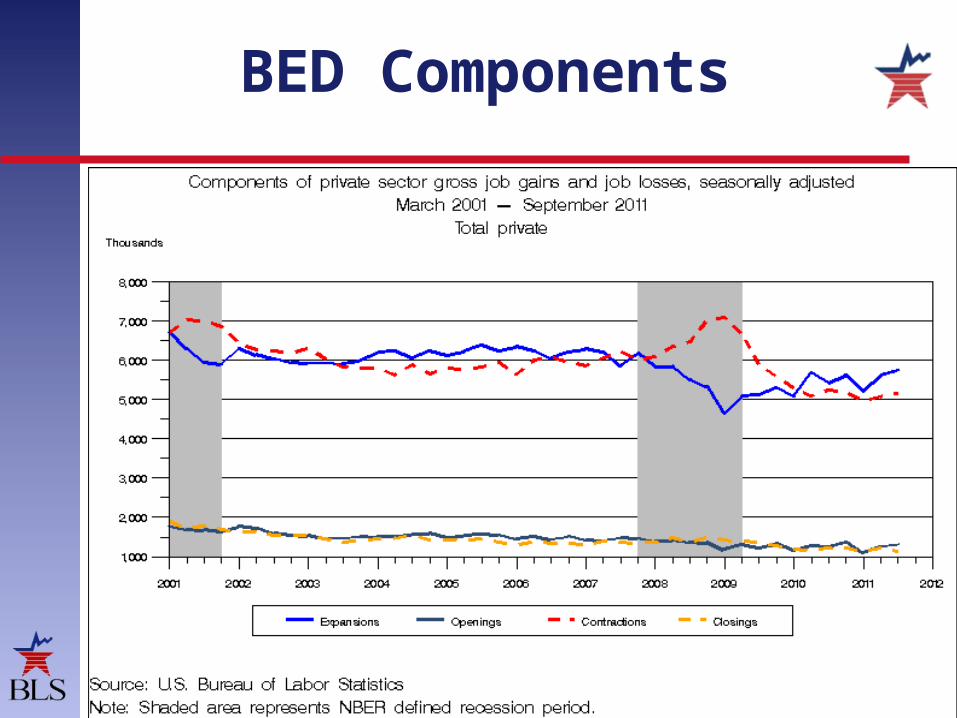
BED Components
Expansions
Contractions
Openings
Closings

“A lesser-known employment snapshot, based on a quarterly census of state unemployment insurance records, shows the economy created about 19,000 private-sector jobs in the third quarter of 2006, the most recent data available... ”
- May 24, 2007
http://online.wsj.com/article/SB117996499341212776.html?mod=todays_us_page_one
Job Market’s Strength May Have Been Overstated

Construction of Buildings
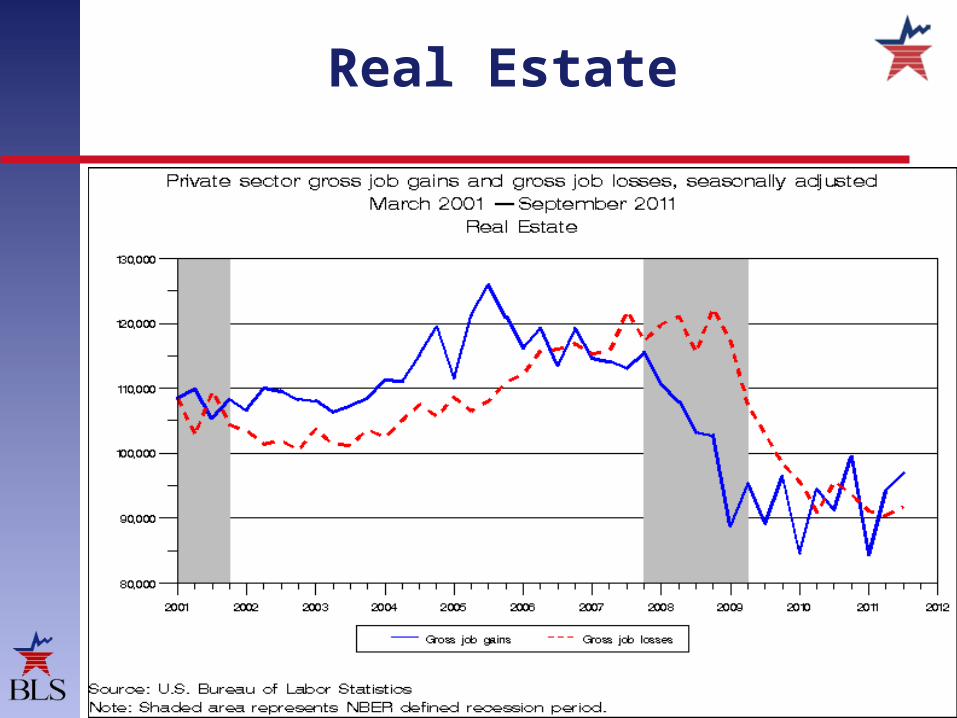
Real Estate
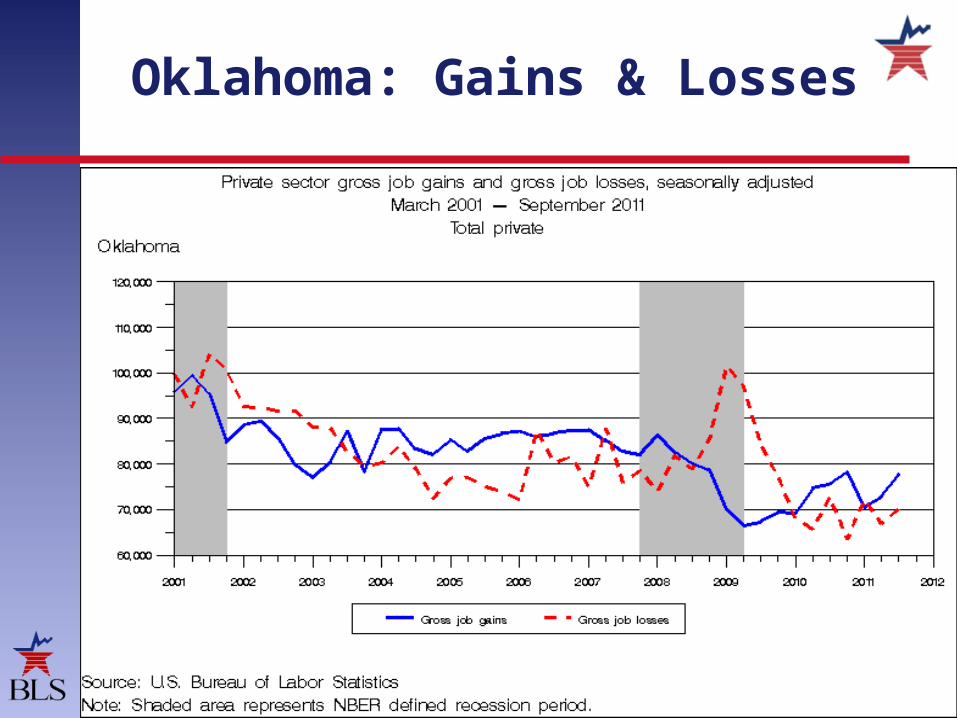
Oklahoma: Gains & Losses
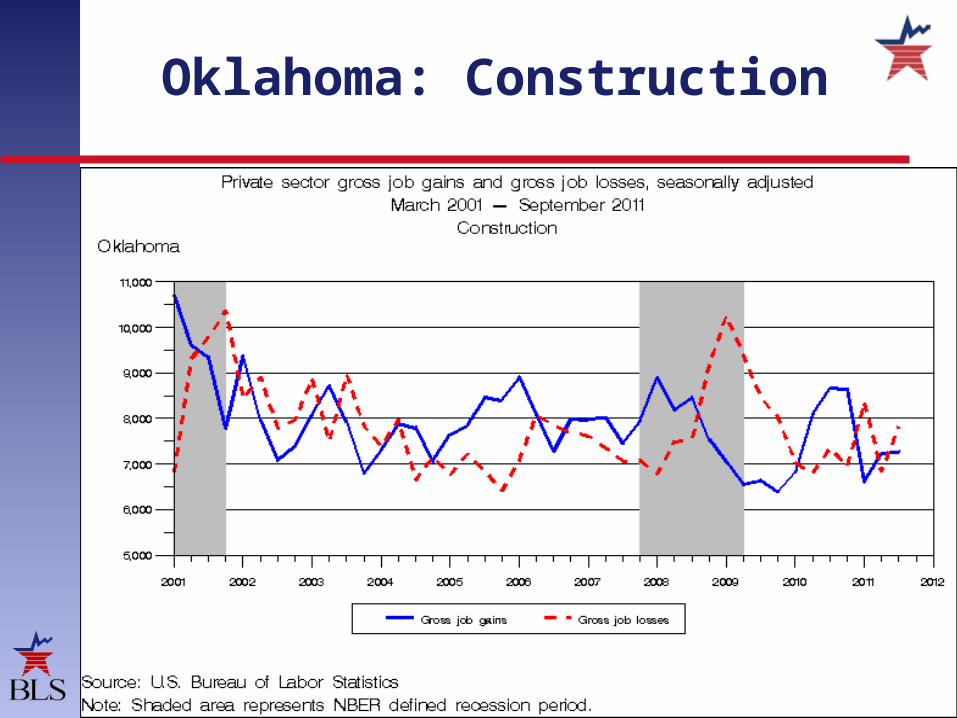
Oklahoma: Construction

Oklahoma: Education and Health Services

Arizona: Gains & Losses
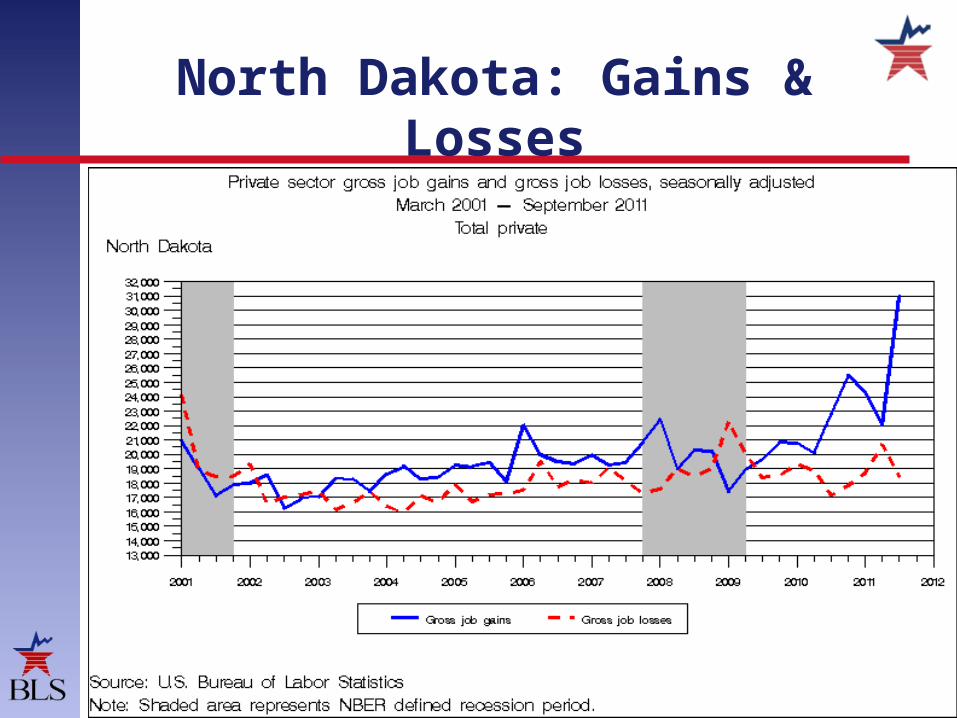
North Dakota: Gains & Losses
24
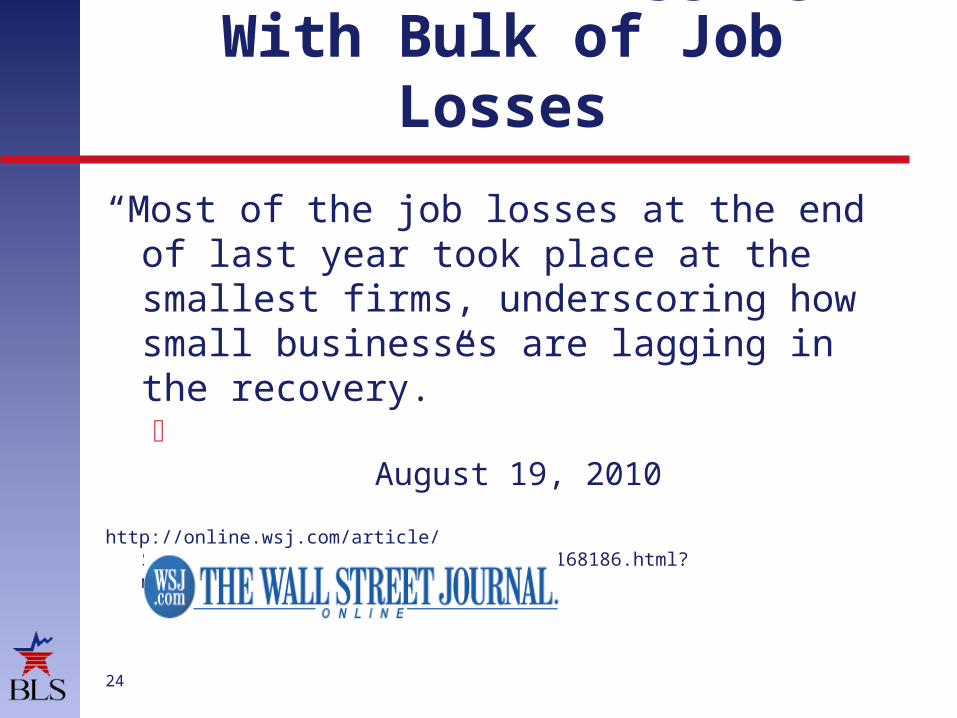
Small Firms Lagging, With Bulk of Job Losses
“Most of the job losses at the end of last year took place at the smallest firms, underscoring how small businesses are lagging in the recovery.” August 19,
2010
http://online.wsj.com/article/SB10001424052748704557704575437650742168186.html?mod=WSJ_economy_LeftTopHighlights

Source: U.S. Bureau of Labor StatisticsNote: Shaded area represents NBER defined recession period

Why BED data by establishment age?
26
The Committee on National Statistics recommended employment dynamics data by age.
Age and survival data along will complete ‘demographic’ profile of US businesses.
Unsettled debate on who creates the most jobs: young or old firms? A debate similar to the small vs. large firms contribution to employment growth.
The impact of age of firm/establishment on employment growth and productivity is inconclusive.
New research (Young firms, Not Small Ones, Are the Engines of Growth ) showed controlling for age, there is no systematic relationship between firm size and growth.

Source: U.S. Bureau of Labor Statistics
28
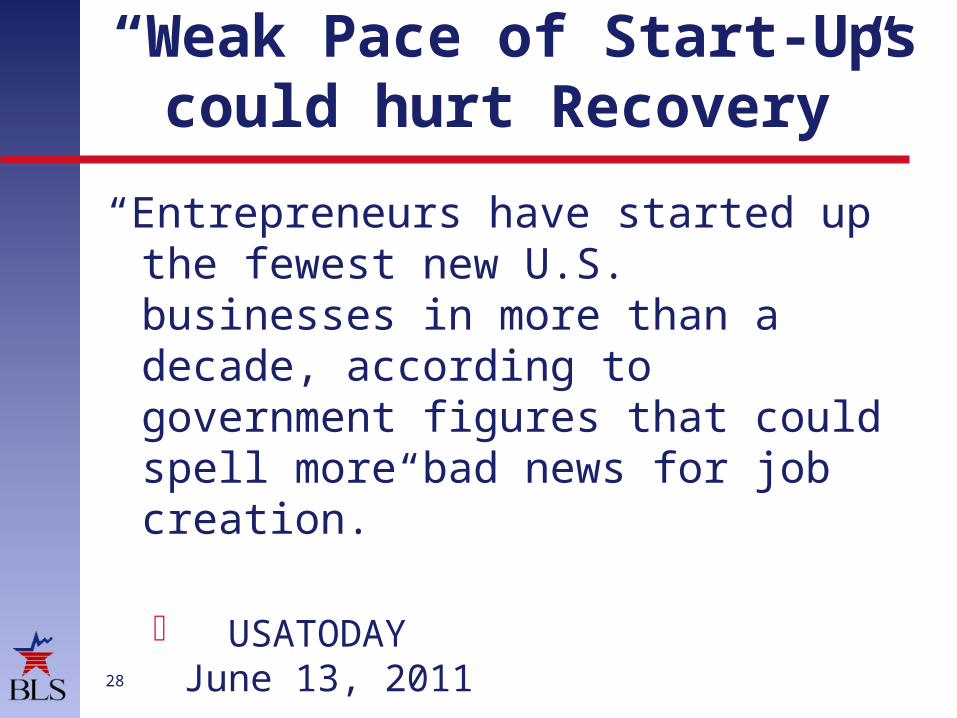
“Weak Pace of Start-Ups could hurt Recovery”
“Entrepreneurs have started up the fewest new U.S. businesses in more than a decade, according to government figures that could spell more bad news for job creation.”
USATODAY June 13,
2011
http://www.usatoday.com/money/smallbusiness/2011-06-13-small-business-start-ups-fewer_n.htm

Source: U.S. Bureau of Labor StatisticsNote: Shaded area represents NBER defined recession period

Source: U.S. Bureau of Labor StatisticsNote: Shaded area represents NBER defined recession period
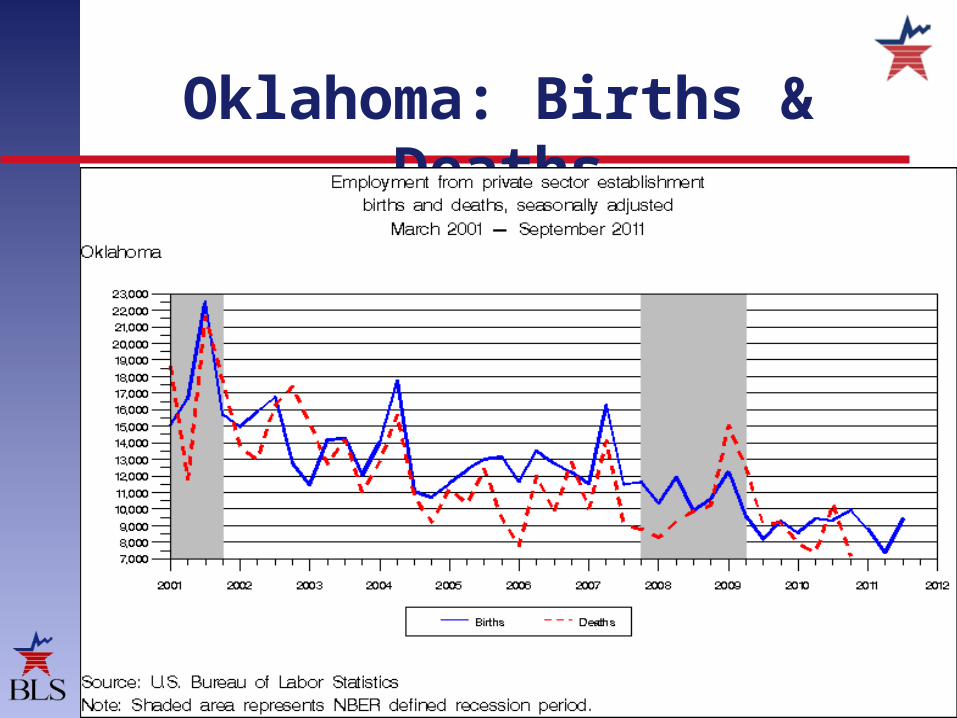
Oklahoma: Births & Deaths


Source: U.S. Bureau of Labor Statistics

Source: U.S. Bureau of Labor Statistics

Accessing the QCEW and BED Macrodata
BED: http://www.bls.gov/bdm/home.htm
QCEW: http://www.bls.gov/cew/home.htm
35

Contact Information
David M. Talan
Phone: (202) 691-6467Email: [email protected] Website: www.bls.gov/bdm


