Business Case for Residential Communal
94
Business Case City of Edmonton 5th Floor Century Place 9803 102A Ave NW Edmonton, AB T5J 3A3 edmonton.ca Business Case for Residential Communal Collection Mandatory Source Separation (Formerly: Multi-unit Program) City Operations | Waste Services City of Edmonton Page 1 of 94
Transcript of Business Case for Residential Communal

Business Case
City of Edmonton5th Floor Century Place9803 102A Ave NWEdmonton, AB T5J 3A3
edmonton.ca
Business Case for Residential Communal
Collection
Mandatory Source Separation
(Formerly: Multi-unit Program)
City Operations | Waste Services
City of Edmonton
Page 1 of 94

Business Case City Operations | Waste Services
page intentionally left blank
Page 2 of 94

Business Case City Operations | Waste Services
Table of Contents
Table of Contents 3
Change History 6
Document Approval 6
Executive Summary 8
Background 10Current Situation 11Planning and Growth 15
Challenges and Opportunities 16Diversion 16Commitment to Cross Sector Consistency 17Additional Challenges 18
Initiative 19Initiative Description 19Urgency of Need 20Anticipated Outcomes 21Scope 21Out of Scope 22Critical Success Factors 23
Strategic Alignment 24
Context Analysis 25Comprehensive Research 25Regulated Utility Model 28
High Level Options 29Method of Separating Food Scraps and Recyclables 29Method of Collection 29Resident Support 29Property Management Relationship 29Financial Mechanisms 29Regulatory Mechanisms 30
Options Analysis Methodology 30Overview of Analysis Approach 30
Page 3 of 94
Business Case City Operations | Waste Services
Options Analysis Stages 31
Summary of Public Engagement Results 36Phase One 36Phase Two 36
Viable Alternatives 37Method of Separating Food Scraps and Recyclables 37Method of Collection 38Volume Allocation and Container Sizes 40Resident and Property Manager Supports 41Regulatory Mechanisms 43Financial Mechanisms 45
Program Alternatives 45Colocation 46Chute Closure 46Summary of Alternatives 48Diversion Comparison 50Staff and Fleet Impacts 50
Organizational Change Impact 51Stakeholder Requirement, Business and Operational Impacts 51
Summary of Cost and Benefits 57Expected Benefits 57Costs 57
Key Risks and Mitigating Strategies 60
Gender Based Analysis Plus (GBA+) Considerations and Recommendations 61
Conclusion and Recommendation 62Conclusion 62Recommendation 63Additional Recommendations 63
Project Responsibility and Accountability 64
Implementation Approach 64Recommended Timeline for Mandatory Colocation 64Alternative Timeline for Voluntary Colocation 66Bylaw Updates 66Performance Management 67Critical Dependencies Impacting Timeline 67
Page 4 of 94

Business Case City Operations | Waste Services
Additional Implementation Steps 67
Review and Approval Process 68Business Case Sign Off 69
Appendices 70Appendix A - Stage One Options Analysis Results 71Appendix B - Stage Two Options Analysis Results and Sensitivity Analysis Methodology 73Appendix C - Stage Three Options Analysis Results and Scoring Methodology 77Appendix D - Assumptions for Alternatives 82Appendix E - Detailed Alternative Cost Comparison Summary 88Appendix F - Comparison of Revenue Requirement for Alternatives 90Appendix G - Annual Operating and Maintenance Costs 94
Page 5 of 94
Business Case City Operations | Waste Services
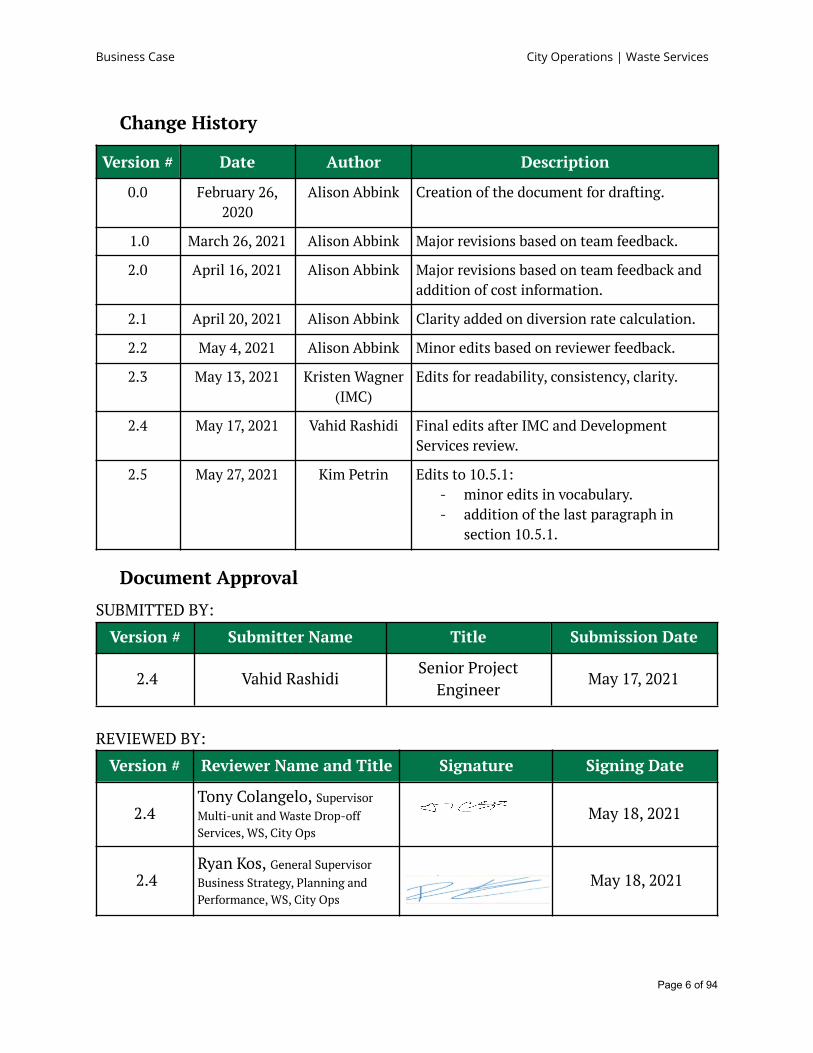
Change History
Version # Date Author Description
0.0 February 26,2020
Alison Abbink Creation of the document for drafting.
1.0 March 26, 2021 Alison Abbink Major revisions based on team feedback.
2.0 April 16, 2021 Alison Abbink Major revisions based on team feedback andaddition of cost information.
2.1 April 20, 2021 Alison Abbink Clarity added on diversion rate calculation.
2.2 May 4, 2021 Alison Abbink Minor edits based on reviewer feedback.
2.3 May 13, 2021 Kristen Wagner(IMC)
Edits for readability, consistency, clarity.
2.4 May 17, 2021 Vahid Rashidi Final edits after IMC and DevelopmentServices review.
2.5 May 27, 2021 Kim Petrin Edits to 10.5.1:- minor edits in vocabulary.- addition of the last paragraph in
section 10.5.1.
Document Approval
SUBMITTED BY:
Version # Submitter Name Title Submission Date
2.4 Vahid RashidiSenior Project
EngineerMay 17, 2021
REVIEWED BY:
Version # Reviewer Name and Title Signature Signing Date
2.4Tony Colangelo, SupervisorMulti-unit and Waste Drop-offServices, WS, City Ops
May 18, 2021
2.4Ryan Kos, General SupervisorBusiness Strategy, Planning andPerformance, WS, City Ops
May 18, 2021
Page 6 of 94

Business Case City Operations | Waste Services
2.4 Sarah Wilmot, Senior IntegratedWaste Policy Planner, WS, City Ops
May 17, 2021
2.4 William Johnston, Barristerand Solicitor, Legal Services, FCS
Will Johnston May 17, 2021
APPROVED BY:
Version # Approver Name and Title Signature Signing Date
2.4Mordecai Baba, ActingDirector, Collection Services, WS,City Ops
May 17, 2021
2.4 Chris Fowler, Acting Director,Waste Strategy, WS, City Ops
May 18, 2021
2.4 Ellen Tian, Director, TechnicalServices, WS, City Ops
May 17, 2021
2.4Neil Kjelland, Director,Sustainable Waste Processing, WS,City Ops
Neil Kjelland May 20, 2021
2.4 Jodi Goebel, Acting Director,Business Integration, WS, City Ops
May 17, 2021
2.4 Santosh Appukuttan,Finance Manager, WS, City Ops
Sant�s� Appuku�a� May 19, 2021
2.4 Michael Labrecque, BranchManager, Waste Services, City Ops
May 21, 2021
2.5 Kim Petrin, Branch Manager,Development Services, UPE
May 26, 2021
Page 7 of 94
Business Case City Operations | Waste Services
1. Executive SummaryCurrently, the communal collection program collects two streams: commingled garbage andrecycling. The program uses front load bins (bins that are serviced with front load vehicles) thatare shared by residents of multi-unit properties. This program is provided to apartment andcondo properties that cannot be serviced by curbside collection. Participation in recyclingcollection is voluntary at the property level. The garbage and recycling collected is processed atthe Edmonton Waste Management Center (EWMC), where streams can be mechanically sortedand a portion is diverted from landfill.
The current approach, which requires processing large amounts of unsorted waste, has limitedthe effectiveness and efficiency of the waste processing facilities. Although the City's wasteprocessing infrastructure includes a Refuse Derived Fuel (RDF) Facility, which is able to divertresidual waste, the production of RDF is not meant to replace actions that achieve diversionthrough more sustainable processes such as composting, anaerobic digestion and recycling. Asoutlined in Edmonton’s 25-year Comprehensive Waste Management Strategy (Waste Strategy) ,1
and in alignment with the internationally accepted solid waste management hierarchy, wastesystems should prioritize waste reduction, reuse, and recycling and composting above materialsrecovery in order to operate efficiently.
Most recently, the diversion rate for the sector dropped from 14 percent (in 2019) to ninepercent (in 2020), largely as a result of negative impacts resulting from the closure of theEdmonton Composting Facility and the COVID-19 pandemic. Without consideration for theadditional diversion that can be achieved from the production of Refuse Derived Fuel, or theadditional diversion that is expected to be achieved through the options contemplated in thisbusiness case, waste diversion from the sector is expected to increase over the coming years toa projected total of 41 percent (as a result of system improvements including processing facilityenhancements and investments in additional processing capacity) but to then stagnate withoutchanges to the collection program.
Continuing the status quo service will not achieve the City’s strategic goals, particularly thegoal of 90 percent diversion across all sectors set in Edmonton’s 25-year Waste Strategy.Substantive program changes are required to align the communal collection program in supportof this goal.
Program components that are critical to achieving a high diversion rate were identified throughcomprehensive research. These components address the many challenges unique to thecommunal collection program, such as anonymity, space constraints and less convenient accessto disposal for specific waste streams. These components include source separation of wastestreams; convenient, equal access to containers for all waste streams; and targeted, sustained
1 CR_5829 Waste Strategy - Comprehensive Waste Management Strategy 2019
Page 8 of 94
Business Case City Operations | Waste Services
education. Communal collection customers have not historically received targeted educationalsupport to overcome these challenges. Residents that receive curbside collection have benefitedfrom enhanced education and outreach.
Transitioning to a three stream source separated collection program is a key starting point toaddressing challenges, capitalizing on opportunities and making meaningful progress towardthe goals of the Waste Strategy.
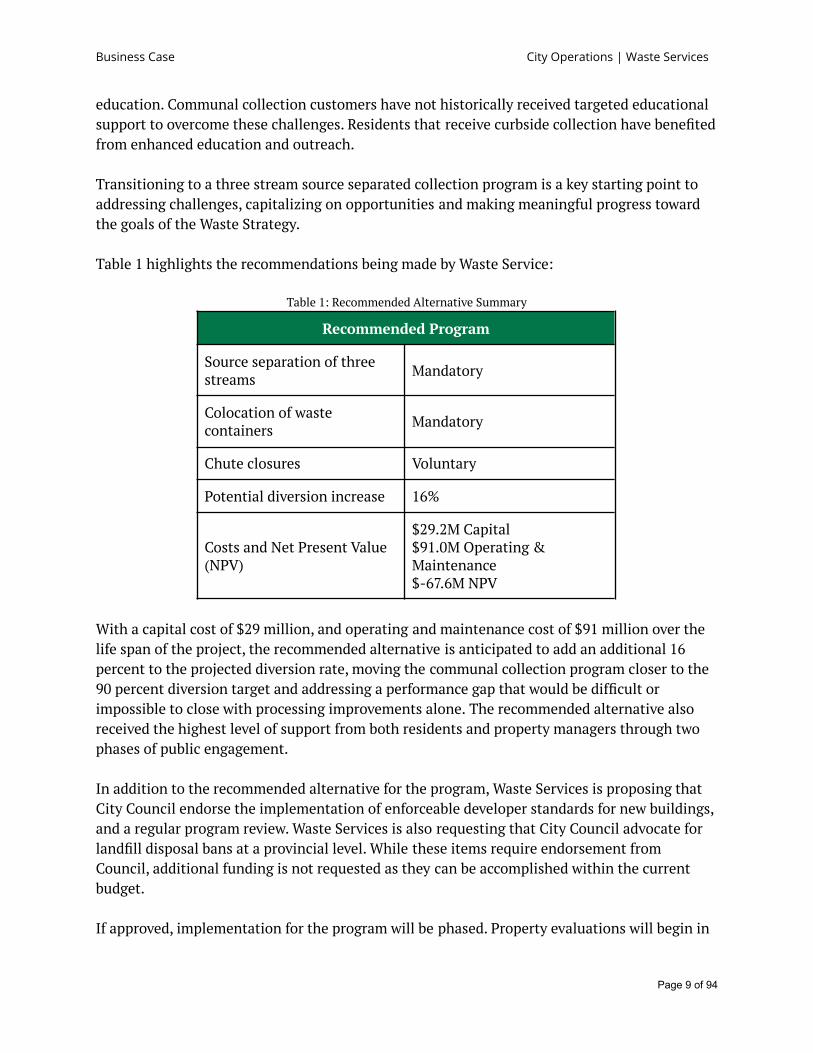
Table 1 highlights the recommendations being made by Waste Service:
Table 1: Recommended Alternative Summary
Recommended Program
Source separation of threestreams Mandatory
Colocation of wastecontainers Mandatory
Chute closures Voluntary
Potential diversion increase 16%
Costs and Net Present Value(NPV)
$29.2M Capital$91.0M Operating &Maintenance$-67.6M NPV
With a capital cost of $29 million, and operating and maintenance cost of $91 million over thelife span of the project, the recommended alternative is anticipated to add an additional 16percent to the projected diversion rate, moving the communal collection program closer to the90 percent diversion target and addressing a performance gap that would be difficult orimpossible to close with processing improvements alone. The recommended alternative alsoreceived the highest level of support from both residents and property managers through twophases of public engagement.
In addition to the recommended alternative for the program, Waste Services is proposing thatCity Council endorse the implementation of enforceable developer standards for new buildings,and a regular program review. Waste Services is also requesting that City Council advocate forlandfill disposal bans at a provincial level. While these items require endorsement fromCouncil, additional funding is not requested as they can be accomplished within the currentbudget.
If approved, implementation for the program will be phased. Property evaluations will begin in
Page 9 of 94

Business Case City Operations | Waste Services
2022, with rollout commencing in 2023 in multiple phases that are expected to continue forapproximately four years.
Once proposed program changes have been approved by City Council, work can commence onupdating the Waste Services Bylaw 18590 to align with the program requirements. Bylawrecommendations are expected to follow at a later date for review by City Council.
2. BackgroundFor more than 25 years, Waste Services has sought to continually evolve the City of Edmonton’swaste management practices to reduce environmental impacts and achieve financial stability.This commitment to sustainability has been recently reaffirmed by the City of Edmonton’sStrategic Plan: Connect Edmonton , which sets out four goals: Healthy City, Urban Places,2
Regional Prosperity, and Climate Resilience. It has also been reaffirmed by the City Plan3
Outcome 1.4: Edmontonians demonstrate shared leadership as stewards of the environment.
By connecting to those key strategic documents the Waste Strategy sets the City on a path ofsignificant change to the way that waste is perceived and managed. This path begins byreaffirming the goal of 90 percent waste diversion from landfill across all sectors and adopting azero waste framework, and will continue as the City develops and implements programs torequire source separation of recyclables, food scraps and yard waste, and takes on newinitiatives to reduce waste generation.
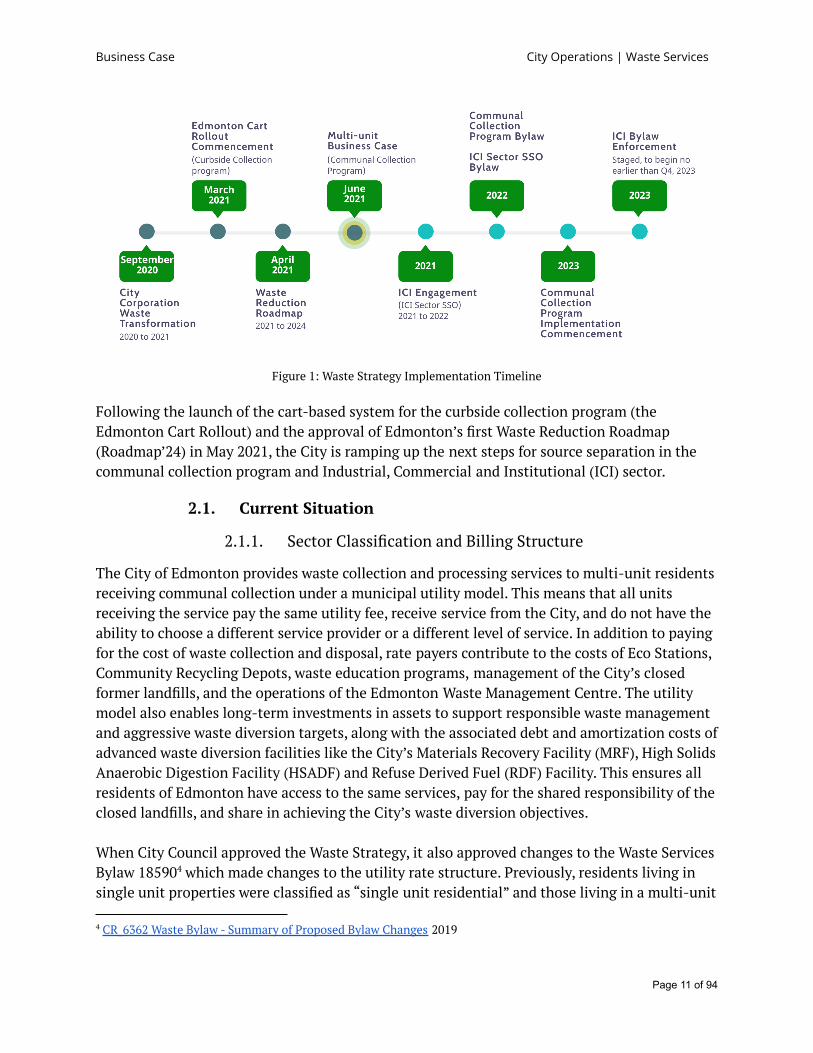
The Waste Strategy outlines how consistent requirements for source separation, supported bycomprehensive educational campaigns and regulatory measures, will help to achieve thediversion rate goal set by City Council. An updated timeline to implement source separationacross all sectors, citywide, was developed in response to the impacts of the COVID-19pandemic and is depicted in Figure 1.
3 Charter Bylaw 20000 - Edmonton City Plan 2020
2 Connect(ed) Edmonton - Edmonton's Strategic Plan 2019 - 2028
Page 10 of 94
Business Case City Operations | Waste Services
Figure 1: Waste Strategy Implementation Timeline
Following the launch of the cart-based system for the curbside collection program (theEdmonton Cart Rollout) and the approval of Edmonton’s first Waste Reduction Roadmap(Roadmap’24) in May 2021, the City is ramping up the next steps for source separation in thecommunal collection program and Industrial, Commercial and Institutional (ICI) sector.
2.1. Current Situation
2.1.1. Sector Classification and Billing Structure
The City of Edmonton provides waste collection and processing services to multi-unit residentsreceiving communal collection under a municipal utility model. This means that all unitsreceiving the service pay the same utility fee, receive service from the City, and do not have theability to choose a different service provider or a different level of service. In addition to payingfor the cost of waste collection and disposal, rate payers contribute to the costs of Eco Stations,Community Recycling Depots, waste education programs, management of the City’s closedformer landfills, and the operations of the Edmonton Waste Management Centre. The utilitymodel also enables long-term investments in assets to support responsible waste managementand aggressive waste diversion targets, along with the associated debt and amortization costs ofadvanced waste diversion facilities like the City’s Materials Recovery Facility (MRF), High SolidsAnaerobic Digestion Facility (HSADF) and Refuse Derived Fuel (RDF) Facility. This ensures allresidents of Edmonton have access to the same services, pay for the shared responsibility of theclosed landfills, and share in achieving the City’s waste diversion objectives.
When City Council approved the Waste Strategy, it also approved changes to the Waste ServicesBylaw 18590 which made changes to the utility rate structure. Previously, residents living in4
single unit properties were classified as “single unit residential” and those living in a multi-unit
4 CR_6362 Waste Bylaw - Summary of Proposed Bylaw Changes 2019
Page 11 of 94
Business Case City Operations | Waste Services
property were classified as “multi-unit residential.” The rate paid by a resident was based onthe type of dwelling they resided in, not the collection program they received. This meant thatsome multi-unit residents receiving curbside service (a higher cost service) paid the lower rateassociated with communal collection. The updated bylaw aligns utility rates with the type ofservice received rather than the dwelling type. Now, residents pay either a cart collection rate(i.e. curbside collection program) or a bin collection rate (i.e. communal collection program),depending on the service they receive. Multi-unit properties that receive curbside collectionhave begun to transition to the new classification and are included in the Edmonton CartRollout.
An effort has been made to move away from using “single unit” and “multi-unit” terminologythroughout this business case, where possible, since waste services and utility rates are nolonger associated with dwelling type. Instead, the terminology is focused on the collectionprograms provided to residents: curbside collection and communal collection. Curbsidecollection refers to the collection of individual containers either at a front street or back alleylocation. Each household is responsible for setting out waste in containers that are allocated onan individual basis. Communal collection refers to the service that is provided through the useof shared containers located in an indoor waste room or outdoor location. Containers forcommunal collection are allocated at a building level rather than on an individual basis. Thisbusiness case is focused on the communal collection program.
2.1.2. Collection Approach
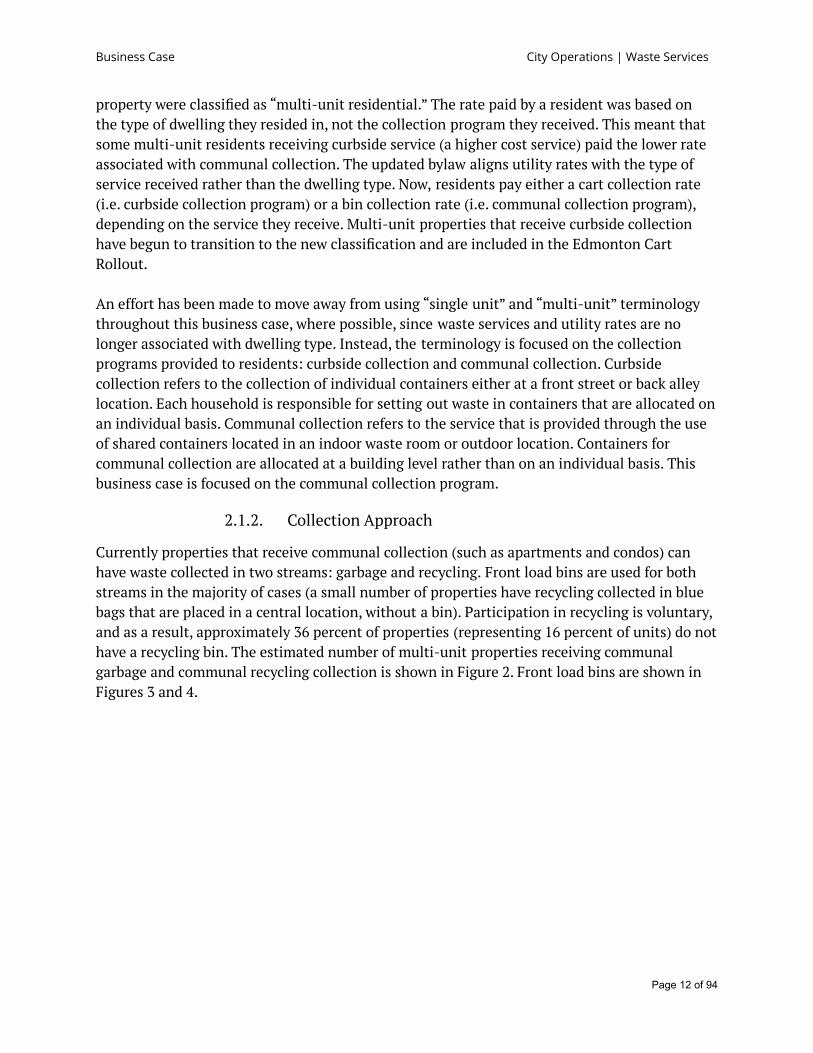
Currently properties that receive communal collection (such as apartments and condos) canhave waste collected in two streams: garbage and recycling. Front load bins are used for bothstreams in the majority of cases (a small number of properties have recycling collected in bluebags that are placed in a central location, without a bin). Participation in recycling is voluntary,and as a result, approximately 36 percent of properties (representing 16 percent of units) do nothave a recycling bin. The estimated number of multi-unit properties receiving communalgarbage and communal recycling collection is shown in Figure 2. Front load bins are shown inFigures 3 and 4.
Page 12 of 94
Business Case City Operations | Waste Services
Figure 2: Current Multi-unit Site Breakdown for Garbage and Recycling Collection
There is currently no limit on the quantity of waste that is collected from communal collectioncustomers. While bins are collected on a regular schedule, additional collection is provided atno cost to a building if a bin becomes full between regular collection days.
Residents set out all household garbage, including compostable material such as food scraps, inthe garbage bins. For properties with recycling bins, residents can place all recyclable materialsin the recycling bin. Residents of properties without recycling bins may choose to drop off theirrecyclable materials at a Community Recycling Depot.
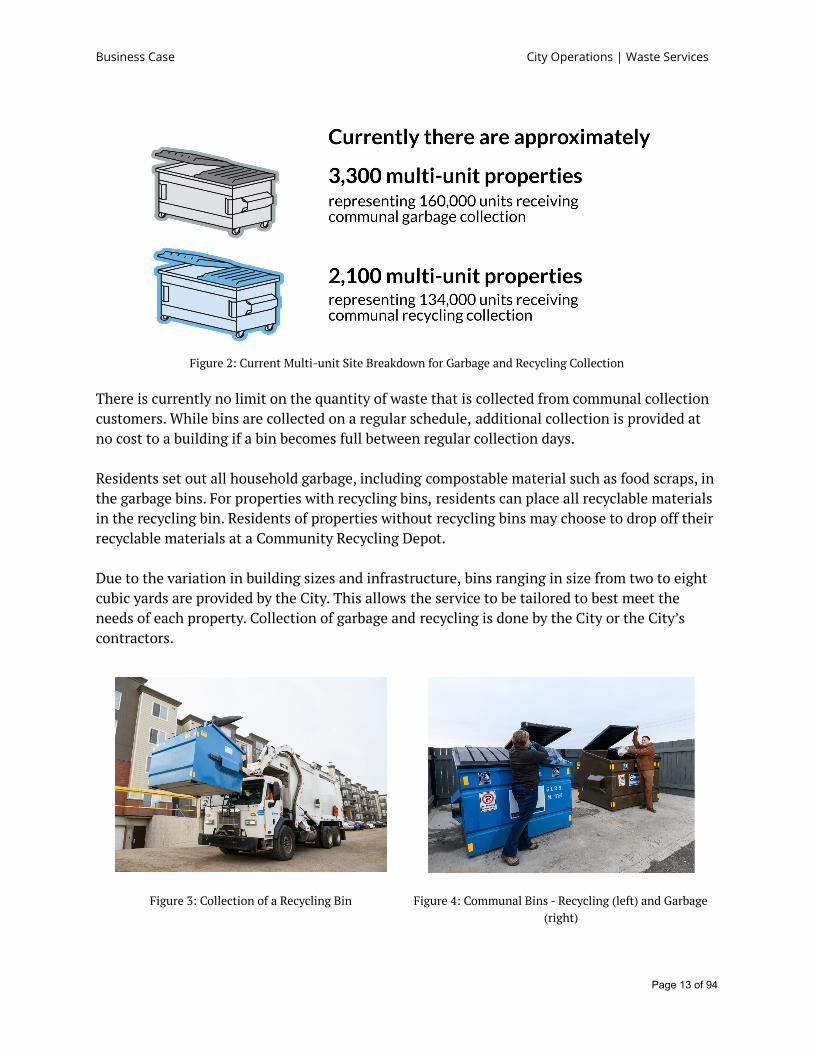
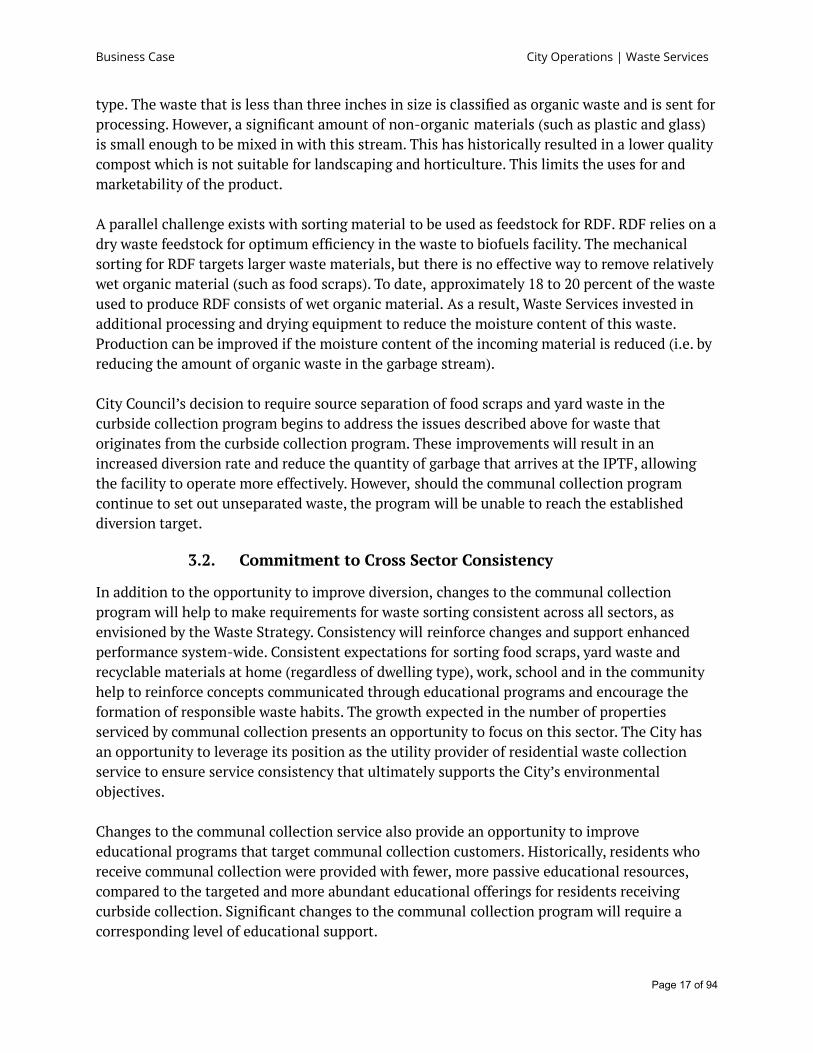
Due to the variation in building sizes and infrastructure, bins ranging in size from two to eightcubic yards are provided by the City. This allows the service to be tailored to best meet theneeds of each property. Collection of garbage and recycling is done by the City or the City’scontractors.
Figure 3: Collection of a Recycling Bin Figure 4: Communal Bins - Recycling (left) and Garbage(right)
Page 13 of 94

Business Case City Operations | Waste Services
2.1.3. Processing of Communal Collection Program Waste
Currently garbage from the communal collection program is taken to the EWMC for processing.Residential garbage arriving at the EWMC is mechanically sorted at the Pre-Processing Facility(PPF) inside the Integrated Processing and Transfer Facility (IPTF) and sent to other facilitiesfor further processing. Since the closure of the Edmonton Composting Facility (ECF) aerationhall in 2019, a limited quantity of organic waste has been sent for processing at the High SolidsAnaerobic Digestion Facility (HSADF) and the Cure Site. Additional capacity to process organicwaste is currently being provided by third party composters in the region. Similarly, anotherportion of the waste that has been pre-processed can be processed into Refuse Derived Fuel(RDF).
Recycling from both curbside and communal collection programs arrives at the EWMC at theMRF for sorting. After being sorted into streams, the material can then be sold to recyclingmarkets. A facility renewal project to increase the processing capacity and performance of theMRF was approved in October 2020 .5
2.1.4. Diversion Rate
It is estimated that approximately nine percent of communal collection waste was divertedfrom landfill in 2020. This figure is based on the total volume of waste that was recovered out ofthe total volume of waste generated by residents and includes both the collection andprocessing aspects of the communal collection program as well as contributions from wastedrop off programs such as Eco Stations and Community Recycling Depots. Based on recentanalysis of multiple municipalities, as much as 40 percent of communal garbage is organicwaste (i.e. food scraps) and an estimated further 32 percent is recyclable material. Thesenumbers are in addition to the recycling that is already collected separately through the City’svoluntary recycling program.
A Diversion Rate Calculation for the communal collection program is available as a separatedocument presented with this business case (Attachment 5).
2.1.5. Education and Outreach
Currently, Waste Services has limited educational resources specific to the communal collectionprogram. Online resources include a web page with information about the service. Printresources include a brochure entitled Your Guide to Waste and Recycling (which was initiallydesigned for English Language Learners).
Residents have also been invited to take advantage of other educational events and tools thatare offered to all Edmontonians, such as the tours of the Edmonton Waste Management Centre,the WasteWise mobile app, and a printable What Goes Where poster. Currently, Waste Servicesdoes not have any in-person educational programs specifically targeting communal collection
5 CO00057 Material Recovery Facility (MRF) Renewal Business Case Report 2020
Page 14 of 94

Business Case City Operations | Waste Services
and there are currently no dedicated education staff to support communal collectioncustomers.
2.1.6. Regulatory Requirements
Waste Bylaw 18590 was revised in 2019 to align with leading municipal best practice to supporta waste program designed to achieve high diversion targets. Two best practices are establishingmandatory source separation of waste streams and setting volume limits. The revision in 2019did not introduce regulatory requirements related to volume limits or mandatory three streamsource separation for residents receiving communal collection. Those best practices arereflected in the sections of the bylaw related to curbside collection.
The bylaw currently supports the proposed changes in this business case, but further revisionswill be required to bring it into full alignment.
Currently, developer guidelines, which describe the size and location of waste managementfacilities as well as vehicle access requirements for new multi-unit properties, are presented byWaste Services during the permitting phase of a new development, and must be reflected in theComprehensive Site Plan required by Clause 13.5 of Edmonton Zoning Bylaw 12800 . As the6
Zoning Bylaw is updated, ongoing alignment with the Waste Bylaw and updated Waste DesignStandards, along with enhanced procedures to ensure standards are reflected in completeddevelopments, will be required to provide clarity to developers and require best practices forwaste management to be incorporated into all new buildings.
2.2. Planning and Growth
The City Plan provides an outlook for the growth and evolution of the City. As the City7
continues to grow from one million to two million residents, a substantial increase in growth inmedium to high density dwellings such as apartments and mixed use properties is anticipated.Steady growth in high density residential development is expected over the next ten years,followed by more intense increases in subsequent years. The City Plan anticipates that a total of280,000 medium density and 220,000 high density dwellings will be required in order toaccommodate two million residents.
The City Plan estimates that medium and high density dwellings will account for 59 percent ofall dwellings city-wide with at least 50 percent of net new units added through infill. Thisgrowth will influence how programs and services will need to evolve to keep up with demands,and will play a large role in how waste is collected in the City. It will become increasinglyimportant for design and development standards to become enforceable and consistentlyutilized for new developments while allowing for flexibility and innovation in response toemerging needs, to ensure that this growth is aligned with best practices and service standards.
7 Charter Bylaw 20000 - Edmonton City Plan 2020
6 Edmonton Zoning Bylaw 12800 2017
Page 15 of 94

Business Case City Operations | Waste Services
3. Challenges and Opportunities
3.1. Diversion
In 2020 the diversion rate for the portion of the residential sector that receives communalcollection services dipped to nine percent. This rate includes collections and processing, as wellas waste drop off programs. This decrease in diversion is largely a result of negative impactsresulting from the COVID-19 pandemic and the closure of the ECF aeration hall. Over thecoming years this diversion rate is expected to increase as a result of processing facilityenhancements and investments in additional processing capacity to reach a projected total of41 percent, even without changes to collection.
This diversion forecast, and others presented throughout this business case, does not includethe diversion that can be achieved by processing mixed waste into Refuse Derived Fuel (RDF),since the intended feedstock for the City’s RDF process is municipal solid waste that cannot berecycled or composted. The diversion impact of RDF was removed from the calculationspresented in order to clearly show the impact of source separation of waste for the communalcollection program. The diversion potential of RDF should be seen as an adding value to boththe curbside and communal collection programs, by achieving diversion of residual waste thathas traditionally been sent to landfill. As recycling and composting are higher than recovery(including RDF) on the internationally accepted solid waste management hierarchy, the City’swaste system emphasizes diversion anchored in source separation before relying on recoverysolutions. Without changes to how waste is collected, the diversion rate will stagnate andcontinue to fall short of the target of 90 percent diversion from landfill, even when diversionfrom RDF processing is considered.
Calculations and analysis indicate that as much as 72 percent of the material that is currentlycollected as garbage through communal collection could be diverted through a sourceseparation program. Furthermore, the current recycling stream has a contamination rate ofabout 22 percent, indicating that waste sorting behaviour can be improved . These two8
challenges, in conjunction with the 90 percent diversion target across all sectors, present asignificant opportunity to manage waste from communal collection customers in a moreenvironmentally sustainable way.
As identified in the 2019 Single Unit Waste Set-out business case , the current method of9
collecting and processing a stream of commingled garbage that contains organic waste reducesthe effectiveness of processing facilities and the value of the end products such as compost andRDF, contributing to a lower diversion rate.
Waste that enters the City’s pre-processing facility is mechanically sorted by size, rather than
9 CR_7173 Single Unit Waste Set-out Business Case 20198 City of Edmonton Four-Season Waste Composition Study 2016
Page 16 of 94
Business Case City Operations | Waste Services
type. The waste that is less than three inches in size is classified as organic waste and is sent forprocessing. However, a significant amount of non-organic materials (such as plastic and glass)is small enough to be mixed in with this stream. This has historically resulted in a lower qualitycompost which is not suitable for landscaping and horticulture. This limits the uses for andmarketability of the product.
A parallel challenge exists with sorting material to be used as feedstock for RDF. RDF relies on adry waste feedstock for optimum efficiency in the waste to biofuels facility. The mechanicalsorting for RDF targets larger waste materials, but there is no effective way to remove relativelywet organic material (such as food scraps). To date, approximately 18 to 20 percent of the wasteused to produce RDF consists of wet organic material. As a result, Waste Services invested inadditional processing and drying equipment to reduce the moisture content of this waste.Production can be improved if the moisture content of the incoming material is reduced (i.e. byreducing the amount of organic waste in the garbage stream).
City Council’s decision to require source separation of food scraps and yard waste in thecurbside collection program begins to address the issues described above for waste thatoriginates from the curbside collection program. These improvements will result in anincreased diversion rate and reduce the quantity of garbage that arrives at the IPTF, allowingthe facility to operate more effectively. However, should the communal collection programcontinue to set out unseparated waste, the program will be unable to reach the establisheddiversion target.
3.2. Commitment to Cross Sector Consistency
In addition to the opportunity to improve diversion, changes to the communal collectionprogram will help to make requirements for waste sorting consistent across all sectors, asenvisioned by the Waste Strategy. Consistency will reinforce changes and support enhancedperformance system-wide. Consistent expectations for sorting food scraps, yard waste andrecyclable materials at home (regardless of dwelling type), work, school and in the communityhelp to reinforce concepts communicated through educational programs and encourage theformation of responsible waste habits. The growth expected in the number of propertiesserviced by communal collection presents an opportunity to focus on this sector. The City hasan opportunity to leverage its position as the utility provider of residential waste collectionservice to ensure service consistency that ultimately supports the City’s environmentalobjectives.
Changes to the communal collection service also provide an opportunity to improveeducational programs that target communal collection customers. Historically, residents whoreceive communal collection were provided with fewer, more passive educational resources,compared to the targeted and more abundant educational offerings for residents receivingcurbside collection. Significant changes to the communal collection program will require acorresponding level of educational support.
Page 17 of 94
Business Case City Operations | Waste Services
The current program, supported by the Waste Bylaw, only sets parameters for communalgarbage collection and optional communal recycling collection, whereas the curbside collectionprogram requires source separation of three streams. Once the program has been updated,revisions will be made to the bylaw to align with the new program requirements.
The City also has the opportunity to better leverage the development process for newproperties to ensure that developer standards for waste are reflected in new developments asthe city grows. These standards clearly outline minimum expectations for properties across thesector. Current Zoning Bylaw 12800 is undergoing a multi-year, comprehensive overhaul.Revising the Waste Bylaw and the Zoning Bylaw in tandem will allow for deeper integration andcollaboration between internal stakeholders, and support the development of alignedregulations, standards and procedures to achieve the intended outcomes of the Waste Strategy,alongside those of the City Plan and other key strategic policies and initiatives.
3.3. Additional Challenges
Communal waste collection differs from curbside waste collection in many ways including aneed for more flexible servicing due to space constraints and anonymity of the users. Comparedwith properties receiving curbside collection, resident turnover in properties with communalcollection has a higher impact to service participation and compliance, as large numbers ofpeople may move in a single month.
Properties receiving communal collection tend to have more variety in building size and type.This means there is a need for flexibility in terms of the types and sizes of containers used andservice frequency. Where homes receiving curbside collection can be serviced by one type ofcontainer (with variations in size to incentivize waste reduction and proper waste sorting), onetype does not fit most in the context of communal collection.
Communal waste areas can be located indoors (e.g. garbage rooms on the ground floor ofbuildings or in underground parking garages) or outdoors (e.g. in parking lots), and propertiesmay also have chutes that allow residents to dispose of waste on the same floor as theirdwelling. This variety in infrastructure requires staff to assist properties with allocating spacefor waste collection containers. The variety also compounds the challenge of providing equallyconvenient access to containers for all waste streams. Equal access is a fundamental componentof successful waste sorting.
Residents who receive communal collection do not always have a direct relationship with theimpacts of how they set out their waste. This is a result of two factors: a level of anonymity thatis created by many residents sharing a container, and the fact that many residents do not paythe utility rate directly because it is incorporated into rent or monthly condo fees. This lack of adirect relationship can pose challenges to participation in diversion programs and can give riseto higher contamination rates.
Page 18 of 94

Business Case City Operations | Waste Services
In some properties, outdoor communal bins create an opportunity for illegal dumping. Illegaldumping can include disposing of items that don’t belong in the waste stream in the bins (e.g.furniture, car batteries) or placing furniture and other prohibited materials next to the garbageand recycling bins, and can include opportunistic dumping by those who are not site residents.Although an illegal dumping strategy is outside the scope of this business case, changes to theservice may provide ways to mitigate the impacts of illegal dumping. For example, containerand lid size or shape may reduce disposal of bulky items that are problematic when received atprocessing facilities at the EWMC, and changes to the location may deter people from placingitems next to bins.
Based on information gathered during research and Public Engagement, residents of communalcollection properties typically move more often than residents in single unit dwellings, andtend to represent a wider variety of cultural backgrounds and languages. Educational programsmust therefore address challenges associated with high turnover rates and diverse backgrounds.Ensuring residents have adequate information and support requires more resources and effortfrom educational staff. Having a robust educational program with resources dedicated toresidents of communal collection properties can also impact the behaviour of residents in thecurbside collection program in the long term, as people may transition between property typesinterchangeably over time. This is especially true if the behavioural expectations are similar inboth programs.
Overall, the communal collection program presents a more complex situation than the curbsidecollection program and will require a unique approach to ensure the success of the WasteStrategy.
4. Initiative
4.1. Initiative Description
The alternatives presented in this business case would significantly change the way thatresidents that receive communal collection sort and set out their waste. These changes includemoving from a program that provides garbage collection with voluntary recycling to a programthat requires the separation of waste into three streams, and the creation of a targetededucation and outreach program to support both residents receiving communal collection andproperty managers.
The streams proposed for collection are aligned with the three primary streams provided tocurbside collection customers:
Garbage - Sorting waste into three streams will inevitably reduce the amount of residual waste,or garbage, set out. As a result, some properties will be able to use smaller containers for thisstream. Appropriately sized containers will be provided to every property (with the exception of
Page 19 of 94

Business Case City Operations | Waste Services
compactors which are procured, maintained and replaced by the property owner to reduce therequired collection frequency and/or building footprint required for waste collection from largescale multi-unit sites). Limits on the volume of garbage collected will also be introduced, tomatch expectations of customers receiving curbside collection service, and to incentivizeresidents to sort and reduce their waste.
Recycling - Recyclable materials make up a large volume of the waste that is generated byresidents receiving communal collection service. The alternatives examined in this businesscase are based on mandatory collection of recycling to increase the recovery of recyclablematerials. Suitable containers will be provided to every property.
Food Scraps - The separate collection of food scraps will also be mandatory. This stream willbe new to all properties receiving communal collection, and suitable containers will be providedto every property. Containers may also be topped up with yard waste, as is permitted forresidents who receive curbside collection service.
A targeted education and outreach program is proposed to ensure residents and propertymanagers are informed of the changes and supported through both the initial program changeand the pursuit of targets for program performance.
The impact of the selected alternative will be monitored and evaluated at regular intervals.Additional changes may be made to ensure the program continuously improves and adjusts.
4.2. Urgency of Need
The Waste Strategy and the Corporate Business Plan commit to implementing mandatorysource separation in the multi-unit sector (communal collection program) by 2023. This timingis aligned with changes currently underway for curbside collection customers (the EdmontonCart Rollout) and planned for the ICI sector. Implementation across sectors on similar timelinesallows for consistent educational programs, provides equitable service, closes gaps and ensuresresident habits are supported across sectors. The success of source separation programs in bothresidential programs will increase the success of source separation in the ICI sector.
If changes are not made to the communal collection program starting in 2023, the ongoingdisparity of services between residential programs may have a negative impact on residents’willingness to participate in the source separated curbside collection program, which willnegatively impact the diversion rate in the curbside program. There will also be less rationalefor mandatory source separation for the ICI sector.
It will take time to realize the impact of changes to the communal service. By starting to makechanges now, Waste Services will be better positioned to achieve the goals of the 25-year WasteStrategy.
Page 20 of 94
Business Case City Operations | Waste Services
4.3. Anticipated Outcomes
Waste Services anticipates the following outcomes as a result of the implementation of theproposed program:
● A decrease in the amount of garbage set out by residents, impacting container sizeand/or frequency of collection.
● More compliance with collection rules and increased participation in sorting as a resultof clear and consistent expectations, enforcement, outreach and education.
● Harmonized expectations across residential sectors, which may lead to an increaseddiversion rate in both programs, as residents move fluidly between housing types.
● Equity for residents between the curbside and communal collection programs.● Cleaner feedstock for organic processing facilities, resulting in an increase in processing
efficiency and higher quality end product.● Effective separation of recyclable materials from garbage to increase the amount of
recyclables that can be processed and sold to end markets.● Improved pre-processing at the IPTF due to a reduction in the volume of garbage.● Improved production of RDF, as a result of reduced moisture content in the garbage
stream.● Effective up front planning with regards to serviceability and optimal impact on usable
space in new developments as a result of enforceable Developer Standards.● Improved responsiveness to the needs and constraints of complex developments,
including mixed-use sites, where innovative design approaches are required to achieveserviceability and program outcomes without compromising city building outcomes.
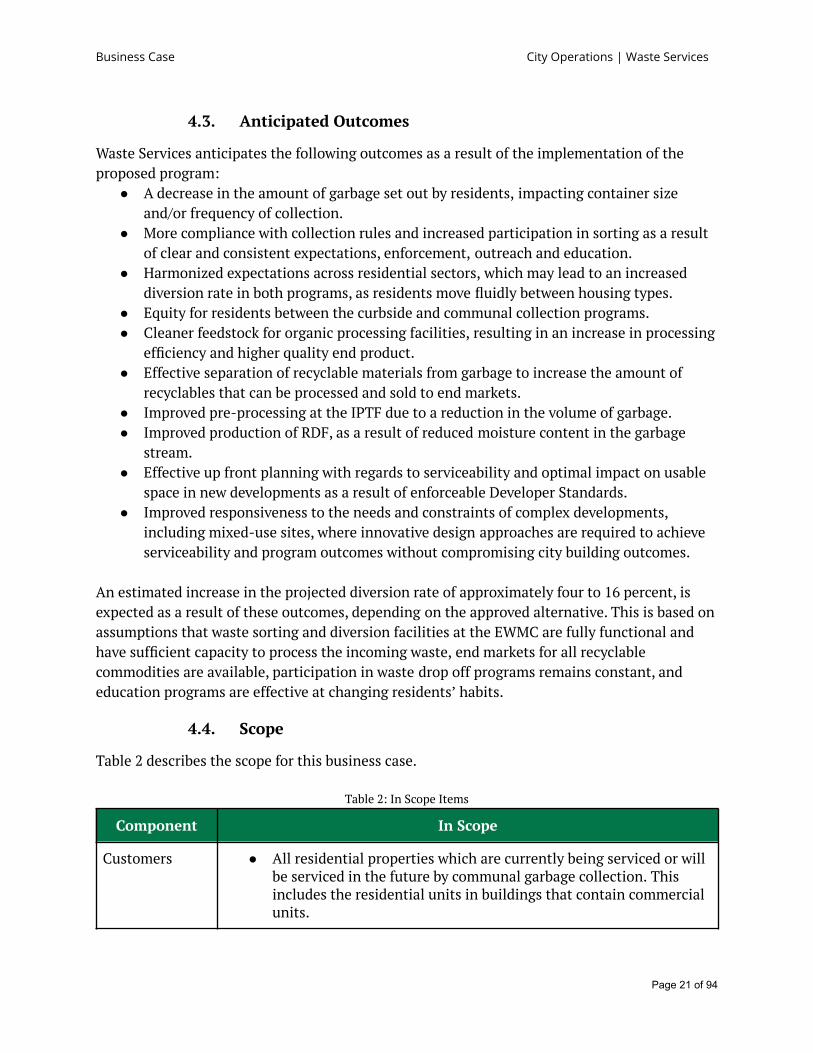
An estimated increase in the projected diversion rate of approximately four to 16 percent, isexpected as a result of these outcomes, depending on the approved alternative. This is based onassumptions that waste sorting and diversion facilities at the EWMC are fully functional andhave sufficient capacity to process the incoming waste, end markets for all recyclablecommodities are available, participation in waste drop off programs remains constant, andeducation programs are effective at changing residents’ habits.
4.4. Scope
Table 2 describes the scope for this business case.
Table 2: In Scope Items
Component In Scope
Customers ● All residential properties which are currently being serviced or willbe serviced in the future by communal garbage collection. Thisincludes the residential units in buildings that contain commercialunits.
Page 21 of 94

Business Case City Operations | Waste Services
Method ofSeparating FoodScraps andRecyclables
● Collection and processing of three streams of source separatedwaste: garbage, food scraps and recycling.
● Collection and processing of two streams of source separatedwaste: garbage and recycling.
Collection ● Identification of preferred containers for recycling.● Identification of preferred containers for garbage.● Identification of preferred containers for food scraps.● Impact of colocation of collection containers or disposal points (i.e.
ensuring residents have access to all three streams in the samespace) on capture and contamination rates.
Financial ● Capital and operating budgets to support the program changes.● Net Present Value (NPV) analysis.● Revenue Requirement (RR) analysis.
Implementation ● A high level implementation plan.● Introduction of regular waste characterization studies to support
regular data collection and measurement.
Strategic ● Analysis of the impact of waste chute closures on capture andcontamination rates.
● The need for mandatory developer standards addressing the designof waste spaces in new multi-unit properties.
Education andOutreach
● Development and delivery of education and outreach programs andstrategies specific to the communal collection program as part ofthe initial program launch, as well as ongoing support.
4.5. Out of Scope
Table 3 describes the items that are managed separately and that are out of scope for thisbusiness case.
Table 3: Out of Scope Items
Component Out of Scope
Customers ● All residential units that are in scope of the Edmonton Cart Rolloutproject.
● Non-residential customers, including commercial units in mixeduse properties.
Collection ● Changes to waste drop off programs such as Eco Stations,Community Recycling Depots, the Reuse Centre, and theResidential Transfer Station.
Page 22 of 94

Business Case City Operations | Waste Services
● Analysis of the cost of collection performed by City crews andcontractors.
● Analysis of the percentage of collection performed by City crewsand contractors.
Implementation A detailed implementation plan for the recommended options including:● Educational plan, tactics and materials for residents and property
managers.● Staff training requirements.● Updates to the billing system, if needed.● Collection contract procurement.● The procurement process for any private processors or technology
providers.● The details of the implementation phases (timing, number of
dwelling units per phase, etc.).
Processing ● Changes to processing infrastructure including contracts,equipment and resources.
● Organics processing facility business case or approval.
Utility Model ● Analysis for the deregulation of communal collection.
Strategic ● Solutions for on site management of organic waste for multi-unitproperties.
● Solutions for waste reduction for multi-unit properties.● Updates to the Waste Management Policy C527.● Diversion rate calculation methodology for communal collection
and proposed methods for measuring the diversion (presentedseparately at the same time of this business case).
Regulatory ● Updates to the Waste Services Bylaw 18590 (to follow at a later datebased on the alternative approved by City Council).
4.6. Critical Success Factors
The following critical success factors have been identified:● Completion of comprehensive research and analysis during program development to
support and identify best practices and evidence of mandatory three stream sourceseparation being effective in other jurisdictions with similar goals, and application oflessons learned from those jurisdictions.
● Effective engagement with stakeholders and residents to learn about local conditions,potential barriers to program implementation, and associated solutions.
● Risk identification and management to mitigate the risks during program planning andimplementation.
● Continued City Council endorsement of the Waste Strategy and its associated goals and
Page 23 of 94

Business Case City Operations | Waste Services
programs.● City Council and corporate leadership endorsement of the proposed program changes.● City Council approval of funding for the proposed program changes.● Resident and property manager participation and adoption of program changes.● Sufficient processing capacity, either at the EWMC or third party facilities, for the
expected quantity of food scraps and recycling.● The successful implementation of the Edmonton Cart Rollout program. The Edmonton
Cart Rollout will create momentum that will aid in implementation of an equivalentprogram for communal collection.
● Sufficient time for educational program planning as well as adequate resourcing toimplement.
5. Strategic AlignmentThe transition of the communal collection program to mandatory three stream separation isrooted in the Waste Strategy, which was approved by City Council in September 2019. The goalsin the Waste Strategy are aligned with City Council’s Strategic Goal of Climate Resilience setout in ConnectEdmonton .10
This business case is aligned with City Plan Outcome 1.4: Edmontonians demonstrate shared11
leadership as stewards of the environment. Intention 1.4.1 of the City Plan is to supportEdmontonians’ transition to a low carbon future in their daily lives and Direction 1.41.4 is toavoid waste at its source, improve diversion rates, and reuse and recover resources. Theimplementation of mandatory waste sorting, and mechanisms to incentivize waste reductionamong communal collection customers is clearly aligned with the directions of the City Plan.
The Waste Strategy also aligns directly with the Environmental Protection aspect of theCorporate Business Plan , supporting the commitment of minimizing the environmental12
impact of Edmontonians’ daily living through sustainable waste management practices,including the implementation of the Source Separated Organics program. This allows for thecollection of organic waste separately from residential garbage to then be processed intocompost .13
The proposed changes to the communal collection program are critical to the City’s ability toachieve these goals and commitments. The program changes will allow Waste Services tocontribute directly to the delivery of excellent services through more efficient and effectivewaste collection, and reduce the impact on the environment through source separation andwaste processing.
13 City of Edmonton Corporate Business Plan 2019 - 2022
12 City of Edmonton Corporate Business Plan 2019 - 2022
11 Charter Bylaw 20000 - Edmonton City Plan 2020
10 Connect(ed) Edmonton - Edmonton's Strategic Plan 2019 - 2028
Page 24 of 94

Business Case City Operations | Waste Services
This business case also aligns with the goals of the Revised Community Energy TransitionStrategy approved by City Council on April 19, 2021. The Revised Community Energy TransitionStrategy includes interconnected pathways of transformative change to reach Edmonton’sClimate Resilience goal of a low carbon city. Pathway 1 calls for a renewable and resilientenergy transition, and one associated goal is for Edmonton to use waste as a resource. Thecollection of source separated streams of waste enables the potential expansion of processingmethods that provide opportunities to maximize the production of zero emissions energy andresources from waste, such as anaerobic digestion. In addition, source separation of recyclingand food scraps will reduce the City of Edmonton’s carbon footprint; recycling uses less energyand fewer resources than production using virgin materials; and keeping food scraps out oflandfills reduces methane production.
Finally, this business case is also strategically aligned with a number of other distinct butrelated initiatives that are currently under development as part of the implementation of theWaste Strategy such as the Waste Reduction Roadmap, the Edmonton Cart Rollout, and the ICIwaste source separation strategy. Discussion is also underway with the provincial governmentregarding the introduction of an Extended Producer Responsibility (EPR) Framework forAlberta. If implemented, producers will be responsible for the end of life treatment of theirproducts. The implementation of a mandatory recycling collection by the City is anticipated toalign with these efforts. While these initiatives are outside the scope of this project, theiroutcomes will impact its overall success, and collectively contribute to achieving the ultimategoal of 90 percent diversion.
6. Context Analysis
6.1. Comprehensive Research
Comprehensive research was undertaken by Waste Services to seek out and validate potentialprogram components that would meet the City’s current and future needs. The findings alsoprovided a basis for the public engagement activities.
The research examined the current practices of jurisdictions in Canada and internationally. Aneffort was made to discover learnings from those municipalities that have long-standingprograms, uncover successful approaches, understand sector best practices, and exploreinnovation. In addition, the research identified future-facing strategic goals, considerations forthe evolution of programs, and program maturation milestones.
The research pulled from five types of information:● Jurisdictional scans: A scan of publicly available online data was conducted for 49
municipalities across Canada, the United States, Europe, Australia and Asia.● Interviews with government representatives: 14 municipalities were directly engaged
via phone interviews and email correspondence in Canada, the United States, andEurope. These municipalities were chosen because they represent a similar future-state
Page 25 of 94
Business Case City Operations | Waste Services
for Edmonton with three stream collection.● Interviews with industry representatives: 10 industry groups such as waste associations,
haulers, and processing companies were directly engaged via phone interviews andemail correspondence.
● Literature review: A review of 73 publicly available documents such as municipaleducational materials, policies, non-government organization (NGO) reports, casestudies, strategic documents, peer reviewed and comparative studies, pilot reports, andregional and municipal reports.
● Behavioural science studies: A review of research focusing on the impact of programdesign on resident behaviours.
In addition, the project team undertook a high level feasibility study of centralized wasteprocessing as an alternative to source separation, using existing Waste Services infrastructure.
The research results were organized into the following categories:● Methods of collection,● Resident supports such as educational and outreach tools,● Supports for property managers,● Regulatory mechanisms for a successful program, and● Financial mechanisms for a successful program.
6.1.1. Key Findings
A number of key findings were distilled from the research. These findings inform the optionsanalysis process of this business case. A full Summary of Findings is available as a separatedocument presented with this business case (Attachment 2).
Complexities of Communal CollectionRecurring challenges to communal collection were identified, including a high level ofanonymity, a wide range of building types and infrastructure needs, high rates of residentturnover, illegal and opportunistic dumping, and access challenges for residents, especially inlarge properties.
Many municipalities find that communal collection requires a more dedicated and sustainedeffort to support successful behaviour change. This may result in the creation of dedicatedcustomer service or multi-functional support teams.
Due to the more complex nature of this type of program, the diversion rate for communalcollection programs among municipalities with the most mature programs is in the range ofbetween 20 and 30 percent . While establishing a new program can result in an immediate14
increase in diversion, program maturity takes time to achieve. Even municipalities with matureprograms have a goal to increase their diversion rate. The most successful municipalities have
14 Multi-unit specific, not combined residential.
Page 26 of 94

Business Case City Operations | Waste Services
had programs in place for the longest time, including sufficient time for generational turnover.
Common Approaches to Waste Separation in Communal Collection ProgramsMost jurisdictions examined have determined that it is preferable to focus on source separation,rather than depend on processing of mixed waste to achieve diversion. Source separation ismandatory in an increasing number of jurisdictions that have high diversion goals. The impactof separation being mandatory is discussed further in the next subsection.
Not only is source separation of waste into three streams achievable, many jurisdictionsexamined during the research provide separate regular collection of up to five streams (e.g.glass, plastic and metal containers, paper and cardboard, food scraps and garbage).
There is a common perception that a lack of space prevents a large number of properties frombeing able to participate in multi-stream waste collection programs. Based on themunicipalities examined, the vast majority of properties are able to participate in the programand do not encounter barriers related to space limitations.
Mandatory Programs and Clear StandardsMandatory programs were both the most common and the most preferred approach amongmunicipalities examined. Mandatory programs not only reinforce norms and standardize therequirements from building to building but also increase participation. These benefits werenoted even in the municipalities that did not directly service the sector.
As an extension of this finding, the most successful programs in the municipalities examinedhave consistent sorting requirements enforced in all spheres of life such as home, work andschool.
In addition to providing mandatory service, other elements of successful programs can be mademandatory. One example is providing equally convenient access to containers for all wastestreams, and integrating this into building design. Many municipalities in North Americaconsider colocating waste streams as a best practice. Colocation prioritizes equal convenienceand access to all waste streams by siting container locations together, and can be achieved byestablishing enforceable developer standards. Some North American municipalities have begunincluding colocation in their standards which in turn are enforceable with bylaws andordinances. This emphasis on a user centric program design moves the focus of wastemanagement from being an “out of sight, out of mind” issue to becoming embedded in buildingdesign and a recognized process that contributes to sustainability.
How Communal Waste is CollectedOwing to the diversity of building stock the research revealed that municipalities commonlyused more than one, and sometimes up to five, distinct methods of collection to ensure thatservice can be provided to all building types and sizes.
Page 27 of 94

Business Case City Operations | Waste Services
Flexibility in container offerings was key to meeting the needs of the properties and residents.Many municipalities opt to utilize the smallest container size required while still ensuringadequate waste storage. This flexibility helps municipalities “right size” combinations ofcontainers to suit the layout of each property. Smaller containers may also help decreaseopportunities for illegal dumping and additional contamination.
Underground containers are becoming more common in Europe as a method of providingconvenient access while working with above ground space constraints and aesthetics of thestreetscape design. However, the styles of underground collection utilized in Europe are notcommonly available in North America. So while this technology has been successful in theEuropean jurisdictions researched, it requires further investigation and reviews of applicationsin North America to determine suitability for Edmonton.
The Role of Education and OutreachAll the sources examined emphasized the importance of supporting the establishment of newbehaviours in both residents and property management. The research showed that educationand a convenient, well planned program should work hand in hand to achieve success.
Education in the multi-unit sector requires a more sustained effort compared to the single unitsector, because of the challenges associated with higher resident turnover. Dedicated teamsthat provide logistical help to building managers (e.g. identifying optimal container types andlocations) as well as educational information for managers and residents are critical to thesuccess of a mandatory source separation program. Teams need to work consistently ondeveloping relationships with property managers because strong relationships with propertymanagers are considered as valuable to program success as having well-supported residents.
6.2. Regulated Utility Model
The regulated utility model presents an advantage that ensures all residents and propertymanagers are provided with the same high standard of service and educational supportregardless of dwelling type. The research has demonstrated that municipalities achieve themost success in increasing waste diversion through source separation when expectations areclear and consistently enforced across all sectors. Consistent expectations for sorting in allspheres of life help to solidify the formation of positive and responsible waste habits.
This consistency is more difficult to achieve and enforce where properties can enter into theirown agreements with service providers. Municipalities interviewed during the researchhighlighted how non-regulated service introduces the possibility of disparity. The regulatedmodel delivers specific benefits related to service equity, long-term planning and financing, andthe design and implementation of consistent standards and incentives to support strategicpolicy objectives. These benefits are particularly relevant as the City implements the WasteStrategy, with new facilities and programs coming online and the diversion forecast expected totrend sharply upward as part of the ongoing transformation of the waste management system.
Page 28 of 94

Business Case City Operations | Waste Services
7. High Level OptionsThe research revealed a variety of components that can be used in a communal sourceseparation program. The components were grouped into six categories, as described below. Anexplanation of the evaluation process is provided in Section 8, and the findings are discussed inSection 10.
7.1. Method of Separating Food Scraps and Recyclables
Two primary approaches were identified:● Source Separation: The majority of the research pointed to a three (or more) stream
source separated waste collection program, similar to the expectations in place for thecurbside program.
● Centralized Processing: One jurisdiction researched uses an approach that isconceptually similar to Edmonton’s current system. Waste is collected in two streams(garbage and recycling), with centralized processing facilities used to separate organicsfor further diversion.
7.2. Method of Collection
A wide variety of collection methods were identified for communal collection programs. Thesemethods included mobile collection depots, waste drop off sites, a range of above groundcontainers such as carts and bins, as well as underground containers and pneumatic collectionsystems.
7.3. Resident Support
A number of resident focused support mechanisms were identified, such as the provision ofin-unit containers (such as kitchen catchers or totes), ambassador programs and a range ofeducational and outreach campaign components.
7.4. Property Management Relationship
Supports for property management were catalogued separately from resident supports toaccount for the difference in needs. Property manager supports included a range of educationalmaterials, toolkits and customer service approaches such as stakeholder working groups anddedicated customer service teams.
7.5. Financial Mechanisms
A small number of financial incentives were identified, including the possibility of ratereduction for streams with low contamination, variable rates based on volume of waste set out,and credits that could be used to encourage desired waste behaviour.
Page 29 of 94
Business Case City Operations | Waste Services
7.6. Regulatory Mechanisms
A range of regulatory mechanisms were also found. Regulations can be used to control howspace for waste is designed in new properties (developer standards), ease of access to all threestream disposal points (colocation), the role of chutes (chute closure regulations), and to setvolume limits.
8. Options Analysis Methodology
8.1. Overview of Analysis Approach
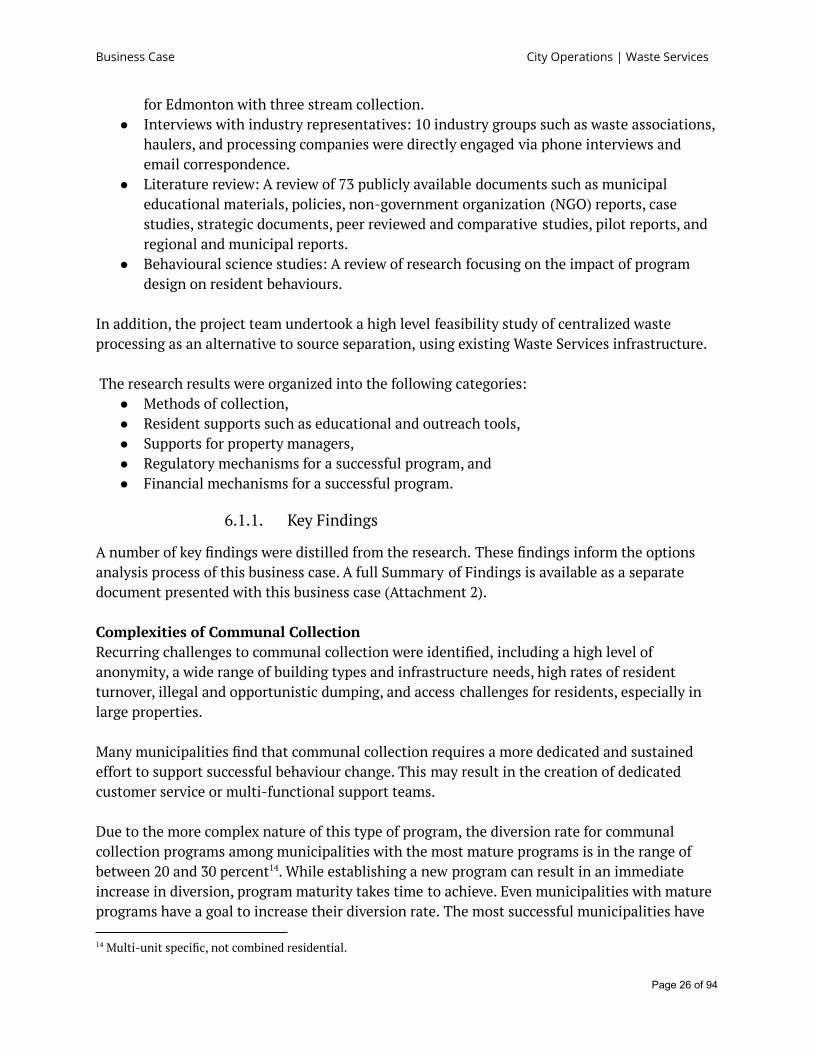
The approach that was taken to evaluate options for the communal collection program wasiterative and integrated feedback from public engagement activities after each phase ofanalysis. As shown in Figure 5, public engagement was interwoven between rounds of analysisto ensure that the recommendations were well aligned from multiple perspectives.
Figure 5: Overall Options Analysis Methodology and Process
The options considered for the communal collection program were evaluated individually, tohelp give the program flexibility to address the variety of needs in communal collection.
A three step process (outlined in Figure 6) was used to narrow down potential options for thisbusiness case. The process ensured that the analysis was done in a consultative and structuredenvironment. Notes and results were recorded transparently and in detail to allow the projectteam to provide critical feedback and make adjustments as necessary. Results from each phaseof analysis are included as Appendices to this document.
Page 30 of 94

Business Case City Operations | Waste Services
Figure 6: Business Case Option Analysis Steps and Evaluation Criteria
8.2. Options Analysis Stages
8.2.1. Stage One - Screening Criteria
The first stage of the evaluation addressed options identified from the research, and sought toeliminate options that would not work in Edmonton. High level criteria were applied, focusingon strategic/regulatory alignment and operational feasibility. An option which failed one ormore of the Stage One criteria was considered non-viable. Eliminated options were not carriedforward to public engagement or further stages of the options analysis process.
Criteria for Stage One evaluation were:● Scalability - the ability for the option to adjust to meet population growth forecasts and
adapt to program changes.● City Alignment - alignment with corporate and branch goals and outcomes.● Precedence - whether or not the waste industry has established the option for
residential collection.● Legislative Alignment - alignment with policy or legislation from higher levels of
government.
Page 31 of 94

Business Case City Operations | Waste Services
After the non-viable options were screened out, Phase One of public engagement wasconducted. Phase One was designed to learn about stakeholders’ needs, barriers and potentialsolutions for source separation. Stakeholders were asked to participate in the engagementprocess in an Advise capacity along the City of Edmonton’s Public Engagement Spectrum.Participants were invited to share feedback and perspectives considered for policies, programs,projects, or services. Stakeholders were organized into three primary groups: managers(property managers, condo board members, and developers), service providers (waste haulersand processors), and residents.
The focus of manager and service provider engagement was to gain feedback on the optionsthat passed through the Stage One analysis; this feedback was then used in Stage Twoevaluation. Managers and service providers participated in one of three identical onlineworkshops and a unique Engaged Edmonton web page where they could learn about the topicsof program rollout, collection containers, regulatory requirements and incentives, educationand outreach, and program success measurements. The Engaged Edmonton site also allowedstakeholders to ask questions of the project team and contribute to peer-to-peer discussion.There were a total of 767 site visitors to the Engaged Edmonton page and 20 active participantswho left a combined total of 61 comments and four questions for the project team. A total of 67managers and service providers participated in the three online workshops.
A total of 52 residents were engaged through eight focus groups and ten one-on-one interviewsin Phase One. The engagements were designed to learn about potential barriers to this programand solutions to those barriers.
Two stream waste collection and the utilization of processing-only options to separate foodscraps were eliminated based on Stage One criteria. Still, additional evaluation was conductedin Stage One and Two to ensure these options were eliminated only after a complete andcomprehensive review.
Results for Stage One of evaluation are available in more detail in Appendix A.
8.2.2. Stage Two - Evaluation Criteria
The second stage of evaluation utilized a more comprehensive criteria list to further analyzethe benefit and impact of the remaining options. In contrast to the Stage One evaluation, whichused yes/no answers, the Stage Two evaluation used a scoring scale to indicate the level ofcompliance with each criteria. The criteria used in Stage Two are presented in Table 4.
In addition to the criteria presented in Table 4, the impact on diversion was used as a criteriaonly to assess two stream versus three stream source separation. All other options fall underone of these two overarching options.
Table 4: Stage Two Evaluation Criteria
Page 32 of 94

Business Case City Operations | Waste Services
Organizational Impact and Alignment
Alignment with corporate/branch goals and outcomesEvaluates how well the option reflects the priorities outlined in Waste Services and City ofEdmonton documents such as the Waste Strategy and City Plan.
Alignment of expectation of residents between curbside and communal collection programsConsiders the option’s ability to maintain consistency across programs with regards tosorting and waste behaviour.
Impact to the City’s ability to deliver existing programs and servicesScoring represents the option’s effects on the City of Edmonton’s ability to provide existingservices (e.g. traffic safety, road services, etc.) but excluding Waste Services.
Financial Impact
Impact on capital costScores represent the high level estimate of an option’s capital cost compared to the currentstate. This can best be described as the difference between current state and future state.
Impact on net operating costScores represent the high level estimate of an option’s impact on operating expensescompared to the current state. Net operating costs include revenue other than rate revenue(i.e. program revenue such as revenue from compost sales).
Operational Impact
Impact on operational productivity, operating efficiency and capacityScores an option’s ability to increase collection effectiveness and efficiency, and on theoperational capacity of Waste Services (i.e. how many dwelling units can be serviced in aday).
Impact on operational reliability and flexibilityRefers to the option’s ability to avoid downtime or time lost due to risks like equipmentfailure. Flexibility refers to the option’s ability to adapt to problems regarding reliability.
Operational adaptabilityGrades an option’s ability to be maintained in a period of time, and over time to adapt to thechanging needs of the properties in the communal collection program, such as densificationand development.
Occupational health and safetyScores an option’s impact on incidents and lost-time injuries.
Impact on feedstock quality and illegal dumpingScores an option’s impact on waste product quality (i.e. the perceived quality/contaminationof recycling and organics before it is processed), or reduction to illegal dumping.
For the “Processing” options category: Scores an option’s impact on the quality of waste
Page 33 of 94
Business Case City Operations | Waste Services
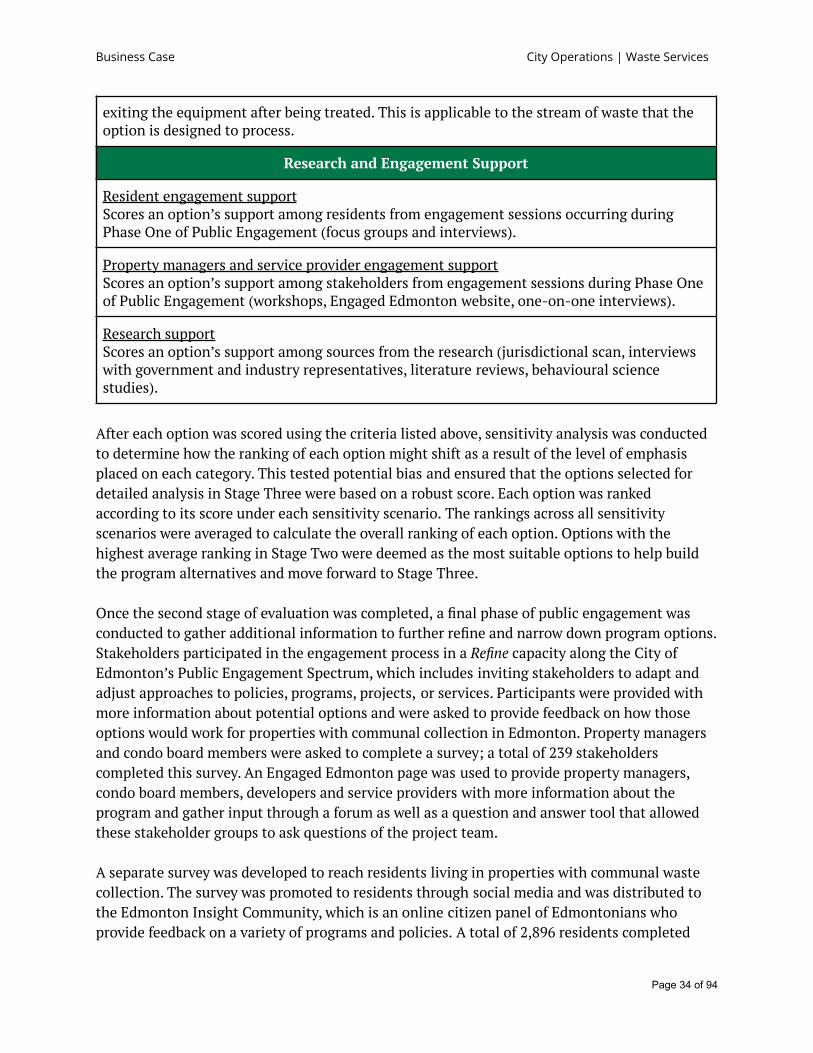
exiting the equipment after being treated. This is applicable to the stream of waste that theoption is designed to process.
Research and Engagement Support
Resident engagement supportScores an option’s support among residents from engagement sessions occurring duringPhase One of Public Engagement (focus groups and interviews).
Property managers and service provider engagement supportScores an option’s support among stakeholders from engagement sessions during Phase Oneof Public Engagement (workshops, Engaged Edmonton website, one-on-one interviews).
Research supportScores an option’s support among sources from the research (jurisdictional scan, interviewswith government and industry representatives, literature reviews, behavioural sciencestudies).
After each option was scored using the criteria listed above, sensitivity analysis was conductedto determine how the ranking of each option might shift as a result of the level of emphasisplaced on each category. This tested potential bias and ensured that the options selected fordetailed analysis in Stage Three were based on a robust score. Each option was rankedaccording to its score under each sensitivity scenario. The rankings across all sensitivityscenarios were averaged to calculate the overall ranking of each option. Options with thehighest average ranking in Stage Two were deemed as the most suitable options to help buildthe program alternatives and move forward to Stage Three.
Once the second stage of evaluation was completed, a final phase of public engagement wasconducted to gather additional information to further refine and narrow down program options.Stakeholders participated in the engagement process in a Refine capacity along the City ofEdmonton’s Public Engagement Spectrum, which includes inviting stakeholders to adapt andadjust approaches to policies, programs, projects, or services. Participants were provided withmore information about potential options and were asked to provide feedback on how thoseoptions would work for properties with communal collection in Edmonton. Property managersand condo board members were asked to complete a survey; a total of 239 stakeholderscompleted this survey. An Engaged Edmonton page was used to provide property managers,condo board members, developers and service providers with more information about theprogram and gather input through a forum as well as a question and answer tool that allowedthese stakeholder groups to ask questions of the project team.
A separate survey was developed to reach residents living in properties with communal wastecollection. The survey was promoted to residents through social media and was distributed tothe Edmonton Insight Community, which is an online citizen panel of Edmontonians whoprovide feedback on a variety of programs and policies. A total of 2,896 residents completed
Page 34 of 94
Business Case City Operations | Waste Services
this survey.
Results for Stage Two of evaluation and sensitivity analysis are available in more detail inAppendix B.
8.2.3. Stage Three - Final Evaluation Criteria
In the final stage of evaluation, four complete packages of options were created and evaluatedas the program alternatives. These alternatives were evaluated using a triple bottom lineapproach, plus a risk assessment. The package with the highest weighted score is therecommended alternative in this business case.
The following criteria were used for the Stage Three evaluation:● Social Impact and Public Preference - This criteria category evaluated the preferences
of both residents and property managers based on the Phase Two Public Engagementresults. Feedback from residents and managers was considered independently andscored on a scale of one to five; a score of one meant that there was no support for anitem and a score of five meant that there was very high support. The scores were thenadded together to provide the raw social score for the package.
● Environmental Impact on Diversion Rate - This criteria category considered theestimated increase in the diversion rate that each alternative was expected to achieve.Increases in diversion due to Refused Drive Fuel production were not included in thisassessment, reflecting the City’s commitment to the zero waste framework thatprioritizes recycling and organics processing over energy recovery. Alternatives withhigher estimated diversion rates scored higher.
● Net Present Value (NPV) and Cost Analysis - Scoring in this category was calculatedbased on a 24 year financial model that considered the forecasted operating and capitalexpenses related to implementation of the alternative. The period selected for the NPVanalysis was based on the shortest common period of the expected life cycle of theassets. Once scored, options with lower NPV values received higher scores relative tooptions with higher NPV values.
● Risk Assessment - This criteria category evaluated the risks unique to each alternative.Unique risks were identified and scored based on likelihood and impact. The “totalpossible risk” for each package was calculated by assigning the maximum likelihood andmaximum impact to each risk and taking the sum of risk scores. The “actual total risk”for each package was calculated by taking the sum of individual risks. The risk score ofeach alternative was then determined by calculating the risk avoided, which is thedifference between the actual total risk and the total possible risk. Common risksbetween all alternatives were scored separately in the same manner but excluded fromthe overall risk score as the impact would be equal for each package of alternatives.
The scoring for Stage Three packages was based on equal weighting of all criteria. Results forStage Three of evaluation are available in more detail in Appendix C.
Page 35 of 94

Business Case City Operations | Waste Services
9. Summary of Public Engagement ResultsAs described in the previous section, two public engagement phases were interwoven betweenrounds of options analysis. This ensured that the feedback received was integrated into theanalysis, and that stakeholders were provided with the latest analysis. The What We HeardReports for both Phase One and Phase Two of Public Engagement are available in separatedocuments presented with this business case (Attachments 3 and 4).
9.1. Phase One
Feedback gathered during Phase One of public engagement was used to determine theengagement scores in the Stage One options analysis. Phase One of public engagement foundthat residents want supports to increase their participation; these supports could include beingprovided with food scraps pails and ongoing education that teaches them how to sort theirwaste, why it is important, and the impact their efforts have. Convenience and access to allstreams of containers were identified as paramount when it came to overcoming barriers,including easily accessible collection containers and colocation of waste streams. Propertymanagers similarly want focused supports, and identified that the customer service relationshipbetween themselves and the City is a critical component of a successful program. Specifically,collaborative support from the City will be important to overcome challenges with space,infrastructure challenges and site logistics. Developers and property managers also identifiedthe need for developer standards for new properties to be established and enforced to ensurethat waste is incorporated into building designs and to make colocation of collection containerspossible.
9.2. Phase Two
Phase Two of public engagement focused on residents and managers. For the purpose of thisphase of engagement, managers refers to property managers, condo board members and thosein equivalent roles.
Based on the final public engagement results, residents communicated that a variety of tacticswould be necessary to support the diverse needs of the sector, and that it was particularlyimportant to have step by step guides demonstrating how to sort food scraps properly and afood scraps pail to use in their kitchens. Residents also felt that clean and well lit communalwaste areas, and waste containers being located next to each other in the same common area,were both very important factors to help with proper sorting. Managers agreed that colocationof communal containers is important for resident convenience and compliance, however manywere concerned that limited space in communal waste areas may limit their ability to placecommunal containers beside each other.
The majority of managers felt that one or more of the collection container options presented(e.g. front load bins or carts) would work for their properties. However, many managers were
Page 36 of 94

Business Case City Operations | Waste Services
still quite concerned about lack of space for more collection containers onsite and requestedone-on-one discussions with the City to find a solution that does not require expensiveinfrastructure changes. Some managers also expressed hope for grants or rebates to help withthe cost of infrastructure changes, and some would like to participate in working groups to helpshape the evolution of the program.
Both residents and managers had a strong preference for keeping chutes open. Rather thanclosing chutes, they preferred to find ways to work with chutes to achieve three streamcollection at properties. Two options that received support were 1) prioritizing convenientdisposal of food scraps by modifying chutes to accept food scraps only and adding containersfor recycling and garbage in communal waste areas, or 2) adding recycling and food scrapscontainers near garbage chutes on each floor.
Both residents and managers shared concerns about tenants not sorting their waste properlyand felt that there would be challenges with enforcing waste sorting in multi-unit properties.Residents and managers also shared concerns about potential increased costs and new fees.Many survey respondents from both the manager and resident groups were also concerned withmess, smell, insects and animals.
In addition, residents stated that regularly receiving information about the results of wastesorting efforts would help motivate them to sort their waste properly; managers similarly feltthat regularly receiving information about the percentage of waste not sent to landfill, or thecontamination rate in different waste streams would help them monitor the impacts of theprogram.
10. Viable AlternativesThe methodology presented in Section 8 was used to identify preferred options and generatethe alternatives presented in this business case. The results of the analysis are described indetail below.
10.1. Method of Separating Food Scraps and Recyclables
The current method of collecting garbage and recycling as two streams of waste was evaluatedas an alternative to a three stream source separated collection program. This method was ruledout as an option in Stage Two. Although it is generally accepted that making enhancements tothe processing facilities at the EWMC may result in increased diversion, it was clear from theresearch that the most effective way to achieve cleaner streams (with higher value end uses) isthrough source separation. It was determined that maintaining a two stream approach wouldprevent the City from further progressing towards the strategic goal of 90 percent diversionfrom landfill. Furthermore, since both the Corporate Business Plan and the Waste Strategycommit to a source separation program, continuing the status quo would be a departure fromthe approved direction.
Page 37 of 94

Business Case City Operations | Waste Services
Three stream source separated collection is, therefore, recommended for inclusion in allalternatives and forms the basis upon which the alternative packages are proposed.
10.2. Method of Collection
Based on the Stage Two analysis, a range of collection containers were included in the finalconsideration for each waste stream. A range of container types and sizes will need to be usedto ensure diversion programs can meet infrastructure, space and access limitations presentedby the diverse building stock. The following subsections provide details about the containertypes and sizes that were included in the alternatives.
10.2.1. Front Load Bins
Front load bins are the primary type of container currently used to provide communalcollection service. These bins range in size from two to eight cubic yards and are currently usedfor both recycling and garbage. These containers scored favourably in Stage Two and wereincluded in the recommended alternatives.
10.2.2. Carts
Carts are currently being distributed to residents receiving curbside collection service. Carts areavailable in a smaller range of sizes than front load bins, typically 120 litres, 240 litres and 360litres.
Carts scored well when considered for the collection of garbage and food scraps. There is anopportunity to operate efficiently by integrating curbside and communal collection serviceswhere possible. If carts can be used for communal collection of garbage and food scraps, thentrucks that are collecting carts from a given neighbourhood can service both curbside andcommunal collection customers. This will result in efficiencies, which in turn will result in amore stable rate for the utility rate payer, reduced collection vehicle traffic, decreased impact toneighbourhoods, infrastructure and the environment. Carts for garbage and food scrapscollection have been included in all alternatives.
Despite their high score when used to collect garbage and organics, carts did not score high forthe collection of recycling, and were not considered for the recycling stream in the finalalternatives. As noted earlier, recyclable materials are bulky in nature and make up a largeportion of communal collection waste. Given the relatively small size of carts (up to 360 litres),they would fill quickly and may not be large enough to fit multiple bulky items such as largecardboard boxes. It was determined that other methods of collection such as front load binswould be more appropriate; larger containers means that the size of the container does notbecome a barrier or deterrent to recycling. In addition, front load bins are available in a rangeof sizes, meaning that it is still possible to ensure right-sizing for each property.
Furthermore, as recycling carts are not currently offered as part of the curbside collection
Page 38 of 94

Business Case City Operations | Waste Services
program, there is no opportunity for integrated collection services. Offering recycling carts tocommunal collection customers would require a dedicated fleet. This specialized service wouldbe very costly with no notable benefits.
Carts for the recycling stream are, therefore, not recommended at this time for inclusion in thealternatives. If carts are used for curbside recycling collection in the future, they may become aviable alternative for smaller communal collection sites.
10.2.3. Roll-off Compactors and Manual Collection
Despite their lower score in the Stage Two options analysis, roll-off compactors for garbage andrecycling, and manual (bag) collection of recycling were not eliminated from furtherconsideration. These methods will continue to be used to address specific building situations. Itshould be noted that bag collection is not preferred and efforts will be made to limit itsapplication. Waste Services currently uses roll-off compactors for certain properties with 250 ormore units; manual collection of recycling is used in circumstances where space is a limitingfactor for front load bins. As these methods of collection are already accounted for in thecurrent operating budget and resource availability, the impact of these methods on the businesscase was considered negligible.
Both roll-off compactors and manual collection of recycling will continue to be available, butwill not be included in the alternatives presented in this business case.
10.2.4. Underground Collection
Underground containers are available in multiple styles. For the Stage Two analysis, twocategories of underground containers were assessed separately: those that require specializedequipment, and those that can be serviced with standard front load vehicles. Althoughunderground containers that require specialized equipment did not score favourably in StageTwo, underground containers that can be serviced with front load vehicles did. However,further analysis of the cost and logistics determined that this method of collection offers fewbenefits compared to front load bins.
Underground containers offer the same or less capacity as front load bins, while occupying asimilar footprint and with significantly higher capital costs. The containers pose additionalrisks and are less adaptable to change as underground infrastructure is more permanent andless forgiving should containers need to be adjusted to meet future building needs or programchanges. Furthermore, the ownership model would be very complex and would requiresignificant study to find a solution.
The advantages of underground containers appear to be limited to improved aesthetics. Thismeans that these containers typically do not require enclosures or screens to improveaesthetics, saving money and space on private property.
Page 39 of 94
Business Case City Operations | Waste Services
Waste Services acknowledges that the future may bring new styles of underground containersthat have the potential to provide better value for money and will continue to review andevaluate technologies as part of the regularly scheduled program review to determine theirsuitability for Edmonton.
Based on these findings, underground collection was not included in the alternatives for thisbusiness case.
10.3. Volume Allocation and Container Sizes
Extensive analysis was completed to determine a volume allocation per unit receivingcommunal collection. The analysis used waste composition data from multi-unit sites inEdmonton, data from the curbside program, as well as waste composition data and allocationformulas from other municipalities. The result is volume and tonnage allocations for eachstream.
It was determined that the recycling stream would require the highest volume allocation perunit and would therefore require larger containers, while garbage and food scraps would requiresmaller containers.
For the food scraps stream, carts and smaller front load bins were preferred as food scraps aredense, resulting in heavier weights for a given volume. Based on the density, bins measuringtwo cubic yards are the largest container that will be used for food scraps collection. As a result,multiple front load bins measuring two cubic yards may be required to meet the volumeallocation for a specific property.
For the garbage stream both carts and bins can be used, based on the size of the property. Ingeneral once source separation is implemented, removing both recycling and food scraps fromthe garbage stream may result in smaller garbage containers being suitable.
The number and size of containers for each stream will be calculated based on the volumeallocation per unit per stream and the number of units per building. Waste Services will utilizea range of container sizes to ensure “right-sizing” occurs for each building. Right-sizing will aidwith concerns regarding smell or pests in food scraps containers as well as providing flexibilityto fit space concerns of a particular site.
While capacity allocated for the food scraps and recycling streams are based on the expectedvolume through the allocation formula, the total capacity for the garbage stream includes anallowance of some additional capacity to assist with adaptation to the program.
While there is a preference to use the smallest container size possible to provide locationflexibility, there is also a threshold at which a large number of carts would be inefficient forcollection and require more space for storage than a front load bin of equivalent volume. At
Page 40 of 94

Business Case City Operations | Waste Services
that threshold, a front load bin would be preferred.
Table 5 shows the container types and sizes that have been included in all alternatives:
Table 5: Recommended Containers and Sizes for Each Collection Stream
Waste Stream Container Style and Size
Garbage240L Cart360L Cart2, 3, 4, 6, 8 yd 3 Front load bins
Recycling 2, 3, 4, 6, 8 yd 3 Front load bins
Food Scraps240L Cart360L Cart2 yd3 Front load bins
10.4. Resident and Property Manager SupportsResearch and engagement have both shown that education and other supports should be top ofmind when a mandatory source separation program is designed and implemented. Withouteffective and ongoing education, programs are less likely to reach their full potential. Thissection discusses the resident and property manager supports for the proposed communalcollection program.
10.4.1. Resident Supports
Annual marketing and communications campaigns, ongoing education, and in-unit containerswere the resident support components that scored favourably in the Stage Two analysis, andwere further analyzed in Stage Three.
Throughout the research and analysis it became clear that a targeted and sustained effortwould be required to overcome challenges such as resident turnover and anonymity. Withoutongoing education it is expected that adoption and participation rates will peak a few monthsafter rollout and decline over the following years, resulting in an increase in contamination anda further stagnation of the diversion rate.
There was particularly strong support in all phases of public engagement for ongoing educationprograms, indicating that both residents and property managers felt like this dedicated andtargeted education approach is critical to ensuring residents are informed and engaged.
A high level of awareness and education will be achieved by delivering ongoing and targetedcampaigns. This includes a comprehensive mix of digital and traditional marketing tactics suchas outdoor advertising, digital communications, multimedia assets, print resources, a strong
Page 41 of 94

Business Case City Operations | Waste Services
web presence with downloadable resources and in-person interactions through outreachactivities. Targeted campaigns will allow more face to face interactions with residents to furthereducate, answer questions and attempt to overcome any accessibility and/or language barriers.
To compliment the above, the provision of food scraps pails will be an important tool toencourage positive behaviors and participation. A desire to receive food scraps pails was heardthrough Phase One of Public Engagement. Food scraps pails were provided to all curbsidecollection customers as well.
While there was some interest expressed during public engagement in having an ambassadorprogram, residents did not communicate a corresponding interest in becoming an ambassadorthemselves. The research showed that some municipalities use these programs to aid withshifting waste behaviours at a building level, but at this time there is a lack of supporting datato show the efficacy of such programs. Further work is required to determine how effective thistype of program would be. An ambassador program is not recommended at this time.
Based on this analysis, ongoing education, annual targeted campaigns, and the provision offood scraps pails have been included as resident supports in all alternatives.
10.4.2. Property Management Supports
Effective and ongoing support for property managers also scored very high in Stage Twoanalysis. In particular, managers requested ongoing communications and updates,City-developed resources, and materials that they could share with residents. Providing thesesupports to property managers would help to facilitate a positive relationship between propertymanagers and the City.
Property managers are a vital link to ensuring that residents have the necessary information tobe able to participate. Resources such as a toolkit (consisting of brochures, posters, doorhangers, newsletters, etc.), access to dedicated customer support, and ongoing education willbuild their capacity to support waste programs. Building resources similarly would includematerials that property managers could distribute to their residents, display in properties orrequest on their residents’ behalf.
Another component which scored favourably in Stage Two was the creation of a stakeholderworking group. Working groups can be used to help prepare for and implement mandatorywaste sorting programs. These groups provide a way for stakeholders to give ongoing input intoa project and can help build a constructive relationship between the City and stakeholders. Theestablishment of a stakeholder working group could be facilitated over the next few years and,while recommended, would not require any additional funding and is therefore not included inthe evaluation of the alternatives at this time.
Based on this analysis, sustained and effective support for property managers via educational
Page 42 of 94
Business Case City Operations | Waste Services
resources, printed materials, and staff resources are very important and have been included inthe alternatives.
10.5. Regulatory Mechanisms
The research shows that a successful mandatory source separation program for communalcollection must be accompanied by a variety of regulatory tools to support program success.
10.5.1. Enforceable Developer Standards
Ensuring the enforceability of developer standards was the highest scoring regulatorymechanism. Developer design standards will be needed to set out criteria for new buildingsrelated to the design of indoor and outdoor waste sorting and storage areas, acceptableapplications of chutes, access criteria for collection vehicles, and may also address themandatory separation of commercial and residential waste in mixed-use properties.
Mandatory separation of commercial and residential waste in mixed-use properties becamestandard practice for Waste Services when Waste Services stopped providing collection servicesto the commercial sector. As commercial tenants and residents are not serviced by the samecollector, it is not recommended at this time to allow waste to be stored or collected together.This practice can lead to one building user group being responsible for the management of theother building users' waste. If commercial tenants use residential containers, the residentialcontainers will not have sufficient capacity for the residential waste.
Research also reflects the beneficial impact of separate storage and collection of waste fromdifferent sectors on the overall participation, compliance and diversion from both sectors. Assuch, and with consideration for the challenges that shared containers present to the City'spolicy not to provide commercial waste collection services, it was determined that WasteServices should continue to require separate waste storage areas for each building user group.Understanding the potential impacts of this separation requirement, Waste Services willcontinue to work with internal stakeholders and the development sector to ensure that designguidelines clearly outline best practices for the separate collection and storage of residentialand commercial waste in a manner that does not compromise city building outcomes.
From the analysis it is clear that for developer standards to be successful, they must beenforceable through bylaw. This ensures that residents have equivalent service across differentbuilding styles. Enforceable developer standards were also supported by stakeholders in PhaseOne of Public Engagement.
This business case recommends that no changes be made to the current requirement formandatory separation of residential and ICI waste in mixed-use buildings. Mandatoryseparation along with other enforceable developer standards such as the design of waste areasand access criteria are recommended for all alternatives.
Page 43 of 94

Business Case City Operations | Waste Services
It is recognized that work with both internal and external stakeholders in developing designstandards is required. The effectiveness of the developer standards and its role in making themandatory three stream source separation program successful will be realized if the City workswith designers, builders, developers and property managers to create mutually beneficialsolutions that can be flexible and adaptable to support a well designed City as well as asuccessful source separation program.
10.5.2. Colocation of Waste Streams
The research and engagement show how important it is for residents to have equallyconvenient access to all waste streams to encourage participation in sorting and decreasecontamination. Equal access to all streams, referred to in this business case as colocation,means that residents would have the same access to dispose of all three streams. In most cases,this means that containers for garbage, recycling and food scraps need to be placed next to eachother in the same area or room. In other cases, this may mean that properties with garbagechutes require a mechanism to allow for the disposal of the other streams near the chutelocation on every floor. Colocation is in contrast to placing a garbage container or havinggarbage chute access in one location, with food scraps and recycling containers elsewhere.
Due to the operational, financial and significant strategic impacts of colocation, bothmandatory and voluntary colocation were included in the alternatives.
10.5.3. Chute Closures
Waste chutes are constructed in some multi-unit properties to make disposing of waste moreconvenient for residents. Most chutes are for garbage disposal only, forcing residents who wishto dispose of recyclables to go to the recycling container, typically on the main floor, parkinglot, or underground parkade of a building. The remote location of the recycling containers is abarrier to recycling, in contrast to the on-floor facility for disposing of garbage, and the lack ofconvenience associated with disposing of recyclables often leads to poor waste sortingbehaviour.
Based on the Stage Two options analysis, closing chutes scored high due to enhanced collectorsafety and reduced contamination of waste streams. Residents indicated in Phase One of PublicEngagement that maintaining chutes would provide easy opportunities to avoid doing “theright thing”.
In light of this discussion and the impact chutes can have on resident behaviour, bothmandatory and voluntary chute closures were included in the Stage Three analysis.
10.5.4. Volume Limits and an Excess Waste Program
Setting volume limits and providing an excess waste program scored well in Stage Two. Volumelimits would be based on the allocation formula that determines the container volume needed
Page 44 of 94

Business Case City Operations | Waste Services
for each waste stream at every property. Volume limits provide motivation to residents andproperty managers to participate in source separated waste programs and work towardsreducing waste. As the curbside program has also adopted volume limits based on cart size, itwould be equitable to have similar expectations for the communal collection program.
While volume limits are seen as an important success factor for source separation, it wasdetermined that some properties may require additional service. An excess waste programcould be developed to provide additional service. An excess waste program for communalcollection is more complex than for the curbside program as it impacts all residents of abuilding. The cost and details of the program need to be equitable while still encouragingresidents to comply with source separation.
The alternatives in this business case are based on the premise that volume limits will beenforced. Waste Services will continue working on details and logistics of an excess wasteprogram, which will be presented at a later date. Details on volume allocations can be found inTables D1 and D2 in Appendix D.
10.6. Financial Mechanisms
Financial mechanisms are often used as an incentive to encourage good waste sortingbehaviour. A variety of financial mechanisms were considered, including rate reductions(applied on a regular basis and awarded based on waste sorting behaviour), one time credits(fixed discounts or incentives for displaying ideal waste behaviour), and variable pricing (therate paid is dependent on the amount of waste discarded or size of container used). Thevariable pricing option scored favourably in Stage Two and was selected for furtherconsideration. Variable pricing is equivalent to the pricing model used in the curbsidecollection program.
10.6.1. Variable Pricing
A variable rate structure would be based on the quantity of garbage set out for collection, takinginto consideration the size of the garbage container and the frequency of collection. It isproposed that properties receiving communal collection would have the opportunity to reducethe amount of their utility bill based on a demonstrated ability to reduce garbage.
Variable pricing could apply to any of the alternatives in this business case. The details andexact cost structure of a variable pricing model is not included in this business case but wouldbe determined as part of a utility rate approval in the future once the program implementationis underway.
11. Program AlternativesBased on the information detailed above, packages of components were developed and analyzedas the Stage Three analysis. Each package is an alternative. As described previously, two stream
Page 45 of 94

Business Case City Operations | Waste Services
collection was eliminated in Stage Two, and it is for this reason that none of the alternativesinclude the status quo.
There were two primary drivers influencing the final scoring of the alternatives: whethercolocation was mandatory or voluntary, and whether chute closure was mandatory orvoluntary. The effect of these drivers on the presentation of the alternatives is explained below.
All alternatives were based on a 24 year life cycle. The total resources required for allalternatives have been included in the financial analysis and are a mix of permanent andtemporary FTEs. In all alternatives the requirement for inspectors, education and outreach, GISmapping, and customer support staff are the same.
A detailed list of assumptions for all alternatives can be found in Appendix D.
11.1. Colocation
Mandatory colocation prioritizes equal convenience and access to all waste streams.Alternatives featuring mandatory colocation garnered a higher social score as residents preferthe convenience and colocation is projected to result in a higher diversion potential, lowercontamination and more significant behaviour change.
While both mandatory and voluntary colocation alternatives will use the same types ofcontainers, it is expected that for the alternatives that feature mandatory colocation there willbe a higher number of containers overall, and more smaller containers. As a result, morecollection staff are required to service the program, resulting in a slightly higher cost thanvoluntary colocation.
If colocation is voluntary, properties will receive the same total allocation of waste containervolume. However, since there is no requirement for containers for different streams to belocated next to each other, fewer larger containers would be required per property. As a result,fewer collection staff are required to service the sector. While fewer containers results in aslightly lower overall cost, it is anticipated that since residents may not have equal access to allthree streams, participation rates will be lower, contamination rates will be higher, and thediversion potential will be lower. These factors increase the risk that the City may not be able toachieve its diversion goal. This also carries an additional risk that residents and propertymanagers would perceive the distribution of fewer containers as a lower level of service fromthe City. While voluntary colocation was slightly preferred by property managers (compared tomandatory colocation), it was considerably less preferred by residents, resulting in a lowersocial score for alternatives without mandatory colocation.
11.2. Chute Closure
Mandatory chute closure would mean that all buildings in the City of Edmonton that currentlyhave garbage chutes would be required to close them. During public engagement, residents
Page 46 of 94

Business Case City Operations | Waste Services
identified that the convenience offered by chutes could tempt residents to sidestep programrequirements, resulting in higher contamination and lower participation. Although mandatingchute closure is therefore expected to result in a marginally higher diversion rate, it would alsobe difficult to enforce and could create accessibility challenges for some residents.
Currently, only about seven percent of properties and 17 percent of units have access to chutesin Edmonton. This means that the incremental increase in diversion resulting from mandatorychute closure is limited. Mandating chute closure would require significant effort and wouldresult in frustration for residents of those buildings. This approach received very low supportfrom residents and property managers, and also had a less favourable risk score.
Voluntary chute closure is a collaborative approach that involves assisting properties to closechutes where there is desire. This approach therefore carries less risk. Based on researchfindings, ongoing operation of chutes does not preclude colocation.
Chute closure was assumed to not have a financial impact on the City and therefore theapproach to chute closure did not change the cost of the alternatives. There is also nodifference in staff requirement.
The alternatives presented in Table 6 represent combinations of these primary drivers.
Table 6: Comparison of Alternatives
Parameter Alternative 1 Alternative 2 Alternative 3 Alternative 4
ChuteClosures Mandatory Voluntary Mandatory Voluntary
Colocation Mandatory Mandatory Voluntary Voluntary
PotentialDiversionIncrease
16% 16% 5% 4%
Costs andNPV
$29.2M Capital$91.0MOperating &Maintenance$-67.6M NPV
$29.2M Capital$91.0MOperating &Maintenance$-67.6M NPV
$25.8M Capital$81.9MOperating &Maintenance$-60.4M NPV
$25.8M Capital$81.9MOperating &Maintenance$-60.4M NPV
Total Score 69 78 62 71
As described in Section 8, the total score for each alternative in Table 6 is calculated based onfour equally weighted criteria. A higher score is desirable for all the criteria:
● A social score reflecting resident and property manager preferences elicited duringPublic Engagement.
Page 47 of 94

Business Case City Operations | Waste Services
● An environmental score based on the potential of each alternative to increase theprojected diversion rate.
● A net present value score based on the combined capital, and operating andmaintenance costs over a period of 24 years.
● A risk score that reflects risk avoided in each alternative.
The breakdown of the total score for each alternative (showing the contributions of eachcriteria ) is presented in Figure 7.
Figure 7: Stage Three Analysis Alternative Scoring Breakdown by Criteria
11.3. Summary of Alternatives
11.3.1. Alternative 1
As a result of mandatory colocation, the diversion potential for this alternative was higher thanthose without mandatory colocation. Colocation is anticipated to increase the projecteddiversion rate by as much as 16 percent. The cost of Alternative 1 is slightly higher thanalternatives without mandatory colocation, at $29.2 million in capital costs and $91.0 million inoperating and maintenance costs, with a negative NPV of $67.6 million. This alternative isanticipated to incur the most significant resistance from residents and property managers, asinfrastructure changes may be required to close chutes and to find ways to colocate wastestreams elsewhere on the property. This challenge lowered both the social preference score andcreated a less favourable risk score.
Alternative 1 is not recommended due to a low social score and less favourable risk score
Page 48 of 94

Business Case City Operations | Waste Services
when compared to Alternative 2.
11.3.2. Alternative 2
Alternative 2 differs from Alternative 1 by making chute closures voluntary. Alternative 2received the highest social score as a result of having the most support from both residents andproperty managers. As with Alternative 1, mandatory colocation is anticipated to increase theprojected diversion rate by as much as 16 percent, and results in $29.2 million in capital costsand $91.0 million in operating and maintenance costs, with a negative NPV of $67.6 million.The combined effect of mandatory colocation and voluntary chute closures results inAlternative 2 having the most favourable risk score, which contributes to Alternative 2 havingthe highest overall score.
Alternative 2 is the recommended alternative.
11.3.3. Alternative 3
Alternative 3 represents a combination of voluntary colocation and mandatory chute closure.Voluntary colocation results in a lower diversion potential than mandatory colocation and theanticipated increase to the projected diversion rate is only five percent. The impact of voluntarycolocation is slightly mitigated by mandatory chute closure, which puts all streams inproperties with chutes on equal ground in terms of convenience and access. This means thatresidents in properties with chutes will need to bring all three streams of their waste to thecentral waste sorting area(s). As colocation is not mandated, waste set out areas will notnecessarily have containers for all the three streams. One stream may be easier to access thanothers due to the container locations. This would be particularly difficult for residents withphysical limitations.
Due to the fact that colocation is voluntary, fewer containers will be required, so the cost islower at $25.8 million in capital costs, $81.9 million in operating and maintenance costs, and anegative NPV of $60.4 million.
Mandatory chute closures resulted in the lowest social preference score of all alternatives, aswell as the least favourable risk score. Alternative 3 has the lowest overall score of all thealternatives.
Alternative 3 is not recommended due to the low scoring in multiple criteria categories.
11.3.4. Alternative 4
Alternative 4 is a combination of voluntary colocation and voluntary chute closure. Thisalternative has the lowest diversion potential of all alternatives, offering only a four percentincrease to the projected diversion rate. As residents and property managers prefer to maintainchutes, Alternative 4 received a relatively high social score. While voluntary colocation poses
Page 49 of 94

Business Case City Operations | Waste Services
risks to the achievement of the diversion target, voluntary chute closure mitigates other risks,giving Alternative 4 a more favourable risk score than Alternative 3. Voluntary colocation has alower cost of $25.8 million in capital costs, $81.9 million in operating and maintenance costswith a negative NPV of $60.4 million.
Alternative 4 is the second highest scoring alternative overall, with a similar score toAlternative 1.
Alternative 4 is not recommended due to the low diversion potential.
11.4. Diversion Comparison
In 2020, the diversion rate was nine percent including collections and processing as well aswaste drop off programs. Table 7 below provides a comparison of the projected diversion ratesfor each alternative once the program has reached maturity, as well as the projected ratewithout the proposed program changes. As noted in Section 6, while some increase in diversioncan be realized immediately after full implementation of the program, it takes time for aprogram to mature and for residents to form lasting waste habits. Achievement of programmaturity will depend on a number of factors such as the City’s ability to provide processingcapacity, educational programs, and time, which together will result in a shift in resident wastebehaviours, increased capture rates, decreased contamination and ultimately higher diversion.
As noted earlier, the projected diversion rates in this business case exclude potential diversionfrom Refuse Derived Fuel (RDF).
Table 7: Comparison of Diversion Rate Contribution of Alternatives to the Total Diversion Rate
Program Alternative Projected Diversion Rate atMaturity
Without proposedprogram changes 41%
Alternative 1 57%
Alternative 2 57%
Alternative 3 46%
Alternative 4 45%
11.5. Staff and Fleet Impacts
Table 8 below shows the number of staff and the fleet requirements for all four alternatives. Thetotal numbers include collection staff and fleet required to support collection of waste from the
Page 50 of 94
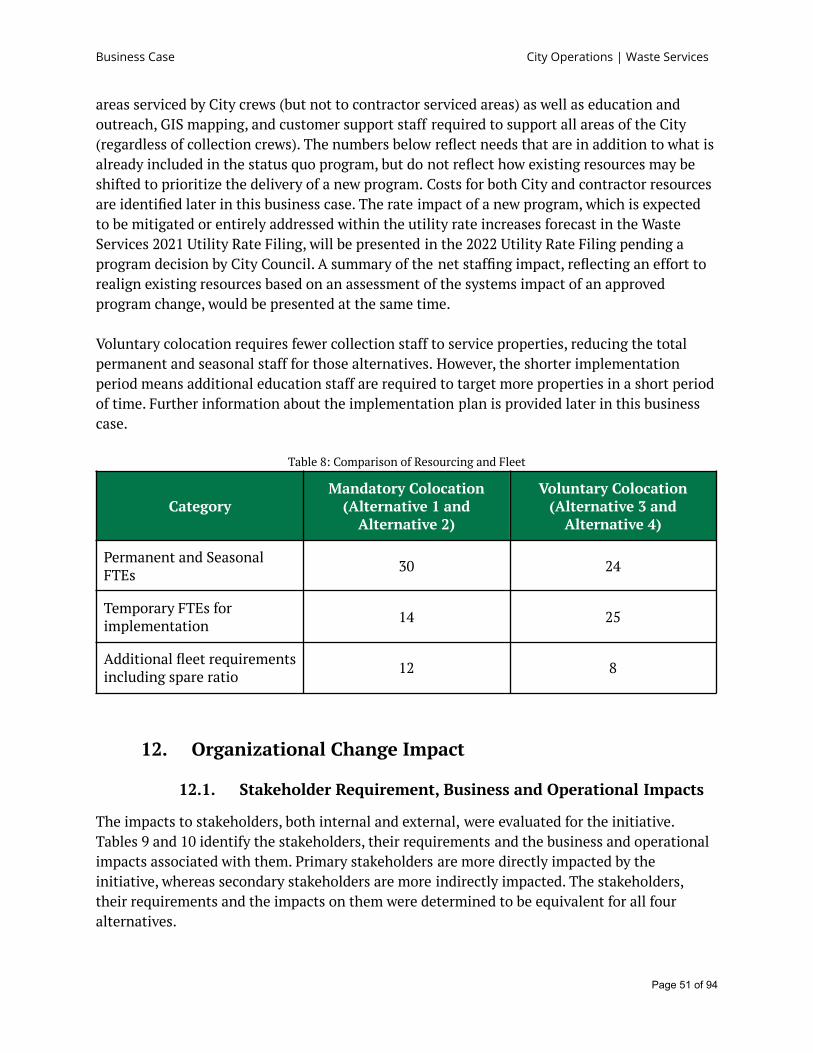
Business Case City Operations | Waste Services
areas serviced by City crews (but not to contractor serviced areas) as well as education andoutreach, GIS mapping, and customer support staff required to support all areas of the City(regardless of collection crews). The numbers below reflect needs that are in addition to what isalready included in the status quo program, but do not reflect how existing resources may beshifted to prioritize the delivery of a new program. Costs for both City and contractor resourcesare identified later in this business case. The rate impact of a new program, which is expectedto be mitigated or entirely addressed within the utility rate increases forecast in the WasteServices 2021 Utility Rate Filing, will be presented in the 2022 Utility Rate Filing pending aprogram decision by City Council. A summary of the net staffing impact, reflecting an effort torealign existing resources based on an assessment of the systems impact of an approvedprogram change, would be presented at the same time.
Voluntary colocation requires fewer collection staff to service properties, reducing the totalpermanent and seasonal staff for those alternatives. However, the shorter implementationperiod means additional education staff are required to target more properties in a short periodof time. Further information about the implementation plan is provided later in this businesscase.
Table 8: Comparison of Resourcing and Fleet
CategoryMandatory Colocation
(Alternative 1 andAlternative 2)
Voluntary Colocation(Alternative 3 and
Alternative 4)
Permanent and SeasonalFTEs 30 24
Temporary FTEs forimplementation 14 25
Additional fleet requirementsincluding spare ratio 12 8
12. Organizational Change Impact
12.1. Stakeholder Requirement, Business and Operational Impacts
The impacts to stakeholders, both internal and external, were evaluated for the initiative.Tables 9 and 10 identify the stakeholders, their requirements and the business and operationalimpacts associated with them. Primary stakeholders are more directly impacted by theinitiative, whereas secondary stakeholders are more indirectly impacted. The stakeholders,their requirements and the impacts on them were determined to be equivalent for all fouralternatives.
Page 51 of 94

Business Case City Operations | Waste Services
Table 9: Primary Stakeholders
StakeholderName Stakeholder Requirement Business and Operational
Impact
Waste ServicesBranch (internal)
● To implement a communalwaste collection programthat separates food scrapsand recycling from garbagein order to meet strategicgoals on a corporate andbranch level.
● To develop and implementsector-specific educationaland outreach programmingto support implementationand ongoing programprogress.
● To develop regulatoryrequirements to supportprogram requirements.
● Fulfillment of keystrategic goals such asdiversion from landfillthrough successfulimplementation of thenew program.
● Increased resourcedemands to meet theservice level and programobjectives.
● Increased capital andoperating costs.
● Development of newenforcement strategiesfor the implementation ofthe program changes.
Fleet and FacilityServices Branch(internal)
● Collaboration andconsultation regardingproject scheduling, purchaseand maintenance ofcollection vehicles andequipment to meet theprogram requirements for allstreams of collection.
● Potential increase inresource demand tosupport acquisition andmaintenance of currentand any new vehicles andequipment.
Communicationsand EngagementDepartment(internal)
● Effective collaboration withWaste Services and other keystakeholders to developeffective, high qualitycommunication andoutreach plans includingbriefing any internalstakeholders such as 311.
● Support the implementationof said plans with resources.
● Increased resource andschedule demands toaccommodate phasedimplementation.
ExecutiveLeadership Team(internal)
● To receive timely, highquality information tosupport well-informeddecisions that support andalign with key corporate andstrategic goals and
● Project outcome andbusiness case review andapproval.
Page 52 of 94

Business Case City Operations | Waste Services
outcomes.
City Council(internal)
● To receive transparent andcomprehensive informationfrom administration tosupport decision-making.
● Review and approval ofbusiness case includingany supportingdocumentation andattachments.
● Provision of anyadditional direction toAdministration (WasteServices).
● Receive and discuss anypublic feedback directly.
City of Edmontonunions (external)
● To ensure transparentcommunication andcollaboration with WasteServices in accordance with‘Working RelationshipAgreement’ principles.
● Ongoing fulfillment andsupport of workingrelationships andprinciples.
Multi-unitresidents(external)
● To be consulted andinformed throughout theproject life cycle.
● To know that the proposedprogram considers residentneeds and barriers.
● To receive clear and effectivecommunication regardingprogram changes and how toparticipate.
● To receive support before,during and afterimplementation on anongoing basis.
● To be able to providefeedback.
● Changes to behaviour androutine required totransition to a newprogram.
● Increased need fortargeted and sustainededucation.
● Ongoing support.
Multi-unitbuildingmanagementincluding:managementcompanies,building owners,property sitemanagement, and
● To be consulted andinformed throughout theproject life cycle.
● To know that the proposedprogram considers residentand manager needs andtakes barriers to successfulparticipation intoconsideration.
● Potential increase toresourcing and time tocommunicate with Citystaff regarding programchanges.
● Potential increase toresourcing and time tocommunicate withresidents regarding
Page 53 of 94

Business Case City Operations | Waste Services
condo boards(external)
● To know that the proposedprogram was designed withan awareness of the need tolimit stressors such as illegaldumping and cleanliness.
● To be confident that theproposed program reflectstheir needs and wasdesigned to limit additionalcosts that could impact theirbusiness model.
● To receive clear and effectivecommunication regardingprogram changes and how toparticipate.
● To receive supports before,during and afterimplementation on anongoing basis.
● To collaborate with WasteServices to make anyrequired changes tocollection locations andcontainers to supportimplementation.
program changes.● Potential additional cost
should infrastructurechanges be required.
Multi-unitdevelopers
● That proposed requirementsbe clearly explained.
● To be informed andconsulted throughout theproject life cycle.
● Consistency in application ofstandards from the City.
● Potential new costs,resources or time neededto adapt new buildingdesigns to meet newexpectations.
● Additional consultationregarding new standards.
Collection Servicescontractors(external)
● To be informed of the projectrequirements in order to beable to effectively bid on anyupcoming contracts (whichmay include acquiringequipment to deliver newservices).
● To have clarity regardingscope of work and programexpectations.
● Opportunity to bid andwork for the City.
● Resource and equipmentneeds for providing theservice to the City.
Waste containervendors (external)
● To be informed of changes tocontracts and/or have
● Opportunity to bid on anycontainer supply and
Page 54 of 94

Business Case City Operations | Waste Services
adequate notice to bid onnew contracts as required.
potential distribution.
EPCOR (external)
● Consultation, informationand collaboration to ensureany changes required in thebilling system and wasteaccount setup arecommunicated adequately toEPCOR and all relevant staffare trained.
● To update the billingsystem and waste accountsetup system as required.
● Ensure all relevant staffare trained.
Table 10: Secondary Stakeholders
StakeholderName Stakeholder Requirement Business and Operational
Impact
Financial ServicesBranch (internal)
● To ensure financialtransparency in theallocation of the proposedbudget and to ensureWaste Services meets itsobligations under theWaste Management UtilityFiscal Policy.
● Review and consult onfinancial impact to programchanges.
● Make recommendations asrequired.
CorporateProcurement andSupply ServicesBranch (internal)
● Consultation andinformation from WasteServices regardingprocurement needs tosupport proposed programchanges.
● Provide resources to meetthe project procurementneeds.
Legal Services(internal)
● To be consulted regardinglegal impacts of any or allcomponents of theproposed program tomanage risk.
● Provision of expert legalreview of program, tenderand contract aspects.
CommunityStandards andNeighbourhoodBranch (internal)
● To be consulted on allregulatory changes tocommunal collectionprograms to ensureenforceability of proposedchanges.
● To work collaborativelywith Waste Services torecommend changes toWaste Bylaw 18590.
Urban Planning ● To be involved in setting ● Potential impact to Zoning
Page 55 of 94

Business Case City Operations | Waste Services
and Economy(internal)
developer standards andsite requirements for newproperties andincorporating them intobylaws.
● To work jointly with WasteServices on the issue ofcontainer aesthetics andscreening requirements.
Bylaw to ensure compliancewith waste developerstandards includingenforcement staff capacityand resourcing.
● Representation needed fordiscussion on containeraesthetics and screeningrequirements.
Employee Services(internal)
● To be kept up to date onhuman resourcemanagement needs such asrecruiting.
● To provide resources onhuman resourcemanagement needs.
Open City andTechnologies(internal)
● To be communicatedadequately with about ITneeds.
● To provide IT resources.
Waste ServicesOHS (internal)
● To ensure the projectaligns with all OHS Acts,Codes, Regulations and theCOE OHS Policies,Procedures and Directives.
● To provide resources toreview and finalize theproject OHS program.
AlbertaEnvironment andParks (external)
● To ensure the programchange meets allrequirements underAlberta EnvironmentalProtection andEnhancement Act.
● To review and approve anyapproval or amendment toexisting approvals.
Media
● To be informed of theproject decisions andprogress and be providedwith information asrequired.
● To provide resources onreporting the projectdecisions and progress.
Corporate Enviso● To ensure the project
aligns with the CorporateEnviso requirements.
● To provide resources toreview and finalize theproject Enviso documents.
Current WasteServices collectioncontractors
● To be communicatedadequately on the needsfor vehiclemodifications/purchasing.
● To provide resources toensure all garbage truckmodifications/purchasingmeets the City timeline andrequirements.
Page 56 of 94

Business Case City Operations | Waste Services
Local wastemanagementorganizations
● To be informed of theproject decisions andprogress.
● To provide input and assistthe City in ensuring asuccessful program.
Greater Edmontonregionmunicipalities
● To be informed of projectdecisions and outcomes.
● To be consulted orinformed of changes thatmay impact regional wastemanagement programs ormarket conditions.
● The proposed programchanges will createprecedence that mayimpact sector expectationsand market conditions forsurrounding municipalitiesand potentially affectprogram changes proposedby municipalities in thefuture.
13. Summary of Cost and BenefitsThis section identifies overall benefits and costs incurred to realize the recommendedalternative.
13.1. Expected Benefits
The benefits described in Table 11 are expected to result from the recommended alternative.
Table 11: Expected Benefits
Tangible Benefits Intangible Benefits
Increase of 16 percent to projected diversionrate.
Equity for residents between services.
Higher quality end products for market. Program is more aligned with best practicesfound in other jurisdictions.
Reduction of GHG from reduced landfillingof organics and increased recycling.
Collateral benefit of improved results inother programs (such as curbside collection)as a result of harmonized expectations.
Improved relationship with residents and property managers as a result of the support andresources provided by the City.
13.2. Costs
13.2.1. Capital Costs
This financial requirement includes the purchase of collection vehicles, containers (both carts
Page 57 of 94

Business Case City Operations | Waste Services
and bins), as well as their corresponding replacement parts, contingency, and inflation.
The capital costs are summarized for the life of the project for the recommended alternative inTable 12 below.
Table 12: Capital Cost Summary for Alternative 2
Item Alternative 2
Fleet Related Capital Costs $10,170,000
Container Related Capital Costs $10,739,537
Contingency $4,181,907
Inflation $4,106,682
Total $29,198,126
The capital costs for the recommended alternative are presented in Figure 8. These costs arepresented by category by business cycle.
Figure 8: Capital Cost Breakdown by Category for a Four Year Business Cycle
13.2.2. Operating and Maintenance Costs
This financial requirement includes operational costs for the collection of all the streams
Page 58 of 94

Business Case City Operations | Waste Services
(including estimated contractor cost), routing, container maintenance, waste inspectors, costsfor a comprehensive education and outreach program, costs for the initial rollout, costs forwaste characterization studies every three years, costs for fleet maintenance, supply costs,inflation, and a contingency estimate.
The operating costs are summarized for the life of the project (24 years) for the recommendedalternative in Table 13.
Table 13: Operating and Maintenance Cost Summary for Alternative 2
Item Alternative 2
Operations $31,970,814
Education and Outreach $21,690,571
Fleet $5,073,679
Rollout Materials $694,314
Supplies $1,288,755
Waste Characterization Studies $1,600,000
Contingency $12,463,627
Inflation $16,184,392
Total $90,966,152
The operating costs by category by year are presented in Figure 9.
Page 59 of 94

Business Case City Operations | Waste Services
Figure 9: Operating Cost Breakdown by Category for a Four Year Business Cycle
Appendix E, F and G provide a detailed alternative cost comparison summary, a comparison ofrevenue requirements for the alternatives, and the annual operating and maintenance costs ofthe recommended Alternative respectively.
14. Key Risks and Mitigating StrategiesA comprehensive risk register was developed for this initiative. High impact risks for thecommunal collection program are summarized in Table 14, together with associated mitigationstrategies. The risk impacts outlined in the table below are based on risk scores before themitigation strategies for the program are in place.
Table 14: High Impact Risks and Mitigation Strategies for the Recommended Alternative
Risks Mitigation Strategy
Improvements to waste sorting andset out behaviours are less thananticipated.
● Set achievable expectations andassumptions from the beginning.
● Monitor behaviour and review the programregularly to ensure program expectationsare aligned with communication andeducation tools.
● Implement diverse and targeted educationaltactics during implementation and on anongoing basis to ensure residents havesupport they need to properly sort theirwaste, and in turn, help reducecontamination.
● Work with customer support and bylawteams to inform residents and propertymanagers of issues with compliance.
● Work with collections and bylaw teamsregarding enforcement tactics.
● Ensure the bylaw is updated with clearlanguage.
Internal accounting platform (SAPAriba) causes delays in the tenderingprocess.
● Ensure CPSS is aware of projectexpectations and timelines.
● Raise any concerns with leadership toensure full support.
● Give enough time to CPSS for therecruitment process.
Page 60 of 94

Business Case City Operations | Waste Services
Inadequate capacity to processseparated waste streams (organicsand recycling).
● Secure third party capacity for processing.● Regularly monitor tonnage and volume
projections and compare with actual valuesto improve accuracy of predictive models.
Delays in administrative processes ordifficulty in meeting needs ofinternal stakeholders due to the civicelection.
An unpredictable political climateresulting in the bylaw amendmentnot being approved on time.
● Begin working on bylaw amendments assoon as possible.
● Include all stakeholders from the beginningto ensure everyone's concerns are captured.
● Communicate early and often with CityCouncil to ensure they are up to date andinformed about the program.
Difficulty in enforcing the newdeveloper standards in newproperties if standards are not partof Zoning Bylaw.
● Work closely with the Zoning Bylaw renewalteam to ensure they are informed of thenecessity of enforceable developerstandards.
Infrastructure changes may berequired in some multi-unitproperties to accommodate threestreams.
● Provide as much time as reasonably possibleto allow the site to make changes or findsolutions to accommodate colocation ofthree streams.
● Provide different styles and sizes ofcontainers to help minimize the need forinfrastructure changes.
Properties may expect the City topay for (or contribute to) the cost ofinfrastructure changes required toaccommodate three streamcollection.
● Ensure expectations and program directionis clear from the beginning to remove anymisconceptions.
● Work with properties to try to find solutionsto avoid infrastructure changes.
15. Gender Based Analysis Plus (GBA+) Considerations andRecommendations
GBA+ (Gender-Based Analysis Plus) is a process to examine and address how policies, programsand services impact diverse individuals and groups. Multiple identity factors, including age,race, ability, education, ethnicity, geography, health, language, class, sex, and gender need tobe considered to improve planning and decision-making. By using a GBA+ lens, diverseperspectives, experiences, and needs are taken into account to create services that serveeveryone.
Through all phases of work the project team looked at the nuanced approaches needed andalready being taken in other municipalities to provide a successful program to service
Page 61 of 94
Business Case City Operations | Waste Services
multi-unit properties while considering the diverse needs of residents. Research examinedother jurisdictions to find key program components influencing the experiences of residents inmulti-unit properties. Two phases of engagement gathered feedback regarding anticipatedbarriers to participation and how to overcome them. The options analysis process sought toalign approaches across the curbside and communal collection services, to ensure equity inexperience and level of service, while utilizing feedback from the engagement to influence howoptions were scored and promoted for consideration.
The following considerations were included in the analysis:● Cultural and language considerations - The use of icons, images and less text
in educational materials was identified as a way to effectively offer educationand outreach to program customers.
● Socio-economic considerations - Understanding that the actual or perceivedcost of the program is a burden on residents and building management, acommitment was made to offer the same opportunities and service levels acrossthe sector, regardless of socio-econonomic status.
● Accessibility and convenience - A user-centred program design addressing howresidents access their waste collection areas resulted in consideration of distancetravelled to collection areas and the influence of building infrastructure onprogram design.
Waste Services recognizes that after the major changes to the program have been established,the program will need to continue to be evaluated for enhancements to ensure that it continuesto meet the changing needs of stakeholders in the multi-unit sector.
16. Conclusion and Recommendation
16.1. Conclusion
This business case and the supporting analysis demonstrate the need to transition thecommunal collection program to mandatory source separation of recycling and food scraps.Although introducing a mandatory source separation program in properties with communalcollection is more challenging than an equivalent program for curbside collection, research andengagement have shown that it is possible. This change will favourably impact the diversionrate and will create equal expectations for residents in both sectors.
Waste Services recommends enforceable developer standards to ensure all new properties inEdmonton are designed and built to accommodate three stream separation and collection.Regular program review and advocating for landfill disposal bans are also recommended forendorsement by City Council.
Waste Services recognizes that change to the communal collection program will take time andrequire extensive communication and education to achieve high success rates. The changes
Page 62 of 94
Business Case City Operations | Waste Services
recommended herein are not expected to cause a steep increase to the diversion rate in a shortperiod of time. Instead, this recommendation will help increase waste diversion over time asresidents adapt and become comfortable with this new way of managing waste. The change tothree stream collection is key to the overall success of the 25-year Waste Strategy.
16.2. Recommendation
Alternative 2 (mandatory colocation and voluntary chute closure) provides the most favourableresults and is recommended for implementation. The recommended alternative has a capitalcost of $29 million and an operating and maintenance cost of $91.0 million.
While Alternative 1 and Alternative 4 received the next highest total scores, they represent twocontrasting scenarios: all mandatory or all voluntary. Although Alternative 1 scored higherfrom an environmental perspective and carried slightly less risk overall, there is significantlyless support from a social standpoint compared to Alternative 4. Alternative 4 has significantlymore support from a social perspective, which is countered by a lower diversion rate potentialand a less favourable score for risk.
16.3. Additional RecommendationsWaste Services recommends the following additional items be added to all alternatives to forma complete program. These items do not carry additional resource requirements beyond thestatus quo, and therefore were not included in the financial analysis of the alternatives, but arepresented here for consideration and endorsement by City Council.
A. Enforceable Developer Standards - Waste Services’ comprehensive developerstandards will be completed and referenced to the Zoning and Waste bylaws to ensureall new properties comply.
B. Regular Program Review - Waste Services will introduce provisions to review theprogram every six to nine years to evaluate program success in achieving diversion andcontamination rate targets. This timing would align with the regular wastecharacterization studies, which are planned for every three years. Among other aspects,this review will include a review of volume allocations, container types, and theeffectiveness of the regulatory and enforcement measures in this business case toensure that the solutions remain relevant and effective as Edmonton grows andchanges.
C. Landfill Disposal Bans - Research has shown that landfill disposal bans prohibitingorganics and recyclable material from entering landfills have been a successful tool inensuring the success of source separation programs. These regulations are oftenintroduced at the provincial or regional level to ensure that all disposal facilities withina region have the same rules. The City continues to engage with its neighbours toexplore regional alignment, as defined by the Edmonton Metropolitan Regional Board’s2019 Metropolitan Region Servicing Plan. This work includes a review of the success oflandfill bans on successful waste diversion, establishing common reporting protocols,
Page 63 of 94

Business Case City Operations | Waste Services
and regional advocacy to the Provincial government for extended producerresponsibility legislation. Waste Services recommends that City Council advocate fordisposal bans to be implemented on a provincial level.
17. Project Responsibility and AccountabilityThe Waste Services communal collection program is sponsored by the Branch Manager of WasteServices. The program oversight and implementation is provided by the Director of WasteStrategy and Director of Collection Services. Once implementation is complete, the ongoingoversight will be provided by the Director of Collection Services.
Information to complete the business case was gathered and analyzed by a dedicated teamwhich included subject matter experts from Waste Services under the supervision of theDirector of Waste Strategy and the Waste Services Leadership Team.
18. Implementation ApproachThe implementation of the new communal collection program is dependent on publiceducation and outreach efforts, the availability of sufficient processing capacity for organicsand recycling, allowing sufficient time for properties to prepare their sites for three streamcollection, an update of the Waste Bylaw, and securing the resources identified in this businesscase.
A high level implementation timeline for the communal collection program is outlined inFigure 10.
18.1. Recommended Timeline for Mandatory Colocation
Should City Council select the recommended alternative, it is anticipated that preparation forthe new service will begin in 2022 so three stream collection can commence in 2023. Rolloutwill be phased over a period of four years. The sequence for operational implementation andeducation program implementation is described in more detail below.
The timeline allows sufficient time for properties to make infrastructure changes if desired andensures the City is learning and adapting as the program is rolled out. It also provides theopportunity to build strong relationships with property managers and condo boards along theway. Implementing source separation for properties receiving communal collection requiresmore time and resources than the curbside program, as the City will need to work with propertymanagers and/or condo boards at each site to make decisions regarding container type, size,placement and collection frequency.
18.1.1. Operational Implementation
Changes to communal collection will be implemented in phases. Each phase is expected to
Page 64 of 94
Business Case City Operations | Waste Services
include approximately 100 properties and will take approximately six weeks. During this period,the properties will be provided with new containers and education. Phases will be determinedby geographic area, beginning with areas currently serviced by City crews. Propertyassessments will start in 2022 to prepare for the first phases of rollout, and will continue as aparallel process during the phased implementation.
Starting in 2022, the City will advise properties which containers have been determined to beoptimal for their site. This approach to phased notification will provide properties with as muchtime as possible to plan for changes and correspond with the City about modifying the assignedcontainers. Providing a long notice period to properties was one of the requests made byproperty managers during the engagement activities. A deadline will be set for properties toapproach the City regarding any requests for changes to their containers.
18.1.2. Education and Outreach Implementation
The implementation of the proposed communal collection program includes a comprehensiveeducation and outreach strategy. This education strategy is focused on supporting residentsand property managers through the transition and on an ongoing basis. This approach willbuild awareness, provide the tools and support necessary for residents to successfullyparticipate in the program, and help residents adapt to the change in the long term.
Education and outreach tactics will include, but are not limited to:● Awareness campaigns that will help residents anticipate, understand and prepare for the
change. Campaigns will use a variety of approaches, including materials mailed directlyto residents, campaign videos and ads on City media channels. This will help to initiateadoption of the new program.
● An educational “welcome” package, which provides residents with the tools they needto immediately begin participating in the program, including an in-unit food scraps pail,an educational brochure outlining the program, a What Goes Where poster for in-unituse, and signage and posters for the building to ensure clear and consistent messaging.
● Direct outreach to all residents to introduce the program. This will involve door-to-doorcanvassing that will use behaviour change tools typical of Community Based SocialMarketing practices. These tools have been proven to positively impact behaviourchange and include identifying barriers and highlighting benefits of the desiredbehaviour to residents, asking residents to make commitments (both private and public)to try the new system, and a gift (the food scraps pail), to increase feelings ofreciprocity.
● Digital educational resources, including the WasteWise app, information on the Citywebsite, and educational videos designed to help residents adapt to the program.
● Virtual education sessions for both residents and property managers, to createawareness of the program, answer questions and point residents and property managersto other available resources.
● An annual newsletter sent to each home receiving the communal collection service to
Page 65 of 94

Business Case City Operations | Waste Services
provide information about the progress of the program as a whole, highlightingresidents’ successes and where performance could be improved, and to encouragecontinued participation in the program.
Since the implementation is planned to take place over a period of several years, tactics andmethods will be evaluated and improved continuously throughout the implementation. As well,learnings from the education and outreach associated with the Edmonton Cart Rollout will beapplied during the implementation of the new communal collection program.
Figure 10: Implementation Timeline for the Recommended Waste Services Program
18.2. Alternative Timeline for Voluntary Colocation
Should Council select an alternative that is not recommended, the implementation timelinecould vary. For Alternative 3 and Alternative 4, implementation is expected to take up totwo-and-half years to complete. The sequence of steps would be the same, but as voluntarycolocation requires distribution of fewer containers, it will not take as long. This expeditedtimeline means that additional educational staff are required; this difference has been reflectedin the cost of the alternatives. Alternative 1 has the same implementation requirements asAlternative 2, the recommended alternative.
18.3. Bylaw Updates
Major changes to the Waste Services Bylaw were introduced together with therecommendations in the Single Unit Waste Set-out Business Case in 2019. These changes didnot include updates related to the communal collection program.
Page 66 of 94

Business Case City Operations | Waste Services
Waste Services Bylaw 18590 will require further updates to ensure alignment with therecommendations presented in this business case. Waste Services will initiate an amendment tothe current Waste Services Bylaw 18590 following approval of this business case. The bylawamendment is planned to be presented for approval to Council in the first quarter of 2022.Bylaw changes will be a collaborative effort involving internal stakeholders such as theCommunity Standards Branch.
18.4. Performance Management
Waste Services will measure the effectiveness and efficiency of the program throughoutimplementation by assessing the results of performance measures such as:
● Overall communal program diversion rate.● Stream-specific diversion from landfill.● Gross tonnes of material collected from food scraps, garbage and recycling.● Contamination rate in the waste streams.● Total operating cost per tonne.● Number of properties serviced.● Number of properties transitioned per phase (until rollout complete).● Overall residential customer satisfaction with the communal collection program.● Overall property management satisfaction with the communal collection
program.● Number of properties using the excess waste program.● Number of properties taking advantage of the variable rate program due to lower
garbage generation.
The most appropriate measures for managing performance on an ongoing basis, oncedetermined, will be embedded in the Enterprise Performance Management (EPM) scorecards ofthe Waste Services branch for regular review through the City’s established EPM framework.
18.5. Critical Dependencies Impacting Timeline
Multiple factors and decisions could impact the timeline for the proposed program changesincluding, but not limited to, the following possibilities:
● Delay to Council approval of proposed program changes in June 2021 will impactthe implementation timing.
● Delay to Council approval of forthcoming amendments to the Waste ServicesBylaw.
18.6. Additional Implementation Steps
In addition to the rollout and the education and outreach programs that would beimplemented, Waste Services will include the following in the implementation phase:
● Variable Pricing Details - Waste Services will continue working on the details of avariable pricing program and present it at a later date. Variable pricing is currently part
Page 67 of 94

Business Case City Operations | Waste Services
of the curbside collection program, allowing rates to be set based on the size ofcontainer at a property.
● Excess Waste Program - Waste Services will continue working on an excess wasteprogram that would charge properties for additional service above and beyond theallocated amount of waste collected as part of the regular service standard.
● Stakeholder Working Groups - Waste Services will evaluate and consider the creationof a stakeholder working group consisting of property managers and condo boardmembers during the implementation phase. Stakeholder working groups can contributeto better stakeholder relationships, collaboratively work towards informing furtherprogram iterations and overcoming implementation challenges.
● Illegal Dumping - Although planning and funding an illegal dumping strategy was notin scope for this business case, it was identified by many stakeholders as one of theprimary concerns for properties with communal collection. As illegal dumping has ascope beyond the communal collection program, Waste Services will considerconducting further study of potential future programs to reduce illegal dumping, andmake recommendations at a future date.
● Bin Aesthetics - Waste Services will investigate options to improve the aesthetics offront load bins, and work with the Development Services branch to determine if changesto current screening requirements would be possible, and under what conditions.
● Regular Waste Characterization Studies - Waste Services will conduct regular andfrequent waste characterization studies and audits to ensure updated data is available tomeasure success against program success measures. These studies will look atcontamination levels in all the streams and will help for benchmarking and educationplanning.
● Communal versus Curbside Collection - Where possible, depending on buildinglayout and operational logistics, Waste Services will prioritize curbside collection overcommunal collection to achieve the policy objectives outlined in the Waste Strategy.
19. Review and Approval ProcessTable 15 shows the review and approval process was followed for this business case:
Table 15: Business Case Review and Approval Process
Review Step Reviewer
Review 1 ● Project working team and Waste Strategy Director.
Review 2 ● Branch Manager of Waste Services,● Branch Manager of Development Services,● Director of Business Integration (Waste Services),● Director of Collection Services (Waste Services),● Director of Sustainable Waste Processing (Waste Services),● Director of Technical Services (Waste Services),● General Supervisor Business Strategy, Planning & Performance
Page 68 of 94

Business Case City Operations | Waste Services
(Waste Services),● Operational Controller with Business Financial Analytics (Waste
Services),● Branch Strategic Coordinator (Waste Services), and● Legal Services.
Review 3 ● Deputy City Manager.
Review 4 ● Utility Advisor and City Manager.
Review 5 ● Utility Committee report presented.
19.1. Business Case Sign Off
The business case will be approved (signed and dated) by the Branch Managers of WasteServices and Development Services in addition to Directors of Waste Strategy, CollectionServices, Technical Services, Sustainable Waste Processing Services, and Business Integrationas well as the Operational Controller in Waste Services. The final approval will be received fromthe Deputy City Manager prior to submission to the Utility Committee and City Council.
Page 69 of 94

Business Case City Operations | Waste Services
AppendicesAppendix A - Stage One Options Analysis ResultsAppendix B - Stage Two Options Analysis Results and Sensitivity Analysis MethodologyAppendix C - Stage Three Options Analysis Results and Scoring MethodologyAppendix D - Assumptions for AlternativesAppendix E - Detailed Alternative Cost Comparison SummaryAppendix F - Comparison of Revenue Requirements for AlternativesAppendix G - Annual Operating and Maintenance Costs
Page 70 of 94
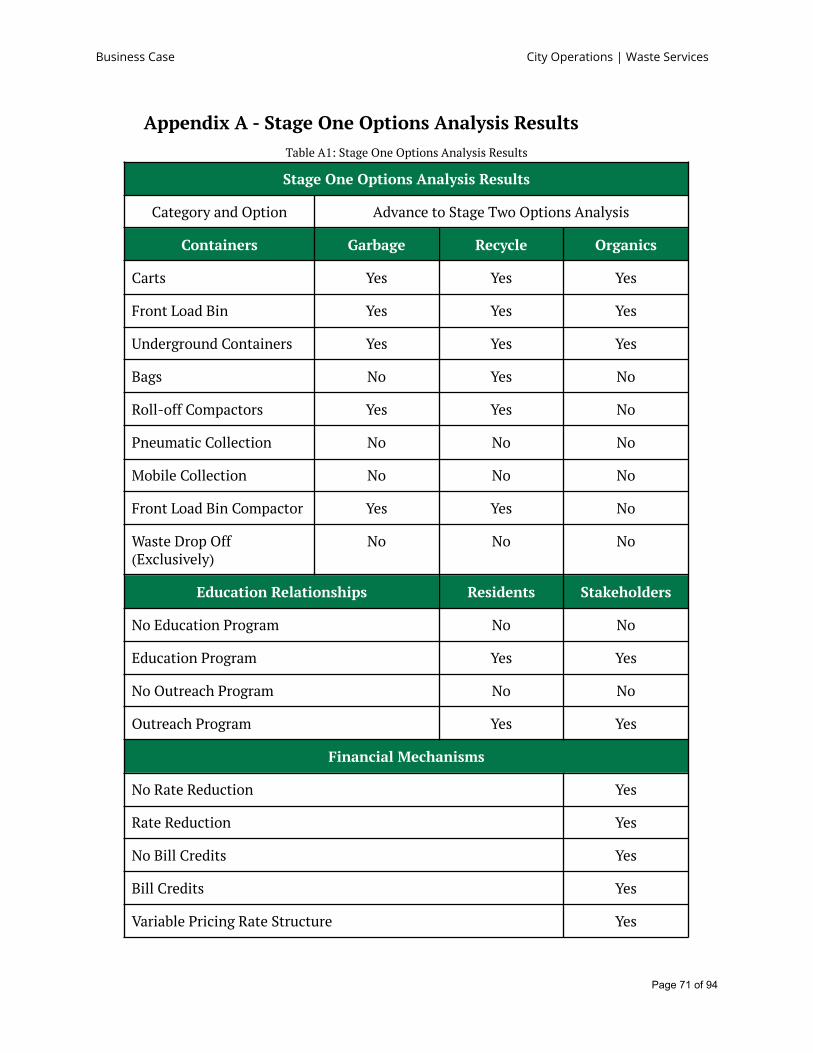
Business Case City Operations | Waste Services
Appendix A - Stage One Options Analysis ResultsTable A1: Stage One Options Analysis Results
Stage One Options Analysis Results
Category and Option Advance to Stage Two Options Analysis
Containers Garbage Recycle Organics
Carts Yes Yes Yes
Front Load Bin Yes Yes Yes
Underground Containers Yes Yes Yes
Bags No Yes No
Roll-off Compactors Yes Yes No
Pneumatic Collection No No No
Mobile Collection No No No
Front Load Bin Compactor Yes Yes No
Waste Drop Off(Exclusively)
No No No
Education Relationships Residents Stakeholders
No Education Program No No
Education Program Yes Yes
No Outreach Program No No
Outreach Program Yes Yes
Financial Mechanisms
No Rate Reduction Yes
Rate Reduction Yes
No Bill Credits Yes
Bill Credits Yes
Variable Pricing Rate Structure Yes
Page 71 of 94

Business Case City Operations | Waste Services
Fixed Pricing Rate Structure Yes
Processing
Pre-processing improvements to the IPTF Yes
Organic Press Yes
Waste to Energy Facility No
No Improvements (Status Quo) Yes
Developer Standards
No Developer Standards and Requirements No
Voluntary Developer Standards and Requirements Yes
Mandatory Developer Standards and Requirements Yes
Collections
Two Stream Waste Collection (Garbage and Recycle) Yes
Three Stream Waste Collection (Garbage, Recycle and FoodScraps)
Yes
Regulatory Programs
No Chute Closure Yes
Voluntary Chute Closure Yes
Mandatory Chute Closure Yes
No Colocation Yes
Voluntary Colocation Yes
Mandatory Colocation Yes
Volume Limits Excluding an Excess Waste Program Yes
Volume Limits Including an Excess Waste Program Yes
Page 72 of 94

Business Case City Operations | Waste Services
Appendix B - Stage Two Options Analysis Results and SensitivityAnalysis Methodology
Table B1: Stage Two Options Analysis Results
Stage Two Options Analysis Results
Option Category and Type Sensitivity Rank Average
Collections
Two Stream Collection (Garbage and Recycle) 1.80
Three Stream Collection (Garbage, Recycle, and Food Scraps) 1.20
Garbage Collection Containers
Carts 3.40
Front Load Bins 2.40
Underground (Front Load Truck Unloaded) 1.60
Roll-off Compactor 6.00
Front Load Bin Compactor 4.60
Underground (Crane Unloaded) 6.00
Underground (European-Style) 4.00
Recycling Collection Containers
Carts 4.80
Front Load Bins 2.00
Underground (Front Load Truck Unloaded) 2.20
Roll-off Compactor 6.20
Front Load Bin Compactor 4.20
Underground (Crane Unloaded) 5.60
Underground (European-Style) 3.60
Bags 7.40
Food Scraps Collection Containers
Page 73 of 94

Business Case City Operations | Waste Services
Carts 1.00
Front Load Bins 2.40
Underground (Crane Unloaded) 3.80
Underground (European-Style) 2.80
Resident Relationships
Make Operational Information Public 4.60
In-unit Food Scraps Containers 3.20
In-unit Recycle Containers 4.20
Ambassador Program 5.00
Annual Education Campaigns 1.80
Ongoing Education 2.20
Property Manager Relationships
Property Manager Resources 3.80
Building Resources (Posters, etc.) 3.00
Voluntary New Tenant Orientation 4.00
Targeted Workshops 6.20
Dedicated Staff for Multi-unit Customer Service 1.80
System Feedback / Report Cards 6.40
Stakeholder Working Teams 2.80
Financial Mechanisms
No Rate Reduction 3.80
Rate Reduction 2.80
No One-time Bill Credits 3.80
One-time Bill Credits 5.20
Variable Pricing Rate Structure 1.80
Fixed Pricing Rate Structure 3.40
Page 74 of 94
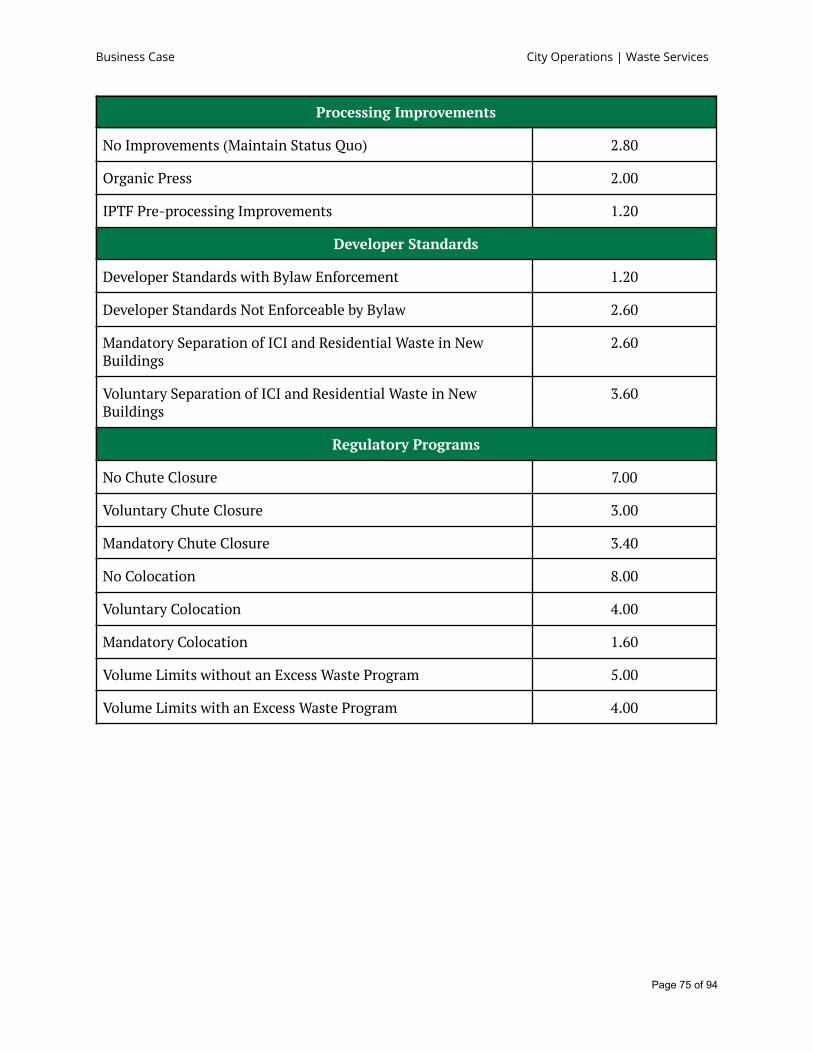
Business Case City Operations | Waste Services
Processing Improvements
No Improvements (Maintain Status Quo) 2.80
Organic Press 2.00
IPTF Pre-processing Improvements 1.20
Developer Standards
Developer Standards with Bylaw Enforcement 1.20
Developer Standards Not Enforceable by Bylaw 2.60
Mandatory Separation of ICI and Residential Waste in NewBuildings
2.60
Voluntary Separation of ICI and Residential Waste in NewBuildings
3.60
Regulatory Programs
No Chute Closure 7.00
Voluntary Chute Closure 3.00
Mandatory Chute Closure 3.40
No Colocation 8.00
Voluntary Colocation 4.00
Mandatory Colocation 1.60
Volume Limits without an Excess Waste Program 5.00
Volume Limits with an Excess Waste Program 4.00
Page 75 of 94

Business Case City Operations | Waste Services
Table B2: Example of Sensitivity Analysis Methodology
Stage Two Sensitivity Analysis Example
Criteria BeingAnalyzed (with % of
bias)
Evaluation Criteria WeightingPercentages
Option Score and Rank
Criteria 1 Criteria 2 Criteria 3 Criteria 4 3.454 -0.182 2.273 -0.727
Criteria 2: 0.00% 27.27% 0.00% 45.45% 27.27% 1 3 2 4
↑ ↓
3.842 3.501 3.500 1.922
Criteria 2: 71.07% 7.89% 71.07% 13.15% 7.89% 1 2 3 4
↓ ↑
3.882 3.883 3.628 2.196
Criteria 2: 78.44% 5.88% 78.44% 9.80% 5.88% 2 1 3 4
In the Sensitivity Analysis example above, four options are being evaluated against Criteria 2.The central columns show the weight assigned to each of the four criteria. The columns to theright are the corresponding rank of each option.
In the first row of the analysis, the weighting for Criteria 2 is set to zero percent, and the optionranks are recorded.
The percent weighting of Criteria 2 was then increased until a rank change occurred in theoptions. In the example above, a rank change occurred when Criteria 2 reached 71.07% (secondrow of the analysis above). When Criteria 2 was weighted at 71.07%, the option that had beenranked third moved up to rank second, and the option ranked second dropped to rank third.
The last row shows another rank change when Criteria 2 reached a weight of 78.44%. In thisexample, the ranking remains constant regardless of how much additional weight is added toCriteria 2 after 78.44%.
This methodology was followed for every option and every criteria in Stage Two analysis toreach the final average rank for each option. An option with a higher sensitivity rank average ispreferred.
Page 76 of 94
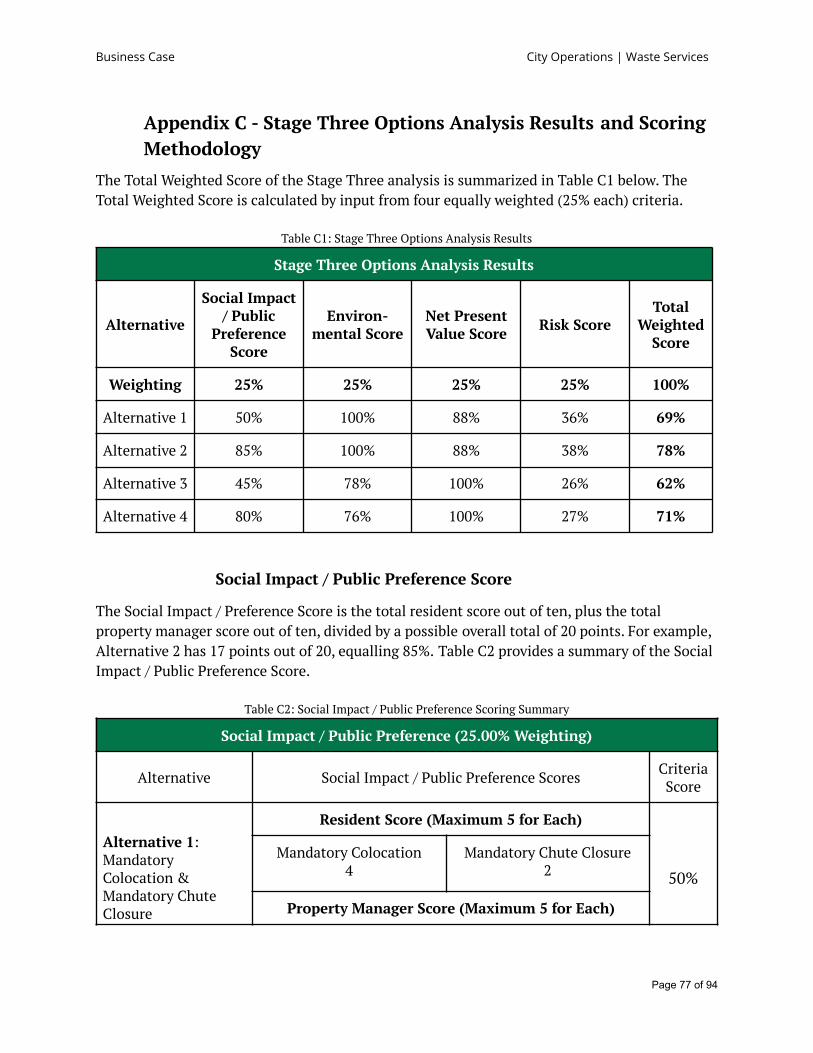
Business Case City Operations | Waste Services
Appendix C - Stage Three Options Analysis Results and ScoringMethodology
The Total Weighted Score of the Stage Three analysis is summarized in Table C1 below. TheTotal Weighted Score is calculated by input from four equally weighted (25% each) criteria.
Table C1: Stage Three Options Analysis Results
Stage Three Options Analysis Results
Alternative
Social Impact/ Public
PreferenceScore
Environ-mental Score
Net PresentValue Score Risk Score
TotalWeighted
Score
Weighting 25% 25% 25% 25% 100%
Alternative 1 50% 100% 88% 36% 69%
Alternative 2 85% 100% 88% 38% 78%
Alternative 3 45% 78% 100% 26% 62%
Alternative 4 80% 76% 100% 27% 71%
Social Impact / Public Preference Score
The Social Impact / Preference Score is the total resident score out of ten, plus the totalproperty manager score out of ten, divided by a possible overall total of 20 points. For example,Alternative 2 has 17 points out of 20, equalling 85%. Table C2 provides a summary of the SocialImpact / Public Preference Score.
Table C2: Social Impact / Public Preference Scoring Summary
Social Impact / Public Preference (25.00% Weighting)
Alternative Social Impact / Public Preference Scores CriteriaScore
Alternative 1:MandatoryColocation &Mandatory ChuteClosure
Resident Score (Maximum 5 for Each)
50%
Mandatory Colocation4
Mandatory Chute Closure2
Property Manager Score (Maximum 5 for Each)
Page 77 of 94

Business Case City Operations | Waste Services
Mandatory Colocation3
Mandatory Chute Closure1
Alternative 2:MandatoryColocation &Voluntary ChuteClosure
Resident Score (Maximum 5 for Each)
85%
Mandatory Colocation4
Voluntary Chute Closure5
Property Manager Score (Maximum 5 for Each)
Mandatory Colocation3
Voluntary Chute Closure5
Alternative 3:Voluntary Colocation& Mandatory ChuteClosure
Resident Score (Maximum 5 for Each)
45%
Voluntary Colocation4
Mandatory Chute Closure2
Property Manager Score (Maximum 5 for Each)
Voluntary Colocation3
Mandatory Chute Closure1
Alternative 4:Voluntary Colocation& Voluntary ChuteClosure
Resident Score (Maximum 5 for Each)
80%
Voluntary Colocation4
Voluntary Chute Closure2
Property Manager Score (Maximum 5 for Each)
Voluntary Colocation3
Voluntary Chute Closure1
Environmental Score
The Environmental Score is calculated with reference to the alternative with the highestprojected diversion at program maturity. Program maturity refers to a period of time whereideal sorting behavior has been established and the program is fully implemented. Everyalternative’s score is a ratio of its own projected diversion compared to the highest projecteddiversion rate. For example, Alternative 1 and Alternative 2 have the same highest projecteddiversion rate (51%), so they score 100%. Alternative 3 has a projected diversion rate of 40%,which is 78% of the highest projected diversion rate (40% / 51% = 78%). The score forAlternative 4 is calculated the same way. Table C3 provides a summary of the environmentalscores. All of the diversion rates are compared against the projected diversion rate if noalternatives were implemented. These diversion rates are estimated based on the proposed
Page 78 of 94

Business Case City Operations | Waste Services
changes to the collection aspect of the program and supporting educational programming. Asthis business case does not propose changes to other programs such as waste drop off,additional diversion from services such as Community Recycling Depots or Eco Stations is notincluded in the Alternative or Status Quo estimates, but are included in overall diversion ratetotals (approximately 6%). Lastly, these diversion rates also exclude contributions from the RDFfacility at the EWMC.
Table C3: Environmental Scoring Summary
Environmental (25.00% Weighting)
Explanation of DiversionRate
Predicted Diversion Rate(Collections and Processing
Only, Excluding RDF)Criteria Score
Alternative 1:Mandatory Colocation & Mandatory Chute Closure
Alternative Diversion Rate atMaturity 51%
100%Projected Status QuoDiversion Rate 35%
Overall Increase in Diversionat Maturity 16%
Alternative 2:Mandatory Colocation & Voluntary Chute Closure
Alternative Diversion Rate atMaturity 51%
100%Projected Status QuoDiversion Rate 35%
Overall Increase in Diversionat Maturity 16%
Alternative 3:Voluntary Colocation & Mandatory Chute Closure
Alternative Diversion Rate atMaturity 40%
78%Projected Status QuoDiversion Rate 35%
Overall Increase in Diversion 5%
Page 79 of 94

Business Case City Operations | Waste Services
at Maturity
Alternative 4:Voluntary Colocation & Voluntary Chute Closure
Alternative Diversion Rate atMaturity 39%
76%Projected Status QuoDiversion Rate 35%
Overall Increase in Diversionat Maturity 4%
Net Present Value Score
Each alternative is scored for Net Present Value based on the percent difference compared tothe highest NPV subtracted from a perfect score (100%). To demonstrate, Alternative 3 andAlternative 4 have the highest NPV (i.e. the least costly alternative), thus the score is 100%.Alternative 1 and Alternative 2 are $7.25M more expensive than Alternative 3 and Alternative 4.$7.25M / $60.38M = 12% summarizes the percent difference calculation, and 100% - 12% givesthe NPV Score of 88%. A mathematical summary can be seen below. Table C4 provides asummary of the NPV scores.
- = 0.87998 = 88%$60.38𝑀$60.38𝑀
$67.63𝑀 − $60.38𝑀$60.38𝑀
Table C4: Net Present Value Scoring Summary
Net Present Value (NPV) (25.00% Weighting)
Alternative Net Present Value Criteria Score
Alternative 1:Mandatory Colocation &Mandatory Chute Closure
Net Present Value:-$67,630,915.92 88%
Alternative 2:Mandatory Colocation &Voluntary Chute Closure
Net Present Value:-$67,630,915.92
88%
Alternative 3:Voluntary Colocation &Mandatory Chute Closure
Net Present Value:-$60,383,543.18
100%
Alternative 4: 100%
Page 80 of 94

Business Case City Operations | Waste Services
Voluntary Colocation &Voluntary Chute Closure
Net Present Value:-$60,383,543.18
Risk Score
The Risk Score reflects the risk avoided by an alternative. This approach was used to maintainconsistency with the other scores where a higher percentage represents better performance. Arisk analysis was completed to determine each alternative’s risk potential and actual risk. Therisk score is based on the difference between the risk potential and actual risk. For example, therisks associated with Alternative 1 had a potential score of 70 (if all risks had maximumlikelihood and impact). The actual risk associated with Alternative 1 had a score of 45 (based onexpected likelihood and impact). The avoided risk is therefore 25. The score is the ratio of theavoided risk to potential risk, where more risk being avoided results in a higher score. Table C5provides a summary of the Risk Score.
Table C5: Risk Scoring Summary
Risk (25.00% Weighting)
Alternative Risk Score Criteria Score
Alternative 1:Mandatory Colocation &Mandatory Chute Closure
Total Risk Avoided: 25
Total Score Possible: 7036%
Alternative 2:Mandatory Colocation &Voluntary Chute Closure
Total Risk Avoided: 23
Total Score Possible: 6038%
Alternative 3:Voluntary Colocation &Mandatory Chute Closure
Total Risk Avoided: 18
Total Score Possible: 7026%
Alternative 4:Voluntary Colocation &Voluntary Chute Closure
Total Risk Avoided: 12
Total Score Possible: 4527%
Page 81 of 94

Business Case City Operations | Waste Services
Appendix D - Assumptions for Alternatives
Table D1: Assumptions list for Alternatives 1 and 2 - Mandatory Colocation
Assumptions for Alternative 1 and Alternative 2 - Mandatory Colocation
1
Cart lifespan is 12 years (less than the Single Unit Waste Set-out Business Case) due tothe shared nature of multi-unit containers. FLB lifespan is set to 12 years for recyclingand garbage containers. Food scraps FLB lifespan are set to 6 years to account for thecorrosive nature of organic waste.
2 Food scraps carts are assumed to be coloured for cost purposes (similar to the curbsideprogram).
3An extra supply of 20% has been approximated to account for inaccuracies in unitcount, site count, and properties with space restrictions and differing container needs.The 20% was taken from the ACEE guidelines for a Class 3 estimate.
4 Service frequency is assumed to be weekly for all streams, and hard volume limits areimposed (no extra lifts).
5
Volume allocation per unit, assuming no contamination, is calculated to be:Garbage = 0.09 yd3 / weekRecycling = 0.20 yd3 / weekFood Scraps = 0.03 yd3 / week
6
Densities from EPA (converted to metric) taken as:15
Mixed Multi-unit Solid Waste (Uncompacted) = 43.09 kg / yd3 (aka Garbage)Mixed Single Stream Recycle (Uncompacted) = 23.13 kg / yd3 (aka Recycling)Food Scraps = 210.01 kg / yd3
Mixed Yard Waste = 113.40 kg / yd3 (added to the Food Scraps stream)
7 Food scraps container size volume allocation is based on a 90% capture rate (by weight),resulting in a total allocation of 0.0276 yd3 / week per unit.
8 Recycling container size volume allocation is based on a 90% capture rate (by weight),resulting in total allocation of 0.185 yd3 / week per unit.
9
Garbage volume container size allocation is based on:● 52% of food scraps to be in the garbage stream by weight to account for
improper sorting.● 15% of recycling to be in the garbage stream by weight to account for improper
sorting and to not significantly increase the volume of the garbage allocation.This results in the garbage container size to be increased by 23% above the 0.09yd3 / week allocation, resulting in a total allocation of 0.125 yd3 / week per unit.
15 EPA Density Document 2016
Page 82 of 94

Business Case City Operations | Waste Services
10 Based on current in-field percentages, 20% of the bins require casters. Only mediumduty casters are used, and no FLB over 4 yd3 in size will have casters.
11 No FLB are refurbishable due to end of life wear and tear.
12 Every unit will be given 1 food scraps pail. After the first initial purchase of food scrapspails, new purchases will equate a 2% expected growth rate and a 5% surplus.
13 The requirements for garbage FLB can be met by existing inventory.
14 The largest container to be used for food scraps is a 2 yd3 front load bin.
15 Cart and FLB replacement part quantity is set to match the surplus, a similarassumption to the Single Unit Waste Set-out Business Case.
16 None of the FLB are assumed to be "Cathedral Style.”
17 The number of 240L carts is assumed to be 25% of the 360L carts. The two differentsizes will be used based on building space limitations.
18
No more than 4 food scraps carts can be placed in a single "collection area" at aproperty. If 5 or more carts are needed, a 2 yd3 bin shall be allocated instead.It is assumed a property limit of 15 food scraps carts will satisfy all "collection areas"that a property requires.
19
No more than 7 garbage carts per property are allowed, which services up to a potential7 "collection areas.” These are for special cases where a frequency reduction for currentgarbage bins would be too low, or space is a primary concern. This is to ensure thatexisting FLB are used as often as possible instead of replacing them with carts. Thislimit is separate from the food scraps cart limit of 15 outlined in Assumption 18.
20 Lifespan of new trucks has been averaged to 8 years instead of 10, to allot for reducedlife expectancy due to dedicated organics collection.
21 Downtime for all collection vehicles is calculated at 15% based on historical data.
22City contractor cost for servicing food scraps FLB is assumed to be higher than the costof servicing recycling and garbage FLB. This is based on data from the existing curbsideprogram.
23 The contractor food scraps cart 240L and 360L servicing cost follows the same costprogression as garbage carts.
24 Contractor collection costs are the current average cost multiplied by the newadditional allocation.
25Contractor collection costs are set to 100% of status quo for the first year ofimplementation, as city-side rollout will occur first. The costs are then adjusted asimplementation is completed.
Page 83 of 94
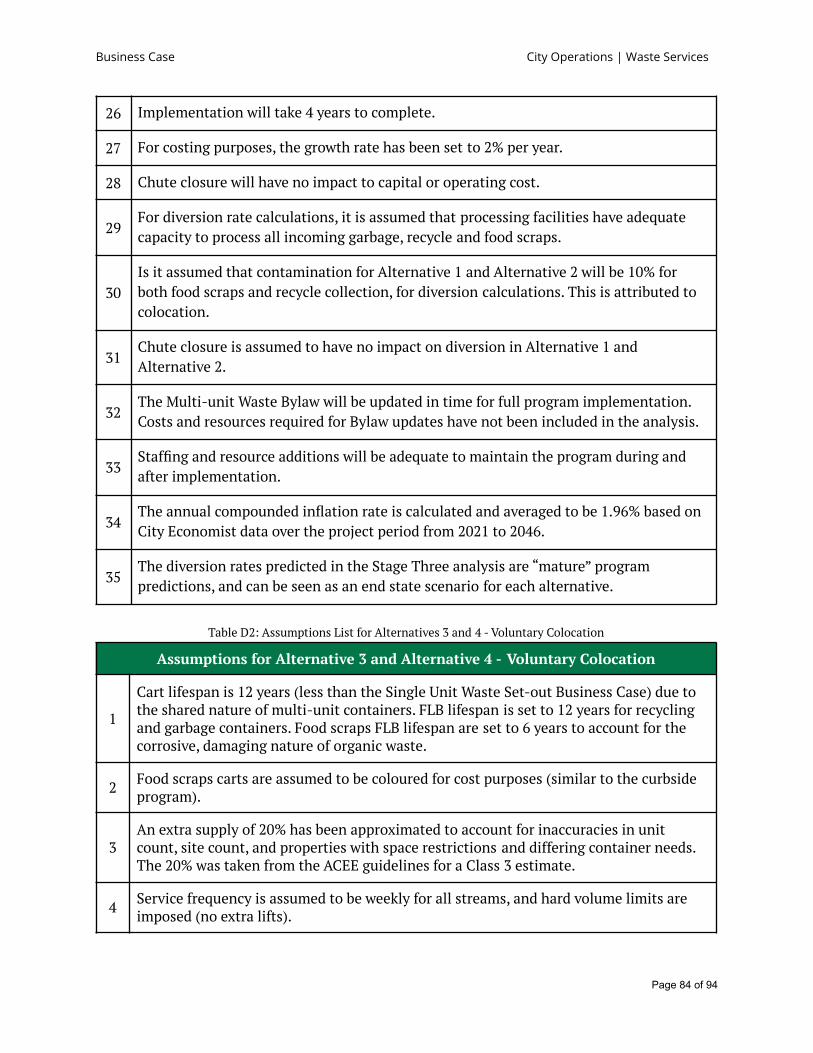
Business Case City Operations | Waste Services
26 Implementation will take 4 years to complete.
27 For costing purposes, the growth rate has been set to 2% per year.
28 Chute closure will have no impact to capital or operating cost.
29For diversion rate calculations, it is assumed that processing facilities have adequatecapacity to process all incoming garbage, recycle and food scraps.
30Is it assumed that contamination for Alternative 1 and Alternative 2 will be 10% forboth food scraps and recycle collection, for diversion calculations. This is attributed tocolocation.
31Chute closure is assumed to have no impact on diversion in Alternative 1 andAlternative 2.
32The Multi-unit Waste Bylaw will be updated in time for full program implementation.Costs and resources required for Bylaw updates have not been included in the analysis.
33Staffing and resource additions will be adequate to maintain the program during andafter implementation.
34The annual compounded inflation rate is calculated and averaged to be 1.96% based onCity Economist data over the project period from 2021 to 2046.
35The diversion rates predicted in the Stage Three analysis are “mature” programpredictions, and can be seen as an end state scenario for each alternative.
Table D2: Assumptions List for Alternatives 3 and 4 - Voluntary Colocation
Assumptions for Alternative 3 and Alternative 4 - Voluntary Colocation
1
Cart lifespan is 12 years (less than the Single Unit Waste Set-out Business Case) due tothe shared nature of multi-unit containers. FLB lifespan is set to 12 years for recyclingand garbage containers. Food scraps FLB lifespan are set to 6 years to account for thecorrosive, damaging nature of organic waste.
2 Food scraps carts are assumed to be coloured for cost purposes (similar to the curbsideprogram).
3An extra supply of 20% has been approximated to account for inaccuracies in unitcount, site count, and properties with space restrictions and differing container needs.The 20% was taken from the ACEE guidelines for a Class 3 estimate.
4 Service frequency is assumed to be weekly for all streams, and hard volume limits areimposed (no extra lifts).
Page 84 of 94

Business Case City Operations | Waste Services
5
Volume allocation per unit, assuming no contamination, is calculated to be:Garbage = 0.09 yd3 / weekRecycling = 0.20 yd3 / weekFood Scraps = 0.03 yd3 / week
6
Densities from EPA (converted to metric) taken as:16
Mixed Multi-unit Solid Waste (Uncompacted) = 43.09 kg / yd3 (aka Garbage)Mixed Single Stream Recycle (Uncompacted) = 23.13 kg / yd3 (aka Recycling)Food Scraps = 210.01 kg / yd3
Mixed Yard Waste = 113.40 kg / yd3 (added to the Food Scraps stream)
7 Food scraps container size volume allocation is based on a 90% capture rate, resultingin a total allocation of 0.0276 yd3 / week per unit.
8 Recycling container size volume allocation is based on a 90% capture rate, resulting intotal allocation of 0.185 yd3 / week per unit.
9
Garbage volume container size allocation is based on:● 52% of food scraps to be in the garbage stream by weight to account for
improper sorting.● 15% of recycling to be in the garbage stream by weight to account for improper
sorting and to not significantly increase the volume of the garbage allocation.This results in the garbage container size to be increased by 23% above the 0.09yd3 / week allocation, resulting in a total allocation of 0.125 yd3 / week per unit.
10 Based on current in-field percentages, 20% of the bins require casters. Only mediumduty casters are used, and no FLB over 4 yd3 in size will have casters.
11 No FLB are refurbishable due to end of life wear and tear.
12 Every unit will be given 1 food scraps pail. After the first initial purchase of food scrapspails, new purchases will equate a 2% expected growth rate and a 5% surplus.
13 The requirements for garbage FLB can be met by existing inventory.
14 The largest container to be used for food scraps is a 2 yd3 front load bin.
15 Cart and FLB replacement part quantity is set to match the surplus, a similarassumption to the Single Unit Waste Set-out Business Case.
16 None of the FLB are assumed to be "Cathedral Style.”
17 The number of 240L carts is assumed to be 25% of the 360L carts. The two differentsizes will be used based on building space limitations.
18 Recycling FLB are included for the properties that currently do not have recyclingservice.
16 EPA Density Document 2016
Page 85 of 94

Business Case City Operations | Waste Services
19No more than 4 carts can be placed in a single collection area at a site. If 5 or more cartsare needed, a 2 yd3 FLB is preferable due to the fact the footprint of 5 carts is more thanone 2 yd3 FLB.
20 Lifespan of new trucks has been averaged to 8 years instead of 10, to allot for reducedlife expectancy due to dedicated organics collection.
21 Downtime for all collection vehicles is calculated at 15% based on historical data.
22City contractor cost for servicing food scraps FLB is assumed to be higher than the costof servicing recycling and garbage FLB. This is based on data from the existing curbsideprogram.
23 Contractor collection costs are the current average cost multiplied by the newadditional allocation.
24 The contractor food scraps cart 240L and 360L servicing cost follows the same costprogression as garbage carts.
25Contractor collection costs are set to 100% of status quo for the first year ofimplementation, as city-side rollout will occur first. The costs are then adjusted asimplementation is completed.
26 Implementation will take 2 years to complete.
27 For costing purposes, the growth rate has been set to 2% per year.
28 Chute closure will have no impact to capital or operating cost.
28For diversion rate calculations, it is assumed that processing facilities have adequatecapacity to process all incoming garbage, recycle and food scraps.
29
Is it assumed that contamination for:● Alternative 3 will be 56.28% for recycle and 68.78% for food scraps collection
assuming that with mandatory chute closure, properties with chutes will followthe same contamination as Alternative 1 and Alternative 2 (10%). Buildingswithout chutes will follow contamination outlined below for Alternative 4.
● Alternative 4 will be 71.50% for recycle and 84.00% for food scraps collectionbased on composition studies from other municipalities who also have voluntarycolocation and voluntary chute closure.
30Chute closure is assumed to have no impact on diversion in Alternative 1 andAlternative 2.
31The Multi-unit Waste Bylaw will be updated in time for full program implementation.Costs and resources required for Bylaw updates have not been included in the analysis.
Page 86 of 94
Business Case City Operations | Waste Services
32Staffing and resource additions will be adequate to maintain the program during andafter implementation.
33The annual compounded inflation rate is calculated and averaged to be 1.96% based onCity Economist data over the project period from 2021 to 2046.
34The diversion rates predicted in Stage 3 analysis are “mature” program predictions, andcan be seen as an end state scenario for each alternative.
Page 87 of 94
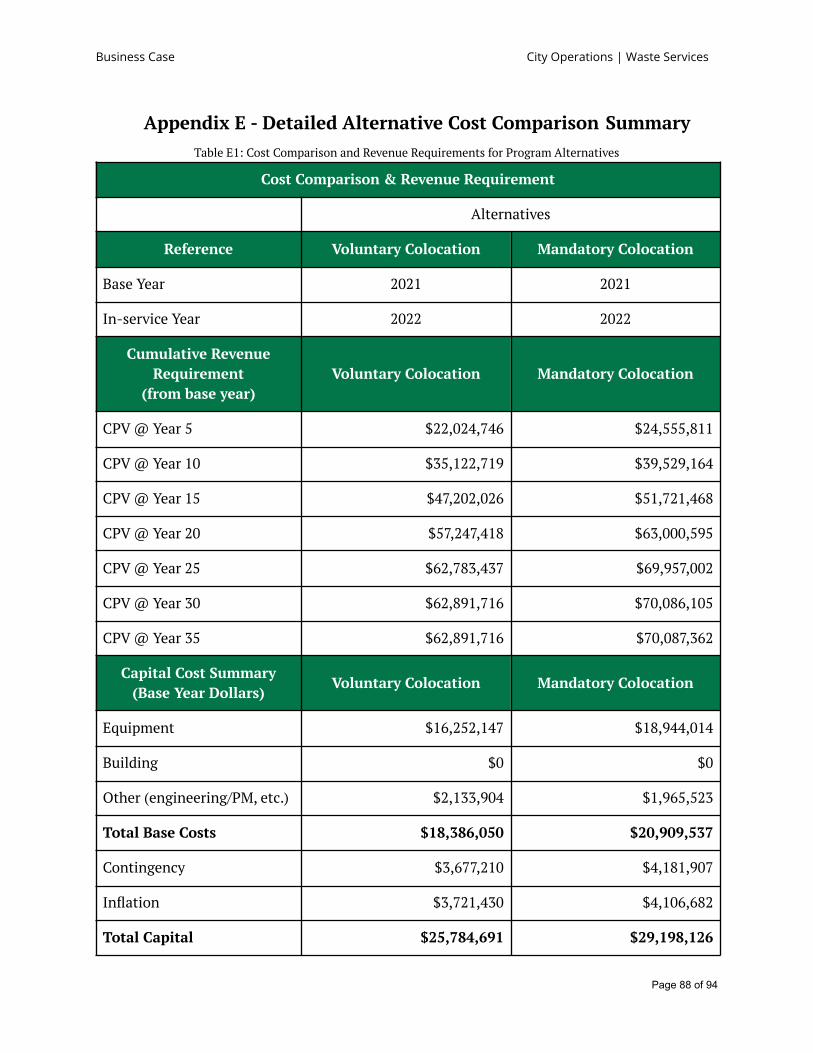
Business Case City Operations | Waste Services
Appendix E - Detailed Alternative Cost Comparison SummaryTable E1: Cost Comparison and Revenue Requirements for Program Alternatives
Cost Comparison & Revenue Requirement
Alternatives
Reference Voluntary Colocation Mandatory Colocation
Base Year 2021 2021
In-service Year 2022 2022
Cumulative RevenueRequirement
(from base year)Voluntary Colocation Mandatory Colocation
CPV @ Year 5 $22,024,746 $24,555,811
CPV @ Year 10 $35,122,719 $39,529,164
CPV @ Year 15 $47,202,026 $51,721,468
CPV @ Year 20 $57,247,418 $63,000,595
CPV @ Year 25 $62,783,437 $69,957,002
CPV @ Year 30 $62,891,716 $70,086,105
CPV @ Year 35 $62,891,716 $70,087,362
Capital Cost Summary(Base Year Dollars)
Voluntary Colocation Mandatory Colocation
Equipment $16,252,147 $18,944,014
Building $0 $0
Other (engineering/PM, etc.) $2,133,904 $1,965,523
Total Base Costs $18,386,050 $20,909,537
Contingency $3,677,210 $4,181,907
Inflation $3,721,430 $4,106,682
Total Capital $25,784,691 $29,198,126
Page 88 of 94
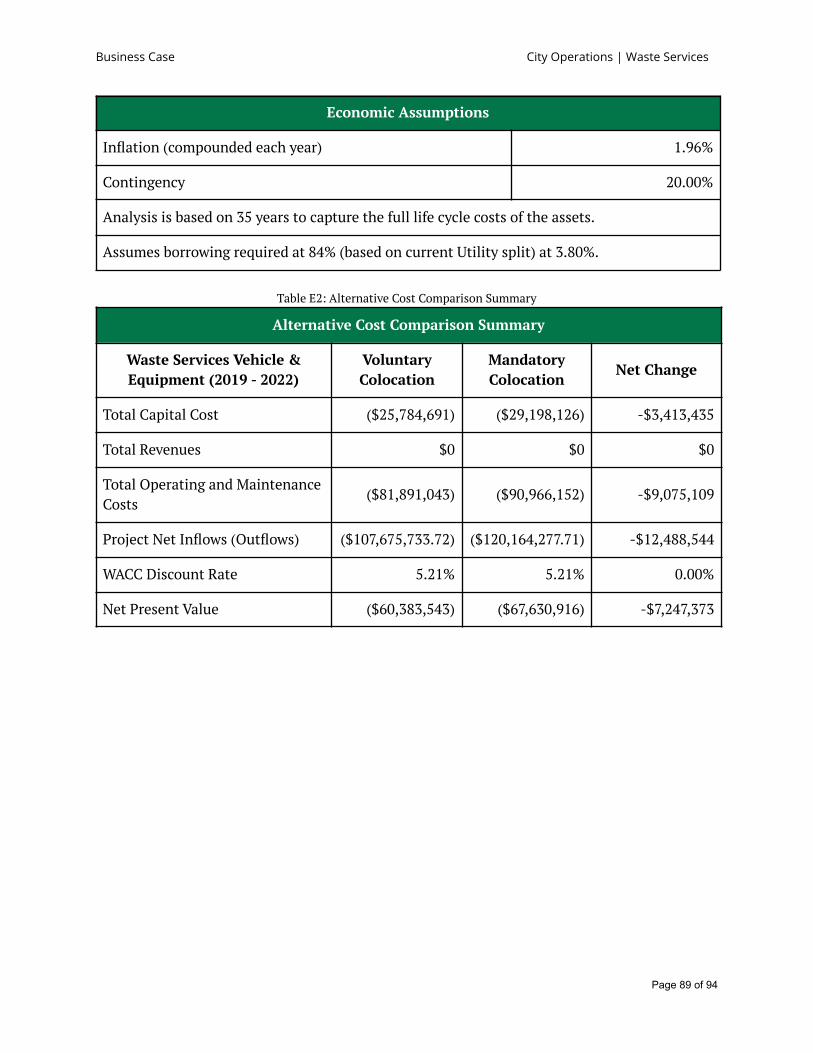
Business Case City Operations | Waste Services
Economic Assumptions
Inflation (compounded each year) 1.96%
Contingency 20.00%
Analysis is based on 35 years to capture the full life cycle costs of the assets.
Assumes borrowing required at 84% (based on current Utility split) at 3.80%.
Table E2: Alternative Cost Comparison Summary
Alternative Cost Comparison Summary
Waste Services Vehicle &Equipment (2019 - 2022)
VoluntaryColocation
MandatoryColocation
Net Change
Total Capital Cost ($25,784,691) ($29,198,126) -$3,413,435
Total Revenues $0 $0 $0
Total Operating and MaintenanceCosts
($81,891,043) ($90,966,152) -$9,075,109
Project Net Inflows (Outflows) ($107,675,733.72) ($120,164,277.71) -$12,488,544
WACC Discount Rate 5.21% 5.21% 0.00%
Net Present Value ($60,383,543) ($67,630,916) -$7,247,373
Page 89 of 94

Business Case City Operations | Waste Services
Appendix F - Comparison of Revenue Requirement forAlternatives
Table F1: Annual Cost Revenue Requirement Summary
Revenue Requirement Summary (Annual Costs)
Alternatives
Calendar Year Voluntary Colocation Mandatory Colocation
2022 $8,109,713 $7,234,481
2023 $6,127,119 $4,974,144
2024 $3,494,209 $5,507,765
2025 $3,754,500 $5,725,237
2026 $3,502,270 $4,877,711
2027 $3,505,270 $4,145,149
2028 $4,777,900 $4,504,408
2029 $4,343,816 $4,263,001
2030 $3,260,417 $4,686,733
2031 $3,668,133 $4,907,894
2032 $3,410,498 $4,168,191
2033 $3,435,939 $4,025,467
2034 $6,023,450 $5,102,216
2035 $6,274,940 $5,052,044
2036 $4,426,515 $5,359,984
2037 $4,477,931 $5,971,653
2038 $4,312,260 $5,472,708
2039 $4,539,895 $5,503,118
2040 $6,103,546 $5,681,994
Page 90 of 94

Business Case City Operations | Waste Services
2041 $5,784,618 $5,387,215
2042 $4,320,093 $5,425,276
2043 $4,467,952 $5,680,789
2044 $4,155,226 $5,053,432
2045 $3,972,369 $4,882,541
2046 $431,766 $769,644
2047 $311,338 $348,463
2048 $99,102 $54,285
2049 $0 $45,665
2050 $0 $31,483
2051 $0 $18,596
2052 $0 $6,065
Table F2: Cumulative Present Value Revenue Requirement Summary
Revenue Requirement Summary (Cumulative Present Value)
Alternatives
Calendar Year Voluntary Colocation Mandatory Colocation
2022 $7,708,120 $6,876,230
2023 $13,243,435 $11,369,932
2024 $16,243,825 $16,099,313
2025 $19,308,074 $20,771,986
2026 $22,024,746 $24,555,811
2027 $24,609,262 $27,612,125
2028 $27,957,667 $30,768,863
2029 $30,851,112 $33,608,476
Page 91 of 94

Business Case City Operations | Waste Services
2030 $32,915,351 $36,575,746
2031 $35,122,719 $39,529,164
2032 $37,073,420 $41,913,242
2033 $38,941,352 $44,101,669
2034 $42,053,814 $46,738,107
2035 $45,135,663 $49,219,347
2036 $47,202,026 $51,721,468
2037 $49,188,876 $54,371,079
2038 $51,007,469 $56,679,064
2039 $52,827,251 $58,884,947
2040 $55,152,658 $61,049,745
2041 $57,247,418 $63,000,595
2042 $58,734,365 $64,867,939
2043 $60,196,051 $66,726,404
2044 $61,488,113 $68,297,761
2045 $62,662,148 $69,740,798
2046 $62,783,437 $69,957,002
2047 $62,866,566 $70,050,043
2048 $62,891,716 $70,063,820
2049 $62,891,716 $70,074,835
2050 $62,891,716 $70,082,053
2051 $62,891,716 $70,086,105
2052 $62,891,716 $70,087,362
Page 92 of 94

Business Case City Operations | Waste Services
Figure F1: Cumulative Present Value of Revenue Requirement for Program Alternatives
Page 93 of 94

Business Case City Operations | Waste Services
Appendix G - Annual Operating and Maintenance CostsTable G1 provides the annual operating and maintenance costs for the recommendedAlternative.
Table G1: Annual Operating and Maintenance Costs for Alternative 2
Year O&M Costs Year O&M Costs
2022 $6,723,767 2034 $4,174,480
2023 $4,020,672 2035 $3,947,372
2024 $4,358,771 2036 $4,019,204
2025 $4,382,952 2037 $4,403,103
2026 $3,481,905 2038 $3,397,170
2027 $2,784,152 2039 $3,460,630
2028 $3,170,684 2040 $3,937,468
2029 $2,953,683 2041 $3,676,041
2030 $3,006,885 2042 $3,745,342
2031 $3,343,041 2043 $4,161,456
2032 $3,044,538 2044 $3,800,071
2033 $3,100,119 2045 $3,872,649
Page 94 of 94