Business Case for Microsoft Visual Studio · The solution acquisition benefits, specifically...
14
The Business Case for Visual Studio Quality Assurance and Testing Tools 795 Folsom Street, 1 st Floor | San Francisco, CA 94107 | Tel.: 415.685.3392 | Fax: 415.373.3892 www.piquesolutions.com May 2011 This document is property of Pique Solutions. Reproduction is forbidden unless authorized. Visit www.piquesolutions.com to learn more about our consulting and market research services.
Transcript of Business Case for Microsoft Visual Studio · The solution acquisition benefits, specifically...

The Business Case for Visual Studio Quality Assurance and Testing Tools
795 Folsom Street, 1st
Floor | San Francisco, CA 94107 | Tel.: 415.685.3392 | Fax: 415.373.3892
www.piquesolutions.com
May 2011
This document is property of Pique Solutions. Reproduction is forbidden unless authorized.
Visit www.piquesolutions.com to learn more about our consulting and market research services.

THE BUSINESS CASE FOR VISUAL STUDIO QUALITY ASSURANCE AND TESTING TOOLS
© 2011 Pique Solutions. All rights reserved.
Contents
Executive Summary ......................................................................................... 1
A Comprehensive, Unified Solution for Agile Development ........................... 2
The Business Case for Visual Studio Quality Assurance and Testing Tools . 3
The Economic and Business Benefits .......................................................................................... 4
Activity-Based Process Improvements: Productivity and Efficiency ........................................... 5
Summary of Strategic Benefits.................................................................................................... 8
Conclusions and Key Takeaways .................................................................... 9
Call to Action ................................................................................................... 9
Appendix: Business Case Framework Approach .......................................... 10
Strategic Benefits ...................................................................................................................... 12
Research Methodology ............................................................................................................. 12
Microsoft and Visual Studio are trademarks of the Microsoft group of companies.
All other trademarks are property of their respective owners.

THE BUSINESS CASE FOR VISUAL STUDIO QUALITY ASSURANCE AND TESTING TOOLS
© 2011 Pique Solutions. All rights reserved. 1
Executive Summary This white paper provides a business case for the adoption of Microsoft Visual Studio quality assurance
and testing tools based on in-depth research and analysis of the business and the technical benefits
achieved by companies using Visual Studio for quality management and testing as part of their software
development projects. While most development tools and platforms today don’t support the flow of
value across the lifecycle and don’t adequately address waste in the process, Microsoft’s Application
Lifecycle Management (ALM) foundation provides increased visibility into the lifecycle, a common
process, rich interactions, and support for upstream and downstream processes. The Visual Studio focus
on flow of value and increased transparency make it a powerful tool that enables Agile development
processes and increases productivity and predictability of software construction while significantly
reducing costs.
Some of the key findings of the study include:
In terms of baseline economic benefits, companies achieve a 154%, three-year return on
investment (ROI) based on the tangible cost savings
associated with the acquisition of the Visual Studio Ultimate
and Test Professional products.
As a complement to the baseline economic benefits,
companies on average nearly doubled (91% increase) the
amount of defects found and fixed per development cycle
and reduced the development-to-test cycle time for
preproduction releases by 26%.
From a strategic benefit standpoint, the top benefits cited by the
interviewees include better collaboration among developers and
testers, enablement of Agile development processes, predictability
of software quality, and better visibility into the development and test processes.
Key Study Takeaways
The Visual Studio quality and testing solution provides the benefit of a single platform and tool
set for development and testing activities, which improves productivity and efficiency and
enables better collaboration among developers and testers.
There are substantive economic and business benefits both for companies migrating from
other vendors’ quality and testing tools and for companies migrating from manual processes.
While the economic value (ROI) is substantial and easily justifies the investment, much larger
indirect benefits also can be gained, such as customer satisfaction or even company bottom-
line benefits.
The enablement and scaling of Agile development practices is a key driver for the adoption
of Visual Studio and facilitates companies realizing the benefits of Agile development,
including increasing the flow of value, reducing waste, and providing transparency into the
development process.
91% increase in defects found/fixed
26% reduction in cycle time

THE BUSINESS CASE FOR VISUAL STUDIO QUALITY ASSURANCE AND TESTING TOOLS
© 2011 Pique Solutions. All rights reserved. 2
“In terms of our Agile
adoption, testing was the
piece we were missing with
our former solution.
Visual Studio 2010 and
Team Foundation Server
provide us a superior
platform and tool set for the
integration of development
and test activities.”
Application Manager,
New Zealand Insurance Conglomerate
A Comprehensive, Unified Solution for Agile Development Support for a migration to, or further adoption of, Agile development processes was identified as a top
strategic driver for the adoption of Visual Studio quality assurance and testing tools. Nearly 80% of
companies in the research viewed the adoption of Visual Studio — including the use of Microsoft Agile
process templates — as critical to a move to Agile and, as a result, did not need an explicit cost savings or
value justification for the investment. That said, it is still relevant
and important to quantify the benefits of quality assurance and
testing tools in the context of Agile, particularly around metrics
for quality and cycle-time improvements. These metrics cannot
always be tied back to hard cost savings or economic business
value, but in terms of Agile they are often more important and
relevant measures of success. At the end of the day, Agile
development is about:
A much closer collaboration among business analysts,
developers, testers, and IT management;
Earlier involvement of testing in the development
process, including both engaging testers earlier and
enabling developers to more easily do testing activities
themselves;
Increasing the flow of value by improving the
productivity and efficiency of the development and
testing teams, thus enabling more output to be
delivered in often shorter cycle times;
Reducing the waste in the development cycle through
compressed development and test cycles, and the
dramatic reduction in “no repro” defects;
More transparency and, in turn, manageability and predictability for software development costs
and quality.
As will be demonstrated in the business case — validated with data from 20 in-depth interviews and
detailed data-collection points — the quality assurance and testing capabilities offered by Visual Studio
2010 provide results that satisfy the goals of economic justification, Agile development metrics, and
overall strategic IT and business alignment. In fact, the benefits achieved by the companies studied that
have adopted Agile along with Visual Studio 2010 were greater than those of their counterparts that are
using non-Agile development practices.
The quality assurance and testing capabilities in the comprehensive and integrated Visual Studio offerings
were cited by all study participants as a key driver for the business case, including both companies that
migrated from other high-quality tools like HP Quality Center and those that transitioned from purely
manual processes for testing and quality assurance.

THE BUSINESS CASE FOR VISUAL STUDIO QUALITY ASSURANCE AND TESTING TOOLS
© 2011 Pique Solutions. All rights reserved. 3
The Business Case for Visual Studio Quality Assurance and Testing Tools The business case for Visual Studio 2010 quality assurance and testing tools demonstrates the compelling
value along three key dimensions — economic benefits, business benefits, and strategic benefits. In terms
of the business case, these are defined as follows:
Economic: Demonstrates the judicious use of “scarce” financial resources relative to other
potential investments. Shows a compelling ROI for investment in Visual Studio 2010 Ultimate and
Visual Studio 2010 Test Professional based on the tangible cost savings associated with the
acquisition and usage of the quality assurance and testing capabilities over a three-year period.
Business (Output and Quality): Measures important, tangible metrics for improvements in
software development processes and software quality, particularly related to Agile development
practices and goals. These benefits may not explicitly map to tangible cost savings or return on
investment, but they are often more important.
Strategic: Highlights the impact on strategic elements of development and testing and the overall
alignment with key business objectives.
Table 1 presents a summary of the business case based on the composite data collected through the
primary research interviews conducted by Pique Solutions. It is important to note that the economic
benefits account for only a portion of the developer and tester productivity and efficiency savings
associated with the use of Visual Studio quality assurance and testing tools.
Table 1: Business Case Summary
Economic Business (Output and Quality) Strategic 154% return on investment* over a three-year period, based on tangible cost savings/value:
Solution acquisition costs/savings
Development and test process savings
Management and administration savings
Postproduction release savings
*Based on a $526,000 net present value (NPV) on an investment of $342,000 over three years.
91% increase in the amount of bugs/defects found and fixed per development cycle
38% increase in code coverage
28% reduction in new developer/tester “ramp-up” time
26% reduction in the development-to-test cycle time; results in a 14% reduction in production release cycle time
11% reduction in postrelease maintenance, patches, and hot-fix items required
Better collaboration among developers, testers, and IT management
Enablement of Agile development practices
Higher/more predictable software quality
Increased visibility into the development process

THE BUSINESS CASE FOR VISUAL STUDIO QUALITY ASSURANCE AND TESTING TOOLS
© 2011 Pique Solutions. All rights reserved. 4
The Economic and Business Benefits
An important aspect of the overall business case involved the quantification of the interlinked economic
and business benefits of the Visual Studio 2010 quality assurance and testing solution as evidenced by
customers and partners who had significant historical deployments with the tools.
To capture that information, Pique solutions engaged in an in-depth, multiphase, data-collection process.
The process involved initial and follow-up interviews with participants and the use of a data-collection
spreadsheet instrument that included inputs for 70 unique quantitative data elements along with a
provision for qualitative descriptions of the responses. The questions and entries spanned the lifecycle of
the deployment, including the acquisition of the solution (and benefits associated with acquisition), the
impact on development and testing processes, management and administrative activities, and, ultimately,
the impact on production software releases. The composite profile used for the economic and business
benefit analysis, based on all of the companies interviewed in the study, is provided in Table 2. It is
important to note that the composite profile corresponds to a typical team in the industry, which in many
cases is representative of a subset of the broader development team in the larger companies interviewed.
Table 2: Composite Profile for Business Case
Average Number of Test Staff 17 (11 Visual Studio Test Professional;
6 Visual Studio Ultimate) Average Number of Developer Staff
(directly involved in testing) 14 (Visual Studio Ultimate)
Average Total Size of Developer Staff 55
Average Number of Active Development Projects
8
Average Major Release Cycle 6 months
Previous System for Quality Assurance and Testing
Migrated from manual process
Acquisition Method for Visual Studio 2010
MSDN subscription
Based on the composite profile, an analysis was conducted of the return on investment of the Visual
Studio quality assurance and testing solution — specifically, the net present value of the costs and
tangible benefits achieved, on average, by the interview participants. The summary ROI analysis is
presented in Table 3, demonstrating a 154% ROI with a payback of 17.75 months.
Table 3: ROI Summary
Quality and Testing Return on Investment: ROI and NPV (Three-Year Analysis)
Total Visual Studio Value/Cost Savings (PV*) >>>>>>>>>>> $867,946**
Total Investment in Visual Studio MSDN Subscriptions (PV*)
>>>>>>>>>>> $342,071**
Total NPV* >>>>>>>>>>> $525,875**
Payback (Months) >>>>>>>>>>> 17.75
ROI for Visual Studio >>>>>>>>>>> 153.7%
*Present value (PV) calculations are based on a discount rate of 6%. **U.S. dollar/exchange rate = 1.

THE BUSINESS CASE FOR VISUAL STUDIO QUALITY ASSURANCE AND TESTING TOOLS
© 2011 Pique Solutions. All rights reserved. 5
The investment of $342,000 shown in Table 3 includes the three-year MSDN subscription with Visual
Studio 2010 Ultimate and Test Professional, as well as the implementation and training costs indicated by
the aggregate data provided from the research participants.
Figure 1 provides a breakdown of the undiscounted, three-year benefits by category for the Visual Studio
quality assurance and testing solution. The solution acquisition benefits, specifically relating to MSDN
subscription benefits and the value of the Load Test Virtual User Pack product included with Visual Studio
Ultimate, are significant at 27%.
Figure 1: Benefits and Savings by Category
It should be noted that the acquisition-related benefits do not include the substantial savings associated
with the retirement of software licenses or the termination of support contracts for the interviewee
participants who migrated from other quality assurance and testing tools such as HP Quality Center
(which represented only 21% of the respondents). The majority of the benefits and savings (58%) come in
the form of the reduced or avoided costs associated with the productivity and efficiency of development
and testing staff. That being said, those who did migrate from HP Quality Center did achieve substantive
benefits in terms of developer and tester productivity and efficiency, and that data is factored into the
economic analysis.
Activity-Based Process Improvements: Productivity and Efficiency
A key area of focus for the quantitative assessment and primary research involved detailed questions and
data collection to identify the distribution of effort for developers and testers across key activities and the
average savings in terms of effort and time for those activities based on the usage of Visual Studio quality
assurance and testing tools relative to the effort and time required before the use of the tools.
Figures 2 and 3 provide a summary of the aggregate data based on the research participants’ responses.
For testers, there were significant savings in all of the areas (ranging from 22% to 38% savings of time and
effort) but the largest savings in terms of time and effort was in the area where testers spend the most
time — test execution and regression testing.
One of the study participants provided an example of the magnitude of savings in this area by saying,
“Because all testing was manual prior to our utilization of Visual Studio, the savings in time here are quite
dramatic. For instance, regression testing a particular page in our ASP.NET application might have taken
279,210, 27%
598,135, 58%
108,000, 10% 50,400, 5%
Visual Studio Quality and Testing Solution Benefit and Savings Summary (Three Years; Undiscounted)
Acquisition Related Benefits
Development & Test Productivity andEfficiency Benefits
Reporting & Administration Benefits
Production Software Benefits
U.S. Dollar/Exchange Rate = 1

THE BUSINESS CASE FOR VISUAL STUDIO QUALITY ASSURANCE AND TESTING TOOLS
© 2011 Pique Solutions. All rights reserved. 6
an hour to run through all the scenarios for that particular page. Now, with the coded UI tests, we run
through the same test in about 10 seconds.”
Figure 2: Tester Productivity and Efficiency Savings by Activity
In terms of the developers who are involved in the testing process, Figure 3 highlights two key points.
First, nearly half of these developers’ time, on average, is spent doing testing-related activities as
compared to “heads-down” coding and development. Secondly, there are significant time and effort
savings for the test-related activities, ranging from 22% to 30% savings.
Figure 3: Developer Productivity and Efficiency Savings by Activity
18% (24% time
savings = $60,000 3-year savings)
12% (22% time savings =
$37,000 3-year savings)
41%
(38% time savings = $210,000 3-year
savings)
18% (31% time
savings = $73,000 3-year savings)
11% (34% time
savings = $49,000 3-year savings)
Distribution of Tester Effort by Key Activity (Time Savings with Visual Studio by Activity and Three-Year Cost Savings)
Authoring Test Cases
Authoring Test Scripts
Test Execution andRegression Testing
Documenting andRecording Bugs/Defects
Consolidating Test Dataand Preparing Reports
52% (time savings
not applicable)
12% (25% time
savings = $42,000 3-year savings)
13% (30% time
savings = $47,000 3-year savings)
16% (27% time
savings = $56,000 3-year savings)
8% (22% time
savings = $23,000 3-year savings)
Distribution of Developer Effort by Key Activity (Time Savings with Visual Studio by Activity and Three-Year Cost Savings)
Development/Coding (new code)
Pre-build/deployment to testtesting
Communicating with test staffabout bugs/defects
Fixing/closing defects and bugs
Debugging w/ IntelliTrace

THE BUSINESS CASE FOR VISUAL STUDIO QUALITY ASSURANCE AND TESTING TOOLS
© 2011 Pique Solutions. All rights reserved. 7
Aside from savings based on specific features such as IntelliTrace, the overwhelming theme echoed by all
research participants was the benefit of a unified platform and tool set for activities related to
development and testing.
It is important to note that the activity-based savings identified in Figures 2 and 3 do not necessarily map
to tangible, or hard cost, savings. In fact, based on the research participants’ responses, only about a
quarter (25%) of the productivity and efficiency savings result in reducing the number of resources on the
development and testing teams, using fewer outsourced or contract resources, or avoiding the cost of
bringing on new resources as development and testing workloads grow. This 25% of the efficiency and
productivity gains was the amount used to calculate the return on investment in the previously
mentioned analysis. (See Table 3.) According to the customers and partners interviewed, this is likely a
very conservative figure, particularly for years two and three of the analysis, when development and
testing teams are able to absorb substantial growth in the development portfolio without adding
additional head count.
The balance of the productivity and efficiency savings (75%) is reflected in the ability of existing
development and testing teams to increase their output per cycle and often to shorten the development-
to-test cycles. As a result, the bulk of the productivity and efficiency savings quantified in the study is
realized in the business metrics related to output and software quality. These metrics, also captured in
the research, are summarized in Table 4.
Figure 4: Summary of Business Benefits
Table 4: Business Benefits of Visual Studio 2010 (Output and Quality)
Number of Defects 91% average increase in the number of bugs/defects found
and fixed per development cycle
Code Coverage 38% average increase in code coverage
Postrelease Work Items 11% average decrease in the number of maintenance,
hot-fix, and patch items required
Development-to-Test Cycle Time 26% average reduction in development-to-test
cycle time
Production Release Cycle Time 14% average reduction in production release
cycle time
91%
38%
11% 26%
14%
0%
20%
40%
60%
80%
100%
Increase in defectsfound/fixed
Increase in codecoverage
Reduction of post-release work
items
Reduction of dev-to-test cycle time
Reduction ofproduction
release cycle time
Visual Studio Quality Assurance and Testing Solution Business Benefit Summary (Quality and Cycle Time)

THE BUSINESS CASE FOR VISUAL STUDIO QUALITY ASSURANCE AND TESTING TOOLS
© 2011 Pique Solutions. All rights reserved. 8
“We’re spending much less
time on fixing/closing bugs
because the findings are
getting to the developers so
much faster than before. At a
minimum we’re finding and
fixing approximately 3 times
the number of bugs that we
were prior to moving to Visual
Studio and TFS.”
Development Lead,
Education Software Provider
As illustrated in Table 4, the study data reveals some very
substantial improvements in both quality and cycle time,
based on the process benefits achieved in using Visual
Studio 2010 for development and testing. They
substantiate the increase in the flow of value and
reduction of waste in the development cycle. While the
metrics listed in Table 4 did not explicitly factor into the
return on investment analysis, it does not mean that they
do not have economic value.
Rather, the value of these types of metrics is specific to
the type of business and type of application being
developed and therefore cannot be easily incorporated
into a composite economic analysis. With that said,
improvements like these for quality and cycle time often
trump, and even obviate the need for, a formal ROI
analysis.
Summary of Strategic Benefits
The final element of the business case sought to
understand the strategic benefits of the Visual Studio
quality assurance and testing solution, in an effort to find relevance for a broader IT or even business
strategy. In our data-collection exercise, we presented a list of eight strategic benefits and asked
respondents to rank the top three benefits. The synthesized results for the top three strategic benefits are
listed in Table 5.
Table 5: Strategic Benefits of Visual Studio 2010 (Top Three Based on Stack Ranking)
Rank Strategic Driver
1 Better collaboration among development, testing, and IT management
2 Enablement of Agile development practices
3 (tie) Higher/more predictable software quality
and Increased visibility into the development process
Collaboration was by far the top choice across the interviewee population and is very consistent with the
economic and business benefits that the study brought to light. The ability for developers and testers to
work much more closely together, on the same platform and from the early stages of development, drives
most of the benefits quantified in the study.

THE BUSINESS CASE FOR VISUAL STUDIO QUALITY ASSURANCE AND TESTING TOOLS
© 2011 Pique Solutions. All rights reserved. 9
Conclusions and Key Takeaways Pique Solutions developed an intuitive framework to present the business case for Visual Studio quality
assurance and testing tools. It also collected a deep data set that validated the framework and provided
the basis for quantifying the solution’s economic, business, and strategic benefits.
In conclusion of the study analysis, the key takeaways include:
A common theme echoed by nearly all of the interviewees was the benefit of a single platform and
tool set for development and testing activities, which improves productivity and efficiency and
enables better collaboration among developers and testers. The integration of the tools — and the
ability to perform quality assurance and testing functions in the primary tool used by both
developers and testers — is a key driver for many of the economic, business, and strategic benefits
cited in the study.
Beyond the single platform and tool set, several Visual Studio 2010 features specific to quality
assurance and testing were called out as providing value. These features included IntelliTrace, Lab
Management, Coded UI Testing, Load Test Virtual User Pack, and Team Foundation Server.
There are substantive economic and business benefits both for companies migrating from other
vendors’ quality assurance and testing tools and for companies migrating from manual processes.
While the economic value (ROI) is substantial and easily justifies the investment, the more
important benefits lie in the productivity and efficiency improvements, which result in improved
metrics related to quality and cycle time.
The enablement and scaling of Agile development practices is a key driver for the adoption of
Visual Studio and helps companies to realize the benefits of Agile development, including increas-
ing the flow of value, reducing waste, and providing transparency into the development process.
Call to Action For more information about Visual Studio testing tools, go to:
www.microsoft.com/visualstudio/test
For help with assessing the value of Visual Studio quality assurance and testing tools for your
organization and with developing a business case specific to your company, please send a request
to: [email protected] or call 415.685.3392.

THE BUSINESS CASE FOR VISUAL STUDIO QUALITY ASSURANCE AND TESTING TOOLS
© 2011 Pique Solutions. All rights reserved.
10
Appendix: Business Case Framework Approach The Pique Solutions research and analysis study was designed to assess the impact on the software
development process and quantify the costs and benefits associated with the acquisition and use of
Microsoft Visual Studio quality assurance and testing tools. In terms of the business case framework, the
structure of the framework includes three major categories as illustrated in Figure 5. The business case
provides a way to structure and present the value of the Microsoft Visual Studio quality assurance and
testing solution in a manner that communicates the economic, quantitative, and strategic benefits based
on actual usage of the tools.
Figure 5: Pique Solutions Approach to the Business Case Framework
Economic: Demonstrates the judicious use of “scarce” financial resources relative to other
potential investments. Shows a compelling ROI for Visual Studio 2010 Ultimate and Visual Studio
2010 Test Professional, based on a the tangible cost savings associated with the acquisition and
usage of the quality assurance and testing capabilities over a three-year period.
Business (Output and Quality): Measures important, tangible metrics for improvements in
software development process and software quality, particularly related to Agile development
practices and goals. These benefits may not explicitly map to tangible cost savings or ROI, but
they are often more important.
Strategic: Highlights the impact on strategic elements of development and testing and the overall
alignment with key business objectives.
Using the business case framework for economic, business, and strategic benefits, Pique Solutions
constructed and validated a way to present the business case as it pertains to the adoption and use of
quality assurance and testing tools by customers. The lifecycle includes acquisition of the quality
Justify the Investment
Demonstrate Output & Quality
Improvements
Highlight Strategic Impact
Demonstrate judicious use of “scarce” financial resources relative to other investments. Show a compelling ROI for investment in Microsoft Visual Studio quality and testing tools.
Measure the tangible metrics for improvements in software development process and software quality. They may not explicitly map to cost savings or ROI but are often more important.
Highlight the impact on strategic elements of development and testing and the overall alignment with key business objectives.
THE BUSINESS CASE FOR VISUAL STUDIO QUALITY ASSURANCE AND TESTING TOOLS
© 2011 Pique Solutions. All rights reserved.
11
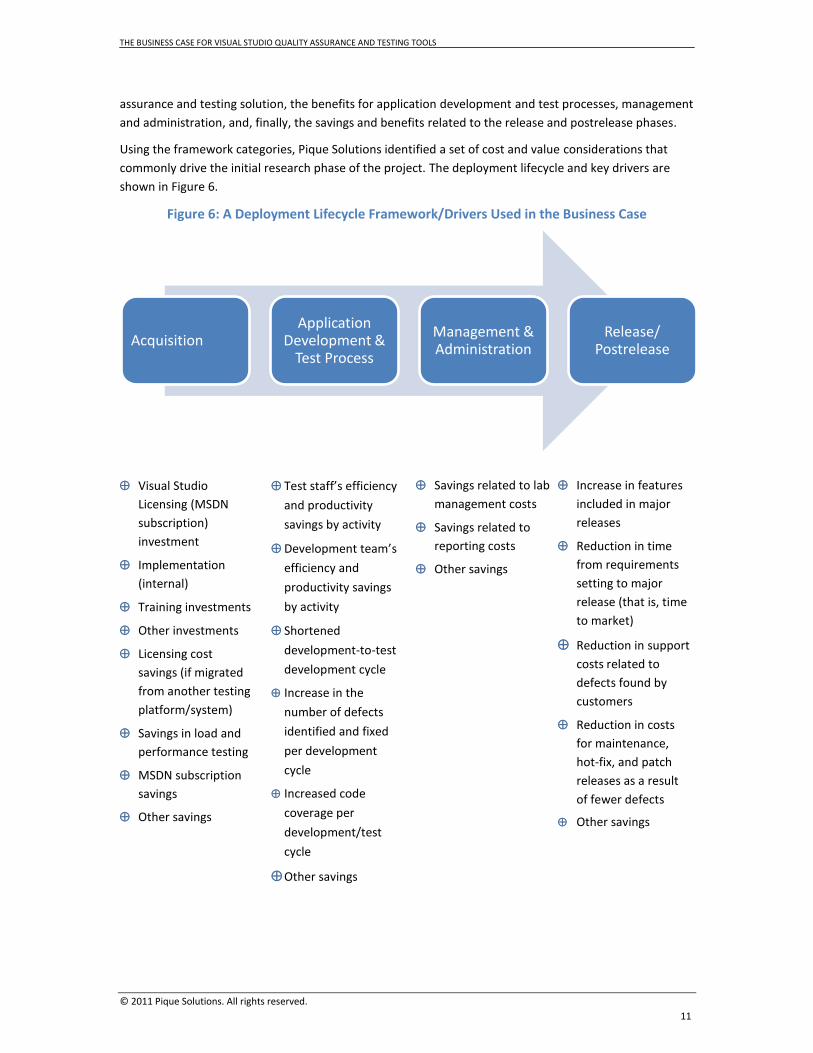
assurance and testing solution, the benefits for application development and test processes, management
and administration, and, finally, the savings and benefits related to the release and postrelease phases.
Using the framework categories, Pique Solutions identified a set of cost and value considerations that
commonly drive the initial research phase of the project. The deployment lifecycle and key drivers are
shown in Figure 6.
Figure 6: A Deployment Lifecycle Framework/Drivers Used in the Business Case
Acquisition Application
Development & Test Process
Management & Administration
Release/ Postrelease
Visual Studio
Licensing (MSDN
subscription)
investment
Implementation
(internal)
Training investments
Other investments
Licensing cost
savings (if migrated
from another testing
platform/system)
Savings in load and
performance testing
MSDN subscription
savings
Other savings
Test staff’s efficiency
and productivity
savings by activity
Development team’s
efficiency and
productivity savings
by activity
Shortened
development-to-test
development cycle
Increase in the
number of defects
identified and fixed
per development
cycle
Increased code
coverage per
development/test
cycle
Other savings
Savings related to lab
management costs
Savings related to
reporting costs
Other savings
Increase in features
included in major
releases
Reduction in time
from requirements
setting to major
release (that is, time
to market)
Reduction in support
costs related to
defects found by
customers
Reduction in costs
for maintenance,
hot-fix, and patch
releases as a result
of fewer defects
Other savings

THE BUSINESS CASE FOR VISUAL STUDIO QUALITY ASSURANCE AND TESTING TOOLS
© 2011 Pique Solutions. All rights reserved.
12
Strategic Benefits The business case framework also included the strategic business value drivers realized as a result of the
adoption and usage of Visual Studio quality assurance and testing tools. The following list of strategic
drivers was included in the framework and corresponding research:
Better overall business agility (time to market)
Better predictability of development costs
Collaboration among the development, test, and management staff involved in development and
test activities
Enablement of agile development practices
Higher/more predictable software quality
Improved customer or partner relationships
Increased visibility into the development process
Reduction in risk associated with production releases
Research Methodology
With the business case framework and drivers identified, Pique Solutions designed an in-depth, multi-
phase data-collection and interview process. The process comprised 14 complete customer data
collections and additional validation and data gathering from three partners, which together represented
hundreds of quality assurance and testing solution deployments. The roles of the interviewees included
test leads, quality assurance managers, development managers, application Managers, and chief
technology officers. The research process involved an initial screening based on usage of the relevant
Visual Studio products and the ability to fully respond to cost and business value questions. For
companies that passed the screening, an initial interview took place to capture the following data:
Company type
Types of applications
Existing tools used prior to Visual Studio
Type(s) of development
Number of developers, number of testers, tools used, etc.
Key drivers for adoption
Adoption and implementation costs
Quantitative and qualitative benefits of the Visual Studio quality assurance and testing tools
Following the interview, each company was given a detailed data-collection instrument, which contained
70 unique, quantitative data elements along with a provision for qualitative descriptions of the responses.
The questions and entries spanned the lifecycle of the deployment, including the acquisition of the
solution (and benefits associated with the acquisition), the impact on development and testing processes,
management and administrative activities, and ultimately the impact on production software releases.
Once data collection was completed, the data was validated and follow-up interviews were scheduled to
confirm the entries and clarify any ambiguities. The data was then synthesized into the composite profile
(using averages of all values), which was used for the economic, business, and strategic business case.