Business Administration/Small Business · PDF filelabor market needs for the Business...
12
1 Business Administration/Small Business Entrepreneur June 2012 Needs Assessment Prepared by Carli Straight Date: June 6, 2012 Business Administration/Small Business Entrepreneur
-
Upload
truongkhue -
Category
Documents
-
view
214 -
download
1
Transcript of Business Administration/Small Business · PDF filelabor market needs for the Business...

1
Business Administration/Small Business Entrepreneur
June 2012 Needs Assessment
Prepared by Carli Straight Date: June 6, 2012
Business Administration/Small Business Entrepreneur
2
Scope Data compiled in this report covers San Bernardino, Riverside, Orange, and Los Angeles counties. Data were drawn from external sources, including the Employment Development Department’s California Labor Market Information and the U.S. Department of Education’s Integrated Postsecondary Education Data System (IPEDS), as well as Chaffey College’s Colleague Administrative database. Data Sources and Calculations Educational Program Data TOP Code Program of Study
0506.40 Small Business and Entrepreneurship The Taxonomy of Programs (TOP) is a standardized system used at the state level to classify programs and courses at California Community Colleges that are intended to achieve the same outcome. The Business Administration/Small Business Entrepreneurship program at Chaffey College is classified under the Small Business and Entrepreneurship TOP code. CIP Code Program of Study
52.0703 Small Business Administration/Management The Classification of Instructional Programs (CIP) is a standardized coding system used at the federal level to facilitate accurate tracking, assessment, and reporting of fields of study and program completion at educational institutions throughout the country. This report draws on the Small Business Administration/Management CIP code, which maps to the Small Business and Entrepreneurship TOP code, to compare Chaffey College to other institutions and examine employment trends. Completions Data Degree and certificate data regarding students at Chaffey College were collected from the Colleague Administrative database. Degree and certificate data for all comparison schools were collected from the U.S. Department of Education’s Integrated Postsecondary Education Data System (IPEDS). All comparison institutions included in this report are postsecondary and have provided data to IPEDS. IPEDS defines postsecondary education as a formal program designed primarily for students beyond high school age. These include academic, vocational, and continuing professional education, and exclude avocational and adult basic education programs. Occupational Data SOC Code Occupational Title
11.9199 Managers, All Other The Standard Occupational Classification (SOC) system is used by federal statistical agencies to classify workers into occupational categories. The Small Business Administration/Management CIP code was mapped to the SOC code listed in the table above using the crosswalk described in the paragraph below.

3
Educational Program to Occupation Crosswalk The TOP-CIP-SOC Crosswalk (Employment Development Department, 2007) was used in this report to map TOP codes to CIP and SOC codes. This crosswalk allows the user to estimate labor market demand for California Community College program completers using SOC-based projections from the California Labor Market Information Division. Industry Data The North American Industry Classification System (NAICS) is used by federal statistical agencies to classify business establishments for the purpose of conducting and reporting research on the U.S. business economy. The Standard Occupation Classification codes are mapped to industry data by the California Labor Market Information Division. Industry information is used to geographically map the business locations of potential employers as well as to observe trends across the industries that employ the occupations identified above.
4
Introduction and Contents Contents Background Information 5 Regional Job Outlook 6 Largest and Fastest Growing Industry Employers 8 Regional Graduation Summary 10 Chaffey College’s Performance on Core Indicators 11 Map of Regional Employers and Competitor Institutions 12 Purpose and Goals Chaffey College currently offers a 30-31-unit Associate of Science, a 30-31-unit Level II Certificate, and a 15-unit untranscripted Level I Certificate in the Business Administration/Small Business Entrepreneur program. The following is a description of the Business Administration/Small Business Entrepreneur program as outlined in the 2011-12 Catalog: “According to a Dun and Bradstreet report of small businesses, inadequate management is a major contributor to business failures. The purpose of this curriculum is to enhance the success rate of entrepreneurs by providing managerial techniques and information that will be useful to anyone who wants to start a business or improve conditions in an established business.” The purpose of this report is to integrate and analyze data from multiple sources to determine labor market needs for the Business Administration/Small Business Entrepreneur program at Chaffey College.
Regional Definitions Inland Empire includes the Riverside-San Bernardino-Ontario Metropolitan Statistical Area (MSA) Los Angeles County includes the Los Angeles-Long Beach-Glendale Metropolitan Division Orange County includes the Santa Ana-Anaheim-Irvine Metropolitan Division Key Terms and Concepts Replacement Jobs: Replacement jobs refer to the number of job openings due to workers leaving an occupation. Annual Openings: Annual openings are calculated by adding the number of new jobs to the number of replacement jobs, divided by the number of years in the projection period. Projections: Projections of employment are calculated by the Employment Development Department and are based on a mathematical formula that includes historical employment and economic indicators along with national, state, and local trends. Occupation: Jobs are grouped into occupations using the federal Standard Occupational Classification (SOC) system. Industry: Occupations are grouped into industries using the North American Industry Classification System (NAICS). Wages: Hourly wages are reported in percentiles and averages. The 25th percentile is a useful proxy of entry-level wages and the 75th percentile of experienced-level wages.
5
Background Information 1 California Community Colleges, Chancellor’s Office, Taxonomy of Programs, Sixth Edition (Corrected Version). 2 O*Net Online: http://online.onetcenter.org/find
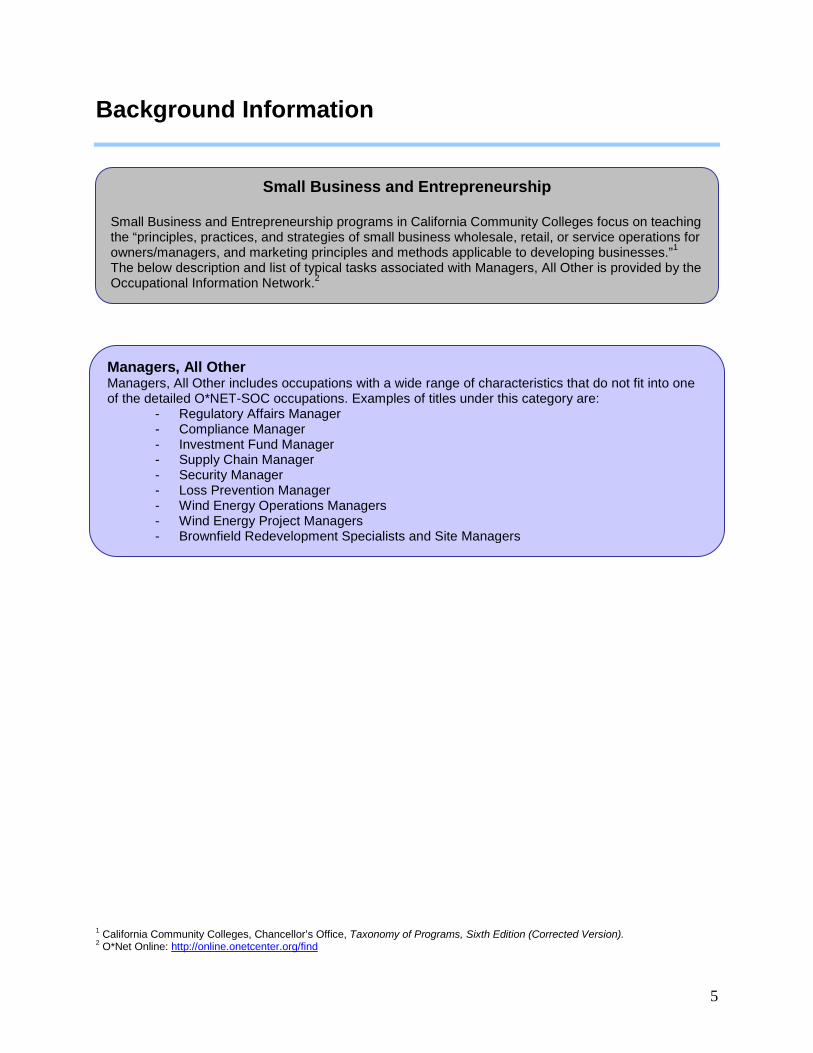
Small Business and Entrepreneurship Small Business and Entrepreneurship programs in California Community Colleges focus on teaching the “principles, practices, and strategies of small business wholesale, retail, or service operations for owners/managers, and marketing principles and methods applicable to developing businesses.”1 The below description and list of typical tasks associated with Managers, All Other is provided by the Occupational Information Network.2
Managers, All Other Managers, All Other includes occupations with a wide range of characteristics that do not fit into one of the detailed O*NET-SOC occupations. Examples of titles under this category are:
- Regulatory Affairs Manager - Compliance Manager - Investment Fund Manager - Supply Chain Manager - Security Manager - Loss Prevention Manager - Wind Energy Operations Managers - Wind Energy Project Managers - Brownfield Redevelopment Specialists and Site Managers
6
Regional Job Outlook
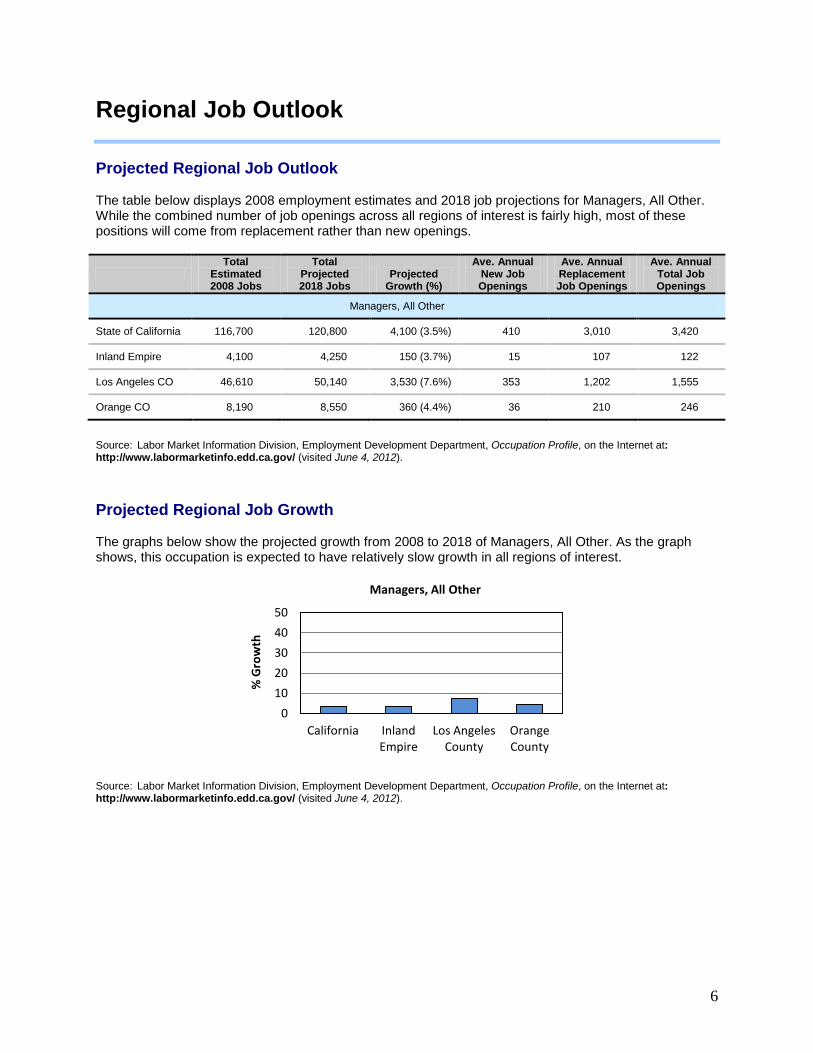
Projected Regional Job Outlook The table below displays 2008 employment estimates and 2018 job projections for Managers, All Other. While the combined number of job openings across all regions of interest is fairly high, most of these positions will come from replacement rather than new openings.
Total
Estimated 2008 Jobs
Total Projected 2018 Jobs
Projected Growth (%)
Ave. Annual New Job Openings
Ave. Annual Replacement Job Openings
Ave. Annual Total Job Openings
Managers, All Other
State of California 116,700 120,800 4,100 (3.5%) 410 3,010 3,420
Inland Empire 4,100 4,250 150 (3.7%) 15 107 122
Los Angeles CO 46,610 50,140 3,530 (7.6%) 353 1,202 1,555
Orange CO 8,190 8,550 360 (4.4%) 36 210 246
Source: Labor Market Information Division, Employment Development Department, Occupation Profile, on the Internet at: http://www.labormarketinfo.edd.ca.gov/ (visited June 4, 2012). Projected Regional Job Growth The graphs below show the projected growth from 2008 to 2018 of Managers, All Other. As the graph shows, this occupation is expected to have relatively slow growth in all regions of interest.
0
10
20
30
40
50
California Inland Empire
Los Angeles County
Orange County
% G
row
th
Managers, All Other
Source: Labor Market Information Division, Employment Development Department, Occupation Profile, on the Internet at: http://www.labormarketinfo.edd.ca.gov/ (visited June 4, 2012).
7
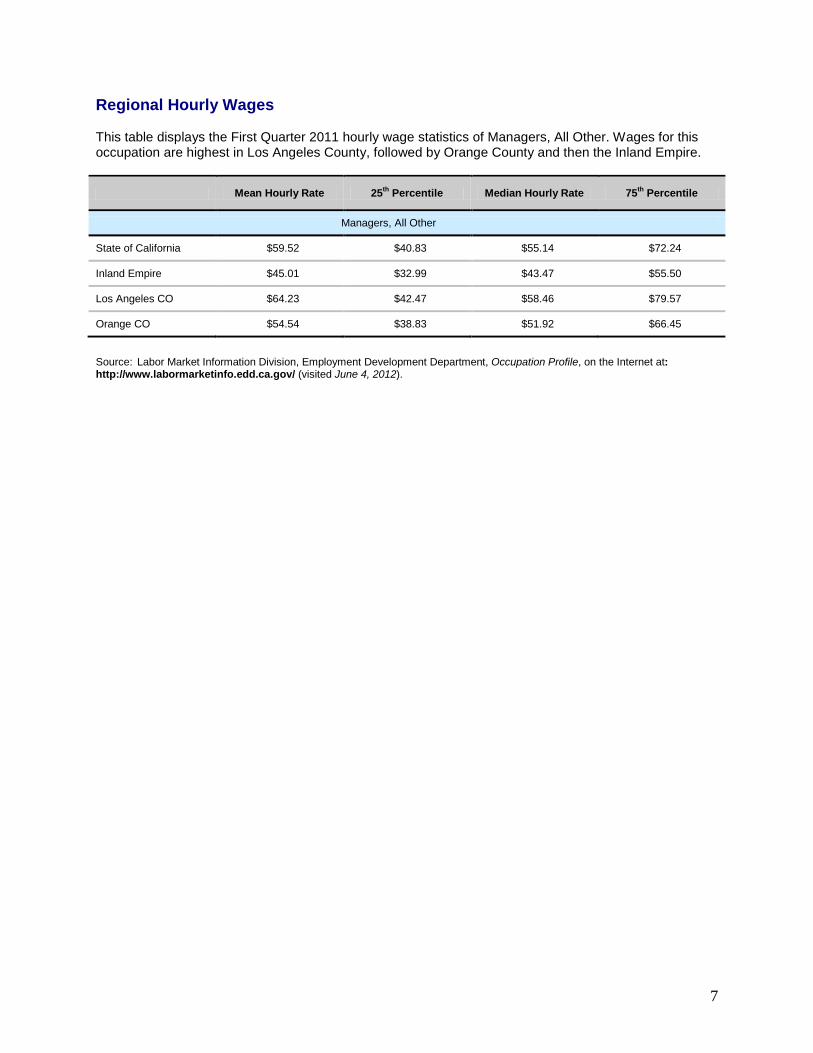
Regional Hourly Wages This table displays the First Quarter 2011 hourly wage statistics of Managers, All Other. Wages for this occupation are highest in Los Angeles County, followed by Orange County and then the Inland Empire.
Mean Hourly Rate 25th Percentile Median Hourly Rate 75th Percentile
Managers, All Other
State of California $59.52 $40.83 $55.14 $72.24
Inland Empire $45.01 $32.99 $43.47 $55.50
Los Angeles CO $64.23 $42.47 $58.46 $79.57
Orange CO $54.54 $38.83 $51.92 $66.45
Source: Labor Market Information Division, Employment Development Department, Occupation Profile, on the Internet at: http://www.labormarketinfo.edd.ca.gov/ (visited June 4, 2012).
8
Largest and Fastest Growing Industry Employers
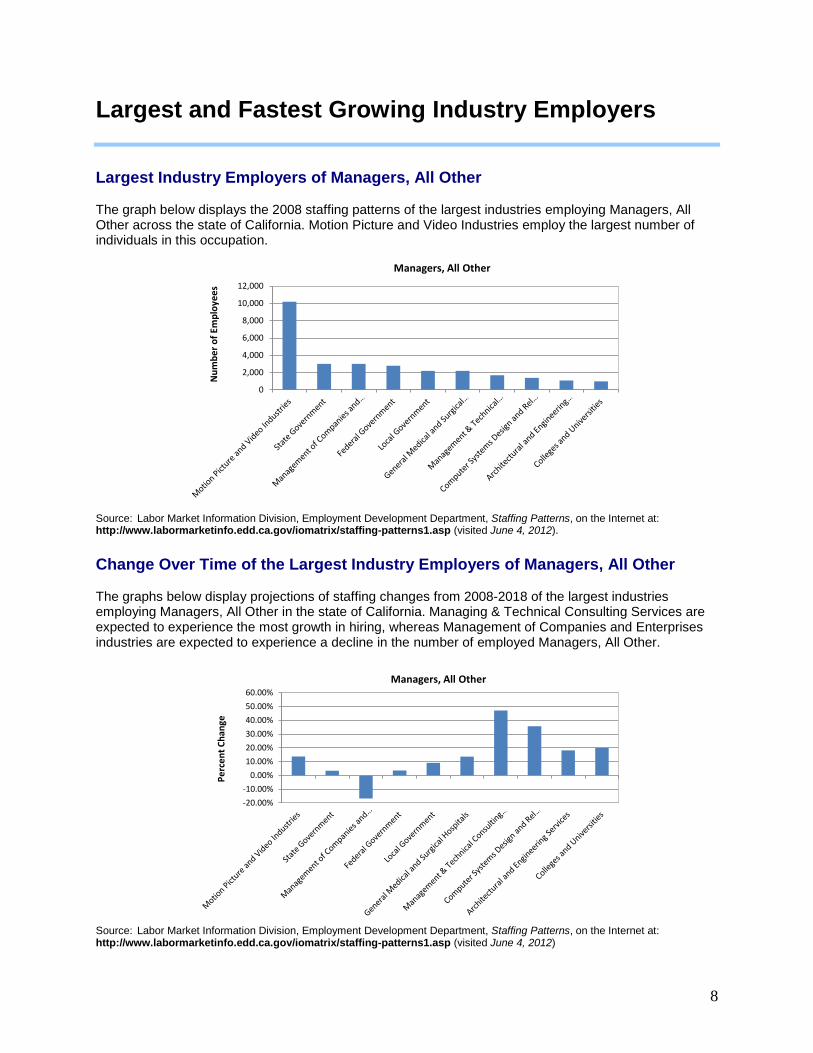
Largest Industry Employers of Managers, All Other The graph below displays the 2008 staffing patterns of the largest industries employing Managers, All Other across the state of California. Motion Picture and Video Industries employ the largest number of individuals in this occupation.
0
2,000
4,000
6,000
8,000
10,000
12,000
Num
ber o
f Em
ploy
ees
Managers, All Other
Source: Labor Market Information Division, Employment Development Department, Staffing Patterns, on the Internet at: http://www.labormarketinfo.edd.ca.gov/iomatrix/staffing-patterns1.asp (visited June 4, 2012). Change Over Time of the Largest Industry Employers of Managers, All Other The graphs below display projections of staffing changes from 2008-2018 of the largest industries employing Managers, All Other in the state of California. Managing & Technical Consulting Services are expected to experience the most growth in hiring, whereas Management of Companies and Enterprises industries are expected to experience a decline in the number of employed Managers, All Other.
-20.00%
-10.00%
0.00%
10.00%
20.00%
30.00%
40.00%
50.00%
60.00%
Perc
ent C
hang
e
Managers, All Other
Source: Labor Market Information Division, Employment Development Department, Staffing Patterns, on the Internet at: http://www.labormarketinfo.edd.ca.gov/iomatrix/staffing-patterns1.asp (visited June 4, 2012)
9
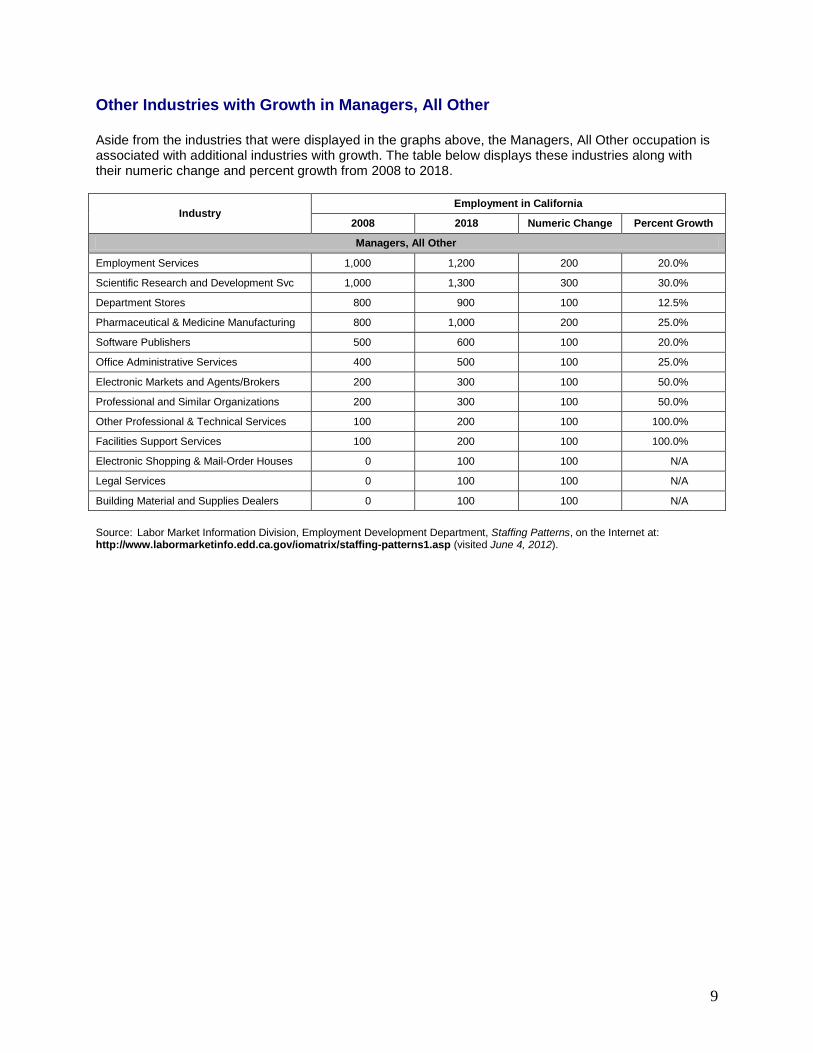
Other Industries with Growth in Managers, All Other Aside from the industries that were displayed in the graphs above, the Managers, All Other occupation is associated with additional industries with growth. The table below displays these industries along with their numeric change and percent growth from 2008 to 2018.
Industry Employment in California
2008 2018 Numeric Change Percent Growth
Managers, All Other
Employment Services 1,000 1,200 200 20.0%
Scientific Research and Development Svc 1,000 1,300 300 30.0%
Department Stores 800 900 100 12.5%
Pharmaceutical & Medicine Manufacturing 800 1,000 200 25.0%
Software Publishers 500 600 100 20.0%
Office Administrative Services 400 500 100 25.0%
Electronic Markets and Agents/Brokers 200 300 100 50.0%
Professional and Similar Organizations 200 300 100 50.0%
Other Professional & Technical Services 100 200 100 100.0%
Facilities Support Services 100 200 100 100.0%
Electronic Shopping & Mail-Order Houses 0 100 100 N/A
Legal Services 0 100 100 N/A
Building Material and Supplies Dealers 0 100 100 N/A
Source: Labor Market Information Division, Employment Development Department, Staffing Patterns, on the Internet at: http://www.labormarketinfo.edd.ca.gov/iomatrix/staffing-patterns1.asp (visited June 4, 2012).
10
Regional Graduation Summary
Education and Training3
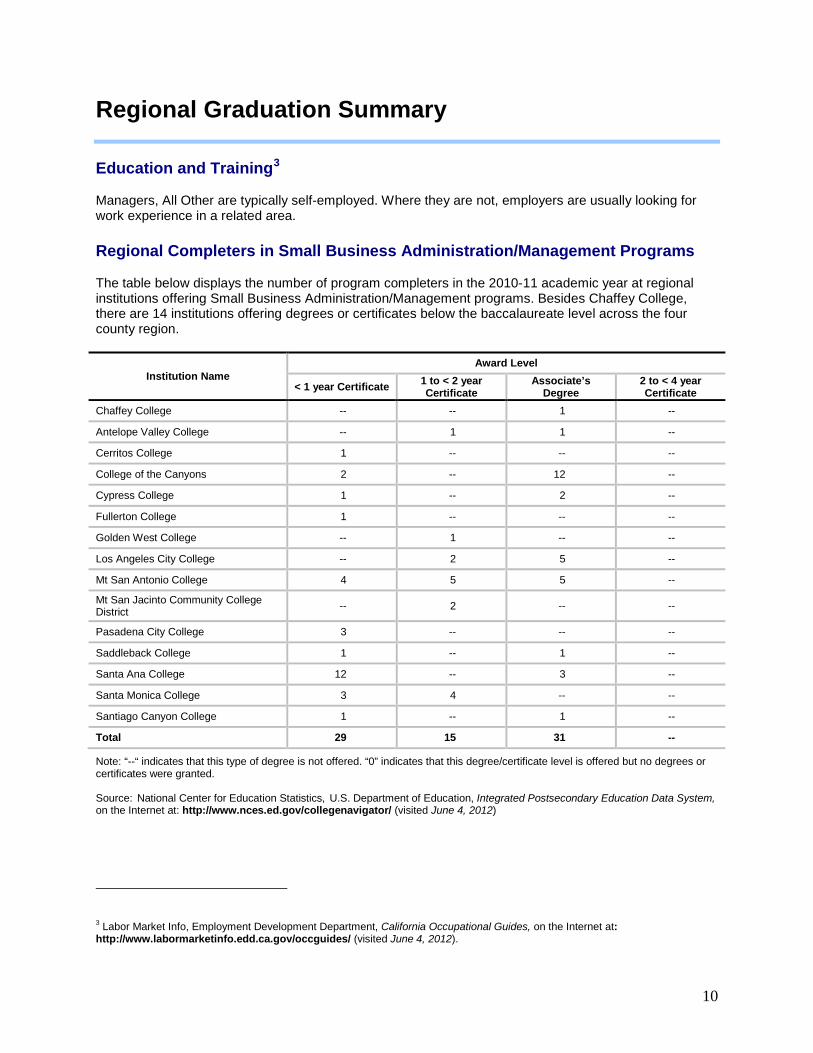
Managers, All Other are typically self-employed. Where they are not, employers are usually looking for work experience in a related area. Regional Completers in Small Business Administration/Management Programs The table below displays the number of program completers in the 2010-11 academic year at regional institutions offering Small Business Administration/Management programs. Besides Chaffey College, there are 14 institutions offering degrees or certificates below the baccalaureate level across the four county region.
Institution Name Award Level
< 1 year Certificate 1 to < 2 year Certificate
Associate’s Degree
2 to < 4 year Certificate
Chaffey College -- -- 1 --
Antelope Valley College -- 1 1 --
Cerritos College 1 -- -- --
College of the Canyons 2 -- 12 --
Cypress College 1 -- 2 --
Fullerton College 1 -- -- --
Golden West College -- 1 -- --
Los Angeles City College -- 2 5 --
Mt San Antonio College 4 5 5 --
Mt San Jacinto Community College District -- 2 -- --
Pasadena City College 3 -- -- --
Saddleback College 1 -- 1 --
Santa Ana College 12 -- 3 --
Santa Monica College 3 4 -- --
Santiago Canyon College 1 -- 1 --
Total 29 15 31 --
Note: “--“ indicates that this type of degree is not offered. “0” indicates that this degree/certificate level is offered but no degrees or certificates were granted. Source: National Center for Education Statistics, U.S. Department of Education, Integrated Postsecondary Education Data System, on the Internet at: http://www.nces.ed.gov/collegenavigator/ (visited June 4, 2012) 3 Labor Market Info, Employment Development Department, California Occupational Guides, on the Internet at: http://www.labormarketinfo.edd.ca.gov/occguides/ (visited June 4, 2012).
11
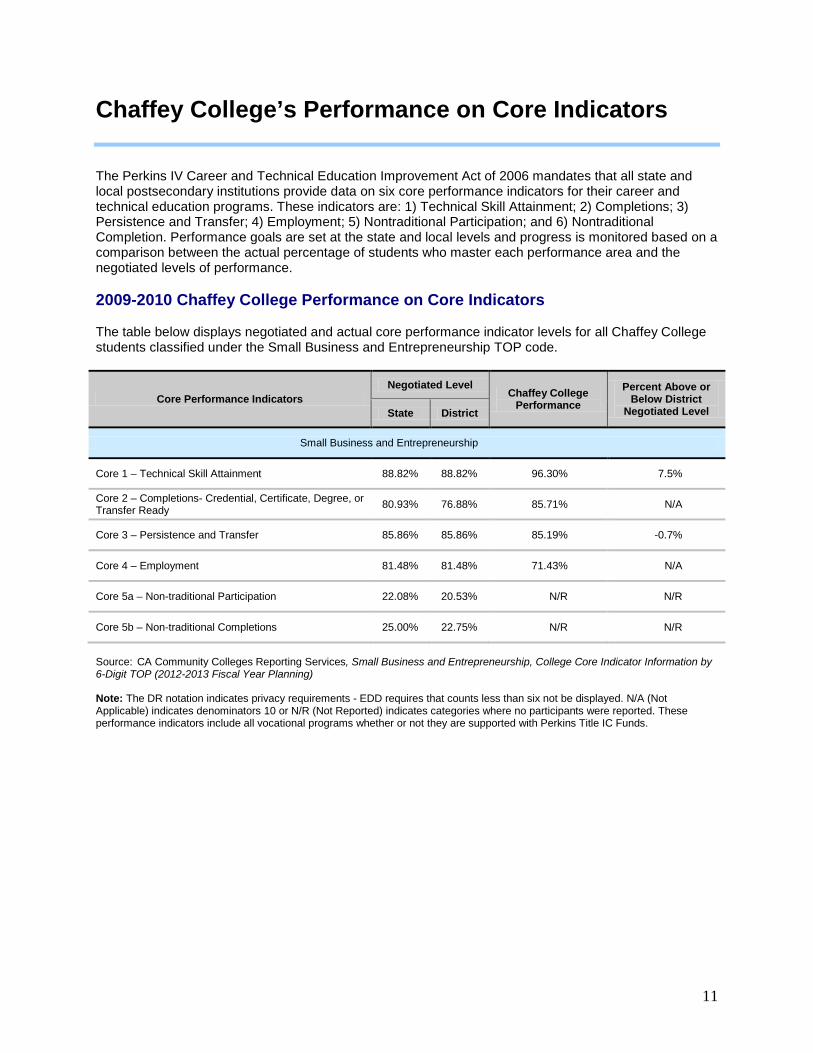
Chaffey College’s Performance on Core Indicators The Perkins IV Career and Technical Education Improvement Act of 2006 mandates that all state and local postsecondary institutions provide data on six core performance indicators for their career and technical education programs. These indicators are: 1) Technical Skill Attainment; 2) Completions; 3) Persistence and Transfer; 4) Employment; 5) Nontraditional Participation; and 6) Nontraditional Completion. Performance goals are set at the state and local levels and progress is monitored based on a comparison between the actual percentage of students who master each performance area and the negotiated levels of performance. 2009-2010 Chaffey College Performance on Core Indicators The table below displays negotiated and actual core performance indicator levels for all Chaffey College students classified under the Small Business and Entrepreneurship TOP code.
Core Performance Indicators Negotiated Level
Chaffey College Performance
Percent Above or Below District
Negotiated Level State District
Small Business and Entrepreneurship
Core 1 – Technical Skill Attainment 88.82% 88.82% 96.30% 7.5%
Core 2 – Completions- Credential, Certificate, Degree, or Transfer Ready 80.93% 76.88% 85.71% N/A
Core 3 – Persistence and Transfer 85.86% 85.86% 85.19% -0.7%
Core 4 – Employment 81.48% 81.48% 71.43% N/A
Core 5a – Non-traditional Participation 22.08% 20.53% N/R N/R
Core 5b – Non-traditional Completions 25.00% 22.75% N/R N/R
Source: CA Community Colleges Reporting Services, Small Business and Entrepreneurship, College Core Indicator Information by 6-Digit TOP (2012-2013 Fiscal Year Planning) Note: The DR notation indicates privacy requirements - EDD requires that counts less than six not be displayed. N/A (Not Applicable) indicates denominators 10 or N/R (Not Reported) indicates categories where no participants were reported. These performance indicators include all vocational programs whether or not they are supported with Perkins Title IC Funds.
12
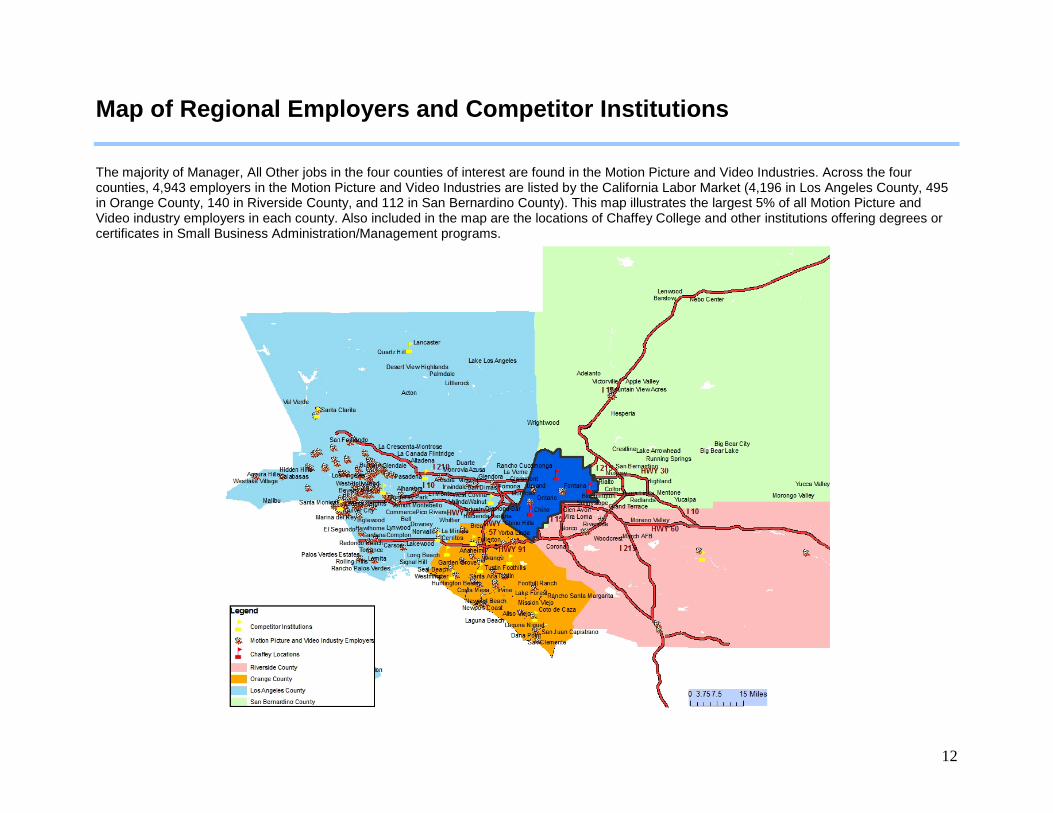
Map of Regional Employers and Competitor Institutions
The majority of Manager, All Other jobs in the four counties of interest are found in the Motion Picture and Video Industries. Across the four counties, 4,943 employers in the Motion Picture and Video Industries are listed by the California Labor Market (4,196 in Los Angeles County, 495 in Orange County, 140 in Riverside County, and 112 in San Bernardino County). This map illustrates the largest 5% of all Motion Picture and Video industry employers in each county. Also included in the map are the locations of Chaffey College and other institutions offering degrees or certificates in Small Business Administration/Management programs.