BUS occupant survey method: details for licensees · BUS occupant survey method: details for...
14
BUS occupant survey method: details for licensees Introduction This has details of the BUS Methodology occupant data reporting and analysis method. It is intended as background for prospective licensees and others using or wanting to understand the system. The method is for evaluation studies of: - non-domestic buildings of all types with permanent occupants; - housing, especially those with sustainable credentials. Questionnaires are normally used as the basic way of gathering data from building occupants. We find that this approach is the most practical and cost-effective, both for the people and managers in the buildings being studied, and for ourselves. This can be supplemented if necessary with interviews, individual telephone call follow-ups, focus groups, and revisits. We also use an internet version (see below). For the non-domestic versions: Survey data gathered from paper questionnaires are typed into pre-formatted Excel data files. Survey data from the internet version are imported to a database. The database is then processed by a series of scripts to produce the results. The main results are presented as an Appendix which includes: - up to 50 pages of data and benchmarks (Appendix A) - length depends on the questionnaire being used ; - comments from respondents (Appendix B) ; - graphics for up to 65 variables. These are supplied as confidential and anonymous web links. You may log in with a standard web browser. Appendices A and B are distributed as pdf files. You may then: - write your own report prefacing the Appendix which has been supplied to you; - commission us to write one for you (for which we would normally charge extra). To use the BUS Methodology occupant questionnaire you must sign a licence in advance of the survey. For the domestic (housing) versions; - There is a standard version, with two variants. - Data from the early surveys are currently being collected and will form the basis of a benchmarking system. - Questionnaires are administered to house occupiers by field researchers. They are used as: interview pro formas (especially for those who may have difficulty filling them in); standard write-in questionnaires; as the basis for a telephone interview; or in internet format. The choice of any or all of these depends on circumstances. What is it for? The BUS analysis method is a quick and thorough but not simplistic way of obtaining professional-level feedback data on building performance, primarily from the occupants. It may be used by itself, or with other techniques as part of a broader post-occupancy evaluation. By professional-level we mean: - useful by advanced design practices and research organisations for obtaining detailed diagnostics on building performance; - passes examination by Ethical Standards Committees (universities often require internal assessment); - statistically rigorous, to satisfy high standards of data reporting and analysis; - interesting and easy to understand for non-specialists; - incorporating benchmarks which are empirically sound (that is, based on results from real buildings, not simulations, theories or guesswork); 1
Transcript of BUS occupant survey method: details for licensees · BUS occupant survey method: details for...

BUS occupant survey method: details for licensees
Introduction
This has details of the BUS Methodology occupant data reporting and analysis method. It is intended as background for prospective licensees and others using or wanting to understand the system.
The method is for evaluation studies of:
- non-domestic buildings of all types with permanent occupants;
- housing, especially those with sustainable credentials.
Questionnaires are normally used as the basic way of gathering data from building occupants. We find that this approach is the most practical and cost-effective, both for the people and managers in the buildings being studied, and for ourselves. This can be supplemented if necessary with interviews, individual telephone call follow-ups, focus groups, and revisits. We also use an internet version (see below).
For the non-domestic versions:
Survey data gathered from paper questionnaires are typed into pre-formatted Excel data files. Survey data from the internet version are imported to a database. The database is then processed by a series of scripts to produce the results.
The main results are presented as an Appendix which includes:- up to 50 pages of data and benchmarks (Appendix A) - length depends on the questionnaire being used ;- comments from respondents (Appendix B) ;- graphics for up to 65 variables. These are supplied as confidential and anonymous web links. You may
log in with a standard web browser.
Appendices A and B are distributed as pdf files.
You may then:- write your own report prefacing the Appendix which has been supplied to you;- commission us to write one for you (for which we would normally charge extra).
To use the BUS Methodology occupant questionnaire you must sign a licence in advance of the survey.
For the domestic (housing) versions;
- There is a standard version, with two variants.
- Data from the early surveys are currently being collected and will form the basis of a benchmarking system.
- Questionnaires are administered to house occupiers by field researchers. They are used as: interview pro formas (especially for those who may have difficulty filling them in); standard write-in questionnaires; as the basis for a telephone interview; or in internet format. The choice of any or all of these depends on circumstances.
What is it for?
The BUS analysis method is a quick and thorough but not simplistic way of obtaining professional-level feedback data on building performance, primarily from the occupants. It may be used by itself, or with other techniques as part of a broader post-occupancy evaluation.
By professional-level we mean:- useful by advanced design practices and research organisations for obtaining detailed diagnostics on
building performance;- passes examination by Ethical Standards Committees (universities often require internal assessment);- statistically rigorous, to satisfy high standards of data reporting and analysis;- interesting and easy to understand for non-specialists;- incorporating benchmarks which are empirically sound (that is, based on results from real buildings, not
simulations, theories or guesswork);
1

- cross-disciplinary, so that findings are equally useful for designers, managers, researchers, developers and occupiers.
The method is now an integral part of :- the ‘Soft Landings’ approach to briefing, monitoring, feedback and commissioning;- the Technology Strategy Board's building evaluation programme;- the Nabers building assessment method (Australia);- the BEES building assessment method (New Zealand);- Arup Appraise;- PhD programmes worldwide;- Commercial clients worldwide.
Who is it for?
Anyone who wants to know more about building performance. We try to give convincing answers based on trustworthy data. We are not testing hypotheses or theories (although the method can be used for this if you wish). We are not using research to promote other services. There are no hidden agendas.
The outputs are helpful to:- designers, especially architects and engineers, to assess how well buildings work as part of briefing,
design, post-occupancy analysis and strategic thinking about the future;- occupiers, to see whether their buildings give value for money, especially with respect to the occupants’
needs and perceptions;- managers, to help improve services to occupiers and users;- developers, to extend and improve their products and services;- consultants, to increase their knowledge of how buildings work;- researchers, to extend their data sources and knowledge base;- students, for project work;- lecturers, as source material.
Who uses it?
Usage is split 60:40 between advanced design practices (along with consultancies, developers and building owners) and researchers, usually in universities and research associations.
The method originated in 1985, and has been used by over 500 organisations and individuals worldwide. Licensing has been in operation since 1995.
The method is either licensed by third parties or used in-house by licensees.
Most outputs are not in the public domain. A notable exception is the series of Probe post-occupancy studies, which used the original BUS method under licence.
About half the buildings on the non-domestic dataset are in the UK and Ireland. The rest are spread over 16 other countries.
You get with the licence
Non domestic versions
- The questionnaire (there are three main formats (q.v.) with variants (there are also versions in Dutch, German, Norwegian, Spanish, Portuguese, Italian, French, Japanese and Swedish, and tropical climate and monsoon versions).
- Advice on how best to carry out the survey.- A supplied Excel data file for the data input (you do the data input to a set format).- Extra statistics if you need to carry out statistical tests more detailed than those already supplied (e.g. to
meet more astringent requirements of academic referees).- Analysis of the results with benchmarks (using our in-house database) based on the data you have input
in to the Excel file and sent to us. - These results are presented as an Appendix (q.v. Introduction) so that you can construct your own report
if you want.- Other support as required (within reason (!), extra if not).
2

Domestic versions
- A standard questionnaire (English version only).- Advice on how best to carry out the survey.- A supplied Excel data file for the data input (you do the data input to a set format).
Why do we ask for a licence?
We do not make the questionnaire openly available in the first instance. We have found that asking users to sign a licence first is a better method. Our main concern is that people have been carrying out studies without either telling us or letting us incorporate their data into our benchmarks. As a result, the feedback loop was not being properly closed.
We ask for a licence:- to develop the benchmarks by incorporating your data (anonymously) into them;- to subject the technique to continued scrutiny and testing by third parties;- to develop relationships with like-minded people worldwide;- to cover our costs (but the licence is free to supervised postgraduates, and, in exceptional cases,
undergraduates as well) (q.v. Charges);- to open up opportunities for new projects;- to help protect the method (which has taken 20 years in development and refinement).
What data do I get?
Non domestic versions
The method gives a range of quantitative and qualitative data usually including the following (depending on which version is used):- Background information about age, sex, time in the building, time at desk, time at VDU, workgroup size,
window seats and other basic information about the sample and the respondents.- Ratings and feedback for design, needs, image, cleaning, storage, meeting facilities.- Response times for key variables.- Perceived productivity.- Perceived health.- Thermal comfort.- Ventilation.- Lighting, including glare.- Noise, including interruptions.- Furniture and space in the building.- Other workplace performance variables including e.g. perceived control.- Full ratings and benchmarks.- Comments organised alphabetically and by question category.- Web enabled graphics for 65 variables.- The ability to interrogate the database to answer more specific questions.
Domestic versions
- Standard sets of data in modules which are compatible with the non-domestic versions (see above).- Further questions about use, needs and context appropriate to the situation and circumstances.- Benchmarks are under development for the domestic version.
Charges
Non domestic versions
Our charging policy is normally:- On application. - In special circumstances, we might look at a package deal.- The licence is free to supervised postgraduate students working on their own dissertations with the
agreement of their supervisor.- Special rates may be applicable to projects for funded research, the voluntary sector or small-scale
design practices. This will depend on the scale and purpose of the project.
3

- The charging covers the intellectual property and an analysis charge.
We normally require that the licence fee is payable on receipt of the questionnaire before the study takes place.
Changes to the questionnaire are discouraged - because it adds extra cost - but they can be incorporated if required.
Domestic versions- On application. For example, if a licensee wants to study a group of six houses in a new project after six
months and then again after eighteen months, then this counts as two phases. The number of houses in each phase (six, in this case) is not normally a factor in the licence cost.
Questionnaires are best for the job
Our main analysis tool is the questionnaire. We find the questionnaire to be a good compromise in achieving our objectives. It is/gives:- easy to understand for most building users;- quick to fill in;- rapid to administer (in and out of the building the same day);- not a threat to anybody (questions can be vetoed);- a wide selection of coverage - we find this is enough to cover the majority of topics but not
unmanageable;- sufficient information for different viewpoints (e.g. architecture, building services, facilities management);- appropriate for benchmarking;- a balance between qualitative and quantitative data;- reasonably easy to analyse, given the potential complexity of buildings;- easy to translate;- usable by others without supervision;- an open-ended format, so changes can be incorporated;- cost effective, especially using the standard version;- underpinned by a database, so data can be further interrogated if required.
Range of questionnaires now in use
The questionnaires have evolved from the original 16-page version in 1985 to a slicker versions now.
We normally use a paper questionnaire to collect the data because 2. Not all building users have computers, 3. Response rates are much higher.
For the non-=domestic survey, the questionnaire is usually handed out in the morning and collected in the afternoon of the same day. We find that this gives approach us high response rates and minimises impacts on the occupants and managers. We page-set the questionnaires using InDesign software, outputting files in pdf format.
The range now covers:1. One-page questionnaire (with optional journey to work page added). 2. Two-page questionnaire Probe (with optional journey to work page added). This evolved originally from
the 1985 BUS Office Environment Survey questionnaire . The BRE/ Royal Society of Health questionnaire is also derived in part from this.
3. Workplace questionnaire (as 2. but with an emphasis on work and the workplace.) This was introduced in 1997 to give more emphasis to work requirements . Questions on e.g. control, quickness of response and response time were omitted from 2. and replaced with more details on respondents' work and how it is affected by the building. This is now the standard questionnaire.
4. Three-page version. Combines all questions in 2 and 3, plus journey-to-work with further facilities management questions added. We ensure that a core set of a minimum of 10 questions is always used so that benchmark comparability is maintained.
5. Dutch, Spanish, Portuguese, German, Italian, Swedish, French, Norwegian and Japanese translations of 3 (and Swedish version of 2).
6. Tropical climate and monsoon variants7. Domestic / residential version for assessment of houses. This is a standard questionnaire with two
variants.8. Internet version of 1,3 and 7 (in preparation).
4
All the questionnaires have a common set of ten rating scales which are used for benchmarking. We normally insist that these are retained, otherwise the benchmarking and rating system will not work properly.
Outside the basic set of questions, you can add or subtract questions, but we ask you not to change any. This is because minor changes magnify the difficulties of managing data files, especially when they are compared.
Data input
Once filled in by the respondents, the data from the questionnaires are typed in to a pre-formatted Excel file, using a standard file format with fixed variable names. The internet version sends data pre-formatted as e-mails to Building Use Studies.
We have considered scanning in the data, but have found that the volume of data does not merit batch processing. You can spend more time correcting the input for scanning as it takes to type in anyway.
Typing data in by hand also introduces a quality control phase, so that, for example, spelling can be corrected and acronyms expanded.
The survey building data files in Excel are then error and range checked.
We use Excel because it is cross-platform and widely available making it relatively easy for anyone in most of its versions. It is normal for our licensees to type their data using Excel. However, if you wish us to prepare the data for you then this can be carried out for a small extra fee.
Excel files are readable by FileMaker Pro and Aabel (a statistical graphics package used for publication quality output), as well as being programmable by AppleScript.
Our in-house analysis and data entry work is carried out using Apple OS, but with software which is cross-platform so that the approach can be replicated on other platforms if necessary.
We have found that minor problems can arise when moving files from one platform to another. But they are relatively trivial compared with the advantages of transparency across platforms.
The analysis database
The data file/s from Excel are input to an in-house system using FileMaker Pro. We use FileMaker Pro because it is easy to program (especially when this is done with gaps of weeks or months between sessions) and does not require advanced technical expertise to maintain. This means that we can manage the program ourselves and make changes as we go along without it becoming too costly.
The system allows basic statistics and indicators to be calculated and output in a set format. These are provided in the Appendices to our reports.
The database can also be used to generate further analyses not covered in the basic tables.
The database approach introduces better levels of data management and considerably reduces the burden of data management across hundreds of files.
However, the system is not fully integrated and is not turnkey (i.e. it requires some specialist operation from ‘curators’). This is deliberate. Buildings and their operating contexts are complex. Survey requirements are also constantly changing, so there will always be some fine-tuning needed. We do not think that it is practical to produce a complete 'point and go' survey instrument.
We find Excel graphics and statistics are not specific enough for our needs and there is no FileMaker Pro graphics capability, so we generate our own graphics and statistics to the level required.
Data output from the FileMaker Pro database are input into a buildings metafile maintained to generate benchmark information, statistical tests and benchmark charts.
Our system is thus 'open'. This has the advantages of:- using the strengths of established software packages; - allowing changes to be gradually introduced (and tested) from one survey to the next; - having elements of manual input which helps error checking (and aids interpretation because you are
closer to the data);
5

- being able to adapt outputs to different types of requirement; - being able to add new features relatively easily.
The FileMaker database also has a comments analysis system and a data validity checker, both in AppleScript, which organise the comments from the questionnaires and examine data ranges and type validity.
Drawbacks include:- extra quality control takes extra time;- mistakes can sometimes still slip through (this is rare but still possible);- some aspects of the system may not be finalised (e.g. some of the definitions of what constitutes red,
amber and green on some arrow charts are yet to be finally decided).
In order to make mistakes easier to spot we use a double-entry method, so that important calculations are carried out by two routes, then compared to make sure they match properly.
The benchmarks datafile
This is maintained in FileMaker Pro. A standard set of graphics is produced, supplemented, if necessary, with more detailed statistics using the specialist statistics package Aabel.
Client requirements differ appreciably so we use a 'highest common factor' approach which covers the hardest case as well as the simplest. One client might require results in a simple format ('All I want to know is whether our building is better than theirs'). The next wants statistical tests ('I need to run this past the statisticians in market research') . Others want fine detail ('Is the glare worse on the second or first floors?').
This approach allows us to carry out most type of statistical tests quickly. It has the virtues of :- well-defined graphics (e.g. scatter plots with regression) which can be quickly pasted into reports;- it can be learned easily so that the user does not forget how to run the program between sessions.
Aabel is employed for any operations on the benchmark dataset (not individual building studies). We input the results from the building surveys into the benchmark file.
The 'slider' graphics used in Appendix A show how well a study building performs against the benchmarks. They are created to our own specification automatically by AppleScript using data from the FileMaker Pro database. The plots use Intaglio graphics driven by Applescripts.
Why go to all this trouble? Basically, to meet the hardest case we encounter without then having to carry out major rework (which raises costs substantially).
Normally, benchmarks are available only to licensees and are not in the public domain. This is a condition of the licence.
Example of a benchmark plot
These plots are supplied online for all main variables in the non-domestic study. The histogram shows how the responses for the variable shown are distributed amongst the sample. The plots show how the study buildings compare with the benchmark dataset. Actual benchmarks are shown on the 'slider' graphic (ticks on top and bottom scales).
6

Air in summer: dry/humid
Score: 3.47L Mean U
Benchmark 3.62 3.74 3.86
Scale midpoint 3.88 4 4.12
Study mean Scale midpoint
Percentile 26 76B | Airsdry
Study mean: 3.47 | Study building percentile: 26 | Quintile: 2!Building code: 1178 | Benchmarks: BUS 2011 UK benchmark!Web content © BUSMethodology 2011
6 13
CountPercent
Dry :1
3 6:2
8 17:3
25 53:4
3 6:5
2 4:6
0 0Humid :7
Airsdry Dry :1 7: Humid
0 10 20 30 40 50 60 70 80 90 100
Percentile
Dry: 1
2
3
4
5
6
Humid: 7
20406080
^v
Airsdry
© BUSMethodology 2011 B
Name of building removed 1
7

Example from the web graphics
The online plots are comprehensive summaries of the variables studied, and plots of the benchmark tests, as here. Individual graphics may be ‘grabbed’ from the screen to input into reports in jpg format, as shown below. High resolution graphics are supplied separately for use in publications.
Example from the comments
The data are both quantitative and qualitative. An excerpt from the qualitative output follows. These use the respondents’ comments listed alphabetically by question type. We do not think it is necessary to carry out content analysis on e.g. frequency of mentions as these are self-evident from the context.
8
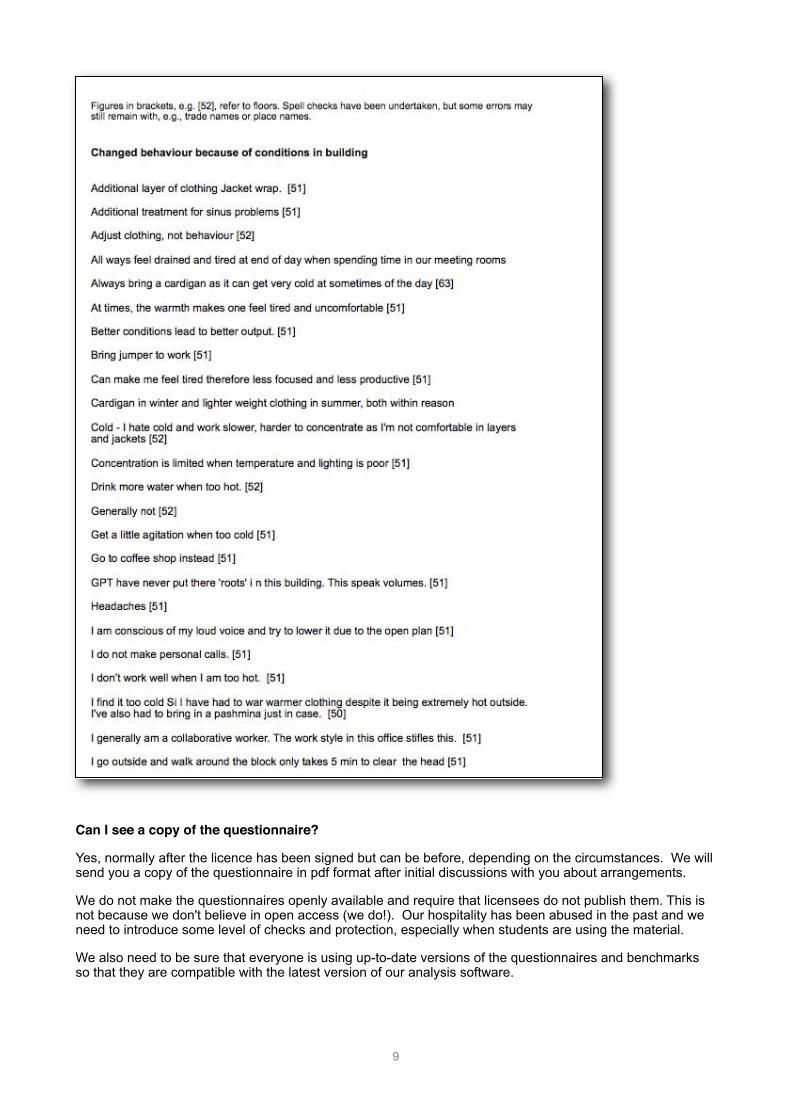
Can I see a copy of the questionnaire?
Yes, normally after the licence has been signed but can be before, depending on the circumstances. We will send you a copy of the questionnaire in pdf format after initial discussions with you about arrangements.
We do not make the questionnaires openly available and require that licensees do not publish them. This is not because we don't believe in open access (we do!). Our hospitality has been abused in the past and we need to introduce some level of checks and protection, especially when students are using the material.
We also need to be sure that everyone is using up-to-date versions of the questionnaires and benchmarks so that they are compatible with the latest version of our analysis software.
9

Components of the non-domestic analysis system
This has the main components of the non-domestic system showing main inputs (top and outputs (bottom).
10

11

Confidentiality
Unless you specifically instruct us otherwise, your results will be treated as strictly confidential. They will never be revealed to third parties. If you wish to put your results into the public domain, then we may refer to them by name, as for example, in the Probe series of post-occupancy studies which use the BUS method.
As a general rule, we would encourage you to publish the results so that others may learn from them.
If your results go into the public domain by default (as with, for example, postgraduate theses) then we request that you do not to reveal the benchmark numbers as a whole set (references to individual benchmarks are acceptable). This falls within the terms of the licensing agreement.
Our approach
We try to collect data to high statistical standards, and present them in an interesting and open way. We also try to simplify for those who do not need the detail. This is a delicate balance because we do not know in advance the levels of detail required.
Our results can be used: - to get a quick snapshot of how well a building works;- to investigate or diagnose its functions in more detail;- as a stand-alone occupant study, or ...- as one part of a bigger building evaluation programme covering other topics like energy, technical and
spatial performance.
On a technical point, we do not normalise data, except in the calculation of the Summary, Comfort and Satisfaction indices where all formulas are shown (in Appendix A web graphics key).
We think that normalisation (i.e. adjusting results with weightings to try to balance out intrinsic population differences) is ultimately misleading (e.g. between buildings with different proportions of part-time staff, where greater numbers of part-time staff are known to affect ratings favourably - the less time people spend in a building, the more they say they like it!) .
We believe it is better to present raw scores, and normalise only at the final analysis stage, making it completely clear where weightings have been introduced.
It is also worth remembering that buildings in use are extraordinarily complicated, with a host of variables in contexts which are constantly changing. We try to capture as much of the richness and complexity as we can, without being overwhelmed by too much data.
More on the approach may be found in the accompanying guide The Probe Approach to Post-Occupancy Evaluation.
The basic non-domestic service gives you ...- copies of a standard questionnaire in pdf format (see Range of Questionnaires q.v.);- a pro-forma Excel worksheet, into which you type the data from the filled-in questionnaires;- an internet version, which we recommend you use as a fail-safe or backup;- advice on administering the questionnaire;- quality control on the data you send us;- statistical analysis with benchmarks, graphics, and a classified list of written responses, - available as a three appendices in pdf format and via a private website.
You do not normally get ...- special questions (these will normally be extra);- translation into other languages (unless a translation is already - available (see Range of Questionnaires q.v.)) - we are happy to arrange translations;- printed questionnaire forms (you will normally print these off from the - pdf forms provided);- a service to distribute and collect the questionnaires (we are happy for quote for this if you wish);- data entry from the questionnaires into an Excel worksheet (but we - provide a pro-forma worksheet);
12

- a written report to accompany the appendices which are part of the standard service (but we are happy to do this - in English only, though).
We request you not to ...- distribute the questionnaire to others (the licence agreement covers this);- make the benchmarks available to others (this is also part of the agreement) - we do not mind if one or
two are quoted but not the whole set.
What we would like you to do
Although we fully respect confidentiality (see Confidentiality q.v.) we also request that you consider publishing your results on the feedback website: www.usablebuildings.co.uk or as appropriate. Here, you will find examples of other buildings studies and techniques which also may be of use.
What's the pedigree?
- The BUS occupant survey originally started in 1985 as part of the first study of sick buildings in the UK - the Office Environment Survey, by Sheena Wilson and Alan Hedge (Building Use Studies, London, 1987).
- the main questionnaire was significantly shortened in 1990;- many of the health-related questions were incorporated in the BRE/Royal Society of Health questionnaire
and dropped from the BUS survey;- benchmarks were introduced for the UK in 1995, Australian benchmarks were added in 2004; New
Zealand in 2006 and an international 'green building' benchmark set is in 2006;- licensing was begun in 1995;- the BUS Workplace questionnaire became the two-page standard in 1997;- the BUS Probe questionnaire is now a variant of the standard version and was introduced in 1995;- the internet version was introduced in 1998, subsequently shortened as a variant of the one-page version
(see next point). A 2-page standard version is also available in internet format ;- the one-page version was developed in 2002, primarily for use with energy certification, but has proved
popular with a wider audience;- Australian questionnaires were revised in 2008;- other language variants are introduced as demand required;- Arup adopted it as their preferred method in 2008;- the domestic version began development in 2006.
In all, the questionnaire has been used in over 700 buildings since its inception in 1985. The current non-domestic database has 450 buildings from 17 countries.
What about questionnaires on the internet?
We use internet-based data collection and delivery, but find that the drawbacks can outweigh the advantages:- not all building users have computers: this is a major drawback because it leads to bias in the sample;- response rates are much lower (our experience is that paper-based questionnaires achieve a response
rate of 80% or better and internet surveys 50% or worse) however well the internet version is designed - this affects the representativeness of the sample, amongst other statistical considerations;- it is harder to keep track of data in the event of computer system malfunctions;- the quality of data received is reduced with internet versions; - often the comments data requires editing because people do not take as much care as they do with the
paper version;- internet questions are harder to follow up because sometimes the respondents cannot be identified.
On balance, we prefer the paper method, and we think respondents do as well. It works best with samples of up to about 250 respondents. This makes the data entry manageable. See also Data Input (q.v.).
However, if clients insist on an internet-based approach we are happy to accommodate it.
13

What about housing?
Housing presents different challenges to non-domestic buildings.
Housing studies are harder to carry out because;- they are more expensive as the fieldwork usually takes longer;- for safety reasons, two researchers should visit the respondents;- it is better for the questionnaires to be administered as an interview pro forma with the interview conducted
by the researcher on site, however ...- questionnaires can also work as a ‘standard’ questionnaire, being filled in and returned by the occupant
without an interview;- some potential respondents may not have English as their first language;- some respondents may be hostile to the survey and/or aggressive to the researchers;- samples are smaller, so results can be more varied and harder to interpret
For further details please contact …
Adrian Leaman: [email protected]
Skype: adrianleaman
14