Burlington_County_Data_Book 2010 Edition
50
Burlington County Data Book 2010 Edition Burlington County Department of Economic Development and Regional Planning 50 Rancocas Road PO Box 6000 Mount Holly, New Jersey 08060 (609) 265-5055 www.co.burlington.nj.us
-
Upload
david-hojsak-aicp-pp -
Category
Documents
-
view
91 -
download
0
Transcript of Burlington_County_Data_Book 2010 Edition
Burlington County Data Book
2010 Edition
Burlington County Department of Economic Development and Regional Planning
50 Rancocas Road PO Box 6000
Mount Holly, New Jersey 08060 (609) 265-5055
www.co.burlington.nj.us


Burlington County Data Book
2010 Edition
Burlington County Department of Economic Development and Regional Planning
50 Rancocas Road PO Box 6000
Mount Holly, New Jersey 08060 (609) 265-5055
www.co.burlington.nj.us
COUNTY OF BURLINGTON
BOARD OF CHOSEN FREEHOLDERS
Bruce D. Garganio Freeholder Director
Joseph B. Donnelly
Deputy Director
Chris Brown Freeholder
Mary Ann O’Brien
Freeholder
Mary Anne Reinhart Freeholder
DEPARTMENT OF ECONOMIC DEVELOPMENT AND REGIONAL PLANNING
Mark A. Remsa, AICP, PP, CLA, ASLA Director
Edward E. Fox, III, AICP, PP Regional Planning Coordinator
David J. Hojsak, AICP, PP Principal Planner
Linda Wong GIS Specialist
Darlene Scocca Economic Development Representative
Mary Fox Principal Clerk Typist

Table of Contents i
Burlington County Data Book, 2010 Edition
Table of Contents Preface........................................................................................................................................... ii Burlington County ........................................................................................................................ 1 Bass River Township .................................................................................................................... 2 Beverly City .................................................................................................................................. 3 Bordentown City........................................................................................................................... 4 Bordentown Township.................................................................................................................. 5 Burlington City ............................................................................................................................. 6 Burlington Township .................................................................................................................... 7 Chesterfield Township .................................................................................................................. 8 Cinnaminson Township ................................................................................................................ 9 Delanco Township ...................................................................................................................... 10 Delran Township......................................................................................................................... 11 Eastampton Township................................................................................................................. 12 Edgewater Park Township .......................................................................................................... 13 Evesham Township..................................................................................................................... 14 Fieldsboro Borough .................................................................................................................... 15 Florence Township...................................................................................................................... 16 Hainesport Township .................................................................................................................. 17 Lumberton Township.................................................................................................................. 18 Mansfield Township ................................................................................................................... 19 Maple Shade Township............................................................................................................... 20 Medford Township...................................................................................................................... 21 Medford Lakes Borough............................................................................................................. 22 Moorestown Township ............................................................................................................... 23 Mount Holly Township............................................................................................................... 24 Mount Laurel Township ............................................................................................................. 25 New Hanover Township ............................................................................................................. 26 North Hanover Township ........................................................................................................... 27 Palmyra Borough ........................................................................................................................ 28 Pemberton Borough .................................................................................................................... 29 Pemberton Township .................................................................................................................. 30 Riverside Township .................................................................................................................... 31 Riverton Borough........................................................................................................................ 32 Shamong Township .................................................................................................................... 33 Southampton Township .............................................................................................................. 34 Springfield Township.................................................................................................................. 35 Tabernacle Township.................................................................................................................. 36 Washington Township ................................................................................................................ 37 Westampton Township ............................................................................................................... 38 Willingboro Township ................................................................................................................ 39 Woodland Township................................................................................................................... 40 Wrightstown Borough................................................................................................................. 41
Preface ii
Burlington County Data Book, 2010 Edition
Preface
elcome to the Burlington County Data Book, 2010 Edition! This is an update of the Department of Economic Development and Regional Planning’s 2002 statistical profile of
Burlington County and its 40 constituent municipalities. This book aims to provide essential Burlington County data useful to a wide audience, ranging from planners to developers to prospective businesses and to the general public. While containing a wealth of information culled primarily from the most recent decennial census, the Data Book is not meant to replicate the detailed picture of our county and towns that Census 2000 painted. Future editions of the Data Book will see updated and increased content from Census 2010, as well as format changes. Major updates to this edition include: population estimates for 2007; land use data as of 2005; and building permit data through 2007. Population estimates for 2007 were obtained from the US Census Bureau and the Delaware Valley Regional Planning Commission. Building permit data were obtained from the New Jersey Department of Labor, the US Census Bureau, and the Delaware Valley Regional Planning Commission. The 2005 land use data were obtained from the Delaware Valley Regional Planning Commission. The Burlington County Data Book, 2010 Edition was prepared by the Burlington County Department of Economic Development and Regional Planning, Mark A. Remsa, Director. David J. Hojsak, Principal Planner, was the project manager. Edward E. Fox, III, Regional Planning Coordinator, provided valuable feedback. Merrilee Torres, GIS Specialist in the Burlington County Department of Information Technology, provided the graphics that accompany the individual profile pages.
W
Burlington County
1
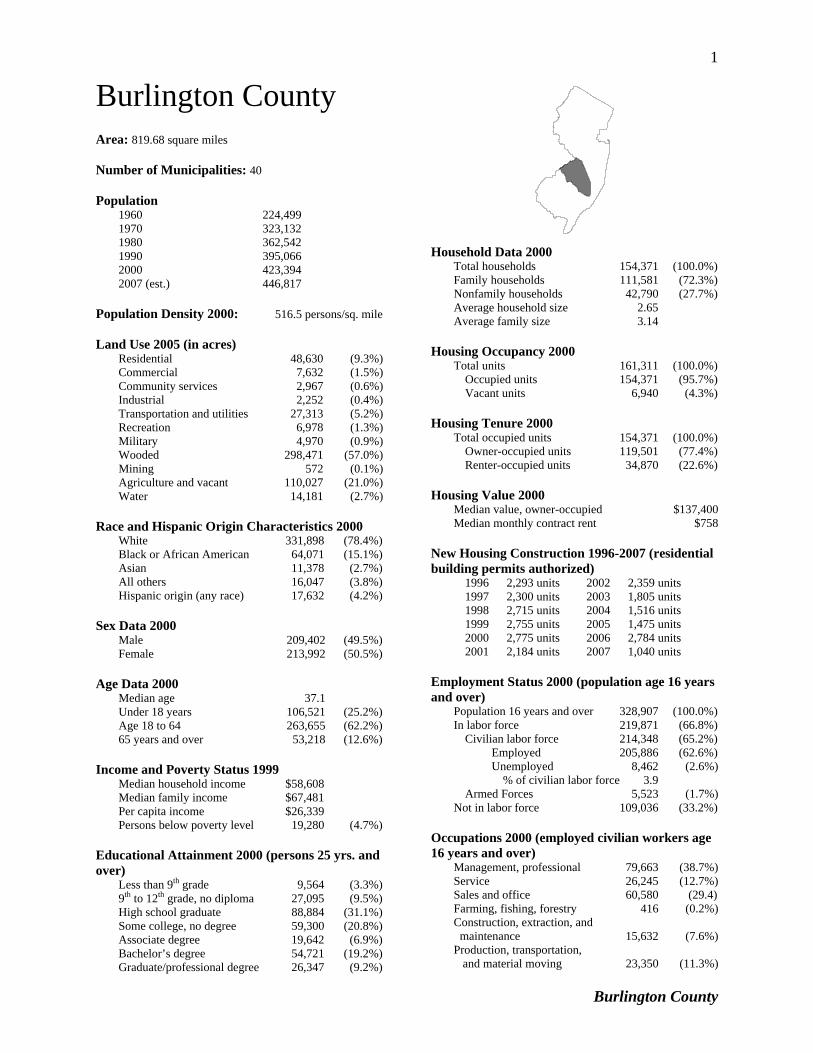
Burlington County Area: 819.68 square miles Number of Municipalities: 40 Population 1960 224,499 1970 323,132 1980 362,542 1990 395,066 2000 423,394 2007 (est.) 446,817 Population Density 2000: 516.5 persons/sq. mile Land Use 2005 (in acres) Residential 48,630 (9.3%) Commercial 7,632 (1.5%) Community services 2,967 (0.6%) Industrial 2,252 (0.4%) Transportation and utilities 27,313 (5.2%) Recreation 6,978 (1.3%) Military 4,970 (0.9%) Wooded 298,471 (57.0%) Mining 572 (0.1%) Agriculture and vacant 110,027 (21.0%) Water 14,181 (2.7%) Race and Hispanic Origin Characteristics 2000 White 331,898 (78.4%) Black or African American 64,071 (15.1%) Asian 11,378 (2.7%) All others 16,047 (3.8%) Hispanic origin (any race) 17,632 (4.2%) Sex Data 2000 Male 209,402 (49.5%) Female 213,992 (50.5%) Age Data 2000 Median age 37.1 Under 18 years 106,521 (25.2%) Age 18 to 64 263,655 (62.2%) 65 years and over 53,218 (12.6%) Income and Poverty Status 1999 Median household income $58,608 Median family income $67,481 Per capita income $26,339 Persons below poverty level 19,280 (4.7%) Educational Attainment 2000 (persons 25 yrs. and over) Less than 9th grade 9,564 (3.3%) 9th to 12th grade, no diploma 27,095 (9.5%) High school graduate 88,884 (31.1%) Some college, no degree 59,300 (20.8%) Associate degree 19,642 (6.9%) Bachelor’s degree 54,721 (19.2%) Graduate/professional degree 26,347 (9.2%)
Household Data 2000 Total households 154,371 (100.0%) Family households 111,581 (72.3%) Nonfamily households 42,790 (27.7%) Average household size 2.65 Average family size 3.14 Housing Occupancy 2000 Total units 161,311 (100.0%) Occupied units 154,371 (95.7%) Vacant units 6,940 (4.3%) Housing Tenure 2000 Total occupied units 154,371 (100.0%) Owner-occupied units 119,501 (77.4%) Renter-occupied units 34,870 (22.6%) Housing Value 2000 Median value, owner-occupied $137,400 Median monthly contract rent $758 New Housing Construction 1996-2007 (residential building permits authorized) 1996 2,293 units 2002 2,359 units 1997 2,300 units 2003 1,805 units 1998 2,715 units 2004 1,516 units 1999 2,755 units 2005 1,475 units 2000 2,775 units 2006 2,784 units 2001 2,184 units 2007 1,040 units Employment Status 2000 (population age 16 years and over) Population 16 years and over 328,907 (100.0%) In labor force 219,871 (66.8%) Civilian labor force 214,348 (65.2%) Employed 205,886 (62.6%) Unemployed 8,462 (2.6%) % of civilian labor force 3.9 Armed Forces 5,523 (1.7%) Not in labor force 109,036 (33.2%) Occupations 2000 (employed civilian workers age 16 years and over) Management, professional 79,663 (38.7%) Service 26,245 (12.7%) Sales and office 60,580 (29.4) Farming, fishing, forestry 416 (0.2%) Construction, extraction, and maintenance 15,632 (7.6%) Production, transportation, and material moving 23,350 (11.3%)

Bass River Township
2
Bass River Twp. Area: 78.40 square miles
School District(s): Bass River Township (K-6) Pinelands Regional (7-12)
Population 1960 737 1970 815 1980 1,344 1990 1,580 2000 1,510 2007 (est.) 1,547 Population Density 2000: 19.3 persons/sq. mile Land Use 2005 (in acres) Residential 472 (0.9%) Commercial 56 (0.1%) Community services 59 (0.1%) Industrial 28 (0.1%) Transportation and utilities 318 (0.6%) Recreation 153 (0.3%) Military 188 (0.4%) Wooded 40,313 (80.3%) Mining 0 (0.0%) Agriculture and vacant 6,404 (12.8%) Water 2,191 (4.4%) Race and Hispanic Origin Characteristics 2000 White 1,493 (98.9%) Black or African American 1 (0.1%) Asian 2 (0.1%) All others 14 (0.9%) Hispanic origin (any race) 33 (2.2%) Sex Data 2000 Male 768 (50.9%) Female 742 (49.1%) Age Data 2000 Median age 38.1 Under 18 years 405 (26.8%) Age 18 to 64 944 (62.5%) 65 years and over 161 (10.7%) Income and Poverty Status 1999 Median household income $47,469 Median family income $51,167 Per capita income $20,382 Persons below poverty level 81 (5.2%) Educational Attainment 2000 (persons 25 yrs. and over) Less than 9th grade 46 (4.5%) 9th to 12th grade, no diploma 151 (14.9%) High school graduate 397 (39.3%) Some college, no degree 190 (18.8%) Associate degree 46 (4.5%) Bachelor’s degree 132 (13.1%) Graduate/professional degree 49 (4.8%)
Household Data 2000 Total households 548 (100.0%) Family households 410 (74.8%) Nonfamily households 138 (25.2%) Average household size 2.76 Average family size 3.15 Housing Occupancy 2000 Total units 602 (100.0%) Occupied units 548 (91.0%) Vacant units 54 (9.0%) Housing Tenure 2000 Total occupied units 548 (100.0%) Owner-occupied units 471 (85.9%) Renter-occupied units 77 (14.1%) Housing Value 2000 Median value, owner-occupied $98,800 Median monthly contract rent $650 New Housing Construction 1996-2007 (residential building permits authorized) 1996 2 units 2002 7 units 1997 5 units 2003 4 units 1998 2 units 2004 3 units 1999 7 units 2005 9 units 2000 4 units 2006 8 units 2001 3 units 2007 4 units Employment Status 2000 (population age 16 years and over) Population 16 years and over 1,197 (100.0%) In labor force 808 (67.5%) Civilian labor force 804 (67.2%) Employed 773 (64.6%) Unemployed 31 (2.6%) % of civilian labor force 3.9 Armed Forces 4 (0.3%) Not in labor force 389 (32.5%) Occupations 2000 (employed civilian workers age 16 years and over) Management, professional 178 (23.0%) Service 122 (15.8%) Sales and office 215 (27.8%) Farming, fishing, forestry 5 (0.6%) Construction, extraction, and maintenance 171 (22.1%) Production, transportation, and material moving 82 (10.6%)
Beverly City
3
Beverly Area: 0.77 square miles
School District(s): Beverly City (K-8) Palmyra (8-12)
Population 1960 3,400 1970 3,105 1980 2,919 1990 2,973 2000 2,661 2007 (est.) 2,588 Population Density 2000: 3,469.3 persons/sq. mile Land Use 2005 (in acres) Residential 175 (35.4%) Commercial 23 (4.7%) Community services 17 (3.4%) Industrial 3 (0.7%) Transportation and utilities 69 (13.8%) Recreation 12 (2.5%) Military 0 (0.0%) Wooded 41 (8.2%) Mining 0 (0.0%) Agriculture and vacant 12 (2.4%) Water 143 (28.9%) Race and Hispanic Origin Characteristics 2000 White 1,721 (64.7%) Black or African American 765 (28.7%) Asian 24 (0.9%) All others 151 (5.6%) Hispanic origin (any race) 122 (4.6%) Sex Data 2000 Male 1,251 (47.0%) Female 1,410 (53.0%) Age Data 2000 Median age 35.0 Under 18 years 754 (28.3%) Age 18 to 64 1,593 (59.9%) 65 years and over 314 (11.8%) Income and Poverty Status 1999 Median household income $45,054 Median family income $49,519 Per capita income $17,760 Persons below poverty level 302 (11.5%) Educational Attainment 2000 (persons 25 yrs. and over) Less than 9th grade 76 (4.5%) 9th to 12th grade, no diploma 312 (18.5%) High school graduate 711 (42.1%) Some college, no degree 333 (19.7%) Associate degree 67 (4.0%) Bachelor’s degree 113 (6.7%) Graduate/professional degree 77 (4.6%)
Household Data 2000 Total households 960 (100.0%) Family households 694 (72.3%) Nonfamily households 266 (27.7%) Average household size 2.77 Average family size 3.23 Housing Occupancy 2000 Total units 1,042 (100.0%) Occupied units 960 (92.1%) Vacant units 82 (7.9%) Housing Tenure 2000 Total occupied units 960 (100.0%) Owner-occupied units 670 (69.8%) Renter-occupied units 290 (30.2%) Housing Value 2000 Median value, owner-occupied $94,300 Median monthly contract rent $645 New Housing Construction 1996-2007 (residential building permits authorized) 1996 0 units 2002 1 units 1997 0 units 2003 4 units 1998 2 units 2004 0 units 1999 0 units 2005 3 units 2000 4 units 2006 1 units 2001 3 units 2007 5 units Employment Status 2000 (population age 16 years and over) Population 16 years and over 1,990 (100%) In labor force 1,372 (68.9%) Civilian labor force 1,368 (68.7%) Employed 1,253 (63.0%) Unemployed 115 (5.8%) % of civilian labor force 8.4 Armed Forces 4 (0.2%) Not in labor force 618 (31.1%) Occupations 2000 (employed civilian workers age 16 years and over) Management, professional 276 (22.0%) Service 288 (23.0%) Sales and office 311 (24.8%) Farming, fishing, forestry 0 (0.0%) Construction, extraction, and maintenance 126 (10.1%) Production, transportation, and material moving 252 (10.6%)

Bordentown City
4
Bordentown City Area: 0.96 square miles
School District(s): Bordentown Regional (K-12)
Population 1960 4,974 1970 4,490 1980 4,441 1990 4,341 2000 3,969 2007 (est.) 3,854 Population Density 2000: 4,134.4 persons/sq. mile Land Use 2005 (in acres) Residential 155 (25.3%) Commercial 50 (8.2%) Community services 59 (9.6%) Industrial 32 (5.2%) Transportation and utilities 91 (14.9%) Recreation 13 (2.1%) Military 0 (0.0%) Wooded 142 (23.2%) Mining 0 (0.0%) Agriculture and vacant 48 (7.9%) Water 23 (3.7%) Race and Hispanic Origin Characteristics 2000 White 3,225 (81.3%) Black or African American 519 (13.1%) Asian 76 (1.9%) All others 149 (3.8%) Hispanic origin (any race) 112 (2.8%) Sex Data 2000 Male 1,881 (47.4%) Female 2,088 (52.6%) Age Data 2000 Median age 37.9 Under 18 years 830 (21.0%) Age 18 to 64 2,583 (65.1%) 65 years and over 556 (14.0%) Income and Poverty Status 1999 Median household income $47,279 Median family income $59,872 Per capita income $25,882 Persons below poverty level 266 (6.8%) Educational Attainment 2000 (persons 25 yrs. and over) Less than 9th grade 90 (3.2%) 9th to 12th grade, no diploma 316 (11.1%) High school graduate 874 (30.8%) Some college, no degree 640 (22.6%) Associate degree 159 (5.6%) Bachelor’s degree 537 (18.9%) Graduate/professional degree 221 (7.8%)
Household Data 2000 Total households 1,757 (100.0%) Family households 990 (56.3%) Nonfamily households 767 (43.7%) Average household size 2.23 Average family size 2.93 Housing Occupancy 2000 Total units 1,884 (100.0%) Occupied units 1,757 (93.3%) Vacant units 127 (6.7%) Housing Tenure 2000 Total occupied units 1,757 (100.0%) Owner-occupied units 981 (55.8%) Renter-occupied units 776 (44.2%) Housing Value 2000 Median value, owner-occupied $110,200 Median monthly contract rent $736 New Housing Construction 1996-2007 (residential building permits authorized) 1996 0 units 2002 0 units 1997 3 units 2003 0 units 1998 0 units 2004 4 units 1999 6 units 2005 0 units 2000 0 units 2006 0 units 2001 24 units 2007 1 units Employment Status 2000 (population age 16 years and over) Population 16 years and over 3,260 (100.0%) In labor force 2,387 (73.2%) Civilian labor force 2,352 (72.1%) Employed 2,263 (69.4%) Unemployed 89 (2.7%) % of civilian labor force 3.8 Armed Forces 35 (1.1%) Not in labor force 873 (26.8%) Occupations 2000 (employed civilian workers age 16 years and over) Management, professional 763 (33.7%) Service 412 (18.2%) Sales and office 677 (29.9%) Farming, fishing, forestry 0 (0.0%) Construction, extraction, and maintenance 192 (8.5%) Production, transportation, and material moving 219 (9.7%)
Bordentown Township
5
Bordentown Twp. Area: 9.31 square miles
School District(s): Bordentown Regional (K-12)
Population 1960 5,936 1970 7,303 1980 7,170 1990 7,683 2000 8,380 2007 (est.) 10,201 Population Density 2000: 900.1 persons/sq. mile Land Use 2005 (in acres) Residential 882 (14.8%) Commercial 264 (4.4%) Community services 115 (1.9%) Industrial 65 (1.1%) Transportation and utilities 918 (15.4%) Recreation 85 (1.4%) Military 0 (0.0%) Wooded 1,875 (31.5%) Mining 0 (0.0%) Agriculture and vacant 1,334 (22.4%) Water 418 (7.0%) Race and Hispanic Origin Characteristics 2000 White 7,486 (89.3%) Black or African American 421 (5.0%) Asian 278 (3.3%) All others 195 (2.3%) Hispanic origin (any race) 254 (3.0%) Sex Data 2000 Male 4,081 (48.7%) Female 4,299 (51.3%) Age Data 2000 Median age 37.6 Under 18 years 1,986 (23.7%) Age 18 to 64 5,414 (64.6%) 65 years and over 980 (11.7%) Income and Poverty Status 1999 Median household income $60,131 Median family income $71,627 Per capita income $26,934 Persons below poverty level 234 (2.8%) Educational Attainment 2000 (persons 25 yrs. and over) Less than 9th grade 219 (3.7%) 9th to 12th grade, no diploma 544 (9.3%) High school graduate 1,948 (33.2%) Some college, no degree 1,281 (21.8%) Associate degree 469 (8.0%) Bachelor’s degree 963 (16.4%) Graduate/professional degree 439 (7.5%)
Household Data 2000 Total households 3,293 (100.0%) Family households 2,305 (70.0%) Nonfamily households 988 (30.0%) Average household size 2.53 Average family size 3.03 Housing Occupancy 2000 Total units 3,436 (100.0%) Occupied units 3,293 (95.8%) Vacant units 143 (4.2%) Housing Tenure 2000 Total occupied units 3,293 (100.0%) Owner-occupied units 2,542 (77.2%) Renter-occupied units 751 (22.8%) Housing Value 2000 Median value, owner-occupied $136,000 Median monthly contract rent $698 New Housing Construction 1996-2007 (residential building permits authorized) 1996 33 units 2002 68 units 1997 118 units 2003 124 units 1998 84 units 2004 168 units 1999 122 units 2005 102 units 2000 349 units 2006 1 units 2001 26 units 2007 1 units Employment Status 2000 (population age 16 years and over) Population 16 years and over 6,590 (100.0%) In labor force 4,838 (73.4%) Civilian labor force 4,833 (73.3%) Employed 4,670 (70.9%) Unemployed 163 (2.5%) % of civilian labor force 3.4 Armed Forces 5 (0.1%) Not in labor force 1,752 (26.6%) Occupations 2000 (employed civilian workers age 16 years and over) Management, professional 1,622 (34.7%) Service 650 (13.9%) Sales and office 1,567 (33.6%) Farming, fishing, forestry 10 (0.2%) Construction, extraction, and maintenance 405 (8.7%) Production, transportation, and material moving 416 (8.9%)
Burlington City
6
Burlington City Area: 3.73 square miles
School District(s): Burlington City (K-12)
Population 1960 12,687 1970 12,010 1980 10,246 1990 9,835 2000 9,736 2007 (est.) 9,485 Population Density 2000: 2,610.2 persons/sq. mile Land Use 2005 (in acres) Residential 484 (20.2%) Commercial 177 (7.4%) Community services 80 (3.3%) Industrial 64 (2.7%) Transportation and utilities 374 (15.6%) Recreation 91 (3.8%) Military 0 (0.0%) Wooded 446 (18.6%) Mining 0 (0.0%) Agriculture and vacant 232 (9.7%) Water 445 (18.6%) Race and Hispanic Origin Characteristics 2000 White 6,638 (68.2%) Black or African American 2,592 (26.6%) Asian 125 (1.3%) All others 381 (3.9%) Hispanic origin (any race) 332 (3.4%) Sex Data 2000 Male 4,618 (47.4%) Female 5,118 (52.6%) Age Data 2000 Median age 38.1 Under 18 years 2,328 (23.9%) Age 18 to 64 5,772 (59.3%) 65 years and over 1,636 (16.8%) Income and Poverty Status 1999 Median household income $43,115 Median family income $47,969 Per capita income $20,208 Persons below poverty level 776 (8.0%) Educational Attainment 2000 (persons 25 yrs. and over) Less than 9th grade 444 (6.7%) 9th to 12th grade, no diploma 1,048 (15.8%) High school graduate 2,530 (38.1%) Some college, no degree 1,427 (21.5%) Associate degree 395 (5.9%) Bachelor’s degree 558 (8.4%) Graduate/professional degree 244 (3.7%)
Household Data 2000 Total households 3,898 (100.0%) Family households 2,521 (64.7%) Nonfamily households 1,377 (35.3%) Average household size 2.48 Average family size 3.09 Housing Occupancy 2000 Total units 4,181 (100.0%) Occupied units 3,898 (93.2%) Vacant units 283 (6.8%) Housing Tenure 2000 Total occupied units 3,898 (100.0%) Owner-occupied units 2,564 (65.8%) Renter-occupied units 1,334 (34.2%) Housing Value 2000 Median value, owner-occupied $97,600 Median monthly contract rent $620 New Housing Construction 1996-2007 (residential building permits authorized) 1996 5 units 2002 8 units 1997 0 units 2003 12 units 1998 57 units 2004 12 units 1999 41 units 2005 7 units 2000 11 units 2006 6 units 2001 13 units 2007 2 units Employment Status 2000 (population age 16 years and over) Population 16 years and over 7,703 (100.0%) In labor force 5,030 (65.3%) Civilian labor force 5,004 (65.0%) Employed 4,723 (61.3%) Unemployed 281 (3.6%) % of civilian labor force 5.6 Armed Forces 26 (0.3%) Not in labor force 2,673 (34.7%) Occupations 2000 (employed civilian workers age 16 years and over) Management, professional 1,161 (24.6%) Service 794 (16.8%) Sales and office 1,414 (29.9%) Farming, fishing, forestry 7 (0.1%) Construction, extraction, and maintenance 459 (9.7%) Production, transportation, and material moving 888 (18.8%)

Burlington Township
7
Burlington Twp. Area: 14.05 square miles
School District(s): Burlington Township (K-12)
Population 1960 6,291 1970 10,621 1980 11,527 1990 12,454 2000 20,294 2007 (est.) 21,359 Population Density 2000: 1,444.4 persons/sq. mile Land Use 2005 (in acres) Residential 1,779 (19.9%) Commercial 475 (5.3%) Community services 147 (1.6%) Industrial 530 (5.9%) Transportation and utilities 1,265 (14.1%) Recreation 181 (2.0%) Military 0 (0.0%) Wooded 2,571 (28.7%) Mining 19 (0.2%) Agriculture and vacant 1,668 (18.6%) Water 311 (3.5%) Race and Hispanic Origin Characteristics 2000 White 13,742 (67.7%) Black or African American 4,971 (24.5%) Asian 757 (3.7%) All others 824 (4.1%) Hispanic origin (any race) 814 (4.0%) Sex Data 2000 Male 9,620 (47.4%) Female 10,674 (52.6%) Age Data 2000 Median age 35.6 Under 18 years 5,519 (27.2%) Age 18 to 64 12,217 (60.2%) 65 years and over 2,558 (12.6%) Income and Poverty Status 1999 Median household income $61,663 Median family income $70,958 Per capita income $24,754 Persons below poverty level 969 (5.0%) Educational Attainment 2000 (persons 25 yrs. and over) Less than 9th grade 692 (5.0%) 9th to 12th grade, no diploma 1,353 (9.9%) High school graduate 4,246 (30.9%) Some college, no degree 2,911 (21.2%) Associate degree 960 (7.0%) Bachelor’s degree 2,572 (18.7%) Graduate/professional degree 990 (7.2%)
Household Data 2000 Total households 7,112 (100.0%) Family households 5,280 (74.2%) Nonfamily households 1,832 (25.8%) Average household size 2.72 Average family size 3.18 Housing Occupancy 2000 Total units 7,348 (100.0%) Occupied units 7,112 (96.8%) Vacant units 236 (3.2%) Housing Tenure 2000 Total occupied units 7,112 (100.0%) Owner-occupied units 5,486 (77.1%) Renter-occupied units 1,626 (22.9%) Housing Value 2000 Median value, owner-occupied $151,600 Median monthly contract rent $621 New Housing Construction 1996-2007 (residential building permits authorized) 1996 444 units 2002 144 units 1997 362 units 2003 59 units 1998 303 units 2004 15 units 1999 427 units 2005 17 units 2000 274 units 2006 40 units 2001 75 units 2007 52 units Employment Status 2000 (population age 16 years and over) Population 16 years and over 15,265 (100.0%) In labor force 10,743 (70.4%) Civilian labor force 10,552 (69.1%) Employed 10,145 (66.5%) Unemployed 407 (2.7%) % of civilian labor force 3.9 Armed Forces 191 (1.3%) Not in labor force 4,522 (29.6%) Occupations 2000 (employed civilian workers age 16 years and over) Management, professional 3,796 (37.4%) Service 1,429 (14.1%) Sales and office 2,857 (28.2%) Farming, fishing, forestry 43 (0.4%) Construction, extraction, and maintenance 684 (6.7%) Production, transportation, and material moving 1,336 (13.2%)

Chesterfield Township
8
Chesterfield Twp. Area: 21.43 square miles
School District(s): Chesterfield Township (K-6) Northern Burlington Co. Regional (7-12)
Population 1960 2,519 1970 3,190 1980 3,867 1990 5,152 2000 5,955 2007 (est.) 6,919 Population Density 2000: 277.9 persons/sq. mile Land Use 2005 (in acres) Residential 837 (6.1%) Commercial 28 (0.2%) Community services 94 (0.7%) Industrial 0 (0.0%) Transportation and utilities 463 (3.4%) Recreation 210 (1.5%) Military 0 (0.0%) Wooded 3,618 (26.2%) Mining 0 (0.0%) Agriculture and vacant 8,455 (61.3%) Water 92 (0.7%) Race and Hispanic Origin Characteristics 2000 White 2,960 (49.7%) Black or African American 2,225 (37.4%) Asian 38 (0.6%) All others 732 (12.3%) Hispanic origin (any race) 735 (12.3%) Sex Data 2000 Male 4,619 (77.6%) Female 1,336 (22.4%) Age Data 2000 Median age 24.6 Under 18 years 705 (11.8%) Age 18 to 64 4,951 (83.1%) 65 years and over 299 (5.0%) Income and Poverty Status 1999 Median household income $85,428 Median family income $91,267 Per capita income $17,193 Persons below poverty level 46 (1.8%) Educational Attainment 2000 (persons 25 yrs. and over) Less than 9th grade 73 (2.6%) 9th to 12th grade, no diploma 527 (18.9%) High school graduate 744 (26.7%) Some college, no degree 541 (19.4%) Associate degree 164 (5.9%) Bachelor’s degree 531 (19.0%) Graduate/professional degree 210 (7.5%)
Household Data 2000 Total households 899 (100.0%) Family households 744 (82.8%) Nonfamily households 155 (17.2%) Average household size 2.91 Average family size 3.19 Housing Occupancy 2000 Total units 924 (100.0%) Occupied units 899 (97.3%) Vacant units 25 (2.7%) Housing Tenure 2000 Total occupied units 899 (100.0%) Owner-occupied units 829 (92.2%) Renter-occupied units 70 (7.8%) Housing Value 2000 Median value, owner-occupied $197,500 Median monthly contract rent $940 New Housing Construction 1996-2007 (residential building permits authorized) 1996 23 units 2002 10 units 1997 26 units 2003 22 units 1998 7 units 2004 33 units 1999 12 units 2005 105 units 2000 9 units 2006 203 units 2001 10 units 2007 179 units Employment Status 2000 (population age 16 years and over) Population 16 years and over 5,370 (100.0%) In labor force 1,396 (26.0%) Civilian labor force 1,396 (26.0%) Employed 1,347 (25.1%) Unemployed 49 (0.9%) % of civilian labor force 3.5 Armed Forces 0 (0.0%) Not in labor force 3,974 (74.0%) Occupations 2000 (employed civilian workers age 16 years and over) Management, professional 663 (49.2%) Service 154 (11.4%) Sales and office 296 (22.0%) Farming, fishing, forestry 17 (1.3%) Construction, extraction, and maintenance 111 (8.2%) Production, transportation, and material moving 106 (7.9%)
Cinnaminson Township
9
Cinnaminson Twp. Area: 8.03 square miles
School District(s): Cinnaminson Township (K-12)
Population 1960 8,302 1970 16,962 1980 16,072 1990 14,583 2000 14,595 2007 (est.) 15,240 Population Density 2000: 1,817.6 persons/sq. mile Land Use 2005 (in acres) Residential 1,738 (33.9%) Commercial 326 (6.4%) Community services 116 (2.3%) Industrial 151 (2.9%) Transportation and utilities 966 (18.8%) Recreation 236 (4.6%) Military 0 (0.0%) Wooded 628 (12.2%) Mining 0 (0.0%) Agriculture and vacant 598 (11.7%) Water 371 (7.2%) Race and Hispanic Origin Characteristics 2000 White 13,334 (91.4%) Black or African American 742 (5.1%) Asian 274 (1.9%) All others 245 (1.7%) Hispanic origin (any race) 224 (1.5%) Sex Data 2000 Male 7,121 (48.8%) Female 7,474 (51.2%) Age Data 2000 Median age 42.0 Under 18 years 3,493 (23.9%) Age 18 to 64 8,308 (56.9%) 65 years and over 2,794 (19.1%) Income and Poverty Status 1999 Median household income $68,474 Median family income $75,920 Per capita income $27,790 Persons below poverty level 353 (2.4%) Educational Attainment 2000 (persons 25 yrs. and over) Less than 9th grade 271 (2.7%) 9th to 12th grade, no diploma 776 (7.7%) High school graduate 3,388 (33.5%) Some college, no degree 2,126 (21.0%) Associate degree 645 (6.4%) Bachelor’s degree 1,980 (19.6%) Graduate/professional degree 941 (9.3%)
Household Data 2000 Total households 5,057 (100.0%) Family households 4,143 (81.9%) Nonfamily households 914 (18.1%) Average household size 2.85 Average family size 3.18 Housing Occupancy 2000 Total units 5,147 (100.0%) Occupied units 5,057 (98.3%) Vacant units 90 (1.7%) Housing Tenure 2000 Total occupied units 5,057 (100.0%) Owner-occupied units 4,864 (96.2%) Renter-occupied units 193 (3.8%) Housing Value 2000 Median value, owner-occupied $158,900 Median monthly contract rent $916 New Housing Construction 1996-2007 (residential building permits authorized) 1996 33 units 2002 52 units 1997 63 units 2003 41 units 1998 64 units 2004 41 units 1999 36 units 2005 157 units 2000 33 units 2006 70 units 2001 47 units 2007 97 units Employment Status 2000 (population age 16 years and over) Population 16 years and over 11,446 (100.0%) In labor force 7,441 (65.0%) Civilian labor force 7,431 (64.9%) Employed 7,130 (62.3%) Unemployed 301 (2.6%) % of civilian labor force 4.1 Armed Forces 10 (0.1%) Not in labor force 4,005 (35.0%) Occupations 2000 (employed civilian workers age 16 years and over) Management, professional 2,791 (39.1%) Service 652 (9.1%) Sales and office 2,426 (34.0%) Farming, fishing, forestry 4 (0.1%) Construction, extraction, and maintenance 521 (7.3%) Production, transportation, and material moving 736 (10.3%)

Delanco Township
10
Delanco Twp. Area: 3.37 square miles
School District(s): Delanco Township (K-8) Riverside Township (9-12)
Population 1960 4,011 1970 4,157 1980 3,730 1990 3,316 2000 3,237 2007 (est.) 4,377 Population Density 2000: 960.5 persons/sq. mile Land Use 2005 (in acres) Residential 333 (15.5%) Commercial 129 (6.0%) Community services 23 (1.0%) Industrial 128 (5.9%) Transportation and utilities 154 (7.2%) Recreation 44 (2.1%) Military 0 (0.0%) Wooded 312 (14.5%) Mining 0 (0.0%) Agriculture and vacant 392 (18.2%) Water 639 (29.7%) Race and Hispanic Origin Characteristics 2000 White 3,104 (95.9%) Black or African American 62 (1.9%) Asian 13 (0.4%) All others 58 (1.7%) Hispanic origin (any race) 63 (1.9%) Sex Data 2000 Male 1,568 (48.4%) Female 1,669 (51.6%) Age Data 2000 Median age 37.0 Under 18 years 807 (24.9%) Age 18 to 64 2,000 (61.8%) 65 years and over 430 (13.3%) Income and Poverty Status 1999 Median household income $50,106 Median family income $56,985 Per capita income $21,096 Persons below poverty level 305 (9.5%) Educational Attainment 2000 (persons 25 yrs. and over) Less than 9th grade 105 (4.7%) 9th to 12th grade, no diploma 223 (10.1%) High school graduate 954 (43.1%) Some college, no degree 465 (21.0%) Associate degree 138 (6.4%) Bachelor’s degree 223 (10.1%) Graduate/professional degree 105 (4.7%)
Household Data 2000 Total households 1,227 (100.0%) Family households 892 (72.7%) Nonfamily households 335 (27.3%) Average household size 2.64 Average family size 3.09 Housing Occupancy 2000 Total units 1,285 (100.0%) Occupied units 1,227 (95.5%) Vacant units 58 (4.5%) Housing Tenure 2000 Total occupied units 1,227 (100.0%) Owner-occupied units 997 (81.3%) Renter-occupied units 230 (18.7%) Housing Value 2000 Median value, owner-occupied $111,600 Median monthly contract rent $615 New Housing Construction 1996-2007 (residential building permits authorized) 1996 3 units 2002 52 units 1997 2 units 2003 101 units 1998 1 units 2004 117 units 1999 2 units 2005 121 units 2000 0 units 2006 111 units 2001 36 units 2007 135 units Employment Status 2000 (population age 16 years and over) Population 16 years and over 2,527 (100.0%) In labor force 1,734 (68.6%) Civilian labor force 1,731 (68.5%) Employed 1,627 (64.4%) Unemployed 104 (4.1%) % of civilian labor force 6.0 Armed Forces 3 (0.1%) Not in labor force 793 (31.4%) Occupations 2000 (employed civilian workers age 16 years and over) Management, professional 426 (26.2%) Service 223 (13.7%) Sales and office 528 (32.5%) Farming, fishing, forestry 3 (0.2%) Construction, extraction, and maintenance 178 (10.9%) Production, transportation, and material moving 269 (16.5%)
Delran Township
11
Delran Twp. Area: 7.28 square miles
School District(s): Delran Township (K-12)
Population 1960 5,327 1970 10,065 1980 14,811 1990 13,178 2000 15,536 2007 (est.) 16,929 Population Density 2000: 2,134.1 persons/sq. mile Land Use 2005 (in acres) Residential 1,339 (28.7%) Commercial 291 (6.2%) Community services 78 (1.7%) Industrial 26 (0.6%) Transportation and utilities 841 (18.0%) Recreation 236 (5.1%) Military 0 (0.0%) Wooded 739 (15.9%) Mining 10 (0.2%) Agriculture and vacant 641 (13.8%) Water 458 (9.8%) Race and Hispanic Origin Characteristics 2000 White 12,875 (82.9%) Black or African American 1,464 (9.4%) Asian 435 (2.8%) All others 762 (4.9%) Hispanic origin (any race) 505 (3.3%) Sex Data 2000 Male 7,646 (49.2%) Female 7,890 (50.8%) Age Data 2000 Median age 36.7 Under 18 years 3,814 (24.5%) Age 18 to 64 10,050 (64.7%) 65 years and over 1,672 (10.8%) Income and Poverty Status 1999 Median household income $58,526 Median family income $67,895 Per capita income $25,312 Persons below poverty level 637 (4.1%) Educational Attainment 2000 (persons 25 yrs. and over) Less than 9th grade 407 (3.9%) 9th to 12th grade, no diploma 825 (7.9%) High school graduate 3,625 (34.6%) Some college, no degree 2,019 (19.3%) Associate degree 729 (7.0%) Bachelor’s degree 2,006 (19.2%) Graduate/professional degree 852 (8.1%)
Household Data 2000 Total households 5,816 (100.0%) Family households 4,330 (74.4%) Nonfamily households 1,486 (25.6%) Average household size 2.67 Average family size 3.11 Housing Occupancy 2000 Total units 5,936 (100.0%) Occupied units 5,816 (98.5%) Vacant units 120 (2.0%) Housing Tenure 2000 Total occupied units 5,816 (100.0%) Owner-occupied units 4,214 (72.5%) Renter-occupied units 1,602 (27.5%) Housing Value 2000 Median value, owner-occupied $145,600 Median monthly contract rent $698 New Housing Construction 1996-2007 (residential building permits authorized) 1996 75 units 2002 184 units 1997 72 units 2003 274 units 1998 160 units 2004 80 units 1999 156 units 2005 6 units 2000 79 units 2006 35 units 2001 107 units 2007 5 units Employment Status 2000 (population age 16 years and over) Population 16 years and over 12,147 (100.0%) In labor force 8,688 (71.5%) Civilian labor force 8,665 (71.3%) Employed 8,403 (69.2%) Unemployed 262 (2.2%) % of civilian labor force 3.0 Armed Forces 23 (0.2%) Not in labor force 3,459 (28.5%) Occupations 2000 (employed civilian workers age 16 years and over) Management, professional 3,206 (38.2%) Service 858 (10.2%) Sales and office 2,442 (29.1%) Farming, fishing, forestry 7 (0.1%) Construction, extraction, and maintenance 738 (8.8%) Production, transportation, and material moving 1,152 (13.7%)

Eastampton Township
12
Eastampton Twp. Area: 5.86 square miles
School District(s): Eastampton Township (K-8) Rancocas Valley Regional High School (9-12)
Population 1960 1,402 1970 2,284 1980 3,814 1990 4,962 2000 6,202 2007 (est.) 6,535 Population Density 2000: 1,058.3 persons/sq. mile Land Use 2005 (in acres) Residential 590 (15.7%) Commercial 90 (2.4%) Community services 34 (0.9%) Industrial 0 (0.0%) Transportation and utilities 386 (10.3%) Recreation 131 (3.5%) Military 0 (0.0%) Wooded 1,319 (35.1%) Mining 0 (0.0%) Agriculture and vacant 1,138 (30.3%) Water 68 (1.8%) Race and Hispanic Origin Characteristics 2000 White 4,853 (78.2%) Black or African American 730 (11.8%) Asian 336 (5.4%) All others 283 (4.5%) Hispanic origin (any race) 293 (4.7%) Sex Data 2000 Male 3,085 (49.7%) Female 3,117 (50.3%) Age Data 2000 Median age 34.9 Under 18 years 1,831 (29.5%) Age 18 to 64 3,927 (63.3%) 65 years and over 444 (7.2%) Income and Poverty Status 1999 Median household income $66,406 Median family income $71,765 Per capita income $24,534 Persons below poverty level 179 (2.9%) Educational Attainment 2000 (persons 25 yrs. and over) Less than 9th grade 105 (2.7%) 9th to 12th grade, no diploma 286 (7.2%) High school graduate 1,130 (28.6%) Some college, no degree 871 (22.1%) Associate degree 384 (9.7%) Bachelor’s degree 829 (21.0%) Graduate/professional degree 340 (8.6%)
Household Data 2000 Total households 2,226 (100.0%) Family households 1,639 (73.6%) Nonfamily households 587 (26.4%) Average household size 2.78 Average family size 3.29 Housing Occupancy 2000 Total units 2,312 (100.0%) Occupied units 2,226 (96.3%) Vacant units 86 (3.7%) Housing Tenure 2000 Total occupied units 2,226 (100.0%) Owner-occupied units 1,568 (70.4%) Renter-occupied units 658 (29.6%) Housing Value 2000 Median value, owner-occupied $143,100 Median monthly contract rent $722 New Housing Construction 1996-2007 (residential building permits authorized) 1996 49 units 2002 20 units 1997 5 units 2003 31 units 1998 19 units 2004 8 units 1999 5 units 2005 6 units 2000 101 units 2006 6 units 2001 13 units 2007 27 units Employment Status 2000 (population age 16 years and over) Population 16 years and over 4,564 (100.0%) In labor force 3,540 (77.6%) Civilian labor force 3,453 (75.7%) Employed 3,368 (73.8%) Unemployed 85 (1.9%) % of civilian labor force 2.5 Armed Forces 87 (1.9%) Not in labor force 1,024 (22.4%) Occupations 2000 (employed civilian workers age 16 years and over) Management, professional 1,200 (35.6%) Service 442 (13.1%) Sales and office 1,021 (30.3%) Farming, fishing, forestry 8 (0.2%) Construction, extraction, and maintenance 251 (7.5%) Production, transportation, and material moving 446 (13.2%)
Edgewater Park Township
13
Edgewater Park Twp. Area: 3.06 square miles
School District(s): Edgewater Park Township (K-8) Burlington City (9-12)
Population 1960 2,866 1970 7,412 1980 9,273 1990 8,388 2000 7,864 2007 (est.) 7,762 Population Density 2000: 2,569.9 persons/sq. mile Land Use 2005 (in acres) Residential 721 (37.0%) Commercial 119 (6.1%) Community services 113 (5.8%) Industrial 26 (1.3%) Transportation and utilities 357 (18.3%) Recreation 47 (2.4%) Military 0 (0.0%) Wooded 190 (9.8%) Mining 0 (0.0%) Agriculture and vacant 280 (14.4%) Water 97 (5.0%) Race and Hispanic Origin Characteristics 2000 White 5,353 (68.1%) Black or African American 1,683 (21.4%) Asian 256 (3.3%) All others 572 (7.3%) Hispanic origin (any race) 519 (6.6%) Sex Data 2000 Male 3,789 (48.2%) Female 4,075 (51.8%) Age Data 2000 Median age 37.9 Under 18 years 1,811 (23.0%) Age 18 to 64 5,028 (63.9%) 65 years and over 1,025 (13.0%) Income and Poverty Status 1999 Median household income $48,936 Median family income $52,016 Per capita income $22,920 Persons below poverty level 677 (8.6%) Educational Attainment 2000 (persons 25 yrs. and over) Less than 9th grade 194 (3.5%) 9th to 12th grade, no diploma 593 (10.7%) High school graduate 2,094 (37.9%) Some college, no degree 1,211 (21.9%) Associate degree 350 (6.3%) Bachelor’s degree 856 (15.5%) Graduate/professional degree 229 (4.1%)
Household Data 2000 Total households 3,152 (100.0%) Family households 2,099 (66.6%) Nonfamily households 1,053 (33.4%) Average household size 2.49 Average family size 3.03 Housing Occupancy 2000 Total units 3,301 (100.0%) Occupied units 3,152 (95.5%) Vacant units 149 (4.5%) Housing Tenure 2000 Total occupied units 3,152 (100.0%) Owner-occupied units 2,034 (64.5%) Renter-occupied units 1,118 (35.5%) Housing Value 2000 Median value, owner-occupied $119,800 Median monthly contract rent $661 New Housing Construction 1996-2007 (residential building permits authorized) 1996 4 units 2002 52 units 1997 6 units 2003 11 units 1998 4 units 2004 0 units 1999 6 units 2005 8 units 2000 8 units 2006 0 units 2001 6 units 2007 1 units Employment Status 2000 (population age 16 years and over) Population 16 years and over 6,259 (100.0%) In labor force 4,328 (69.1%) Civilian labor force 4,322 (69.1%) Employed 4,114 (65.7%) Unemployed 208 (3.3%) % of civilian labor force 4.8 Armed Forces 6 (0.1%) Not in labor force 1,931 (30.9%) Occupations 2000 (employed civilian workers age 16 years and over) Management, professional 1,384 (33.6%) Service 578 (14.0%) Sales and office 1,105 (26.9%) Farming, fishing, forestry 0 (0.0%) Construction, extraction, and maintenance 389 (9.5%) Production, transportation, and material moving 658 (16.0%)

Evesham Township
14
Evesham Twp. Area: 29.68 square miles
School District(s): Evesham Township (K-8) Lenape Regional (9-12)
Population 1960 4,548 1970 13,477 1980 21,508 1990 35,309 2000 42,275 2007 (est.) 45,619 Population Density 2000: 1,424.4 persons/sq. mile Land Use 2005 (in acres) Residential 3,991 (21.0%) Commercial 641 (3.4%) Community services 136 (0.7%) Industrial 0 (0.0%) Transportation and utilities 2,100 (11.1%) Recreation 761 (4.0%) Military 0 (0.0%) Wooded 8,687 (45.7%) Mining 0 (0.0%) Agriculture and vacant 2,371 (12.5%) Water 303 (1.6%) Race and Hispanic Origin Characteristics 2000 White 38,579 (91.3%) Black or African American 1,313 (3.1%) Asian 1,721 (4.1%) All others 662 (1.6%) Hispanic origin (any race) 829 (2.0%) Sex Data 2000 Male 20,498 (48.5%) Female 21,777 (51.5%) Age Data 2000 Median age 36.0 Under 18 years 11,485 (27.2%) Age 18 to 64 27,040 (64.0%) 65 years and over 3,750 (8.9%) Income and Poverty Status 1999 Median household income $67,010 Median family income $77,245 Per capita income $29,494 Persons below poverty level 1,174 (2.8%) Educational Attainment 2000 (persons 25 yrs. and over) Less than 9th grade 433 (1.5%) 9th to 12th grade, no diploma 1,482 (5.2%) High school graduate 7,237 (25.3%) Some college, no degree 5,834 (20.4%) Associate degree 2,231 (7.8%) Bachelor’s degree 7,843 (27.5%) Graduate/professional degree 3,505 (12.3%)
Household Data 2000 Total households 15,712 (100.0%) Family households 11,346 (72.2%) Nonfamily households 4,366 (27.8%) Average household size 2.68 Average family size 3.21 Housing Occupancy 2000 Total units 16,324 (100.0%) Occupied units 15,712 (96.3%) Vacant units 612 (3.7%) Housing Tenure 2000 Total occupied units 15,712 (100.0%) Owner-occupied units 12,214 (77.7%) Renter-occupied units 3,498 (22.3%) Housing Value 2000 Median value, owner-occupied $157,000 Median monthly contract rent $886 New Housing Construction 1996-2007 (residential building permits authorized) 1996 460 units 2002 586 units 1997 237 units 2003 217 units 1998 470 units 2004 135 units 1999 436 units 2005 46 units 2000 460 units 2006 30 units 2001 318 units 2007 26 units Employment Status 2000 (population age 16 years and over) Population 16 years and over 32,206 (100.0%) In labor force 23,430 (72.8%) Civilian labor force 23,374 (72.6%) Employed 22,770 (70.7%) Unemployed 604 (1.9%) % of civilian labor force 2.6 Armed Forces 56 (0.2%) Not in labor force 8,776 (27.2%) Occupations 2000 (employed civilian workers age 16 years and over) Management, professional 10,930 (48.0%) Service 2,200 (9.7%) Sales and office 7,092 (31.1%) Farming, fishing, forestry 8 (0.0%) Construction, extraction, and maintenance 1,158 (5.1%) Production, transportation, and material moving 1,382 (6.1%)

Fieldsboro Borough
15
Fieldsboro Area: 0.41 square miles
School District(s): Bordentown Regional (K-12)
Population 1960 583 1970 615 1980 597 1990 579 2000 522 2007 (est.) 568 Population Density 2000: 1,273.2 persons/sq. mile Land Use 2005 (in acres) Residential 53 (20.4%) Commercial 3 (1.3%) Community services 0 (0.0%) Industrial 0 (0.0%) Transportation and utilities 39 (15.2%) Recreation 3 (1.3%) Military 0 (0.0%) Wooded 88 (33.9%) Mining 0 (0.0%) Agriculture and vacant 14 (5.3%) Water 59 (22.7%) Race and Hispanic Origin Characteristics 2000 White 426 (81.6%) Black or African American 83 (15.9%) Asian 0 (0.0%) All others 13 (2.5%) Hispanic origin (any race) 13 (2.5%) Sex Data 2000 Male 245 (46.9%) Female 277 (53.1%) Age Data 2000 Median age 35.4 Under 18 years 132 (25.3%) Age 18 to 64 325 (62.3%) 65 years and over 65 (12.5%) Income and Poverty Status 1999 Median household income $58,958 Median family income $66,607 Per capita income $23,908 Persons below poverty level 10 (1.9%) Educational Attainment 2000 (persons 25 yrs. and over) Less than 9th grade 6 (1.7%) 9th to 12th grade, no diploma 34 (9.7%) High school graduate 113 (32.2%) Some college, no degree 81 (23.1%) Associate degree 20 (5.7%) Bachelor’s degree 78 (22.2%) Graduate/professional degree 19 (5.4%)
Household Data 2000 Total households 189 (100.0%) Family households 139 (73.5%) Nonfamily households 50 (26.5%) Average household size 2.76 Average family size 3.17 Housing Occupancy 2000 Total units 204 (100.0%) Occupied units 189 (92.6%) Vacant units 15 (7.4%) Housing Tenure 2000 Total occupied units 189 (100.0%) Owner-occupied units 144 (76.2%) Renter-occupied units 45 (23.8%) Housing Value 2000 Median value, owner-occupied $103,900 Median monthly contract rent $1,050 New Housing Construction 1996-2007 (residential building permits authorized) 1996 1 units 2002 6 units 1997 14 units 2003 7 units 1998 11 units 2004 0 units 1999 10 units 2005 1 units 2000 6 units 2006 2 units 2001 5 units 2007 0 units Employment Status 2000 (population age 16 years and over) Population 16 years and over 394 (100.0%) In labor force 305 (77.4%) Civilian labor force 303 (76.9%) Employed 291 (73.9%) Unemployed 12 (3.0%) % of civilian labor force 4.0 Armed Forces 2 (0.5%) Not in labor force 89 (22.6%) Occupations 2000 (employed civilian workers age 16 years and over) Management, professional 84 (28.9%) Service 39 (13.4%) Sales and office 99 (34.0%) Farming, fishing, forestry 0 (0.0%) Construction, extraction, and maintenance 18 (6.2%) Production, transportation, and material moving 51 (17.5%)

Florence Township
16
Florence Twp. Area: 10.07 square miles
School District(s): Florence Township (K-12)
Population 1960 8,127 1970 8,560 1980 9,084 1990 10,266 2000 10,746 2007 (est.) 11,440 Population Density 2000: 1,067.1 persons/sq. mile Land Use 2005 (in acres) Residential 905 (13.9%) Commercial 145 (2.2%) Community services 49 (0.8%) Industrial 298 (4.6%) Transportation and utilities 768 (11.8%) Recreation 86 (1.3%) Military 0 (0.0%) Wooded 1,636 (25.1%) Mining 0 (0.0%) Agriculture and vacant 2,344 (36.0%) Water 280 (4.3%) Race and Hispanic Origin Characteristics 2000 White 9,190 (85.5%) Black or African American 1,047 (9.7%) Asian 253 (2.4%) All others 256 (2.4%) Hispanic origin (any race) 253 (2.4%) Sex Data 2000 Male 5,140 (47.8%) Female 5,606 (52.2%) Age Data 2000 Median age 36.9 Under 18 years 2,707 (25.2%) Age 18 to 64 6,762 (62.9%) 65 years and over 1,277 (11.9%) Income and Poverty Status 1999 Median household income $56,843 Median family income $67,412 Per capita income $23,529 Persons below poverty level 654 (6.1%) Educational Attainment 2000 (persons 25 yrs. and over) Less than 9th grade 367 (5.1%) 9th to 12th grade, no diploma 677 (9.4%) High school graduate 2,717 (37.7%) Some college, no degree 1,512 (21.0%) Associate degree 502 (7.0%) Bachelor’s degree 947 (13.1%) Graduate/professional degree 488 (6.8%)
Household Data 2000 Total households 4,149 (100.0%) Family households 2,892 (69.7%) Nonfamily households 1,257 (30.3%) Average household size 2.58 Average family size 3.10 Housing Occupancy 2000 Total units 4,391 (100.0%) Occupied units 4,149 (94.5%) Vacant units 242 (5.5%) Housing Tenure 2000 Total occupied units 4,149 (100.0%) Owner-occupied units 3,205 (77.2%) Renter-occupied units 944 (22.8%) Housing Value 2000 Median value, owner-occupied $115,900 Median monthly contract rent $680 New Housing Construction 1996-2007 (residential building permits authorized) 1996 54 units 2002 21 units 1997 65 units 2003 10 units 1998 40 units 2004 103 units 1999 94 units 2005 127 units 2000 81 units 2006 46 units 2001 78 units 2007 24 units Employment Status 2000 (population age 16 years and over) Population 16 years and over 8,420 (100.0%) In labor force 5,710 (67.8%) Civilian labor force 5,661 (67.2%) Employed 5,381 (63.9%) Unemployed 280 (3.3%) % of civilian labor force 4.9 Armed Forces 49 (0.6%) Not in labor force 2,710 (32.2%) Occupations 2000 (employed civilian workers age 16 years and over) Management, professional 1,770 (32.9%) Service 684 (12.7%) Sales and office 1,544 (28.7%) Farming, fishing, forestry 6 (0.1%) Construction, extraction, and maintenance 482 (9.0%) Production, transportation, and material moving 895 (16.6%)
Hainesport Township
17
Hainesport Twp. Area: 6.81 square miles
School District(s): Hainesport Township (K-8) Rancocas Valley Regional High School (9-12)
Population 1960 3,271 1970 2,990 1980 3,236 1990 3,249 2000 4,126 2007 (est.) 6,014 Population Density 2000: 605.9 persons/sq. mile Land Use 2005 (in acres) Residential 859 (19.7%) Commercial 138 (3.2%) Community services 50 (1.1%) Industrial 160 (3.7%) Transportation and utilities 393 (9.0%) Recreation 48 (1.1%) Military 0 (0.0%) Wooded 1,361 (31.3%) Mining 0 (0.0%) Agriculture and vacant 1,187 (27.3%) Water 155 (3.6%) Race and Hispanic Origin Characteristics 2000 White 3,882 (94.1%) Black or African American 110 (2.7%) Asian 70 (1.7%) All others 64 (1.6%) Hispanic origin (any race) 88 (2.1%) Sex Data 2000 Male 2,018 (48.9%) Female 2,108 (51.1%) Age Data 2000 Median age 38.4 Under 18 years 1,084 (26.3%) Age 18 to 64 2,557 (62.0%) 65 years and over 485 (11.8%) Income and Poverty Status 1999 Median household income $66,417 Median family income $72,005 Per capita income $28,091 Persons below poverty level 121 (3.0%) Educational Attainment 2000 (persons 25 yrs. and over) Less than 9th grade 25 (0.9%) 9th to 12th grade, no diploma 292 (10.5%) High school graduate 1,054 (37.9%) Some college, no degree 611 (21.9%) Associate degree 113 (4.1%) Bachelor’s degree 475 (17.1%) Graduate/professional degree 214 (7.7%)
Household Data 2000 Total households 1,477 (100.0%) Family households 1,150 (77.9%) Nonfamily households 327 (22.1%) Average household size 2.78 Average family size 3.16 Housing Occupancy 2000 Total units 1,555 (100.0%) Occupied units 1,477 (95.0%) Vacant units 78 (5.0%) Housing Tenure 2000 Total occupied units 1,477 (100.0%) Owner-occupied units 1,319 (89.3%) Renter-occupied units 158 (10.7%) Housing Value 2000 Median value, owner-occupied $144,400 Median monthly contract rent $744 New Housing Construction 1996-2007 (residential building permits authorized) 1996 36 units 2002 169 units 1997 47 units 2003 160 units 1998 37 units 2004 19 units 1999 67 units 2005 38 units 2000 165 units 2006 5 units 2001 221 units 2007 2 units Employment Status 2000 (population age 16 years and over) Population 16 years and over 3,199 (100.0%) In labor force 2,321 (72.6%) Civilian labor force 2,307 (72.1%) Employed 2,244 (70.1%) Unemployed 63 (2.0%) % of civilian labor force 2.7 Armed Forces 14 (0.4%) Not in labor force 878 (27.4%) Occupations 2000 (employed civilian workers age 16 years and over) Management, professional 843 (37.6%) Service 278 (12.4%) Sales and office 662 (29.5%) Farming, fishing, forestry 4 (0.2%) Construction, extraction, and maintenance 191 (8.5%) Production, transportation, and material moving 266 (11.9%)

Lumberton Township
18
Lumberton Twp. Area: 13.01 square miles
School District(s): Lumberton Township (K-8) Rancocas Valley Regional High School (9-12)
Population 1960 2,833 1970 3,945 1980 5,236 1990 6,705 2000 10,461 2007 (est.) 12,099 Population Density 2000: 804.1 persons/sq. mile Land Use 2005 (in acres) Residential 1,523 (18.3%) Commercial 223 (2.7%) Community services 59 (0.7%) Industrial 111 (1.3%) Transportation and utilities 867 (10.4%) Recreation 164 (2.0%) Military 0 (0.0%) Wooded 1,514 (18.2%) Mining 0 (0.0%) Agriculture and vacant 3,765 (45.2%) Water 107 (1.3%) Race and Hispanic Origin Characteristics 2000 White 8,192 (78.3%) Black or African American 1,438 (13.7%) Asian 354 (3.4%) All others 477 (4.6%) Hispanic origin (any race) 539 (5.2%) Sex Data 2000 Male 4,990 (47.7%) Female 5,471 (52.3%) Age Data 2000 Median age 35.6 Under 18 years 2,937 (28.1%) Age 18 to 64 6,366 (60.9%) 65 years and over 1,158 (11.1%) Income and Poverty Status 1999 Median household income $60,571 Median family income $70,329 Per capita income $25,789 Persons below poverty level 381 (3.8%) Educational Attainment 2000 (persons 25 yrs. and over) Less than 9th grade 307 (4.5%) 9th to 12th grade, no diploma 629 (9.3%) High school graduate 1,964 (28.9%) Some college, no degree 1,261 (18.6%) Associate degree 533 (7.8%) Bachelor’s degree 1,445 (21.3%) Graduate/professional degree 651 (9.6%)
Household Data 2000 Total households 3,930 (100.0%) Family households 2,730 (69.5%) Nonfamily households 1,200 (30.5%) Average household size 2.61 Average family size 3.17 Housing Occupancy 2000 Total units 4,080 (100.0%) Occupied units 3,930 (96.3%) Vacant units 150 (3.7%) Housing Tenure 2000 Total occupied units 3,930 (100.0%) Owner-occupied units 2,604 (66.3%) Renter-occupied units 1,326 (33.7%) Housing Value 2000 Median value, owner-occupied $163,300 Median monthly contract rent $702 New Housing Construction 1996-2007 (residential building permits authorized) 1996 94 units 2002 158 units 1997 171 units 2003 87 units 1998 117 units 2004 78 units 1999 225 units 2005 2 units 2000 195 units 2006 31 units 2001 229 units 2007 1 units Employment Status 2000 (population age 16 years and over) Population 16 years and over 7,601 (100.0%) In labor force 5,375 (70.7%) Civilian labor force 5,175 (68.1%) Employed 4,983 (65.6%) Unemployed 192 (2.5%) % of civilian labor force 3.7 Armed Forces 200 (2.6%) Not in labor force 2,226 (29.3%) Occupations 2000 (employed civilian workers age 16 years and over) Management, professional 2,217 (44.5%) Service 526 (10.6%) Sales and office 1,317 (26.4%) Farming, fishing, forestry 0 (0.0%) Construction, extraction, and maintenance 336 (6.7%) Production, transportation, and material moving 587 (11.8%)

Mansfield Township
19
Mansfield Twp. Area: 21.93 square miles
School District(s): Mansfield Township (K-6) Northern Burlington Co. Regional (7-12)
Population 1960 2,048 1970 3,597 1980 5,523 1990 3,874 2000 5,090 2007 (est.) 7,961 Population Density 2000: 232.1 persons/sq. mile Land Use 2005 (in acres) Residential 1,379 (9.8%) Commercial 283 (2.0%) Community services 70 (0.5%) Industrial 44 (0.3%) Transportation and utilities 1,250 (8.9%) Recreation 241 (1.7%) Military 0 (0.0%) Wooded 3,195 (22.8%) Mining 11 (0.1%) Agriculture and vacant 7,422 (52.9%) Water 137 (1.0%) Race and Hispanic Origin Characteristics 2000 White 4,857 (95.4%) Black or African American 97 (1.9%) Asian 76 (1.5%) All others 60 (1.2%) Hispanic origin (any race) 93 (1.8%) Sex Data 2000 Male 2,442 (48.0%) Female 2,648 (52.0%) Age Data 2000 Median age 48.8 Under 18 years 950 (18.7%) Age 18 to 64 2,517 (49.4%) 65 years and over 1,623 (31.9%) Income and Poverty Status 1999 Median household income $50,757 Median family income $59,040 Per capita income $26,559 Persons below poverty level 228 (4.5%) Educational Attainment 2000 (persons 25 yrs. and over) Less than 9th grade 136 (3.6%) 9th to 12th grade, no diploma 414 (10.8%) High school graduate 1,465 (38.4%) Some college, no degree 637 (16.7%) Associate degree 205 (5.4%) Bachelor’s degree 525 (13.8%) Graduate/professional degree 434 (11.4%)
Household Data 2000 Total households 2,077 (100.0%) Family households 1,561 (75.2%) Nonfamily households 516 (24.8%) Average household size 2.45 Average family size 2.86 Housing Occupancy 2000 Total units 2,122 (100.0%) Occupied units 2,077 (97.9%) Vacant units 45 (2.1%) Housing Tenure 2000 Total occupied units 2,077 (100.0%) Owner-occupied units 1,970 (94.8%) Renter-occupied units 107 (5.2%) Housing Value 2000 Median value, owner-occupied $153,800 Median monthly contract rent $706 New Housing Construction 1996-2007 (residential building permits authorized) 1996 53 units 2002 196 units 1997 68 units 2003 154 units 1998 97 units 2004 69 units 1999 202 units 2005 81 units 2000 323 units 2006 51 units 2001 379 units 2007 40 units Employment Status 2000 (population age 16 years and over) Population 16 years and over 4,251 (100.0%) In labor force 2,117 (49.8%) Civilian labor force 2,105 (49.5%) Employed 2,012 (47.3%) Unemployed 93 (2.2%) % of civilian labor force 4.4 Armed Forces 12 (0.3%) Not in labor force 2,134 (50.2%) Occupations 2000 (employed civilian workers age 16 years and over) Management, professional 674 (33.5%) Service 282 (14.0%) Sales and office 563 (28.0%) Farming, fishing, forestry 14 (0.7%) Construction, extraction, and maintenance 257 (12.8%) Production, transportation, and material moving 222 (11.0%)
Maple Shade Township
20
Maple Shade Twp. Area: 3.83 square miles
School District(s): Maple Shade (K-12)
Population 1960 12,947 1970 16,464 1980 20,525 1990 19,211 2000 19,079 2007 (est.) 19,195 Population Density 2000: 4,981.5 persons/sq. mile Land Use 2005 (in acres) Residential 1,028 (42.0%) Commercial 286 (11.7%) Community services 22 (0.9%) Industrial 0 (0.0%) Transportation and utilities 683 (27.9%) Recreation 65 (2.7%) Military 0 (0.0%) Wooded 248 (10.1%) Mining 0 (0.0%) Agriculture and vacant 85 (3.5%) Water 31 (1.3%) Race and Hispanic Origin Characteristics 2000 White 15,868 (83.2%) Black or African American 1,376 (7.2%) Asian 1,164 (6.1%) All others 671 (3.5%) Hispanic origin (any race) 850 (4.5%) Sex Data 2000 Male 9,339 (48.9%) Female 9,740 (51.1%) Age Data 2000 Median age 36.5 Under 18 years 3,697 (19.4%) Age 18 to 64 12,452 (65.3%) 65 years and over 2,930 (15.4%) Income and Poverty Status 1999 Median household income $45,426 Median family income $53,912 Per capita income $23,812 Persons below poverty level 1,009 (5.4%) Educational Attainment 2000 (persons 25 yrs. and over) Less than 9th grade 633 (4.6%) 9th to 12th grade, no diploma 1,792 (13.1%) High school graduate 5,096 (37.2%) Some college, no degree 2,538 (18.5%) Associate degree 713 (5.2%) Bachelor’s degree 1,967 (14.3%) Graduate/professional degree 972 (7.1%)
Household Data 2000 Total households 8,462 (100.0%) Family households 4,718 (55.8%) Nonfamily households 3,744 (44.2%) Average household size 2.22 Average family size 2.95 Housing Occupancy 2000 Total units 9,009 (100.0%) Occupied units 8,462 (93.9%) Vacant units 547 (6.1%) Housing Tenure 2000 Total occupied units 8,462 (100.0%) Owner-occupied units 4,216 (49.8%) Renter-occupied units 4,246 (50.2%) Housing Value 2000 Median value, owner-occupied $107,900 Median monthly contract rent $767 New Housing Construction 1996-2007 (residential building permits authorized) 1996 15 units 2002 41 units 1997 11 units 2003 27 units 1998 14 units 2004 141 units 1999 11 units 2005 101 units 2000 17 units 2006 77 units 2001 12 units 2007 68 units Employment Status 2000 (population age 16 years and over) Population 16 years and over 15,723 (100.0%) In labor force 10,765 (68.5%) Civilian labor force 10,723 (68.2%) Employed 10,342 (65.8%) Unemployed 381 (2.4%) % of civilian labor force 3.6 Armed Forces 42 (0.3%) Not in labor force 4,958 (31.5%) Occupations 2000 (employed civilian workers age 16 years and over) Management, professional 3,403 (32.9%) Service 1,462 (14.1%) Sales and office 2,965 (28.7%) Farming, fishing, forestry 5 (0.0%) Construction, extraction, and maintenance 909 (8.8%) Production, transportation, and material moving 1,598 (15.5%)
Medford Township
21
Medford Twp. Area: 39.86 square miles
School District(s): Medford Township (K-8) Lenape Regional High School (9-12)
Population 1960 4,844 1970 8,292 1980 17,622 1990 20,526 2000 22,253 2007 (est.) 22,838 Population Density 2000: 558.3 persons/sq. mile Land Use 2005 (in acres) Residential 4,620 (18.1%) Commercial 407 (1.6%) Community services 160 (0.6%) Industrial 37 (0.1%) Transportation and utilities 1,866 (7.3%) Recreation 612 (2.4%) Military 0 (0.0%) Wooded 11,844 (46.5%) Mining 0 (0.0%) Agriculture and vacant 5,340 (21.0%) Water 590 (2.3%) Race and Hispanic Origin Characteristics 2000 White 21,527 (96.7%) Black or African American 170 (0.8%) Asian 327 (1.5%) All others 229 (1.0%) Hispanic origin (any race) 252 (1.1%) Sex Data 2000 Male 10,779 (48.4%) Female 11,474 (51.6%) Age Data 2000 Median age 40.0 Under 18 years 5,974 (26.8%) Age 18 to 64 13,892 (62.4%) 65 years and over 2,387 (10.7%) Income and Poverty Status 1999 Median household income $83,059 Median family income $97,135 Per capita income $38,641 Persons below poverty level 410 (1.9%) Educational Attainment 2000 (persons 25 yrs. and over) Less than 9th grade 182 (1.2%) 9th to 12th grade, no diploma 599 (4.0%) High school graduate 2,958 (19.7%) Some college, no degree 2,772 (18.4%) Associate degree 1,026 (6.8%) Bachelor’s degree 4,727 (31.4%) Graduate/professional degree 2,781 (18.5%)
Household Data 2000 Total households 7,946 (100.0%) Family households 6,287 (79.1%) Nonfamily households 1,659 (20.9%) Average household size 2.77 Average family size 3.16 Housing Occupancy 2000 Total units 8,147 (100.0%) Occupied units 7,946 (97.5%) Vacant units 201 (2.5%) Housing Tenure 2000 Total occupied units 7,946 (100.0%) Owner-occupied units 6,790 (85.5%) Renter-occupied units 1,156 (14.5%) Housing Value 2000 Median value, owner-occupied $213,600 Median monthly contract rent $947 New Housing Construction 1996-2007 (residential building permits authorized) 1996 63 units 2002 104 units 1997 69 units 2003 52 units 1998 92 units 2004 29 units 1999 84 units 2005 27 units 2000 152 units 2006 10 units 2001 106 units 2007 67 units Employment Status 2000 (population age 16 years and over) Population 16 years and over 16,988 (100.0%) In labor force 11,690 (68.8%) Civilian labor force 11,619 (68.4%) Employed 11,364 (66.9%) Unemployed 255 (1.5%) % of civilian labor force 2.2 Armed Forces 71 (0.4%) Not in labor force 5,298 (31.2%) Occupations 2000 (employed civilian workers age 16 years and over) Management, professional 6,249 (55.0%) Service 1,007 (8.9%) Sales and office 2,992 (26.3%) Farming, fishing, forestry 8 (0.1%) Construction, extraction, and maintenance 559 (4.9%) Production, transportation, and material moving 549 (4.8%)

Medford Lakes Borough
22
Medford Lakes Area: 1.28 square miles
School District(s): Medford Lakes Borough (K-8) Lenape Regional High School (9-12)
Population 1960 2,876 1970 4,792 1980 4,958 1990 4,462 2000 4,173 2007 (est.) 4,099 Population Density 2000: 3,260.2 persons/sq. mile Land Use 2005 (in acres) Residential 434 (53.3%) Commercial 6 (0.8%) Community services 7 (0.9%) Industrial 0 (0.0%) Transportation and utilities 156 (19.1%) Recreation 88 (10.8%) Military 0 (0.0%) Wooded 30 (3.7%) Mining 0 (0.0%) Agriculture and vacant 42 (5.1%) Water 51 (6.3%) Race and Hispanic Origin Characteristics 2000 White 4,103 (98.3%) Black or African American 18 (0.4%) Asian 20 (0.5%) All others 32 (0.8%) Hispanic origin (any race) 41 (1.0%) Sex Data 2000 Male 2,043 (49.0%) Female 2,130 (51.0%) Age Data 2000 Median age 40.3 Under 18 years 1,067 (25.6%) Age 18 to 64 2,590 (62.1%) 65 years and over 516 (12.4%) Income and Poverty Status 1999 Median household income $77,536 Median family income $83,695 Per capita income $31,382 Persons below poverty level 89 (2.1%) Educational Attainment 2000 (persons 25 yrs. and over) Less than 9th grade 35 (1.2%) 9th to 12th grade, no diploma 106 (3.6%) High school graduate 515 (17.7%) Some college, no degree 468 (16.1%) Associate degree 328 (11.3%) Bachelor’s degree 1,051 (36.1%) Graduate/professional degree 407 (14.0%)
Household Data 2000 Total households 1,527 (100.0%) Family households 1,239 (81.1%) Nonfamily households 288 (18.9%) Average household size 2.73 Average family size 3.04 Housing Occupancy 2000 Total units 1,555 (100.0%) Occupied units 1,527 (98.2%) Vacant units 28 (1.8%) Housing Tenure 2000 Total occupied units 1,527 (100.0%) Owner-occupied units 1,439 (94.2%) Renter-occupied units 88 (5.8%) Housing Value 2000 Median value, owner-occupied $161,100 Median monthly contract rent $920 New Housing Construction 1996-2007 (residential building permits authorized) 1996 1 units 2002 3 units 1997 1 units 2003 2 units 1998 1 units 2004 4 units 1999 4 units 2005 5 units 2000 0 units 2006 16 units 2001 4 units 2007 17 units Employment Status 2000 (population age 16 years and over) Population 16 years and over 3,260 (100.0%) In labor force 2,352 (72.1%) Civilian labor force 2,346 (72.0%) Employed 2,310 (70.9%) Unemployed 36 (1.1%) % of civilian labor force 1.5 Armed Forces 6 (0.2%) Not in labor force 908 (27.9%) Occupations 2000 (employed civilian workers age 16 years and over) Management, professional 1,124 (48.7%) Service 218 (9.4%) Sales and office 735 (31.8%) Farming, fishing, forestry 0 (0.0%) Construction, extraction, and maintenance 96 (4.2%) Production, transportation, and material moving 137 (5.9%)

Moorestown Township
23
Moorestown Twp. Area: 14.91 square miles
School District(s): Moorestown Township (K-12)
Population 1960 12,497 1970 15,577 1980 15,596 1990 16,116 2000 19,017 2007 (est.) 19,624 Population Density 2000: 1,275.5 persons/sq. mile Land Use 2005 (in acres) Residential 3,140 (33.0%) Commercial 709 (7.5%) Community services 135 (1.4%) Industrial 98 (1.0%) Transportation and utilities 1,443 (15.2%) Recreation 411 (4.3%) Military 0 (0.0%) Wooded 1,410 (14.8%) Mining 0 (0.0%) Agriculture and vacant 1,968 (20.7%) Water 193 (2.0%) Race and Hispanic Origin Characteristics 2000 White 16,962 (89.2%) Black or African American 1,082 (5.7%) Asian 621 (3.3%) All others 352 (1.9%) Hispanic origin (any race) 332 (1.7%) Sex Data 2000 Male 8,974 (47.2%) Female 10,043 (52.8%) Age Data 2000 Median age 40.9 Under 18 years 5,220 (27.4%) Age 18 to 64 10,677 (56.1%) 65 years and over 3,120 (16.4%) Income and Poverty Status 1999 Median household income $78,826 Median family income $94,844 Per capita income $42,154 Persons below poverty level 634 (3.4%) Educational Attainment 2000 (persons 25 yrs. and over) Less than 9th grade 354 (2.7%) 9th to 12th grade, no diploma 622 (4.8%) High school graduate 2,354 (18.2%) Some college, no degree 2,126 (16.4%) Associate degree 695 (5.4%) Bachelor’s degree 3,795 (29.3%) Graduate/professional degree 3,000 (23.2%)
Household Data 2000 Total households 6,971 (100.0%) Family households 5,273 (75.6%) Nonfamily households 1,698 (24.4%) Average household size 2.68 Average family size 3.13 Housing Occupancy 2000 Total units 7,211 (100.0%) Occupied units 6,971 (96.7%) Vacant units 240 (3.3%) Housing Tenure 2000 Total occupied units 6,971 (100.0%) Owner-occupied units 5,675 (81.4%) Renter-occupied units 1,296 (18.6%) Housing Value 2000 Median value, owner-occupied $254,900 Median monthly contract rent $843 New Housing Construction 1996-2007 (residential building permits authorized) 1996 156 units 2002 82 units 1997 178 units 2003 45 units 1998 189 units 2004 37 units 1999 180 units 2005 63 units 2000 130 units 2006 57 units 2001 100 units 2007 27 units Employment Status 2000 (population age 16 years and over) Population 16 years and over 14,325 (100.0%) In labor force 8,996 (62.8%) Civilian labor force 8,973 (62.6%) Employed 8,704 (60.8%) Unemployed 269 (1.9%) % of civilian labor force 3.0 Armed Forces 23 (0.2%) Not in labor force 5,329 (37.2%) Occupations 2000 (employed civilian workers age 16 years and over) Management, professional 4,877 (56.0%) Service 599 (6.9%) Sales and office 2,279 (26.2%) Farming, fishing, forestry 12 (0.1%) Construction, extraction, and maintenance 347 (4.0%) Production, transportation, and material moving 590 (6.8%)

Mount Holly Township
24
Mount Holly Twp. Area: 2.90 square miles
School District(s): Mount Holly Township (K-8) Rancocas Valley Regional High School (9-12)
Population 1960 13,271 1970 12,713 1980 10,818 1990 10,639 2000 10,728 2007 (est.) 10,335 Population Density 2000: 3,699.3 persons/sq. mile Land Use 2005 (in acres) Residential 618 (33.6%) Commercial 113 (6.1%) Community services 97 (5.3%) Industrial 43 (2.3%) Transportation and utilities 473 (25.7%) Recreation 81 (4.4%) Military 0 (0.0%) Wooded 306 (16.6%) Mining 0 (0.0%) Agriculture and vacant 56 (3.0%) Water 56 (3.0%) Race and Hispanic Origin Characteristics 2000 White 7,368 (68.7%) Black or African American 2,314 (21.6%) Asian 147 (1.4%) All others 899 (8.4%) Hispanic origin (any race) 942 (8.8%) Sex Data 2000 Male 5,356 (49.9%) Female 5,372 (50.1%) Age Data 2000 Median age 35.0 Under 18 years 2,823 (26.3%) Age 18 to 64 6,570 (61.2%) 65 years and over 1,335 (12.4%) Income and Poverty Status 1999 Median household income $43,284 Median family income $52,000 Per capita income $19,672 Persons below poverty level 1,023 (9.9%) Educational Attainment 2000 (persons 25 yrs. and over) Less than 9th grade 311 (4.5%) 9th to 12th grade, no diploma 1,227 (17.6%) High school graduate 2,441 (35.1%) Some college, no degree 1,278 (18.4%) Associate degree 405 (5.8%) Bachelor’s degree 1,001 (14.4%) Graduate/professional degree 292 (4.2%)
Household Data 2000 Total households 3,903 (100.0%) Family households 2,585 (66.2%) Nonfamily households 1,318 (33.8%) Average household size 2.64 Average family size 3.20 Housing Occupancy 2000 Total units 4,248 (100.0%) Occupied units 3,903 (91.9%) Vacant units 345 (8.1%) Housing Tenure 2000 Total occupied units 3,903 (100.0%) Owner-occupied units 2,465 (63.2%) Renter-occupied units 1,438 (36.8%) Housing Value 2000 Median value, owner-occupied $98,200 Median monthly contract rent $719 New Housing Construction 1996-2007 (residential building permits authorized) 1996 4 units 2002 4 units 1997 2 units 2003 0 units 1998 7 units 2004 0 units 1999 0 units 2005 14 units 2000 2 units 2006 2 units 2001 2 units 2007 4 units Employment Status 2000 (population age 16 years and over) Population 16 years and over 8,229 (100.0%) In labor force 5,412 (65.8%) Civilian labor force 5,163 (62.7%) Employed 4,831 (58.7%) Unemployed 332 (4.0%) % of civilian labor force 6.4 Armed Forces 249 (3.0%) Not in labor force 2,817 (34.2%) Occupations 2000 (employed civilian workers age 16 years and over) Management, professional 1,317 (27.3%) Service 839 (17.4%) Sales and office 1,349 (27.9%) Farming, fishing, forestry 20 (0.4%) Construction, extraction, and maintenance 452 (9.4%) Production, transportation, and material moving 854 (17.7%)

Mount Laurel Township
25
Mount Laurel Twp. Area: 21.94 square miles
School District(s): Mount Laurel Township (K-8) Lenape Regional High School (9-12)
Population 1960 5,249 1970 11,221 1980 17,614 1990 30,270 2000 40,221 2007 (est.) 39,409 Population Density 2000: 1,833.2 persons/sq. mile Land Use 2005 (in acres) Residential 3,741 (26.5%) Commercial 880 (6.2%) Community services 119 (0.8%) Industrial 66 (0.5%) Transportation and utilities 2,829 (20.1%) Recreation 493 (3.5%) Military 0 (0.0%) Wooded 3,376 (24.0%) Mining 0 (0.0%) Agriculture and vacant 2,350 (16.7%) Water 238 (1.7%) Race and Hispanic Origin Characteristics 2000 White 35,034 (87.1%) Black or African American 2,785 (6.9%) Asian 1,529 (3.8%) All others 873 (2.2%) Hispanic origin (any race) 901 (2.2%) Sex Data 2000 Male 18,983 (47.2%) Female 21,238 (52.8%) Age Data 2000 Median age 38.9 Under 18 years 9,305 (23.1%) Age 18 to 64 25,011 (62.2%) 65 years and over 5,905 (14.7%) Income and Poverty Status 1999 Median household income $63,750 Median family income $76,288 Per capita income $32,245 Persons below poverty level 1,243 (3.1%) Educational Attainment 2000 (persons 25 yrs. and over) Less than 9th grade 638 (2.2%) 9th to 12th grade, no diploma 1,641 (5.7%) High school graduate 6,978 (24.1%) Some college, no degree 5,235 (18.1%) Associate degree 2,254 (7.8%) Bachelor’s degree 8,111 (28.0%) Graduate/professional degree 4,067 (14.1%)
Household Data 2000 Total households 16,570 (100.0%) Family households 11,062 (66.8%) Nonfamily households 5,508 (33.2%) Average household size 2.41 Average family size 2.98 Housing Occupancy 2000 Total units 17,163 (100.0%) Occupied units 16,570 (96.5%) Vacant units 593 (3.5%) Housing Tenure 2000 Total occupied units 16,570 (100.0%) Owner-occupied units 13,861 (83.7%) Renter-occupied units 2,709 (16.3%) Housing Value 2000 Median value, owner-occupied $161,900 Median monthly contract rent $939 New Housing Construction 1996-2007 (residential building permits authorized) 1996 387 units 2002 2 units 1997 355 units 2003 4 units 1998 602 units 2004 70 units 1999 269 units 2005 1 units 2000 58 units 2006 38 units 2001 0 units 2007 45 units Employment Status 2000 (population age 16 years and over) Population 16 years and over 31,944 (100.0%) In labor force 21,852 (68.4%) Civilian labor force 21,688 (67.9%) Employed 21,031 (65.8%) Unemployed 657 (2.1%) % of civilian labor force 3.0 Armed Forces 164 (0.5%) Not in labor force 10,092 (31.6%) Occupations 2000 (employed civilian workers age 16 years and over) Management, professional 10,417 (49.5%) Service 1,930 (9.2%) Sales and office 6,352 (30.2%) Farming, fishing, forestry 23 (0.1%) Construction, extraction, and maintenance 1,015 (4.8%) Production, transportation, and material moving 1,294 (6.2%)

New Hanover Township
26
New Hanover Twp. Area: 22.49 square miles
School District(s): New Hanover Township (K-8) Bordentown Regional High School (9-12)
Population 1960 28,528 1970 27,410 1980 14,258 1990 9,546 2000 9,744 2007 (est.) 9,439 Population Density 2000: 433.3 persons/sq. mile Land Use 2005 (in acres) Residential 188 (1.3%) Commercial 35 (0.2%) Community services 39 (0.3%) Industrial 8 (0.1%) Transportation and utilities 434 (3.0%) Recreation 549 (3.8%) Military 3,958 (27.6%) Wooded 7,321 (51.0%) Mining 0 (0.0%) Agriculture and vacant 1,578 (11.0%) Water 242 (1.7%) Race and Hispanic Origin Characteristics 2000 White 6,249 (64.1%) Black or African American 2,816 (28.9%) Asian 143 (1.5%) All others 536 (5.5%) Hispanic origin (any race) 1,890 (19.4%) Sex Data 2000 Male 7,802 (80.1%) Female 1,942 (19.9%) Age Data 2000 Median age 32.1 Under 18 years 1,413 (14.5%) Age 18 to 64 8,206 (84.2%) 65 years and over 125 (1.3%) Income and Poverty Status 1999 Median household income $44,386 Median family income $45,511 Per capita income $12,140 Persons below poverty level 146 (3.9%) Educational Attainment 2000 (persons 25 yrs. and over) Less than 9th grade 416 (6.2%) 9th to 12th grade, no diploma 1,318 (19.7%) High school graduate 2,237 (33.4%) Some college, no degree 1,419 (21.2%) Associate degree 330 (4.9%) Bachelor’s degree 760 (11.3%) Graduate/professional degree 220 (3.3%)
Household Data 2000 Total households 1,162 (100.0%) Family households 991 (85.3%) Nonfamily households 171 (14.7%) Average household size 3.14 Average family size 3.46 Housing Occupancy 2000 Total units 1,381 (100.0%) Occupied units 1,162 (84.1%) Vacant units 219 (15.9%) Housing Tenure 2000 Total occupied units 1,162 (100.0%) Owner-occupied units 221 (19.0%) Renter-occupied units 941 (81.0%) Housing Value 2000 Median value, owner-occupied $133,200 Median monthly contract rent $941 New Housing Construction 1996-2007 (residential building permits authorized) 1996 1 units 2002 3 units 1997 0 units 2003 8 units 1998 2 units 2004 4 units 1999 1 units 2005 0 units 2000 1 units 2006 21 units 2001 1 units 2007 5 units Employment Status 2000 (population age 16 years and over) Population 16 years and over 8,478 (100.0%) In labor force 3,051 (36.0%) Civilian labor force 950 (11.2%) Employed 918 (10.8%) Unemployed 32 (0.4%) % of civilian labor force 3.4 Armed Forces 2,101 (24.8%) Not in labor force 5,427 (64.0%) Occupations 2000 (employed civilian workers age 16 years and over) Management, professional 356 (38.8%) Service 197 (21.5%) Sales and office 216 (23.5%) Farming, fishing, forestry 0 (0.0%) Construction, extraction, and maintenance 70 (7.6%) Production, transportation, and material moving 79 (8.6%)
North Hanover Township
27
North Hanover Twp. Area: 17.39 square miles
School District(s): North Hanover Township (K-6) Northern Burlington Co. Regional (7-12)
Population 1960 2,796 1970 9,858 1980 9,050 1990 9,994 2000 7,347 2007 (est.) 7,415 Population Density 2000: 422.5 persons/sq. mile Land Use 2005 (in acres) Residential 1,055 (9.6%) Commercial 93 (0.8%) Community services 170 (1.5%) Industrial 6 (0.1%) Transportation and utilities 511 (4.7%) Recreation 172 (1.6%) Military 0 (0.0%) Wooded 3,083 (28.1%) Mining 0 (0.0%) Agriculture and vacant 5,754 (52.4%) Water 133 (1.2%) Race and Hispanic Origin Characteristics 2000 White 5,924 (80.6%) Black or African American 805 (11.0%) Asian 156 (2.1%) All others 462 (6.3%) Hispanic origin (any race) 423 (5.8%) Sex Data 2000 Male 3,682 (50.1%) Female 3,665 (49.9%) Age Data 2000 Median age 28.7 Under 18 years 2,468 (33.6%) Age 18 to 64 4,427 (60.3%) 65 years and over 452 (6.2%) Income and Poverty Status 1999 Median household income $39,988 Median family income $45,553 Per capita income $17,580 Persons below poverty level 387 (5.3%) Educational Attainment 2000 (persons 25 yrs. and over) Less than 9th grade 122 (2.9%) 9th to 12th grade, no diploma 420 (10.1%) High school graduate 1,446 (34.8%) Some college, no degree 1,166 (28.1%) Associate degree 449 (10.8%) Bachelor’s degree 415 (10.0%) Graduate/professional degree 138 (3.3%)
Household Data 2000 Total households 2,498 (100.0%) Family households 2,020 (80.9%) Nonfamily households 478 (19.1%) Average household size 2.94 Average family size 3.29 Housing Occupancy 2000 Total units 2,670 (100.0%) Occupied units 2,498 (93.6%) Vacant units 172 (6.4%) Housing Tenure 2000 Total occupied units 2,498 (100.0%) Owner-occupied units 1,271 (50.9%) Renter-occupied units 1,227 (49.1%) Housing Value 2000 Median value, owner-occupied $175,000 Median monthly contract rent $648 New Housing Construction 1996-2007 (residential building permits authorized) 1996 13 units 2002 11 units 1997 8 units 2003 26 units 1998 8 units 2004 23 units 1999 12 units 2005 15 units 2000 11 units 2006 15 units 2001 15 units 2007 11 units Employment Status 2000 (population age 16 years and over) Population 16 years and over 5,037 (100.0%) In labor force 3,853 (76.5%) Civilian labor force 3,000 (59.6%) Employed 2,856 (56.7%) Unemployed 144 (2.9%) % of civilian labor force 4.8 Armed Forces 853 (16.9%) Not in labor force 1,184 (23.5%) Occupations 2000 (employed civilian workers age 16 years and over) Management, professional 767 (26.9%) Service 389 (13.6%) Sales and office 827 (29.0%) Farming, fishing, forestry 27 (0.9%) Construction, extraction, and maintenance 379 (13.3%) Production, transportation, and material moving 467 (16.4%)
Palmyra Borough
28
Palmyra Area: 2.39 square miles
School District(s): Palmyra Public Schools (K-12)
Population 1960 7,036 1970 6,969 1980 7,085 1990 7,056 2000 7,091 2007 (est.) 7,419 Population Density 2000: 2,966.9 persons/sq. mile Land Use 2005 (in acres) Residential 422 (27.2%) Commercial 93 (6.0%) Community services 13 (0.8%) Industrial 0 (0.0%) Transportation and utilities 230 (14.8%) Recreation 34 (2.2%) Military 0 (0.0%) Wooded 254 (16.4%) Mining 12 (0.8%) Agriculture and vacant 119 (7.6%) Water 376 (24.2%) Race and Hispanic Origin Characteristics 2000 White 5,743 (81.0%) Black or African American 1,017 (14.3%) Asian 99 (1.4%) All others 232 (3.3%) Hispanic origin (any race) 229 (3.2%) Sex Data 2000 Male 3,421 (48.2%) Female 3,670 (51.8%) Age Data 2000 Median age 38.0 Under 18 years 1,583 (22.3%) Age 18 to 64 4,548 (64.1%) 65 years and over 960 (13.5%) Income and Poverty Status 1999 Median household income $51,150 Median family income $57,192 Per capita income $23,454 Persons below poverty level 295 (4.2%) Educational Attainment 2000 (persons 25 yrs. and over) Less than 9th grade 160 (3.2%) 9th to 12th grade, no diploma 597 (11.8%) High school graduate 1,702 (33.6%) Some college, no degree 1,173 (23.1%) Associate degree 331 (6.5%) Bachelor’s degree 797 (15.7%) Graduate/professional degree 308 (6.1%)
Household Data 2000 Total households 3,004 (100.0%) Family households 1,852 (61.7%) Nonfamily households 1,152 (38.3%) Average household size 2.36 Average family size 3.02 Housing Occupancy 2000 Total units 3,219 (100.0%) Occupied units 3,004 (93.3%) Vacant units 215 (6.7%) Housing Tenure 2000 Total occupied units 3,004 (100.0%) Owner-occupied units 2,104 (70.0%) Renter-occupied units 900 (30.0%) Housing Value 2000 Median value, owner-occupied $110,500 Median monthly contract rent $818 New Housing Construction 1996-2007 (residential building permits authorized) 1996 1 units 2002 19 units 1997 55 units 2003 9 units 1998 59 units 2004 10 units 1999 71 units 2005 10 units 2000 123 units 2006 10 units 2001 88 units 2007 10 units Employment Status 2000 (population age 16 years and over) Population 16 years and over 5,661 (100.0%) In labor force 4,075 (72.0%) Civilian labor force 4,053 (71.6%) Employed 3,863 (68.2%) Unemployed 190 (3.4%) % of civilian labor force 4.7 Armed Forces 22 (0.4%) Not in labor force 1,586 (28.0%) Occupations 2000 (employed civilian workers age 16 years and over) Management, professional 1,258 (32.6%) Service 485 (12.6%) Sales and office 1,248 (32.3%) Farming, fishing, forestry 5 (0.1%) Construction, extraction, and maintenance 394 (10.2%) Production, transportation, and material moving 473 (12.2%)

Pemberton Borough
29
Pemberton Borough Area: 0.62 square miles
School District(s): Pemberton Township (K-12)
Population 1960 1,250 1970 1,344 1980 1,198 1990 1,367 2000 1,210 2007 (est.) 1,472 Population Density 2000: 1,951.6 persons/sq. mile Land Use 2005 (in acres) Residential 94 (23.6%) Commercial 26 (6.7%) Community services 24 (6.0%) Industrial 0 (0.0%) Transportation and utilities 42 (10.6%) Recreation 4 (1.1%) Military 0 (0.0%) Wooded 138 (34.9%) Mining 0 (0.0%) Agriculture and vacant 56 (14.1%) Water 12 (3.0%) Race and Hispanic Origin Characteristics 2000 White 949 (78.4%) Black or African American 154 (12.7%) Asian 29 (2.4%) All others 78 (6.4%) Hispanic origin (any race) 104 (8.6%) Sex Data 2000 Male 614 (50.7%) Female 596 (49.3%) Age Data 2000 Median age 33.9 Under 18 years 324 (26.8%) Age 18 to 64 778 (64.3%) 65 years and over 108 (8.9%) Income and Poverty Status 1999 Median household income $44,063 Median family income $48,500 Per capita income $18,909 Persons below poverty level 94 (7.8%) Educational Attainment 2000 (persons 25 yrs. and over) Less than 9th grade 32 (4.2%) 9th to 12th grade, no diploma 93 (12.1%) High school graduate 291 (37.9%) Some college, no degree 191 (24.9%) Associate degree 41 (5.3%) Bachelor’s degree 86 (11.2%) Graduate/professional degree 33 (4.3%)
Household Data 2000 Total households 470 (100.0%) Family households 317 (67.4%) Nonfamily households 153 (32.6%) Average household size 2.56 Average family size 3.06 Housing Occupancy 2000 Total units 513 (100.0%) Occupied units 470 (91.6%) Vacant units 43 (8.4%) Housing Tenure 2000 Total occupied units 470 (100.0%) Owner-occupied units 232 (49.4%) Renter-occupied units 238 (50.6%) Housing Value 2000 Median value, owner-occupied $113,300 Median monthly contract rent $641 New Housing Construction 1996-2007 (residential building permits authorized) 1996 0 units 2002 8 units 1997 0 units 2003 34 units 1998 10 units 2004 3 units 1999 2 units 2005 31 units 2000 2 units 2006 56 units 2001 6 units 2007 37 units Employment Status 2000 (population age 16 years and over) Population 16 years and over 933 (100.0%) In labor force 664 (71.2%) Civilian labor force 648 (69.5%) Employed 620 (66.5%) Unemployed 28 (3.0%) % of civilian labor force 4.3 Armed Forces 16 (1.7%) Not in labor force 269 (28.8%) Occupations 2000 (employed civilian workers age 16 years and over) Management, professional 146 (23.5%) Service 137 (22.1%) Sales and office 163 (26.3%) Farming, fishing, forestry 0 (0.0%) Construction, extraction, and maintenance 76 (12.3%) Production, transportation, and material moving 98 (15.8%)
Pemberton Township
30
Pemberton Twp. Area: 62.74 square miles
School District(s): Pemberton Township (K-12)
Population 1960 13,726 1970 19,754 1980 29,720 1990 31,342 2000 28,691 2007 (est.) 28,158 Population Density 2000: 457.3 persons/sq. mile Land Use 2005 (in acres) Residential 3,026 (7.5%) Commercial 218 (0.5%) Community services 260 (0.6%) Industrial 16 (0.0%) Transportation and utilities 1,282 (3.2%) Recreation 279 (0.7%) Military 186 (0.5%) Wooded 25,151 (62.7%) Mining 0 (0.0%) Agriculture and vacant 8,832 (22.0%) Water 876 (2.2%) Race and Hispanic Origin Characteristics 2000 White 18,946 (66.0%) Black or African American 6,632 (23.1%) Asian 913 (3.2%) All others 2,200 (7.7%) Hispanic origin (any race) 2,477 (8.6%) Sex Data 2000 Male 14,148 (49.3%) Female 14,543 (50.7%) Age Data 2000 Median age 34.4 Under 18 years 7,921 (27.6%) Age 18 to 64 17,977 (62.7%) 65 years and over 2,793 (9.7%) Income and Poverty Status 1999 Median household income $47,394 Median family income $52,860 Per capita income $19,238 Persons below poverty level 2,612 (9.3%) Educational Attainment 2000 (persons 25 yrs. and over) Less than 9th grade 806 (4.5%) 9th to 12th grade, no diploma 2,803 (15.5%) High school graduate 7,063 (39.1%) Some college, no degree 4,370 (24.2%) Associate degree 1,310 (7.3%) Bachelor’s degree 1,239 (6.9%) Graduate/professional degree 458 (2.5%)
Household Data 2000 Total households 10,050 (100.0%) Family households 7,484 (74.5%) Nonfamily households 2,566 (25.5%) Average household size 2.80 Average family size 3.22 Housing Occupancy 2000 Total units 10,778 (100.0%) Occupied units 10,050 (93.2%) Vacant units 728 (6.8%) Housing Tenure 2000 Total occupied units 10,050 (100.0%) Owner-occupied units 7,380 (73.4%) Renter-occupied units 2,670 (26.6%) Housing Value 2000 Median value, owner-occupied $98,300 Median monthly contract rent $670 New Housing Construction 1996-2007 (residential building permits authorized) 1996 65 units 2002 31 units 1997 152 units 2003 25 units 1998 61 units 2004 35 units 1999 50 units 2005 68 units 2000 8 units 2006 26 units 2001 29 units 2007 31 units Employment Status 2000 (population age 16 years and over) Population 16 years and over 21,778 (100.0%) In labor force 14,842 (68.2%) Civilian labor force 13,931 (64.0%) Employed 13,087 (60.1%) Unemployed 844 (3.9%) % of civilian labor force 6.1 Armed Forces 911 (4.2%) Not in labor force 6,936 (31.8%) Occupations 2000 (employed civilian workers age 16 years and over) Management, professional 2,806 (21.4%) Service 3,013 (23.0%) Sales and office 3,769 (28.8%) Farming, fishing, forestry 51 (0.4%) Construction, extraction, and maintenance 1,319 (10.1%) Production, transportation, and material moving 2,129 (16.3%)
Riverside Township
31
Riverside Twp. Area: 1.65 square miles
School District(s): Riverside Township (K-12)
Population 1960 8,474 1970 8,591 1980 7,941 1990 7,974 2000 7,911 2007 (est.) 7,765 Population Density 2000: 4,794.5 persons/sq. mile Land Use 2005 (in acres) Residential 409 (39.0%) Commercial 65 (6.2%) Community services 32 (3.1%) Industrial 38 (3.6%) Transportation and utilities 169 (16.1%) Recreation 39 (3.7%) Military 0 (0.0%) Wooded 60 (5.7%) Mining 0 (0.0%) Agriculture and vacant 150 (14.4%) Water 86 (8.2%) Race and Hispanic Origin Characteristics 2000 White 7,137 (90.2%) Black or African American 351 (4.4%) Asian 33 (0.4%) All others 390 (4.9%) Hispanic origin (any race) 325 (4.1%) Sex Data 2000 Male 3,936 (49.8%) Female 3,975 (50.2%) Age Data 2000 Median age 35.6 Under 18 years 1,980 (25.0%) Age 18 to 64 4,842 (61.2%) 65 years and over 1,089 (13.8%) Income and Poverty Status 1999 Median household income $43,358 Median family income $52,479 Per capita income $18,758 Persons below poverty level 642 (8.2%) Educational Attainment 2000 (persons 25 yrs. and over) Less than 9th grade 513 (9.8%) 9th to 12th grade, no diploma 765 (14.6%) High school graduate 2,130 (40.7%) Some college, no degree 1,008 (19.3%) Associate degree 214 (4.1%) Bachelor’s degree 446 (8.5%) Graduate/professional degree 158 (3.0%)
Household Data 2000 Total households 2,978 (100.0%) Family households 1,992 (66.9%) Nonfamily households 986 (33.1%) Average household size 2.64 Average family size 3.21 Housing Occupancy 2000 Total units 3,118 (100.0%) Occupied units 2,978 (95.5%) Vacant units 140 (4.5%) Housing Tenure 2000 Total occupied units 2,978 (100.0%) Owner-occupied units 2,016 (67.7%) Renter-occupied units 962 (32.3%) Housing Value 2000 Median value, owner-occupied $100,400 Median monthly contract rent $670 New Housing Construction 1996-2007 (residential building permits authorized) 1996 11 units 2002 16 units 1997 13 units 2003 16 units 1998 4 units 2004 16 units 1999 4 units 2005 15 units 2000 4 units 2006 11 units 2001 7 units 2007 3 units Employment Status 2000 (population age 16 years and over) Population 16 years and over 6,142 (100.0%) In labor force 4,217 (68.7%) Civilian labor force 4,199 (68.4%) Employed 4,035 (65.7%) Unemployed 164 (2.7%) % of civilian labor force 3.9 Armed Forces 18 (0.3%) Not in labor force 1,925 (31.3%) Occupations 2000 (employed civilian workers age 16 years and over) Management, professional 804 (19.9%) Service 570 (14.1%) Sales and office 1,240 (30.7%) Farming, fishing, forestry 14 (0.3%) Construction, extraction, and maintenance 651 (16.1%) Production, transportation, and material moving 756 (18.7%)
Riverton Borough
32
Riverton Area: 0.95 square miles
School District(s): Riverton Borough (K-8) Palmyra Public Schools (9-12)
Population 1960 3,324 1970 3,412 1980 3,068 1990 2,775 2000 2,759 2007 (est.) 2,652 Population Density 2000: 2,904.2 persons/sq. mile Land Use 2005 (in acres) Residential 239 (38.9%) Commercial 14 (2.2%) Community services 8 (1.2%) Industrial 3 (0.5%) Transportation and utilities 94 (15.3%) Recreation 26 (4.3%) Military 0 (0.0%) Wooded 18 (2.9%) Mining 0 (0.0%) Agriculture and vacant 24 (3.9%) Water 189 (30.8%) Race and Hispanic Origin Characteristics 2000 White 2,644 (95.8%) Black or African American 49 (1.8%) Asian 23 (0.8%) All others 43 (1.6%) Hispanic origin (any race) 30 (1.1%) Sex Data 2000 Male 1,309 (47.4%) Female 1,450 (52.6%) Age Data 2000 Median age 41.8 Under 18 years 601 (21.8%) Age 18 to 64 1,626 (58.9%) 65 years and over 532 (19.3%) Income and Poverty Status 1999 Median household income $58,977 Median family income $68,125 Per capita income $30,223 Persons below poverty level 82 (3.1%) Educational Attainment 2000 (persons 25 yrs. and over) Less than 9th grade 49 (2.4%) 9th to 12th grade, no diploma 158 (7.8%) High school graduate 523 (25.7%) Some college, no degree 440 (21.6%) Associate degree 128 (6.3%) Bachelor’s degree 482 (23.7%) Graduate/professional degree 256 (12.6%)
Household Data 2000 Total households 1,066 (100.0%) Family households 746 (70.0%) Nonfamily households 320 (30.0%) Average household size 2.48 Average family size 3.00 Housing Occupancy 2000 Total units 1,113 (100.0%) Occupied units 1,066 (95.8%) Vacant units 47 (4.2%) Housing Tenure 2000 Total occupied units 1,066 (100.0%) Owner-occupied units 813 (76.3%) Renter-occupied units 253 (23.7%) Housing Value 2000 Median value, owner-occupied $153,600 Median monthly contract rent $695 New Housing Construction 1996-2007 (residential building permits authorized) 1996 4 units 2002 0 units 1997 0 units 2003 1 units 1998 0 units 2004 2 units 1999 0 units 2005 1 units 2000 1 units 2006 6 units 2001 0 units 2007 7 units Employment Status 2000 (population age 16 years and over) Population 16 years and over 2,247 (100.0%) In labor force 1,386 (61.7%) Civilian labor force 1,382 (61.5%) Employed 1,352 (60.2%) Unemployed 30 (1.3%) % of civilian labor force 2.2 Armed Forces 4 (0.2%) Not in labor force 861 (38.3%) Occupations 2000 (employed civilian workers age 16 years and over) Management, professional 642 (47.5%) Service 84 (6.2%) Sales and office 381 (28.2%) Farming, fishing, forestry 0 (0.0%) Construction, extraction, and maintenance 110 (8.1%) Production, transportation, and material moving 135 (10.0%)

Shamong Township
33
Shamong Twp. Area: 45.17 square miles
School District(s): Shamong Township (K-8) Lenape Regional High School (9-12)
Population 1960 774 1970 1,318 1980 4,537 1990 5,765 2000 6,462 2007 (est.) 6,738 Population Density 2000: 143.1 persons/sq. mile Land Use 2005 (in acres) Residential 1,768 (6.1%) Commercial 135 (0.5%) Community services 30 (0.1%) Industrial 0 (0.0%) Transportation and utilities 636 (2.2%) Recreation 119 (0.4%) Military 0 (0.0%) Wooded 21,823 (75.6%) Mining 0 (0.0%) Agriculture and vacant 3,979 (13.8%) Water 373 (1.3%) Race and Hispanic Origin Characteristics 2000 White 6,284 (97.2%) Black or African American 53 (0.8%) Asian 43 (0.7%) All others 82 (1.3%) Hispanic origin (any race) 68 (1.1%) Sex Data 2000 Male 3,239 (50.1%) Female 3,223 (49.9%) Age Data 2000 Median age 37.3 Under 18 years 1,898 (29.4%) Age 18 to 64 4,178 (64.7%) 65 years and over 386 (6.0%) Income and Poverty Status 1999 Median household income $77,457 Median family income $82,534 Per capita income $30,934 Persons below poverty level 168 (2.6%) Educational Attainment 2000 (persons 25 yrs. and over) Less than 9th grade 57 (1.4%) 9th to 12th grade, no diploma 262 (6.3%) High school graduate 1,206 (29.2%) Some college, no degree 854 (20.7%) Associate degree 220 (5.3%) Bachelor’s degree 1,085 (26.2%) Graduate/professional degree 450 (10.9%)
Household Data 2000 Total households 2,132 (100.0%) Family households 1,821 (85.4%) Nonfamily households 311 (14.6%) Average household size 3.03 Average family size 3.29 Housing Occupancy 2000 Total units 2,175 (100.0%) Occupied units 2,132 (98.0%) Vacant units 43 (2.0%) Housing Tenure 2000 Total occupied units 2,132 (100.0%) Owner-occupied units 2,030 (95.2%) Renter-occupied units 102 (4.8%) Housing Value 2000 Median value, owner-occupied $191,900 Median monthly contract rent $764 New Housing Construction 1996-2007 (residential building permits authorized) 1996 32 units 2002 31 units 1997 33 units 2003 28 units 1998 27 units 2004 26 units 1999 22 units 2005 21 units 2000 14 units 2006 15 units 2001 30 units 2007 13 units Employment Status 2000 (population age 16 years and over) Population 16 years and over 4,843 (100.0%) In labor force 3,600 (74.3%) Civilian labor force 3,586 (74.0%) Employed 3,489 (72.0%) Unemployed 97 (2.3%) % of civilian labor force 2.7 Armed Forces 14 (0.3%) Not in labor force 1,243 (25.7%) Occupations 2000 (employed civilian workers age 16 years and over) Management, professional 1,470 (42.1%) Service 448 (12.8%) Sales and office 1,014 (29.1%) Farming, fishing, forestry 5 (0.1%) Construction, extraction, and maintenance 296 (8.5%) Production, transportation, and material moving 256 (7.3%)
Southampton Township
34
Southampton Twp. Area: 43.81 square miles
School District(s): Southampton Township (K-8) Lenape Regional High School (9-12)
Population 1960 3,166 1970 4,982 1980 8,808 1990 10,202 2000 10,388 2007 (est.) 10,885 Population Density 2000: 237.1 persons/sq. mile Land Use 2005 (in acres) Residential 2,205 (7.9%) Commercial 300 (1.1%) Community services 44 (0.2%) Industrial 78 (0.3%) Transportation and utilities 1,066 (3.8%) Recreation 69 (0.2%) Military 0 (0.0%) Wooded 13,113 (46.8%) Mining 0 (0.0%) Agriculture and vacant 10,786 (38.5%) Water 349 (1.2%) Race and Hispanic Origin Characteristics 2000 White 10,086 (97.1%) Black or African American 125 (1.2%) Asian 65 (0.6%) All others 112 (1.1%) Hispanic origin (any race) 134 (1.3%) Sex Data 2000 Male 4,856 (46.7%) Female 5,532 (53.3%) Age Data 2000 Median age 49.7 Under 18 years 1,854 (17.8%) Age 18 to 64 5,239 (50.4%) 65 years and over 3,295 (31.7%) Income and Poverty Status 1999 Median household income $44,419 Median family income $57,419 Per capita income $26,977 Persons below poverty level 399 (3.9%) Educational Attainment 2000 (persons 25 yrs. and over) Less than 9th grade 309 (3.9%) 9th to 12th grade, no diploma 984 (12.4%) High school graduate 3,400 (42.8%) Some college, no degree 1,382 (17.4%) Associate degree 441 (5.5%) Bachelor’s degree 950 (11.9%) Graduate/professional degree 485 (6.1%)
Household Data 2000 Total households 4,574 (100.0%) Family households 3,047 (66.6%) Nonfamily households 1,527 (33.4%) Average household size 2.26 Average family size 2.79 Housing Occupancy 2000 Total units 4,751 (100.0%) Occupied units 4,574 (96.3%) Vacant units 177 (3.7%) Housing Tenure 2000 Total occupied units 4,574 (100.0%) Owner-occupied units 4,258 (93.1%) Renter-occupied units 316 (6.9%) Housing Value 2000 Median value, owner-occupied $113,200 Median monthly contract rent $724 New Housing Construction 1996-2007 (residential building permits authorized) 1996 25 units 2002 71 units 1997 43 units 2003 21 units 1998 41 units 2004 18 units 1999 58 units 2005 88 units 2000 67 units 2006 68 units 2001 55 units 2007 29 units Employment Status 2000 (population age 16 years and over) Population 16 years and over 8,724 (100.0%) In labor force 4,568 (52.4%) Civilian labor force 4,546 (52.1%) Employed 4,321 (49.5%) Unemployed 225 (2.6%) % of civilian labor force 4.9 Armed Forces 22 (0.3%) Not in labor force 4,156 (47.6%) Occupations 2000 (employed civilian workers age 16 years and over) Management, professional 1,382 (32.0%) Service 616 (14.3%) Sales and office 1,187 (27.5%) Farming, fishing, forestry 14 (0.3%) Construction, extraction, and maintenance 494 (11.4%) Production, transportation, and material moving 628 (14.5%)

Springfield Township
35
Springfield Twp. Area: 29.57 square miles
School District(s): Springfield Township (K-6) Northern Burlington Co. Regional (9-12)
Population 1960 1,956 1970 2,244 1980 2,691 1990 3,028 2000 3,227 2007 (est.) 3,492 Population Density 2000: 109.1 persons/sq. mile Land Use 2005 (in acres) Residential 1,013 (5.4%) Commercial 208 (1.1%) Community services 19 (0.1%) Industrial 20 (0.1%) Transportation and utilities 685 (3.6%) Recreation 139 (0.7%) Military 47 (0.2%) Wooded 4,481 (23.7%) Mining 0 (0.0%) Agriculture and vacant 12,226 (64.7%) Water 50 (0.3%) Race and Hispanic Origin Characteristics 2000 White 2,967 (91.9%) Black or African American 104 (3.2%) Asian 85 (2.6%) All others 71 (2.2%) Hispanic origin (any race) 57 (1.8%) Sex Data 2000 Male 1,614 (50.0%) Female 1,613 (50.0%) Age Data 2000 Median age 39.3 Under 18 years 833 (25.8%) Age 18 to 64 2,048 (63.5%) 65 years and over 346 (10.7%) Income and Poverty Status 1999 Median household income $69,268 Median family income $72,292 Per capita income $29,322 Persons below poverty level 116 (3.6%) Educational Attainment 2000 (persons 25 yrs. and over) Less than 9th grade 76 (3.4%) 9th to 12th grade, no diploma 205 (9.3%) High school graduate 729 (33.0%) Some college, no degree 421 (19.1%) Associate degree 192 (8.7%) Bachelor’s degree 401 (18.2%) Graduate/professional degree 182 (8.3%)
Household Data 2000 Total households 1,098 (100.0%) Family households 907 (82.6%) Nonfamily households 191 (17.4%) Average household size 2.93 Average family size 3.22 Housing Occupancy 2000 Total units 1,138 (100.0%) Occupied units 1,098 (96.5%) Vacant units 40 (3.5%) Housing Tenure 2000 Total occupied units 1,098 (100.0%) Owner-occupied units 1,000 (91.1%) Renter-occupied units 98 (8.9%) Housing Value 2000 Median value, owner-occupied $185,400 Median monthly contract rent $541 New Housing Construction 1996-2007 (residential building permits authorized) 1996 14 units 2002 28 units 1997 13 units 2003 12 units 1998 42 units 2004 13 units 1999 35 units 2005 15 units 2000 33 units 2006 5 units 2001 28 units 2007 2 units Employment Status 2000 (population age 16 years and over) Population 16 years and over 2,495 (100.0%) In labor force 1,718 (68.9%) Civilian labor force 1,710 (68.5%) Employed 1,645 (65.9%) Unemployed 65 (2.6%) % of civilian labor force 3.8 Armed Forces 8 (0.3%) Not in labor force 777 (31.1%) Occupations 2000 (employed civilian workers age 16 years and over) Management, professional 600 (36.5%) Service 180 (10.9%) Sales and office 530 (32.2%) Farming, fishing, forestry 15 (0.9%) Construction, extraction, and maintenance 153 (9.3%) Production, transportation, and material moving 167 (10.2%)

Tabernacle Township
36
Tabernacle Twp. Area: 49.55 square miles
School District(s): Tabernacle Township (K-8) Lenape Regional High School (9-12)
Population 1960 1,621 1970 2,103 1980 6,236 1990 7,360 2000 7,170 2007 (est.) 7,182 Population Density 2000: 144.7 persons/sq. mile Land Use 2005 (in acres) Residential 2,363 (7.4%) Commercial 158 (0.5%) Community services 49 (0.2%) Industrial 0 (0.0%) Transportation and utilities 847 (2.7%) Recreation 162 (0.5%) Military 0 (0.0%) Wooded 23,058 (72.6%) Mining 68 (0.2%) Agriculture and vacant 4,685 (14.8%) Water 350 (1.1%) Race and Hispanic Origin Characteristics 2000 White 6,904 (96.3%) Black or African American 150 (2.1%) Asian 52 (0.7%) All others 64 (0.9%) Hispanic origin (any race) 106 (1.5%) Sex Data 2000 Male 3,632 (50.7%) Female 3,538 (49.3%) Age Data 2000 Median age 38.1 Under 18 years 2,004 (27.9%) Age 18 to 64 4,664 (65.0%) 65 years and over 502 (7.0%) Income and Poverty Status 1999 Median household income $76,432 Median family income $86,729 Per capita income $27,874 Persons below poverty level 144 (2.0%) Educational Attainment 2000 (persons 25 yrs. and over) Less than 9th grade 79 (1.7%) 9th to 12th grade, no diploma 262 (5.6%) High school graduate 1,481 (31.8%) Some college, no degree 1,099 (23.6%) Associate degree 309 (6.6%) Bachelor’s degree 956 (20.6%) Graduate/professional degree 465 (10.0%)
Household Data 2000 Total households 2,346 (100.0%) Family households 2,011 (85.7%) Nonfamily households 335 (14.3%) Average household size 3.03 Average family size 3.28 Housing Occupancy 2000 Total units 2,385 (100.0%) Occupied units 2,346 (98.4%) Vacant units 39 (1.6%) Housing Tenure 2000 Total occupied units 2,346 (100.0%) Owner-occupied units 2,233 (95.2%) Renter-occupied units 113 (4.8%) Housing Value 2000 Median value, owner-occupied $171,700 Median monthly contract rent $761 New Housing Construction 1996-2007 (residential building permits authorized) 1996 23 units 2002 9 units 1997 13 units 2003 11 units 1998 14 units 2004 15 units 1999 12 units 2005 15 units 2000 9 units 2006 11 units 2001 16 units 2007 14 units Employment Status 2000 (population age 16 years and over) Population 16 years and over 5,426 (100.0%) In labor force 4,006 (73.8%) Civilian labor force 3,994 (73.6%) Employed 3,913 (72.1%) Unemployed 81 (1.5%) % of civilian labor force 2.0 Armed Forces 12 (0.2%) Not in labor force 1,420 (26.2%) Occupations 2000 (employed civilian workers age 16 years and over) Management, professional 1,630 (41.7%) Service 357 (9.1%) Sales and office 1,147 (29.3%) Farming, fishing, forestry 12 (0.3%) Construction, extraction, and maintenance 398 (10.2%) Production, transportation, and material moving 369 (9.4%)

Washington Township
37
Washington Twp. Area: 103.81 square miles
School District(s): Washington Township (K-8) Greater Egg Harbor Regional High School (9-12)
Population 1960 541 1970 673 1980 808 1990 805 2000 621 2007 (est.) 643 Population Density 2000: 6.0 persons/sq. mile Land Use 2005 (in acres) Residential 336 (0.5%) Commercial 49 (0.1%) Community services 7 (0.0%) Industrial 0 (0.0%) Transportation and utilities 117 (0.2%) Recreation 82 (0.1%) Military 0 (0.0%) Wooded 56,945 (86.2%) Mining 0 (0.0%) Agriculture and vacant 6,375 (9.7%) Water 2,124 (3.2%) Race and Hispanic Origin Characteristics 2000 White 519 (83.6%) Black or African American 18 (2.9%) Asian 2 (0.3%) All others 82 (13.2%) Hispanic origin (any race) 106 (17.1%) Sex Data 2000 Male 298 (48.0%) Female 323 (52.0%) Age Data 2000 Median age 40.8 Under 18 years 182 (29.3%) Age 18 to 64 288 (46.4%) 65 years and over 151 (24.3%) Income and Poverty Status 1999 Median household income $41,250 Median family income $42,188 Per capita income $13,977 Persons below poverty level 68 (16.0%) Educational Attainment 2000 (persons 25 yrs. and over) Less than 9th grade 81 (21.1%) 9th to 12th grade, no diploma 89 (23.2%) High school graduate 130 (33.9%) Some college, no degree 32 (8.3%) Associate degree 5 (1.3%) Bachelor’s degree 36 (9.4%) Graduate/professional degree 11 (2.9%)
Household Data 2000 Total households 160 (100.0%) Family households 113 (70.6%) Nonfamily households 47 (29.4%) Average household size 2.76 Average family size 3.27 Housing Occupancy 2000 Total units 171 (100.0%) Occupied units 160 (93.6%) Vacant units 11 (6.4%) Housing Tenure 2000 Total occupied units 160 (100.0%) Owner-occupied units 122 (76.3%) Renter-occupied units 38 (23.8%) Housing Value 2000 Median value, owner-occupied $95,000 Median monthly contract rent $500 New Housing Construction 1996-2007 (residential building permits authorized) 1996 0 units 2002 1 units 1997 1 units 2003 2 units 1998 4 units 2004 3 units 1999 4 units 2005 4 units 2000 2 units 2006 2 units 2001 2 units 2007 3 units Employment Status 2000 (population age 16 years and over) Population 16 years and over 399 (100.0%) In labor force 174 (43.6%) Civilian labor force 174 (43.6%) Employed 169 (42.4%) Unemployed 5 (1.3%) % of civilian labor force 2.9 Armed Forces 0 (0.0%) Not in labor force 225 (56.4%) Occupations 2000 (employed civilian workers age 16 years and over) Management, professional 34 (20.1%) Service 26 (15.4%) Sales and office 27 (16.0%) Farming, fishing, forestry 30 (17.8%) Construction, extraction, and maintenance 9 (5.3%) Production, transportation, and material moving 43 (25.4%)
Westampton Township
38
Westampton Twp. Area: 11.12 square miles
School District(s): Westampton Township (K-8) Rancocas Valley Regional High School (9-12)
Population 1960 1,114 1970 2,680 1980 3,383 1990 6,004 2000 7,217 2007 (est.) 8,618 Population Density 2000: 649.0 persons/sq. mile Land Use 2005 (in acres) Residential 900 (12.7%) Commercial 168 (2.4%) Community services 153 (2.1%) Industrial 130 (1.8%) Transportation and utilities 802 (11.3%) Recreation 349 (4.9%) Military 0 (0.0%) Wooded 1,867 (26.3%) Mining 0 (0.0%) Agriculture and vacant 2,656 (37.3%) Water 86 (1.2%) Race and Hispanic Origin Characteristics 2000 White 5,110 (70.8%) Black or African American 1,535 (21.3%) Asian 219 (3.0%) All others 353 (4.9%) Hispanic origin (any race) 448 (6.2%) Sex Data 2000 Male 3,418 (47.4%) Female 3,799 (52.6%) Age Data 2000 Median age 35.8 Under 18 years 2,113 (29.3%) Age 18 to 64 4,445 (61.6%) 65 years and over 659 (9.1%) Income and Poverty Status 1999 Median household income $63,973 Median family income $69,656 Per capita income $26,594 Persons below poverty level 180 (2.5%) Educational Attainment 2000 (persons 25 yrs. and over) Less than 9th grade 94 (2.0%) 9th to 12th grade, no diploma 336 (7.1%) High school graduate 1,309 (27.7%) Some college, no degree 1,260 (26.6%) Associate degree 493 (10.4%) Bachelor’s degree 909 (19.2%) Graduate/professional degree 328 (6.9%)
Household Data 2000 Total households 2,525 (100.0%) Family households 1,966 (77.9%) Nonfamily households 559 (22.1%) Average household size 2.83 Average family size 3.24 Housing Occupancy 2000 Total units 2,581 (100.0%) Occupied units 2,525 (97.8%) Vacant units 56 (2.2%) Housing Tenure 2000 Total occupied units 2,525 (100.0%) Owner-occupied units 2,350 (93.1%) Renter-occupied units 175 (6.9%) Housing Value 2000 Median value, owner-occupied $127,300 Median monthly contract rent $1,112 New Housing Construction 1996-2007 (residential building permits authorized) 1996 105 units 2002 154 units 1997 82 units 2003 156 units 1998 51 units 2004 102 units 1999 72 units 2005 66 units 2000 30 units 2006 25 units 2001 81 units 2007 31 units Employment Status 2000 (population age 16 years and over) Population 16 years and over 5,355 (100.0%) In labor force 3,813 (71.2%) Civilian labor force 3,724 (69.5%) Employed 3,604 (67.3%) Unemployed 120 (2.2%) % of civilian labor force 3.2 Armed Forces 89 (1.7%) Not in labor force 1,542 (28.8%) Occupations 2000 (employed civilian workers age 16 years and over) Management, professional 1,301 (36.1%) Service 521 (14.5%) Sales and office 1,208 (33.5%) Farming, fishing, forestry 0 (0.0%) Construction, extraction, and maintenance 170 (4.7%) Production, transportation, and material moving 404 (11.2%)

Willingboro Township
39
Willingboro Twp. Area: 8.14 square miles
School District(s): Willingboro Township (K-12)
Population 1960 11,861 1970 43,386 1980 39,912 1990 36,291 2000 33,008 2007 (est.) 36,865 Population Density 2000: 4,055.0 persons/sq. mile Land Use 2005 (in acres) Residential 2,288 (44.0%) Commercial 112 (2.2%) Community services 169 (3.3%) Industrial 37 (0.7%) Transportation and utilities 1,059 (20.3%) Recreation 387 (7.4%) Military 0 (0.0%) Wooded 571 (11.0%) Mining 0 (0.0%) Agriculture and vacant 299 (5.7%) Water 281 (5.4%) Race and Hispanic Origin Characteristics 2000 White 8,144 (24.7%) Black or African American 22,021 (66.7%) Asian 562 (1.7%) All others 2,281 (6.9%) Hispanic origin (any race) 1,998 (6.1%) Sex Data 2000 Male 15,633 (47.4%) Female 17,375 (52.6%) Age Data 2000 Median age 37.9 Under 18 years 9,069 (27.5%) Age 18 to 64 19,693 (59.7%) 65 years and over 4,246 (12.9%) Income and Poverty Status 1999 Median household income $60,869 Median family income $64,337 Per capita income $21,799 Persons below poverty level 1,934 (5.9%) Educational Attainment 2000 (persons 25 yrs. and over) Less than 9th grade 568 (2.7%) 9th to 12th grade, no diploma 2,169 (10.1%) High school graduate 7,218 (33.7%) Some college, no degree 5,830 (27.2%) Associate degree 1,602 (7.5%) Bachelor’s degree 2,770 (12.9%) Graduate/professional degree 1,274 (5.9%)
Household Data 2000 Total households 10,713 (100.0%) Family households 8,780 (82.0%) Nonfamily households 1,933 (18.1%) Average household size 3.07 Average family size 3.36 Housing Occupancy 2000 Total units 11,124 (100.0%) Occupied units 10,713 (96.3%) Vacant units 411 (3.7%) Housing Tenure 2000 Total occupied units 10,713 (100.0%) Owner-occupied units 9,912 (92.5%) Renter-occupied units 801 (7.5%) Housing Value 2000 Median value, owner-occupied $96,700 Median monthly contract rent $1,100 New Housing Construction 1996-2007 (residential building permits authorized) 1996 2 units 2002 1 units 1997 2 units 2003 4 units 1998 4 units 2004 74 units 1999 2 units 2005 71 units 2000 1 units 2006 1,657 units 2001 3 units 2007 1 units Employment Status 2000 (population age 16 years and over) Population 16 years and over 25,072 (100.0%) In labor force 16,218 (64.7%) Civilian labor force 16,077 (64.1%) Employed 14,958 (59.7%) Unemployed 1,119 (4.5%) % of civilian labor force 7.0 Armed Forces 141 (0.6%) Not in labor force 8,854 (35.3%) Occupations 2000 (employed civilian workers age 16 years and over) Management, professional 4,869 (32.6%) Service 2,348 (15.7%) Sales and office 4,574 (30.6%) Farming, fishing, forestry 31 (0.2%) Construction, extraction, and maintenance 929 (6.2%) Production, transportation, and material moving 2,207 (14.8%)

Woodland Township
40
Woodland Twp. Area: 95.59 square miles
School District(s): Woodland Township (K-8) Lenape Regional High School (9-12)
Population 1960 1,904 1970 2,032 1980 2,285 1990 2,063 2000 1,170 2007 (est.) 1,344 Population Density 2000: 12.2 persons/sq. mile Land Use 2005 (in acres) Residential 491 (0.8%) Commercial 58 (0.1%) Community services 112 (0.2%) Industrial 0 (0.0%) Transportation and utilities 213 (0.3%) Recreation 33 (0.1%) Military 262 (0.4%) Wooded 54,155 (88.6%) Mining 452 (0.7%) Agriculture and vacant 4,171 (6.8%) Water 1,195 (2.0%) Race and Hispanic Origin Characteristics 2000 White 1,147 (98.0%) Black or African American 7 (0.6%) Asian 4 (0.3%) All others 12 (1.0%) Hispanic origin (any race) 14 (1.2%) Sex Data 2000 Male 582 (49.7%) Female 588 (50.3%) Age Data 2000 Median age 38.4 Under 18 years 302 (25.8%) Age 18 to 64 778 (66.5%) 65 years and over 90 (7.7%) Income and Poverty Status 1999 Median household income $59,271 Median family income $65,972 Per capita income $26,126 Persons below poverty level 33 (2.9%) Educational Attainment 2000 (persons 25 yrs. and over) Less than 9th grade 35 (4.5%) 9th to 12th grade, no diploma 98 (12.5%) High school graduate 300 (38.4%) Some college, no degree 178 (22.8%) Associate degree 26 (3.3%) Bachelor’s degree 96 (12.3%) Graduate/professional degree 48 (6.1%)
Household Data 2000 Total households 425 (100.0%) Family households 323 (76.0%) Nonfamily households 102 (24.1%) Average household size 2.75 Average family size 3.15 Housing Occupancy 2000 Total units 448 (100.0%) Occupied units 425 (94.9%) Vacant units 23 (5.1%) Housing Tenure 2000 Total occupied units 448 (100.0%) Owner-occupied units 425 (94.9%) Renter-occupied units 23 (5.1%) Housing Value 2000 Median value, owner-occupied $129,300 Median monthly contract rent $579 New Housing Construction 1996-2007 (residential building permits authorized) 1996 2 units 2002 6 units 1997 5 units 2003 4 units 1998 8 units 2004 5 units 1999 8 units 2005 7 units 2000 8 units 2006 5 units 2001 6 units 2007 8 units Employment Status 2000 (population age 16 years and over) Population 16 years and over 915 (100.0%) In labor force 670 (73.2%) Civilian labor force 662 (72.3%) Employed 638 (69.7%) Unemployed 24 (2.6%) % of civilian labor force 3.6 Armed Forces 8 (0.9%) Not in labor force 245 (26.8%) Occupations 2000 (employed civilian workers age 16 years and over) Management, professional 181 (28.4%) Service 91 (14.3%) Sales and office 147 (23.0%) Farming, fishing, forestry 8 (1.3%) Construction, extraction, and maintenance 118 (18.5%) Production, transportation, and material moving 93 (14.6%)

Wrightstown Borough
41
Wrightstown Area: 1.82 square miles
School District(s): New Hanover Township (K-8) Bordentown Regional High School (9-12)
Population 1960 4,846 1970 2,719 1980 3,031 1990 3,843 2000 748 2007 (est.) 733 Population Density 2000: 411.0 persons/sq. mile Land Use 2005 (in acres) Residential 41 (3.3%) Commercial 38 (3.0%) Community services 3 (0.2%) Industrial 7 (0.5%) Transportation and utilities 59 (4.7%) Recreation 40 (3.2%) Military 329 (26.4%) Wooded 543 (43.5%) Mining 0 (0.0%) Agriculture and vacant 190 (15.2%) Water 0 (0.0%) Race and Hispanic Origin Characteristics 2000 White 373 (49.9%) Black or African American 226 (30.2%) Asian 54 (7.2%) All others 95 (12.7%) Hispanic origin (any race) 84 (11.2%) Sex Data 2000 Male 364 (48.7%) Female 384 (51.3%) Age Data 2000 Median age 31.2 Under 18 years 222 (29.7%) Age 18 to 64 462 (61.8%) 65 years and over 64 (8.6%) Income and Poverty Status 1999 Median household income $27,500 Median family income $29,375 Per capita income $14,489 Persons below poverty level 179 (24.0%) Educational Attainment 2000 (persons 25 yrs. and over) Less than 9th grade 35 (4.5%) 9th to 12th grade, no diploma 98 (12.5%) High school graduate 300 (38.4%) Some college, no degree 178 (22.8%) Associate degree 26 (3.3%) Bachelor’s degree 96 (12.3%) Graduate/professional degree 48 (6.1%)
Household Data 2000 Total households 312 (100.0%) Family households 182 (58.3%) Nonfamily households 130 (41.7%) Average household size 2.37 Average family size 3.09 Housing Occupancy 2000 Total units 339 (100.0%) Occupied units 312 (92.0%) Vacant units 27 (8.0%) Housing Tenure 2000 Total occupied units 312 (100.0%) Owner-occupied units 78 (25.0%) Renter-occupied units 234 (75.0%) Housing Value 2000 Median value, owner-occupied $98,900 Median monthly contract rent $623 New Housing Construction 1996-2007 (residential building permits authorized) 1996 0 units 2002 0 units 1997 0 units 2003 0 units 1998 0 units 2004 1 units 1999 0 units 2005 1 units 2000 0 units 2006 5 units 2001 0 units 2007 5 units Employment Status 2000 (population age 16 years and over) Population 16 years and over 544 (100.0%) In labor force 386 (71.0%) Civilian labor force 364 (66.9%) Employed 339 (62.3%) Unemployed 25 (4.6%) % of civilian labor force 6.9 Armed Forces 22 (4.0%) Not in labor force 158 (29.0%) Occupations 2000 (employed civilian workers age 16 years and over) Management, professional 46 (13.6%) Service 117 (34.5%) Sales and office 94 (27.7%) Farming, fishing, forestry 0 (0.0%) Construction, extraction, and maintenance 21 (6.2%) Production, transportation, and material moving 61 (18.0%)