BURKENROAD REPORTS Investment Conference - … · 2014-04-28 · BURKENROAD REPORTS Investment...
27
NYSE:EGY BURKENROAD REPORTS Investment Conference April 25, 2014 New Orleans, LA
-
Upload
nguyendang -
Category
Documents
-
view
215 -
download
0
Transcript of BURKENROAD REPORTS Investment Conference - … · 2014-04-28 · BURKENROAD REPORTS Investment...

NYSE:EGY
BURKENROAD REPORTS Investment Conference
April 25, 2014
New Orleans, LA

2
This presentation includes "forward-looking statements" within the meaning of Section 27A of the Securities Act of 1933, as amended, and Section 21E of the
Securities Exchange Act of 1934, as amended. All statements included in this presentation that address activities, events or developments that VAALCO
expects, believes or anticipates will or may occur in the future are forward-looking statements. These statements include expected capital expenditures, future
drilling plans, objectives and operations, prospect evaluations, negotiations and relations with governments and third parties, reserve growth, estimated
revenues and losses, and projected costs, timing and amount of future production. These statements are based on assumptions made by VAALCO based on its
experience perception of historical trends, current conditions, expected future developments and other factors it believes are appropriate in the circumstances.
Such statements are subject to a number of assumptions, risks and uncertainties, many of which are beyond VAALCO's control. These risks include, but are not
limited to, inflation, general economic conditions, oil and gas price volatility, the VAALCO's success in discovering, developing and producing reserves, lack of
availability drilling equipment and services, availability of and capital, environmental risks, drilling risks, foreign operational risks, regulatory changes, the
uncertainty inherent in estimating reserves and in projecting future rates of production, cash flow and access to capital, the timing of development expenditures,
and other risks. Additional information on risks and uncertainties that could affect our business prospects and performance are provided in the most recent
reports of VAALCO filed with the Securities and Exchange Commission. These forward-looking statements are based on VAALCO’s current expectations and
assumptions about future events and are based on currently available information as to the outcome and timing of future events. VAALCO cautions you that
forward-looking statements are not guarantees of future performance and that actual results or developments may differ materially from those projected in the
forward-looking statements. VAALCO disclaims any intention or obligation to update or revise any forward-looking statements, whether as a result of new
information, future events, or otherwise.
The SEC requires oil and gas companies, in their filings with the SEC, to disclose proved reserves that a company has demonstrated by actual production or
conclusive formation tests to be economically and legally producible under existing economic and operating conditions. VAALCO uses the terms “estimated
ultimate recovery,” “EUR,” “probable,” “3P,” “possible,” and “non-proven” reserves, reserve “potential” or “upside,” “unrisked potential” or other descriptions of
volumes of reserves potentially recoverable through additional drilling or recovery techniques that are not classified as proved reserves, may not have been
calculated as defined by SEC regulations and that the SEC’s guidelines may prohibit us from including in any future filings with the SEC. These estimates are by
their nature more speculative than estimates of proved reserves and accordingly are subject to substantially greater risk of being actually realized by the
company. VAALCO believes these estimates are reasonable, but such estimates have not been reviewed by independent engineers. Estimates may change
significantly as development provides additional data, and actual quantities that are ultimately recovered may differ substantially from prior estimates. Production
forecasts are dependent upon many assumptions, including estimates of production decline rates from existing wells and the outcome of future drilling activity.
Although VAALCO believes the forecasts are reasonable, VAALCO can give no assurance they will prove to have been correct. They can be affected by
inaccurate assumptions and data or by known or unknown risks and uncertainties.
Market and industry data and forecasts used in this presentation have been obtained from independent industry sources as well as from research reports
prepared for other purposes. Although VAALCO believes these third-party sources to be reliable, VAALCO has not independently verified the data obtained from
these sources and VAALCO cannot assure you of the accuracy or completeness of the data. Forecasts and other forward-looking information obtained from
these sources are subject to the same qualifications and uncertainties as the other forward looking statements in this presentation.
Inquiries:
VAALCO Energy, Inc.
Attn: Gregory R. Hullinger
4600 Post Oak Place, Suite 300
Houston, TX 77027
Ph: 713-623-0801
www.vaalco.com
Safe Harbor Statement

Near field
Development
Current West Africa
Exploration Program
Discovered Resource
Acquisition
Strong Cash Flow
3
Poised for Growth
Strong high margin base business Near term low risk growth opportunities Balanced long term growth strategy
West Africa Focus
4
Block 5 Working Interest 40.0%
1,400,000 gross acres 560,000 net acres
Offshore Exploration
Mutamba Iroru Permit Working Interest 41.0%
270,000 gross acres 111,000 net acres
Onshore Exploration & Development
Etame Marin Permit
Working Interest 28.1% 760,000 gross acres 213,000 net acres
Offshore Production and Exploration
Block P Working Interest 31.0%
57,000 gross acres 18,000 net acres
Offshore Exploration & Development
GABON Port Gentil
Libreville
Luanda
ANGOLA
EQUATORIAL GUINEA
Bata

Company Profile
5
Key Metrics
Share Price(1) $9.07
52-Week Range(1) $5.03 - $9.11
Market Capitalization(1) $516 million
Cash Balance(2) $144 million
Revolving Debt Facility (Undrawn) (1) $ 65 million
Net Production 4,400 BOPD
Reserves (2P)(2) 11 MMBOE
% Oil (Brent Based Pricing) 98%
% Operated 100%
Employees(2)
Corporate International
111 42 69 (1) As of 4/21/2014
(2) As of 12/31/2013

Efficient Reserve Development - Etame Marin Permit
6
Cost Metrics (2002-2013)
Development Costs $14 /BBL
Exploration Costs $ 3 /BBL
DD&A $ 9 /BBL
0
5,000
10,000
15,000
20,000
25,000
2002 2003 2004 2005 2006 2007 2008 2009 2010 2011 2012 2013
Gross Production (BOPD) Etame Original Forecast Etame Base Actual Etame Additional Actual Avouma Ebouri
Exploitation and Development skills
Repeatable performance
Next development underway
Growth in EUR
0.0
20.0
40.0
60.0
80.0
100.0
120.0
2002 2003 2004 2005 2006 2007 2008 2009 2010 2011 2012 2013
1P
Re
serv
es
(MM
BO
)
EUR 1P ReservesGross EUR 1P Reserves
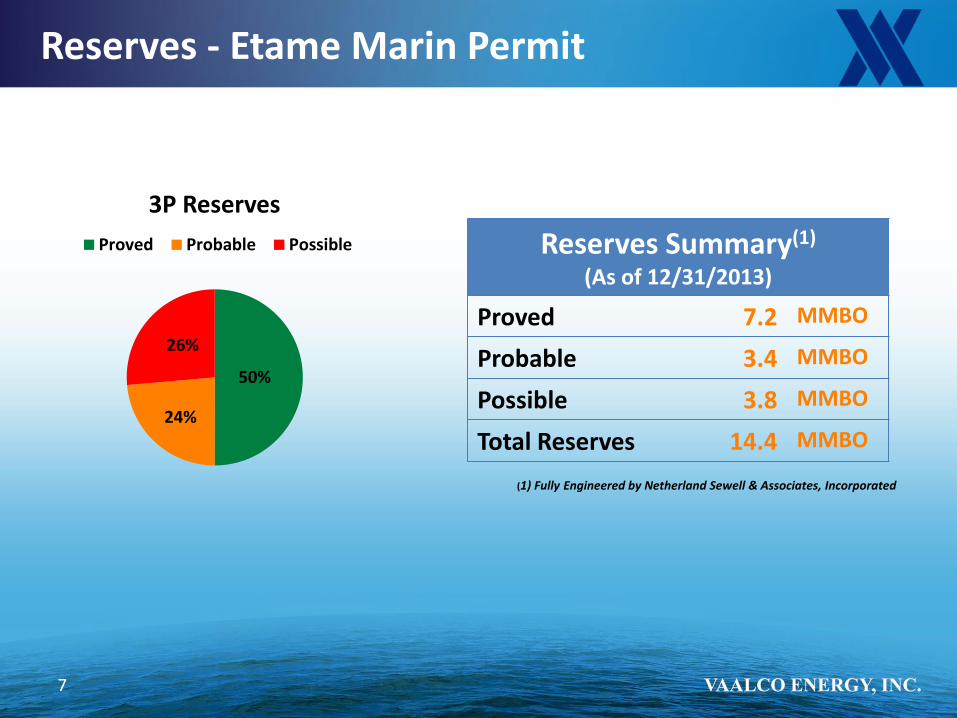
Reserves - Etame Marin Permit
7
Reserves Summary(1) (As of 12/31/2013)
Proved 7.2 MMBO
Probable 3.4 MMBO
Possible 3.8 MMBO
Total Reserves 14.4 MMBO
(1) Fully Engineered by Netherland Sewell & Associates, Incorporated
50%
24%
26%
3P Reserves
Proved Probable Possible

$0
$10
$20
$30
$40
$50
$60
$70
$80
$90
$100
$110
$14
$16
$4 $6
$19
$10
$39
Net Cash Flow Summary ($/bbl) 2013
Margin
DD&A
Taxes (Profit Oil)
G&A
Workovers
OPEX
Royalty
13%
15%
4%
6%
17% 9%
36%
Net Cash Flow Summary (%/bbl) 2013
Royalty OPEX Workovers G&A Taxes (Profit Oil) DD&A Margin
Margin per Barrel - Etame Marin Permit
8
$ 108

Oily and Leveraged to Brent
9
$85.00
$90.00
$95.00
$100.00
$105.00
$110.00
$115.00
$R
ev
/Bb
l
Realized Oil Price Per BBLCompared to Brent BBL (2012)
$85.00
$90.00
$95.00
$100.00
$105.00
$110.00
$115.00
$R
ev
/Bb
l
Realized Oil Price Per BBLCompared to Brent BBL (2012)
0.00%
20.00%
40.00%
60.00%
80.00%
100.00%
To
tal %
of
Pro
du
cti
on
Oil / Gas Production
% Gas
% Oil
Comparators Anadarko
ENI Harvest
Shell SINOPEC
TOTAL Tullow Oil
Development Projects
10

Operator with a 28.1% net W.I. Partners: Addax, Sasol, Sojitz , PetroEnergy and Tullow
Oil production - 18,000 BOPD gross
Cumulative production through 2013 - 79.7 million barrels
Construction of two new platforms underway
Evaluating possible 7th extension to the Etame Marin Exploration Permit
Offshore Gabon – Etame Marin Permit
11
GABON Port Gentil
Libreville
Etame Marin Permit Working Interest 28.1%
Ebouri
SE Etame
Etame
South Tchibala & Avouma
North Tchibala

Etame Field Expansion Project
12
New Etame Platform
$175 million gross investment in the new platform
($49 million net)
4 pile, 8 slot platform in water depth of 85 meters
Initial 3 well development $25 million gross per well
($7 million net per well)
Develop 10 MMBOE incremental gross reserves
Installation in 2H 2014
Spud initial well late 2014
Existing Wells
Initial Planned Wells
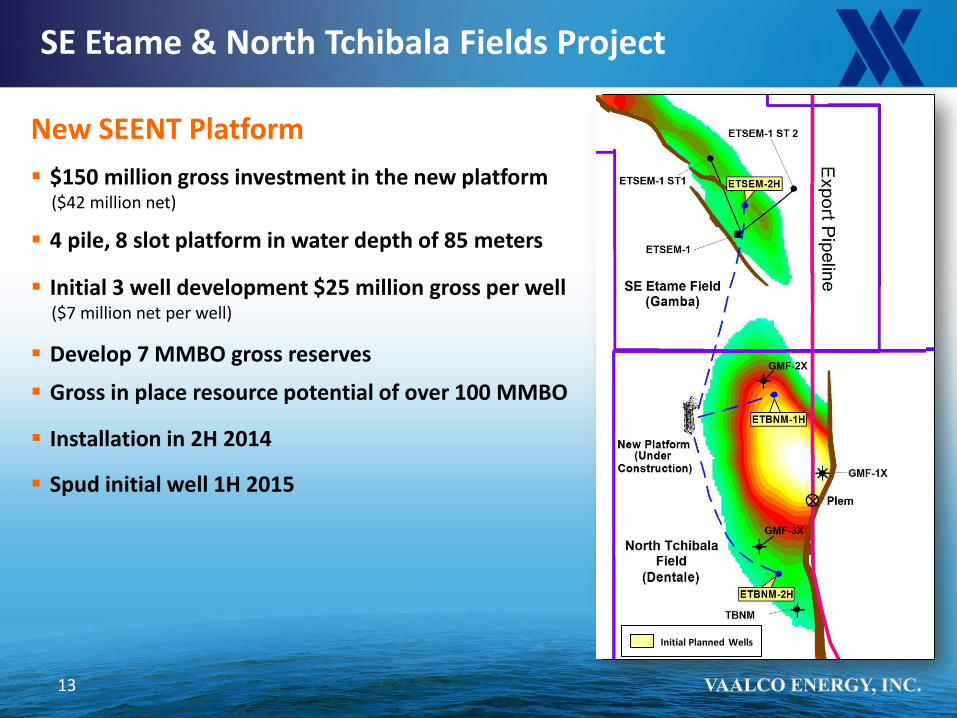
SE Etame & North Tchibala Fields Project
13
New SEENT Platform
$150 million gross investment in the new platform ($42 million net)
4 pile, 8 slot platform in water depth of 85 meters
Initial 3 well development $25 million gross per well ($7 million net per well)
Develop 7 MMBO gross reserves
Gross in place resource potential of over 100 MMBO
Installation in 2H 2014
Spud initial well 1H 2015
Initial Planned Wells

14
Onshore Gabon- Mutamba Iroru Permit
VAALCO operated with 41% working interest
N’Gongui discovery well drilled in Q4 2012
Encountered 49 feet of oil pay in the Gamba Formation
Negotiations currently in progress on establishing the production area and renewal of exploration acreage
Plan of Development underway for submittal to Gabon Government
Shell Rabi Kounga Field Cum: 840 MMBO EUR 900 MMBO
TOTAL Atora Field
Cum: 38 MMBO
VAALCO N’Gongui Discovery
Shell Bende Field
Shell Gamba-Ivinga Field
Cum: 286 MMBO & 568 BCF EUR 350 MMBO
Discoveries
Rabi Kounga Pipeline

Exploration Projects
15
Loengo
A A’
Block 5 Block 20 Block 21
Ombundi Baleia -1A
Mobil Discovery
Lontra-1
Cobalt Discovery
Cobalt Discovery
Mavinga-1
Cobalt Prospect
Cameia -1
Cobalt Discovery
Cameia-2
Cobalt Discovery
Possible Oil Zone
Confirmed Oil Zone
Basement
Salt
Basement
Salt
~15 miles ~65 miles
VAALCO Prospect
VAALCO Lead
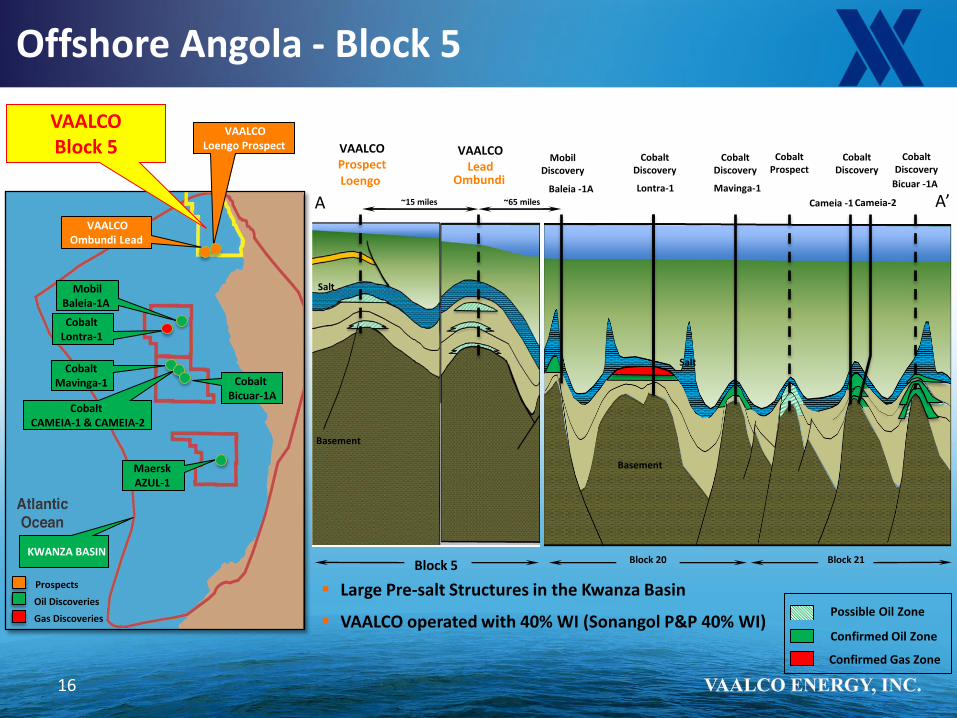
Offshore Angola - Block 5
16
Confirmed Gas Zone
Large Pre-salt Structures in the Kwanza Basin
VAALCO operated with 40% WI (Sonangol P&P 40% WI)
Bicuar -1A
Maersk AZUL-1
Cobalt Mavinga-1
Cobalt CAMEIA-1 & CAMEIA-2
Cobalt Lontra-1
VAALCO Loengo Prospect
VAALCO Ombundi Lead
Mobil Baleia-1A
VAALCO Block 5
Prospects
Oil Discoveries
Cobalt Bicuar-1A
KWANZA BASIN
Gas Discoveries

17
Block 5 - Prospects and Leads
PreSalt Lead or Prospect
Post Salt Prospect
Block 5
Atlantic Ocean
Mubafo Discovery NE NE
NE NE SW
SW SW
SW
Post Salt Discovery
Kindele Prospect (Post Salt) WD=101m Gross Potential=20-49 MMbls
Jack Prospect (Post Salt) WD=75m Gross Potential=22-55 MMbls
Loengo Prospect (Pre&Post Salt) WD=108m Gross Potential=70-250 MMbls
Ombundi Lead (Pre Salt) WD=500m+ Gross Potential=100-760 MMbls Block 5
1Q 2014 VAALCO / Sonangol P&P Reprocessing Deep-Water 3-D
Seismic

18
Offshore Equatorial Guinea - Block P
Acquired 31% W.I. in 57,000 gross acres (PDA area) in November, 2012
2005 discovery – Venus
Working with GEPetrol (operator) to develop a joint operatorship model
Two exploration wells expected to be drilled in the near future
Marathon 1,100 mmboe
Exxon 1,300 mmboe
Hess 600 mmboe
VAALCO BLOCK P
PDA
Equatorial Guinea
Oil Blocks
VAALCO Block

19
Block P - Prospects and Leads
19
Atlantic
Atlantic Ocean
VAALCO
PDA
Boundary
57,000 acres
232 km2
Block P PDA
Discoveries
Prospects
SW Grande 10-180 MMBO
Europa Discovery
Venus Field 17 - 21 MMBO
Marte 16-70 MMBO
A’
A
SW Grande Marte
Exploration Play Types

Attributes of Exploration Opportunities
20
Attributes
Angola Block 5
EG Block P
Etame Marin
Blocks have existing hydrocarbon (oil) discoveries
Prospects are liquids prone
Shallower water (75m – 500m)
Normally pressured regime
Shallower targeted structures
Lower commerciality threshold
State of the art 3D processing and imaging
Development schemes replicates experience
Total unrisked mean net recoverable resource potential ~ 700 MMBOE

2014 Capital Budget
21
Gross $millions
VAALCO
$millions
Development
Etame
Facilities $ 187 $ 54
Drilling 47 13
Exploration
Angola
3-D Seismic 7 3
Loengo 54 27
EG
S.W. Grande 40 12
Gabon
Dimba 21 8
Total $ 356 $ 117
2014 Components (Net)
Construction of platforms $ 54
Development wells 13
Exploration wells 47
Seismic 3
Total $ 117
46%
11%
40%
3%
2014 CAPEX
Construction of platforms
Development wells
Exploration
Seismic

Sequence of Milestones
22
Drill Dimba
Set Etame / SEENT Platforms
Ebouri Crude Sweetening Project
Pre-feed
Development
Drill Development Wells
3 Etame Wells
3 SEENT Wells
3 Ebouri Wells
Process Angola Seismic
Drill Block P (2 wells)
1st Well
2nd Well
Drill Angola (2 wells)
1st Well
2nd Well
Mutamba Development
Mutamba First Oil
23
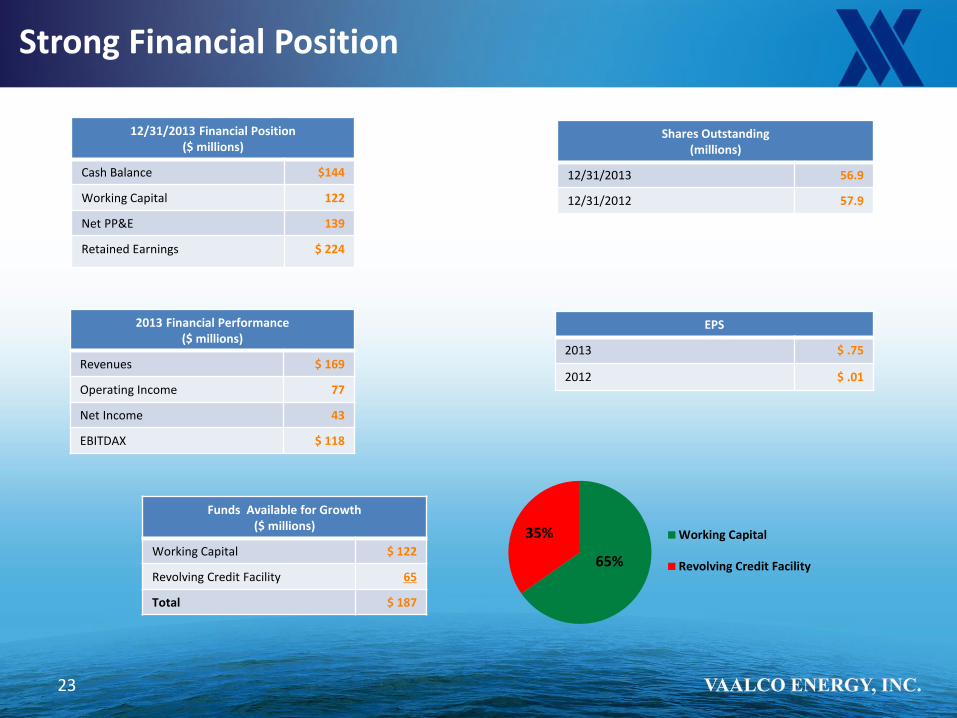
Strong Financial Position
12/31/2013 Financial Position ($ millions)
Cash Balance $144
Working Capital 122
Net PP&E 139
Retained Earnings $ 224
2013 Financial Performance ($ millions)
Revenues $ 169
Operating Income 77
Net Income 43
EBITDAX $ 118
Shares Outstanding (millions)
12/31/2013 56.9
12/31/2012 57.9
Funds Available for Growth ($ millions)
Working Capital $ 122
Revolving Credit Facility 65
Total $ 187
EPS
2013 $ .75
2012 $ .01
65%
35% Working Capital
Revolving Credit Facility

24
Strong Cash Flow with Focus on Growth
Strong high margin base business Stable production profile 100% operated 98% oil – leveraged to Brent
Near term – low risk growth Near field development opportunities Projects on time, on budget Attractive project economics
Long term growth strategy In 3 out of top 4 West Africa producing countries Exposure in excess of 700 MMBOE unrisked net
recoverable resource potential Balance exploration growth with discovered resource
acquisitions

25
APPENDIX
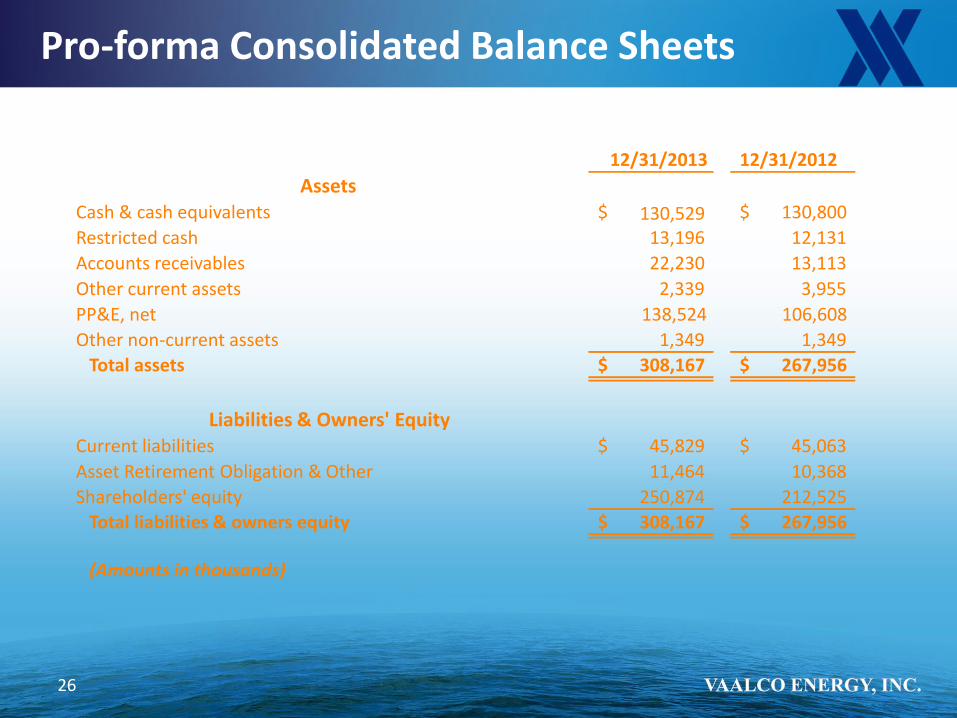
Pro-forma Consolidated Balance Sheets
26
12/31/2013 12/31/2012
Assets Cash & cash equivalents $ 130,800 $
Restricted cash 13,196 12,131
Accounts receivables 22,230 13,113
Other current assets 2,339 3,955
PP&E, net 138,524 106,608
Other non-current assets 1,349 1,349
Total assets 308,167 $ 267,956 $
Liabilities & Owners' Equity
Current liabilities 45,829 $ 45,063 $
Asset Retirement Obligation & Other 11,464 10,368
Shareholders' equity 250,874 212,525
Total liabilities & owners equity (Amounts in thousands)
308,167 $ 267,956 $
130,529

Pro-forma Income Statements
27
12 months
ended
12/31/2013
12 months
ended
12/31/2012
Revenues $ 195,287 $
Operating costs and expenses (92,052) (108,694)
Operating Income 77,225 $ 86,593 $
Other expense, net (38) 559
Income tax expense (34,115) (81,813)
Net Income 43,072 $ 5,339 $
Less net income - noncontrolling interest - (4,708)
Net income - VAALCO Energy, Inc. (Amounts in thousands)
43,072 $ 631 $
169,277