Burj Khalifa in Dubai higher than the Twin Towers in Malaysia (V) Burj Khalifa in Dubai is higher...
24
Burj Khalifa in Dubai higher than the Twin Towers in Malaysia (V) Burj Khalifa in Dubai is higher than the Twin Towers in Malaysia
-
Upload
margery-wilkins -
Category
Documents
-
view
234 -
download
10
Transcript of Burj Khalifa in Dubai higher than the Twin Towers in Malaysia (V) Burj Khalifa in Dubai is higher...
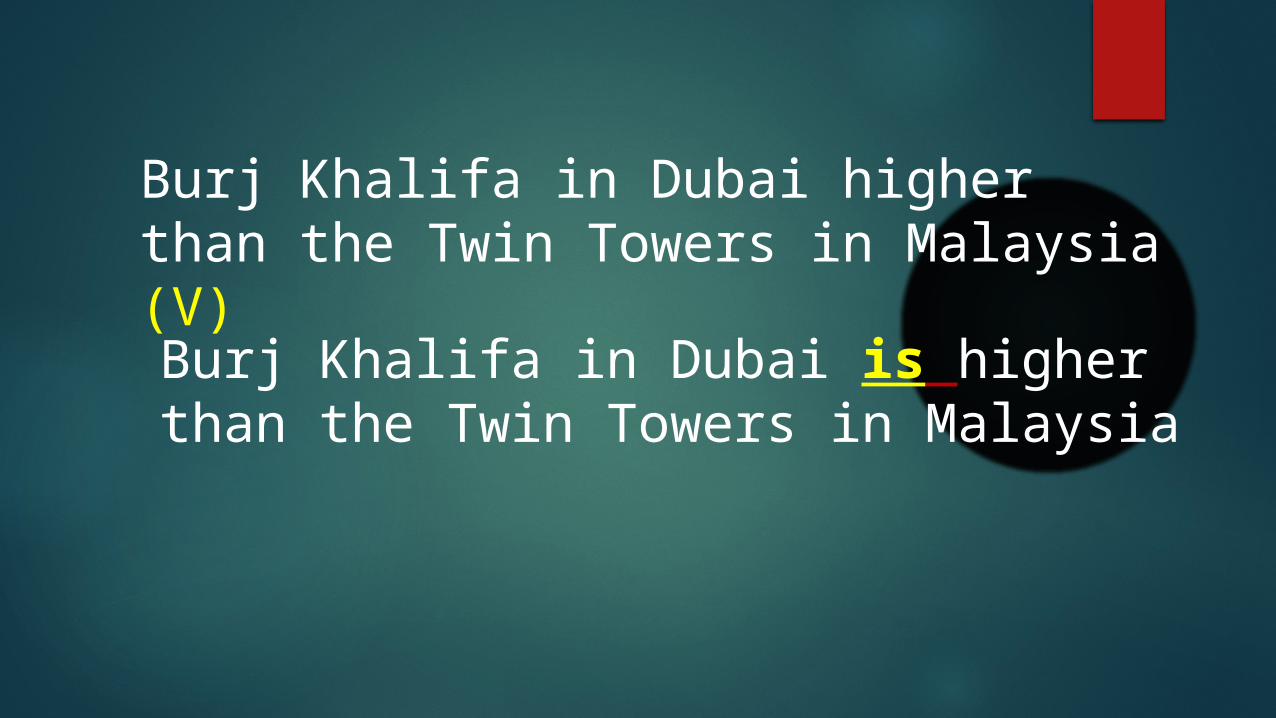
Burj Khalifa in Dubai higher than the Twin Towers in Malaysia (V)
Burj Khalifa in Dubai is higher than the Twin Towers in Malaysia

English is more difficult than Arabic.
english is more difficult than arabic. ©

Dubai has a higher population than Al Ain.
Dubai have a higher population than Al Ain (SVA)

Dubai has a more population than Al Ain (ww)
Dubai has a higher population than Al Ain

English more difficult than Arabic. (V)
English is more difficult than Arabic. (V)

iBook,
Chapter 8
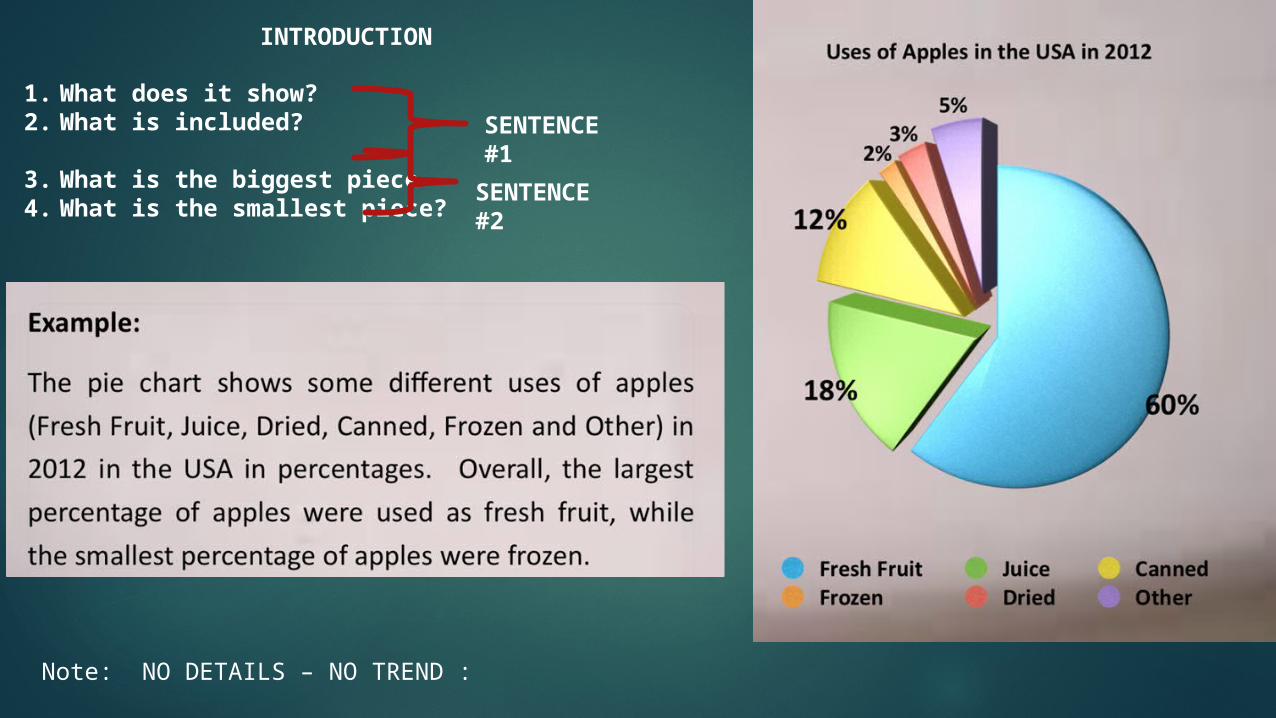
1. What does it show?2. What is included?
3. What is the biggest piece4. What is the smallest piece?
Note: NO DETAILS – NO TREND :
INTRODUCTION
SENTENCE #2
SENTENCE #1
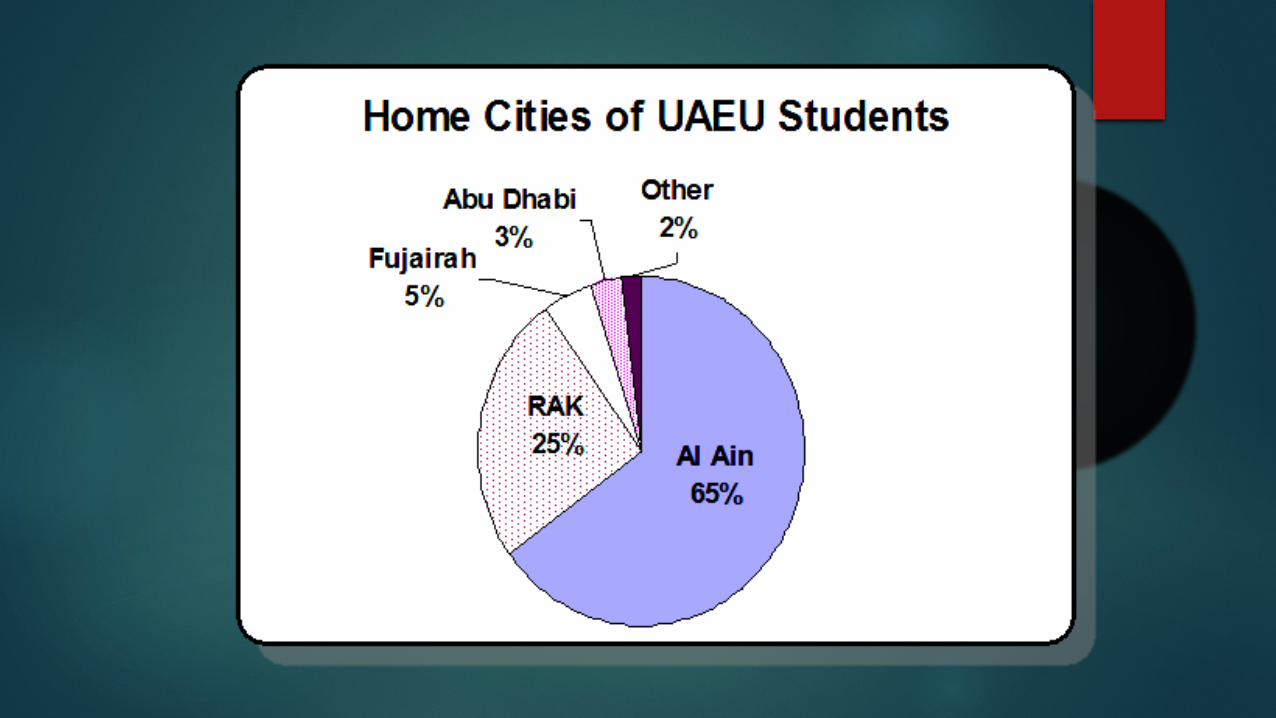


highest
thanmore
The most
More than two thirds
highest
students
More
Twice
RAK common
Most common
as


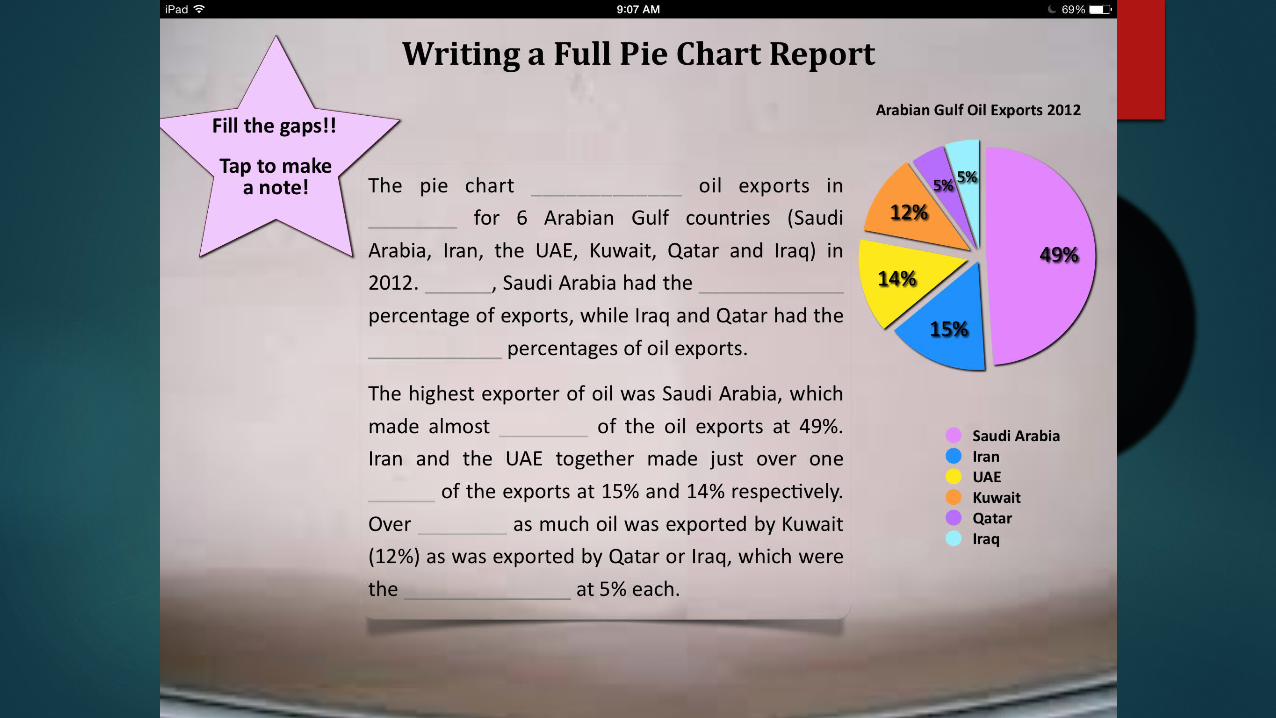
Saudi Arabia52%
UAE16%
Iran15%
Qatar5%
Kuwait12%
Arabian Gulf Oil Exports - 2010
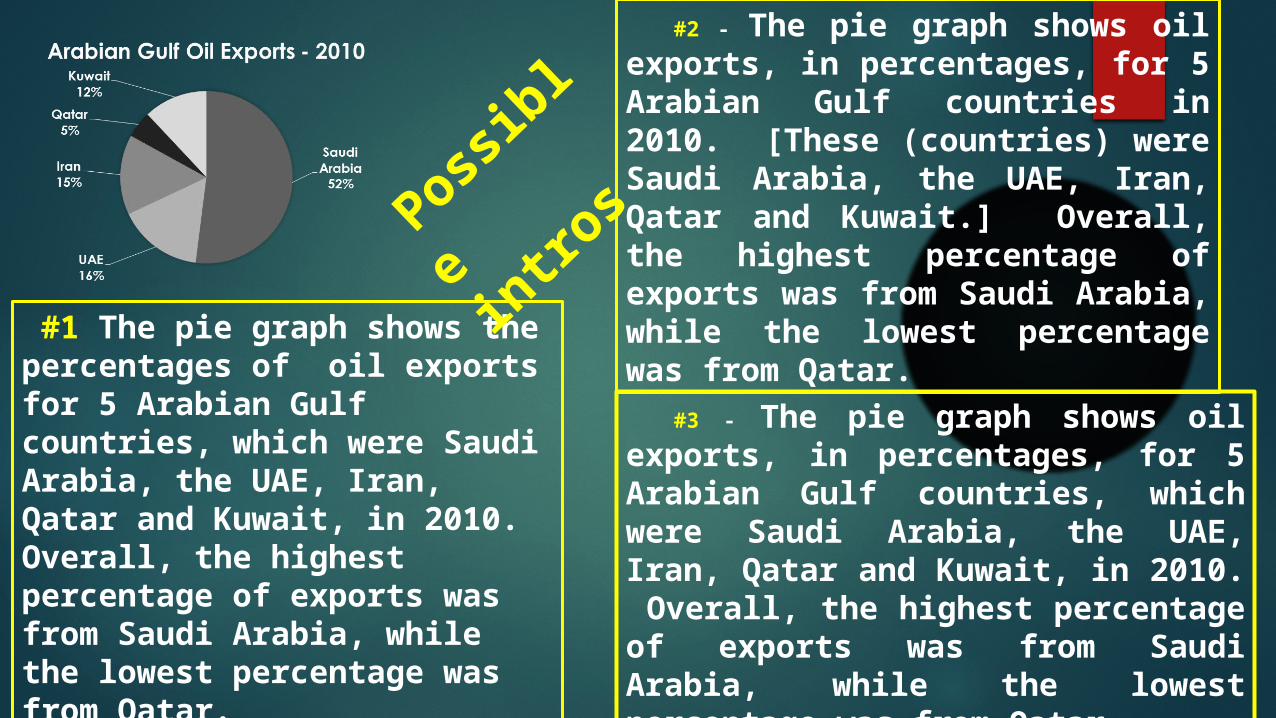
#1 The pie graph shows the percentages of oil exports for 5 Arabian Gulf countries, which were Saudi Arabia, the UAE, Iran, Qatar and Kuwait, in 2010. Overall, the highest percentage of exports was from Saudi Arabia, while the lowest percentage was from Qatar.
#3 - The pie graph shows oil exports, in percentages, for 5 Arabian Gulf countries, which were Saudi Arabia, the UAE, Iran, Qatar and Kuwait, in 2010. Overall, the highest percentage of exports was from Saudi Arabia, while the lowest percentage was from Qatar.
#2 - The pie graph shows oil exports, in percentages, for 5 Arabian Gulf countries in 2010. [These (countries) were Saudi Arabia, the UAE, Iran, Qatar and Kuwait.] Overall, the highest percentage of exports was from Saudi Arabia, while the lowest percentage was from Qatar.
Pos
sibl
e in
tros

#2 The pie graph shows sugar
production in percentages in 5
countries, which were Brazil,
Thailand, the US, China and India,
in 2012. Overall, the highest
percentage of sugar production
was in Brazil, while the lowest
percentage of sugar production
was from the US.
#1 The pie graph shows the
percentages of sugar producing countries,
which were Brazil, Thailand, the US, China
and India, in 2012. Overall, the highest
percentage of sugar production was in
Brazil, while the lowest percentage (of
sugar production) was from the US.