Buried and accessible surface area control intrinsic ...
36
NOTICE: this is the author’s version of a work that was accepted for publication in the Journal of Molecular Biology. Changes resulting from the publishing process, such as peer review, editing, corrections, structural formatting, and other quality control mechanisms may not be reflected in this document. Changes may have been made to this work since it was submitted for publication. A definitive version was subsequently published in J Mol Biol 425, 3250-3263, 9 September 2013 http://dx.doi.org/10.1016/j.jmb.2013.06.019 Buried and accessible surface area control intrinsic protein flexibility Joseph A. Marsh European Bioinformatics Institute (EMBL-EBI) Wellcome Trust Genome Campus Hinxton, Cambridge CB10 1SD, United Kingdom [email protected] Keywords: protein dynamics; protein structure; protein folding; monomer; solvent accessible surface area Abbreviations used: A rel , relative solvent accessible surface area; NMR, nuclear magnetic resonance; GNM, Gaussian network model; Random Coil Index, RCI; quaternary structure, QS; RMSF, root-mean-squared fluctuations
Transcript of Buried and accessible surface area control intrinsic ...
NOTICE: this is the author’s version of a work that was accepted for publication in the Journal of Molecular Biology. Changes resulting from the publishing process, such as peer review, editing, corrections, structural formatting, and other quality control mechanisms may not be reflected in this document. Changes may have been made to this work since it was submitted for publication. A definitive version was subsequently published in J Mol Biol 425, 3250-3263, 9 September 2013 http://dx.doi.org/10.1016/j.jmb.2013.06.019
Buried and accessible surface area control intrinsic protein flexibility
Joseph A. Marsh
European Bioinformatics Institute (EMBL-EBI)
Wellcome Trust Genome Campus
Hinxton, Cambridge CB10 1SD, United Kingdom
Keywords: protein dynamics; protein structure; protein folding; monomer; solvent accessible surface area
Abbreviations used: Arel, relative solvent accessible surface area; NMR, nuclear magnetic resonance; GNM, Gaussian network model; Random Coil Index, RCI; quaternary structure, QS; RMSF, root-mean-squared fluctuations
2
Abstract
Proteins experience a wide variety of conformational dynamics that can be crucial
for facilitating their diverse functions. How is the intrinsic flexibility required for these
motions encoded in their three-dimensional structures? Here, the overall flexibility of
a protein is demonstrated to be tightly coupled to the total amount of surface area
buried within its fold. A simple proxy for this, the relative solvent accessible surface
area (Arel), therefore shows excellent agreement with independent measures of
global protein flexibility derived from various experimental and computational
methods. Application of Arel on a large scale demonstrates its utility by revealing
unique sequence and structural properties associated with intrinsic flexibility. In
particular, flexibility as measured by Arel shows little correspondence with intrinsic
disorder, but instead tends to be associated with multiple domains and increased -
helical structure. Furthermore, the apparent flexibility of monomeric proteins is found
to be useful for identifying quaternary structure errors in published crystal structures.
There is also a strong tendency for the crystal structures of more flexible proteins to
be solved to lower resolutions. Finally, local solvent accessibility is shown to be a
primary determinant of local residue flexibility. Overall this work provides both
fundamental mechanistic insight into the origin of protein flexibility and a simple,
practical method for predicting flexibility from protein structures.
3
Introduction
Proteins are intrinsically flexible, dynamic molecules. Although the structure-function
insight obtained from the tens of thousands of X-ray crystal structures determined to
date has demonstrated the tremendous utility of simple single-conformation models,
it has long been clear, from the basic principles of statistical thermodynamics, that
an ensemble representation would be required to fully describe a protein in solution.
That is, rather than adopting unique structures, proteins can be considered as
ensembles of multiple distinct conformers. A large body of experimental, theoretical
and computational work now supports the importance of this energy landscape
paradigm1–3.
Although the ensemble view of protein structure is now firmly established, much
progress is currently being made in characterizing the diverse ways that proteins
populate the energy landscape. For many proteins, the conformational fluctuations
are small and the classical representation of proteins as single unique structures is
adequate for most practical purposes. Furthermore, the very fact that many proteins
can be crystallized, and that those crystals are densely packed4, provides strong
justification for the approximation of many proteins as rigid solids. However, beyond
this, it is clear that proteins undergo a wide range of motions that can be important
for their functions. These can involve relatively minor backbone or side-chain
dynamics or larger scale movements of secondary structural elements or domains5.
In some cases, proteins can even be intrinsically disordered, i.e. partially or
completely unfolded in solution6–8, in which case the ensemble representation must
cover a vast range of conformational space9,10. Given this structural and dynamic
diversity, protein flexibility can be best considered on a continuum, with rigid,
globular proteins at one extreme and intrinsically disordered proteins at the other11–
13.
We recently introduced a simple parameter, the relative solvent accessible surface
area (Arel), which describes the amount of surface area a protein exposes to solution
(and, conversely, how little it buries intramolecularly) compared to what is expected
given its molecular weight. Arel was shown to have great utility for predicting the
magnitude of conformational changes that occur upon binding from the structures of
protein complexes, allowing the demonstration that large conformational changes
4
are extremely common14. This work also hinted of a close relationship between Arel
and protein flexibility, implying a tight correspondence between the intrinsic flexibility
of proteins in their unbound states and their binding-induced conformational
changes.
Here, the theoretical basis for a relationship between buried and accessible surface
area and intrinsic protein flexibility is first discussed, and then validated by
demonstrating strong correlations between Arel and various measures of flexibility
calculated from normal mode analysis, NMR ensemble models, molecular dynamics
simulations and NMR chemical shifts. This enables analyses of the associations
between intrinsic flexibility and various protein properties, including domain
structure, amino acid composition, secondary structure, quaternary structure and
crystal-structure resolution. Finally, the relationship between solvent accessibility
and local flexibility is investigated.
Results and Discussion
Origins of the relations between molecular weight, solvent
accessible surface area and intrinsic flexibility
As the crystal structures of an increasing number of proteins were determined in the
1970s and 1980s, an interesting phenomenon was noted: when the solvent
accessible surface areas of proteins was plotted against their molecular weights, a
very tight correspondence was observed15–17. This still holds today with the large
number of crystal structures that have now been determined, as shown in Figure
1A. From this plot, the expected solvent accessible surface area for a folded,
crystallizable, monomeric protein (Amonomer) of molecular weight M can be fit:
Amonomer = 4.44M0.770 (1)
At first glance, this relationship might be attributed to a simple geometric
phenomenon in which surface area should scale with an exponent of 2/3 with
respect to volume16,17. In fact, given the difference between molecular surface and
solvent accessible surface area (i.e. the presence of a solvent layer), an exponent of
slightly less than 2/3 might be expected15. However, as is seen here and noted
previously15,18, an exponent considerably higher than 2/3 provides the best fit. One
simple interpretation of this is that larger proteins tend to adopt more extended
5
conformations, burying less surface area per residue than if they adopted a constant
shape with increasing size. Similarly, it has been suggested that bigger proteins are
less densely packed19,20. Finally, an energetic explanation has been proposed: since
protein folding is driven by the burial of surface area in order to compensate for the
massive conformational entropy of the unfolded state21–23, Equation 1 is influenced
by this tendency to bury surface area in proportion to unfolded-state entropy, which
in turn is proportional to molecular weight18.
Regardless of its fundamental origin, one can easily accept Equation 1 as an
empirical relationship describing what is expected for a typical monomeric,
crystallizable protein of a given molecular weight. We recently showed that the
relative solvent accessible surface area, Arel, defined as the observed solvent
accessible surface area, Aobserved, divided by the expected value, Amonomer, could be
extremely useful for understanding the changes in conformation that a protein
undergoes upon complex formation14:
monomer
observed
relA
A=A (2)
Deviations from the idealized Amonomer (i.e. Arel values > 1) for both monomeric
proteins and bound subunits were found to correlate with the magnitude of
conformational changes that occur upon binding14. Interestingly, the Arel values of a
limited set of monomeric proteins were found to correlate with their flexibilities
derived from normal mode analysis. Therefore, the correspondence between free-
state Arel values and conformational changes could be explained if increasing
flexibility in the unbound state were associated with larger binding-induced
conformational changes. Roughly speaking, we found that an Arel value of 1.2 tends
to correspond to a very large conformational change upon complex formation (> 5 Å
root-mean squared deviation between free and bound states). Given that a precision
on the order of 50-100 Å2 is expected for solvent accessible surface area
calculations24, Arel values can be expected to have a precision of 0.005-0.01 for a
typical folded protein with Aobserved of 104 Å2.
Why would solvent accessible surface area be related to intrinsic flexibility? Insight
into this can be obtained by considering the relationship with molecular weight
shown in Figure 1A. Proteins with high Arel values expose more surface area than
6
expected for typical folded proteins and thus, crucially, bury less surface area
intramolecularly within their folds. Since the burial of surface area is the primary
driving force that overcomes the huge conformational entropy of the unfolded
state22, proteins with higher Arel values should therefore retain greater
conformational entropy and be more flexible. On the other hand, proteins with lower
Arel values bury more surface within their folded cores and should thus be more
rigid. This concept is illustrated in Figure 1B where the structures and solvent
accessibilities of several monomeric proteins are shown along with their Arel values.
This relationship between solvent accessible surface area and protein flexibility
becomes even clearer if one assumes a constant relationship between the amount
of surface area buried and the energy of folding. While proteins are of course
heteropolymers comprised of chemically different amino acids, the mean
hydrophobicity of accessible and buried surface area is fairly similar from one
protein to another15. Moreover, the difference in energetic contribution between
buried hydrophobic and hydrophilic surface area should be minimal, assuming that
buried polar residues are hydrogen bonded25–28. Notably, uniform surface area
approaches have been found by some to be much preferable to empirical weighting
schemes29 and have recently shown remarkable agreement with experiments when
used to predict protein complex assembly pathways30,31. Therefore, by assuming
constant surface area, the difference between Aobserved and Amonomer can be directly
related to the difference in conformational entropy with respect to the idealized
folded state from Equation 1, and could even be converted into approximate
energetic terms, for instance by assuming ~0.1 kJ/mol of conformational entropy per
additional Å2 exposed compared to the reference state25. Arel therefore effectively
represents a simple proxy for this difference in conformational entropy, normalized
to protein size, explaining why it would be closely related to intrinsic protein
flexibility.
Arel predicts global measures of intrinsic flexibility
The above suggests that Arel, which functions essentially as a measure of how little
surface area a protein buries within its fold, should be related to flexibility. How
strong is this relationship, and could it be of practical utility? Here this is investigated
in detail through large-scale comparisons of monomer Arel values to multiple
independent probes of intrinsic protein flexibility. Although various definitions of

7
flexibility have been used in different contexts, here we are considering intrinsic
flexibility in a general sense, as a scalar quantity describing the magnitude of
conformational dynamics that a protein will experience isolated in solution. Each
flexibility measure used here is very different, being based upon different simulation
methods or experimental data, but they are all reflective of intrinsic flexibility in the
sense that they quantify the overall extent of protein motions.
A non-redundant set of 6565 monomeric protein crystal structures was first
compiled, as well as a subset of 907 high-confidence monomers that have been
filtered using much stricter criteria. The high-confidence monomers were used to fit
the relationship in Equation 1 (Figure 1A). Figure 1C shows the distribution of Arel
values for both sets. A smooth distribution is observed with a peak at 1.0,
suggesting that Arel represents a continuous phenomenon with a range of possible
values, consistent with the continuum view of protein dynamics. The asymmetric
nature of the distribution implies that there are fairly tight constraints on how much
surface area a protein can possibly bury intramolecularly (with no observed Arel <
0.8) and looser restrictions on how much surface area a crystallizable monomer can
expose (with a few instances of Arel > 1.5).
Normal mode analysis provides a fast and simple way to probe the intrinsic flexibility
and dynamics of proteins of known structure. Excellent agreement has been
obtained between normal mode analysis applied to simple backbone-only models of
various proteins and the intrinsic dynamics and conformational changes observed
experimentally or in molecular dynamics simulations32–36. In this study, the Gaussian
network model (GNM)37 was used for large-scale normal mode analysis. Figure 2A
plots the flexibility values calculated with GNM (i.e. the mean amplitudes of their
normal modes) against Arel for all 6565 monomeric crystal structures. Overall, a
strong correspondence is observed (Pearson correlation coefficient r = 0.78),
confirming the effectiveness of Arel as a proxy for intrinsic flexibility derived from
normal mode analysis. Notably, the correlation with the large dataset used here is
very similar to what was seen previously with only 60 proteins (r = 0.76)14, using a
different method of normal mode analysis (elastic network model38,39).
Models of protein structures calculated from NMR data generally contain multiple
distinct conformations. While the structural heterogeneity among different ensemble
members arises from both the intrinsic dynamics of a protein and of possible
8
uncertainty reflecting an insufficient number of experimental restraints, NMR
ensemble models generally provide reasonable, albeit imperfect, representations of
the solution dynamics40–43. The NMR ensemble models used in this study came
from the RECOORD database and have all been recalculated using a uniform
protocol44, thus avoiding some of the variation between models that arises due to
methodological differences. Figure 2B plots the root-mean-squared fluctuations
(RMSF) for 454 non-redundant NMR models against their Arel values. Overall, there
is a strong correlation between Arel and RMSF (r = 0.82), demonstrating that Arel is
highly reflective of the fluctuations within an NMR model.
Molecular dynamics simulations provide another way to characterize the intrinsic
flexibility and dynamics of proteins in detail. This study utilized a large set of 10 ns
trajectories from the MoDEL database, which contains pre-calculated parameters
describing the global flexibility of each protein45. Figure 2C compares Arel to the
Lindemann index calculated from the molecular dynamics trajectories of 491 non-
redundant monomeric proteins. This parameter provides a measure of atomic-level
disorder, and can thus be used a descriptor of the liquid-like or solid-like character of
a protein46. The correlation is strong (r = 0.77) confirming that Arel shows major
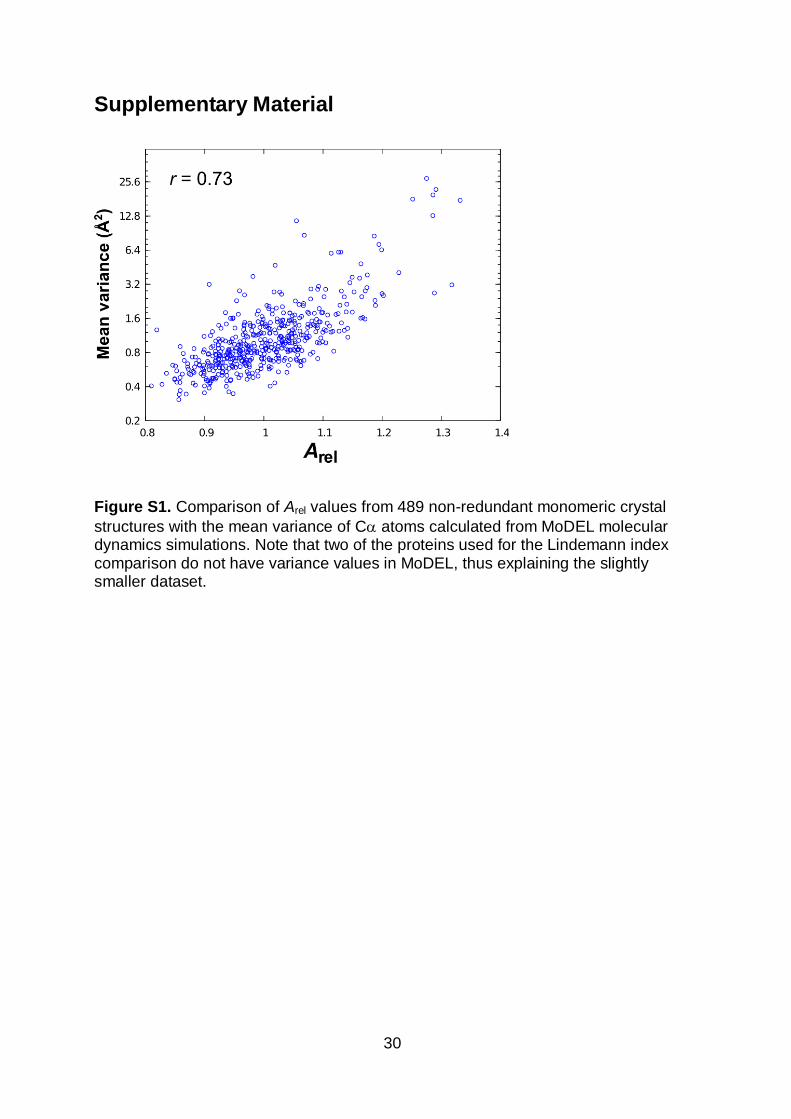
overlap with flexibility derived from molecular dynamics simulations. Likewise, an
alternate measure of flexibility available in MoDEL, the mean variance of C atoms,
shows a similar correlation of 0.73 with Arel (Figure S1).
The Random Coil Index (RCI) is based upon NMR chemical shifts and provides a
local measure of backbone flexibility47. Figure 2D plots the global RCI values,
averaged over all residues, against Arel values calculated from 185 non-redundant
NMR models. The correlation is good (r = 0.71), although slightly lower than the
other examined flexibility measures. Importantly, RCI is directly calculated from
experimental chemical shifts, which were not used in the NMR model calculations,
and is thus independent of the structural models used to calculate Arel.
Together, the above results demonstrate that the overall flexibility of monomeric
proteins is strongly determined by the total amount of surface area buried within
their folds, and thus the simple-to-calculate Arel parameter is highly predictive of
various flexibility measures. Table S1 shows how those different measures correlate
with each other. For example, while the Lindemann index shows a correlation of
0.77 with Arel values, it has markedly lower correlations with RMSF (0.70), RCI

9
(0.57) and GNM (0.68). Strikingly, the Arel values correlate with all four measures of
intrinsic flexibility as well as, or better than, those measures do with each other.
Furthermore, it was also found that the choice of monomer set used for fitting
Equation 1 had little effect on the predictive ability of Arel (Table S2).
Flexibility depends on protein length and number of domains
Arel, by definition, is essentially normalized to protein length (r = 0.999 between
number of residues and molecular weight in the full dataset), and reflects the
flexibility with respect to an idealized state expected for a protein of a given
molecular weight. However, there does appear to be some length dependence to
protein flexibility, as there is a slight correlation between Arel and chain length (r =
0.17). One possibility is that this is related to the number of protein domains, as the
presence of multiple domains can facilitate considerable inter-domain motions5,48.
Indeed, the correlation between Arel and number of domains is much stronger (r =
0.31), while the correlation with chain length largely disappears if one considers only
single-domain proteins (r = 0.07). Figure 3 demonstrates the strong tendency for
mean Arel values to increase with an increasing number of domains.
Could the motions facilitated by the presence of multiple domains be a primary
determinant of the relationship observed between Arel and other measures of
flexibility? Table S3 shows that this is not the case by breaking down the analyses
by single- and two-domain proteins, and showing that the strong correlations are still
preserved. Thus Arel clearly captures much more of the broad spectrum of protein
flexibility than just inter-domain motions.
The influence of multidomain proteins on the fit in Figure 1A used to derive Equation
1 was also considered. If multidomain proteins are excluded, Equation 1 changes to
5.82M0.74. This suggests that, unexpectedly, the approximation of proteins adopting
relatively constant shapes becomes slightly more accurate when considering only
single-domain proteins, as the exponent is closer to 2/3. However, most importantly
for our purposes, the correlations with different measures of intrinsic flexibility
change very little if this form of the equation is used to calculate Arel (Table S2).
10
Flexible proteins are characterized by unique sequence and
secondary structure properties
To what extent is the propensity for protein flexibility reflected in amino acid
composition? To assess this, the Pearson correlation coefficient (r) was calculated
between the fractional content of each of the 20 standard amino acids and the Arel
values of monomeric crystal structures (Figure 4A). Thus amino acids that tend to
be associated with higher-Arel, more flexible proteins will have higher r values, while
those associated with more rigid proteins will have negative r. Each amino acid is
coloured by its type (hydrophobic, charged, polar and glycine), which allows some
interesting trends to be immediately noted. Charged amino acids, with the exception
of aspartate, have a strong association with increased flexibility. On the other hand,
polar amino acids are generally associated with lower flexibility. Interestingly, and
somewhat surprisingly, hydrophobic amino acids tend to be intermediate between
polar and charged residues. Finally, glycine shows the strongest negative
correlation with Arel. Very similar sequence trends are observed if alternate
measures of flexibility are considered (Figure S2A).
Some correspondence between the sequence determinants of intrinsic disorder and
intrinsic flexibility as measured by Arel might be expected. For instance, protein
complex subunits predicted to be disordered have been found to have much higher
Arel values than those predicted to fold14,49. Contact density, which is closely related
to buried surface area, has also been identified as an important parameter for
predicting intrinsically disordered regions50–52. Furthermore, regions of proteins
predicted to be disordered yet observed in crystal structures tend to undergo larger
conformational changes53. Therefore, it is noteworthy that the association between
Arel and charged residues is analogous to the previous observations that net charge
is the primary determinant of expandedness in intrinsically disordered proteins54–56.
Beyond this, however, there appears to be little further similarity with the known
sequence determinants of disorder7,8. For example, glycine is strongly associated
with intrinsic disorder yet here inversely correlates with Arel. Moreover, leucine is
relatively rare in disordered proteins, yet here shows one of the strongest
correlations with increased flexibility. Table S4 shows there are only weak
correlations between the Arel values of monomeric proteins and multiple sequence-
based disorder predictions, suggesting that, for the most part, intrinsic disorder and
11
monomer flexibility as manifested by Arel are reflective of different regions of the
protein dynamics continuum.
In contrast to intrinsic disorder, there does appear to be a clear association between
Arel and the secondary structure propensities of different amino acids. In particular,
glutamate, leucine and lysine have strong -helical propensities, while glycine,
tyrosine and asparagine are helix destabilizing62. Therefore, given this apparent
correspondence between flexibility and secondary structure propensities, the Arel
values of monomer crystal structures from different SCOP classes58 were compared
(Figure 4B). Consistent with the sequence trend, this analysis reveals that all-
proteins are the most flexible (mean Arel = 1.050) and all- proteins the most rigid
(mean Arel = 0.984, P < 2.2 x 10⁻¹⁶, Wilcoxon test). The mixed classes (+ and /)
have Arel values intermediate to and , although / and are nearly equal. This
tendency for proteins to be more flexible than proteins maintained when
alternate measures of flexibility are considered instead of Arel (Figure S2B).
Furthermore, the sequence trends and correlations between Arel and different
measures of flexibility are preserved when split by structural class, demonstrating
that they are largely independent of secondary structure (Figure S3 and Table S5).
What is the origin of this difference in flexibility between and proteins? One
explanation is that -strands are more often associated with changes in the direction
of the polypeptide chain. Thus one can easily imagine why proteins would tend to
form more compact, low-Arel structures that bury more surface area within their
folds. In contrast, -helices only require the chain to go in a single direction, so more
extended, high-Arel structures can be facilitated by the presence of helical structure.
It is also interesting that many of the most compact, low-Arel structures contain a
mixture of both and structure, as for example seen in the TIM barrel -
mannanase shown in Figure 1B (PDB ID: 1BQC); in these cases the combination of
and structure may facilitate their highly pseudosymmetrical folds. Interestingly,
/ proteins were recently shown to be the most compact structural class and to
exhibit the slowest folding rates, which was attributed to the fact that they were able
to adopt the most spherical structures59–61. This helps to explain how these proteins
are able to so efficiently bury surface area and adopt overall rigid conformations. In
light of these observations, it is interesting to note the recent finding that proteins
12
with structure tend to have slightly different As vs. molecular weight relationships
(i.e. Equation 1) than all- proteins63, which could imply that larger proteins tend to
be relatively more flexible than larger proteins, in comparison with smaller
proteins.
These results could also possibly be related to the strong relationship between low
Arel values and polar residues, if the requirement for these side chains to form
intramolecular hydrogen bonds is associated with changes in backbone direction,
e.g. for stabilizing turns or long-range -strand contacts57. Similarly, the strong
association between glycine and rigidity could be related to its favourability for
forming type-II -turns. Thus, while the vast Ramachandran space available to
glycine is often associated with local flexibility, the results here suggest that this also
gives it the ability to facilitate globally rigid structures that can effectively bury
surface area and stabilize their folds.
Quaternary structure errors are associated with high apparent
flexibility
Careful examination of the unit cells of monomeric crystal structures with high Arel
values suggested that some of these were actually homo-oligomeric, with the
monomeric biological unit likely being assigned in error. For example, the structure
of TrmD (PDB ID: 1P9P) is shown in Figure 5A. This structure has an author-
assigned monomeric biological unit with a high Arel value (1.29), yet it has been
manually annotated as a dimer in the PiQSi database of manually curated
quaternary structure (QS)64 and is also predicted to be dimer by PISA65.
To investigate the relationship between apparent flexibility and the propensity for QS
misassignments, correctly and incorrectly assigned monomers were identified from
PiQSi. On average, confirmed monomers tend have lower Arel values (1.01) than
those assigned in error (1.08, P = 2 x 10⁻⁶, Wilcoxon test), thus demonstrating that
incorrectly assigned monomers are associated with greater apparent flexibility.
Figure 5B shows the frequency of QS errors for proteins grouped by Arel values.
Notably, there is a strong tendency for the frequency of QS errors to increase with
higher Arel. Thus while Arel alone would not be able to absolutely identify QS errors,
this plot can be used to roughly assess the likelihood that an apparently monomeric
protein with a given Arel value is the result of a QS misassignment. This could
13
potentially be of considerable use in QS-prediction algorithms, which incorporate
many factors.
Intrinsic flexibility is a major determinant of crystal structure
resolution
Decades of experience have shown that flexible proteins are generally difficult to
crystallize. Therefore, it is natural to ask whether there might be a relationship
between the intrinsic flexibility of a protein and the resolution of its crystal structure.
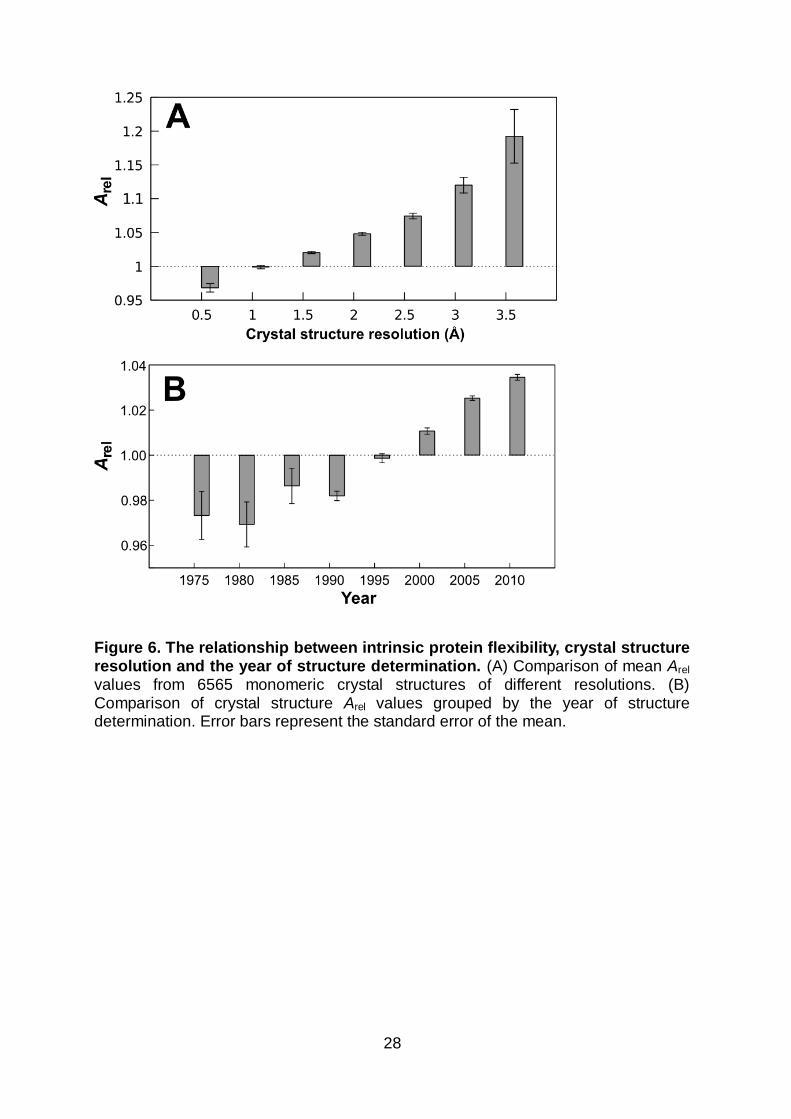
Figure 6A plots the mean Arel values for monomeric crystal structures grouped by
resolution. Interestingly, there is a marked tendency for proteins with lower
resolution crystal structures to be more flexible. For instance, very high-resolution
monomers (< 1 Å) have a mean Arel of 0.97, compared to 1.19 for those of low
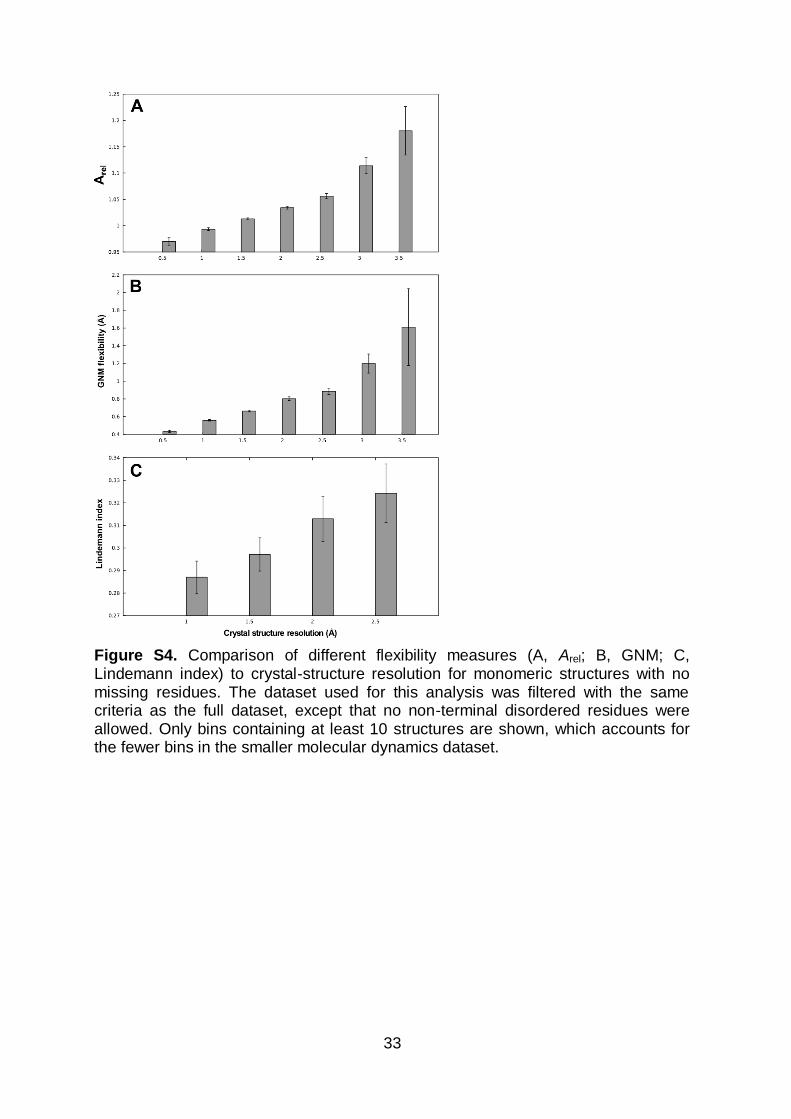
resolution (≥ 3.5 Å) (P = 4 x 10⁻⁸, Wilcoxon test). This relationship is preserved even
when only crystal structures with no disordered residues are considered and is also
confirmed with different measures of flexibility (Figure S4).
An interesting consequence of this result is that, as protein crystallography has
experienced methodological improvements, the ability to solve lower resolution
crystal structures and thus probe more flexible regions of protein conformational
space has improved. Figure 6B shows the mean Arel values of monomeric crystal
structures solved over time. A clear tendency is observed for more recently
determined crystal structures to represent more flexible proteins. Therefore, as
experimental and computational methods for modelling lower resolution crystal
structures continue to improve66, the available coverage of the protein dynamics
continuum will continue to broaden.
Residue-specific Arel reflects local flexibility
Since Arel is based upon the total solvent accessible surface area, it therefore
provides no information on local protein flexibility. However, we can easily employ a
residue-specific local Arel measure, defining it as the ratio of the observed solvent
accessible surface area for a residue to the expected unfolded-state value for that
amino acid type15. Similar approaches have been used in the past, for instance in
defining buried and accessible residues67. In addition, local solvent accessibility is
known to be closely related to B factors from crystal structures68–70 and order
parameters from NMR relaxation experiments71. Therefore, to complement the
14
above global analyses, local Arel values have been compared to residue-specific
flexibility values derived from normal mode analysis, NMR ensemble models and
chemical shifts.
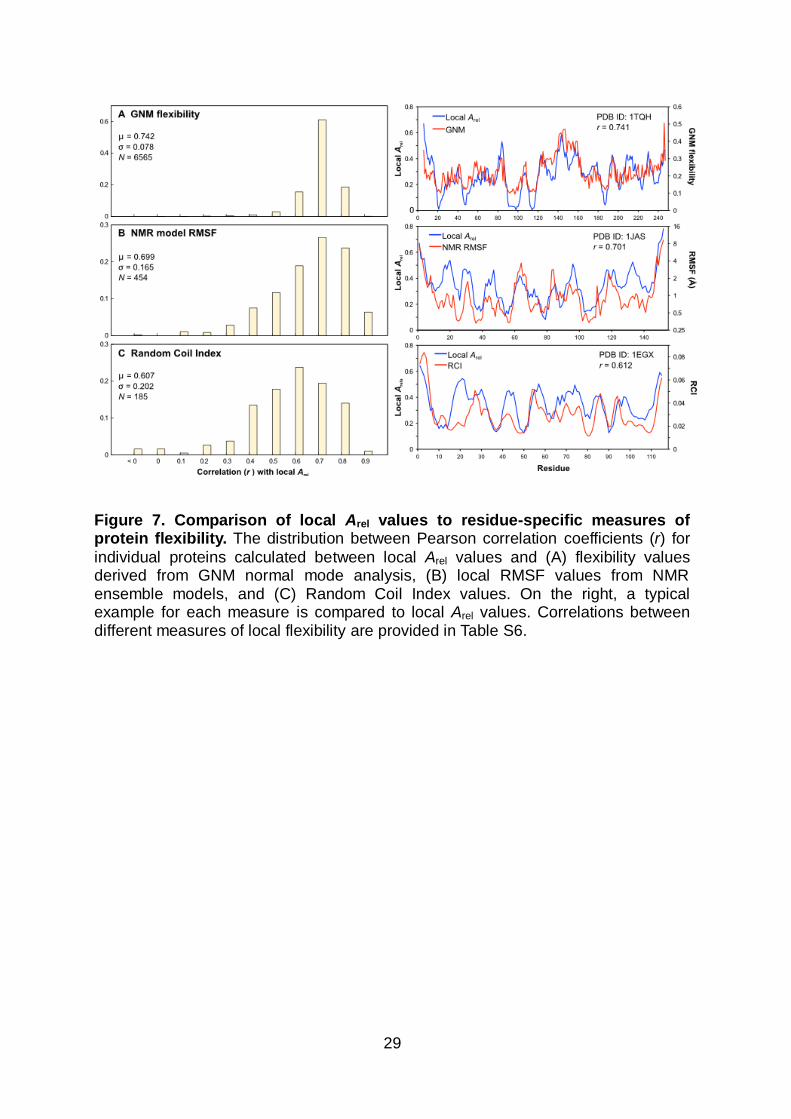
The distributions of Pearson correlation coefficients calculated for individual proteins
between local Arel values and local flexibilities calculated from different methods are
shown in Figure 7A-C. Overall, mean correlations of 0.74 for GNM, 0.70 for RMSF
and 0.61 for RCI are observed. Thus local Arel provides fairly reasonable predictions
of local flexibility for all of these methods. The origin of this relationship is the same
as discussed earlier for global flexibility: proteins with lower local Arel values bury
more surface area, making more extensive intramolecular contacts, and are thus
more motionally restricted. In effect, local Arel here is functioning similarly to the
simple contact models showing that flexibility is primarily determined by local contact
density, thus allowing prediction of B factors, NMR order parameters72,73 or intrinsic
disorder51,52.
Conclusion
Although it has long been clear that protein flexibility is important for function,
characterizing this flexibility can be difficult. Here it is shown that Arel, which
functions essentially as a proxy for how much surface area a protein buries within its
fold, correlates remarkably well with different measures of intrinsic protein flexibility.
This allows the easy assessment of protein flexibility in a quantitative manner from
the large number of protein structures now available, and has revealed new insight
into the relationships between protein flexibility, sequence and structure. Many more
topics of inquiry remain open for future exploration, relating to diverse aspects of
protein structure, function, sequence and evolution.
The major advantage of Arel as a probe of protein flexibility is its simplicity. It can be
quickly and easily calculated from any protein structure. Furthermore, its correlation
with intrinsic flexibility arises directly from the fundamental energetics of protein
folding, so its utility is not merely empirical. While treating surface area uniformly
works remarkably well for many purposes, it is possible that a model considering the
specific properties of a protein's surface could provide a better probe of flexibility.
However, the fact that Arel correlates as good or better with different measures of
intrinsic flexibility than they do with each other suggests that any room for
15
improvement with a more complex model should be minimal.
Another potential issue relevant to this study relates to crystallographic disorder,
which results in residues missing from the crystal structures. Since this study dealt
primarily with structure-based measures of flexibility here, the effect of ignoring
disordered residues should be small. However, in principle, disordered residues
could be dealt with, either by explicit modelling74, or by simply assigning them
statistical accessibilities, with the assumption that they do not form any non-local
contacts. Importantly, all trends in this study are retained when considering only
high-confidence monomers with no disordered residues.
Previously, Arel values of both monomeric proteins and bound subunits were used to
predict protein conformational changes upon binding14. Analysis of the free/bound
pairs shows a very strong correlation between the Arel values of monomeric proteins
and their Arel values in the bound state. This suggests that, in addition to their utility
for predicting conformational changes upon binding, the Arel values of bound
subunits are predictive of the flexibility of proteins in their free states, thus facilitating
large-scale analyses of how intrinsic flexibility relates to protein complex assembly
from the structures of protein complexes.
Finally, it is interesting to note that the unique amino acid properties associated with
intrinsic flexibility appear to be distinct from intrinsic disorder. Given the success of
intrinsic disorder predictors, it is tempting to speculate that a sequence-based
predictor of flexibility could be developed using Arel values as a training set.
Previously B factors have been used in a similar manner to train sequence-based
flexibility predictors75,76, although the amino acids associated with high B factors are
quite different than the sequence determinants of flexibility observed here, likely due
to the differences between global and local flexibility. It is possible that the
topological complexity of protein folds might inhibit a sequence-based predictor of
folded protein flexibility, as compared to intrinsically disordered proteins where the
amino acid composition can sometimes be more important than the specific linear
sequence77. However, the availability of a sequence-based predictor would facilitate
genome-scale analyses of the relationships between protein flexibility, function and
evolution.
16
Methods
Monomer datasets
All monomeric crystal structure biological units containing at least 30 residues were
taken from Protein Data Bank on 2012-08-08, excluding backbone-only models. The
set of high-confidence monomers (used for fitting the relationship in Figure 1A)
included only monomers with SCOP 1.75 domain assignments58 in order to
specifically exclude structures in the classes “membrane and cell surface proteins
and peptides”, “small proteins”, “coiled coil proteins”, “low resolution protein
structures”, “peptides” and “designed proteins”. In addition, only proteins which had
a single chain in the asymmetric unit and which were predicted to be monomeric by
PISA65 were considered. Furthermore, structures which contained >= 1% non-
protein atoms were excluded. Finally, proteins in which any non-terminal residues
were missing from the crystal structure (i.e. disordered) were excluded.
The full crystal-structure dataset used for most of this paper also included only
proteins that were predicted to be monomeric by PISA, and excluded structures
which contained >= 10% non-protein atoms. In addition, any structures containing a
large number of missing, non-terminal residues (containing any stretches of > 20
missing residues, or > 50 missing residues in total) were excluded. For the dataset
used in the QS-assignment analysis, the same criteria were used, except for the
condition that proteins be PISA-predicted monomers.
The NMR ensemble models were taken from the RECOORD database and have all
been recalculated using a uniform protocol and refined in water44.
For all datasets, sequence redundancy filtering was performed at a level of 90%
identity, after the above criteria were applied. This left 907 non-redundant proteins in
the high-confidence set, 6565 in the full set, 491 with MoDEL parameters, 454 in the
NMR set and 267 in the set with PiQSi QS assignments. All protein structures and
relevant parameters related to these analyses are provided in Table S7.
Structural and flexibility calculations
Solvent accessible surface area
Solvent accessible surface area was calculated from each crystal structure and
17
each NMR model ensemble member using AREAIMOL78. For calculating Arel, the
solvent accessible surface area was averaged over all NMR ensemble members.
For the local Arel calculations, the unfolded-state values of Miller et al. were used15,
and values were averaged over a seven-residue window. All correlations with Arel
were calculated using the log of the flexibility parameters, consistent with what was
done previously for conformational changes14 since this tends to give much more
linear relationships.
Normal mode analysis
The Gaussian network model37 was used with default parameters and considering
only backbone C atoms. For each protein, n normal modes are calculated with
GNM for a protein with n + 1 residues. The flexibility of each protein was calculated
as the average of the inverse eigenvalue (i.e. frequency, i) of each normal mode
(Equation 3). This value therefore represents the mean amplitude of a protein’s
normal modes.
GNM (global)=
1/wi
i
n
å
n (3)
The residue-specific flexibility for residue j is given in Equation 4, where aij is the
displacement of residue j under mode i.
GNM (local) j =aij
wii
n
å (4)
NMR models
For each NMR ensemble model, the residue-averaged RMSF was calculated
according to Equation 5, where dij is the distance between each backbone C atom
i from conformer j and the ensemble-averaged position of that atom, m is the total
number of conformers in the ensemble, and n is the total number of residues in the
protein.

18
RMSF =
dij2
j
m
å
mi
n
å
n (5)
Molecular dynamics simulations
All parameters were taken directly from the MoDEL database and were calculated
from 10 ns trajectories using AMBER8 or AMBER9 with parm99 force field and
TIP3P water model45. Because trajectories in MoDEL were only calculated for a
limited subset of all available monomeric proteins, a separate 90% sequence
identity redundancy filtering was performed with these proteins.
NMR chemical shifts
The BioMagResBank79 was searched for sets of chemical shifts that corresponded
to our non-redundant NMR models. In total, chemical shifts were available for 185 of
these proteins. The Random Coil Index (RCI) values were then calculated from
these chemical shifts using the RCI web server47. For the global RCI measure, the
residue-specific values were averaged over all positions.
Acknowledgements
I thank Tim Meyer from providing data from MoDEL and Sarah Teichmann, Julie
Forman-Kay, Tina Perica and A.J Venkatakrishnan for valuable comments on the
manuscript. This work was supported by a Long-term Fellowship from the Human
Frontier Science Program.
References
1. Henzler-Wildman, K. & Kern, D. (2007). Dynamic personalities of proteins. Nature 450, 964–972
2. Frauenfelder, H., Sligar, S.G. & Wolynes, P.G. (1991). The energy landscapes and motions of proteins. Science 254, 1598–1603
3. Tsai, C.J., Kumar, S., Ma, B. & Nussinov, R. (1999). Folding funnels, binding funnels, and protein function. Protein Sci 8, 1181–1190
4. Tsai, J., Taylor, R., Chothia, C. & Gerstein, M. (1999). The packing density in proteins: standard radii and volumes. J. Mol. Biol. 290, 253–266
5. Gerstein, M., Lesk, A.M. & Chothia, C. (1994). Structural mechanisms for domain movements in proteins. Biochemistry 33, 6739–6749
6. Wright, P.E. & Dyson, H.J. (1999). Intrinsically unstructured proteins: re-
19
assessing the protein structure-function paradigm. J. Mol. Biol 293, 321–331
7. Uversky, V.N., Gillespie, J.R. & Fink, A.L. (2000). Why are “natively unfolded” proteins unstructured under physiologic conditions? Proteins 41, 415–427
8. Dunker, A.K., Lawson, J.D., Brown, C.J., Williams, R.M., Romero, P., Oh, J.S., Oldfield, C.J., Campen, A.M., Ratliff, C.M., Hipps, K.W., Ausio, J., Nissen, M.S., Reeves, R., Kang, C., Kissinger, C.R., Bailey, R.W., Griswold, M.D., Chiu, W., Garner, E.C. & Obradovic, Z. (2001). Intrinsically disordered protein. J. Mol. Graph. Model 19, 26–59
9. Marsh, J.A. & Forman-Kay, J.D. (2012). Ensemble modeling of protein disordered states: Experimental restraint contributions and validation. Proteins 80, 556–572
10. Schneider, R., Huang, J., Yao, M., Communie, G., Ozenne, V., Mollica, L., Salmon, L., Jensen, M.R. & Blackledge, M. (2012). Towards a robust description of intrinsic protein disorder using nuclear magnetic resonance spectroscopy. Mol Biosyst 8, 58–68
11. Fisher, C.K. & Stultz, C.M. (2011). Protein structure along the order–disorder continuum. J Am Chem Soc 133, 10022–10025
12. Marsh, J.A., Teichmann, S.A. & Forman-Kay, J.D. (2012). Probing the diverse landscape of protein flexibility and binding. Curr. Opin. Struct. Biol 22, 643–650
13. Hensen, U., Meyer, T., Haas, J., Rex, R., Vriend, G. & Grubmüller, H. (2012). Exploring protein dynamics space: the dynasome as the missing link between protein structure and function. PLoS ONE 7, e33931
14. Marsh, J.A. & Teichmann, S.A. (2011). Relative solvent accessible surface area predicts protein conformational changes upon binding. Structure 19, 859–867
15. Miller, S., Janin, J., Lesk, A.M. & Chothia, C. (1987). Interior and surface of monomeric proteins. J. Mol. Biol 196, 641–656
16. Teller, D.C. (1976). Accessible area, packing volumes and interaction surfaces of globular proteins. Nature 260, 729–731
17. Janin, J. (1976). Surface area of globular proteins. J. Mol. Biol 105, 13–14
18. Miller, S., Lesk, A.M., Janin, J. & Chothia, C. (1987). The accessible surface area and stability of oligomeric proteins. Nature 328, 834–836
19. Fischer, H., Polikarpov, I. & Craievich, A.F. (2004). Average protein density is a molecular-weight-dependent function. Protein Sci 13, 2825–2828
20. Liang, J. & Dill, K.A. (2001). Are proteins well-packed? Biophys. J 81, 751–766 21. Kauzmann, W. (1959). Some factors in the interpretation of protein denaturation.
Adv. Protein Chem. 14, 1–63 22. Chothia, C. (1975). Structural invariants in protein folding. Nature 254, 304–308
23. Dill, K.A. & MacCallum, J.L. (2012). The protein-folding problem, 50 years on. Science 338, 1042–1046
24. Novotny, M., Seibert, M. & Kleywegt, G.J. (2007). On the precision of calculated solvent-accessible surface areas. Acta Crystallogr. D Biol. Crystallogr. 63, 270–
274 25. Chothia, C. (1974). Hydrophobic bonding and accessible surface area in
proteins. Nature 248, 338–339 26. Loladze, V.V., Ermolenko, D.N. & Makhatadze, G.I. (2002). Thermodynamic
consequences of burial of polar and non-polar amino acid residues in the protein interior. J. Mol. Biol. 320, 343–357
27. McDonald, I.K. & Thornton, J.M. (1994). Satisfying hydrogen bonding potential in proteins. J. Mol. Biol. 238, 777–793
28. Takano, K., Yamagata, Y. & Yutani, K. (2001). Contribution of polar groups in the
20
interior of a protein to the conformational stability. Biochemistry 40, 4853–4858
29. Eyal, E., Najmanovich, R., McConkey, B.J., Edelman, M. & Sobolev, V. (2004). Importance of solvent accessibility and contact surfaces in modeling side-chain conformations in proteins. J Comput Chem 25, 712–724
30. Levy, E.D., Erba, E.B., Robinson, C.V. & Teichmann, S.A. (2008). Assembly reflects evolution of protein complexes. Nature 453, 1262–1265
31. Marsh, J.A., Hernández, H., Hall, Z., Ahnert, S., Perica, T., Robinson, C.V. & Teichmann, S.A. (2013). Protein complexes are under evolutionary selection to assemble via ordered pathways. Cell 153, 461–470
32. Ahmed, A., Villinger, S. & Gohlke, H. (2010). Large-scale comparison of protein essential dynamics from molecular dynamics simulations and coarse-grained normal mode analyses. Proteins 78, 3341–3352
33. Bahar, I. & Rader, A.J. (2005). Coarse-grained normal mode analysis in structural biology. Curr. Opin. Struct. Biol. 15, 586–592
34. Rueda, M., Chacón, P. & Orozco, M. (2007). Thorough validation of protein normal mode analysis: a comparative study with essential dynamics. Structure 15, 565–575
35. Tama, F. & Sanejouand, Y.H. (2001). Conformational change of proteins arising from normal mode calculations. Protein Eng. 14, 1–6
36. Mendez, R. & Bastolla, U. (2010). Torsional network model: normal modes in torsion angle space better correlate with conformation changes in proteins. Phys. Rev. Lett. 104, 228103
37. Bahar, I., Wallqvist, A., Covell, D.G. & Jernigan, R.L. (1998). Correlation between native-state hydrogen exchange and cooperative residue fluctuations from a simple model. Biochemistry 37, 1067–1075
38. Suhre, K. & Sanejouand, Y.-H. (2004). ElNemo: a normal mode web server for protein movement analysis and the generation of templates for molecular replacement. Nucleic Acids Research 32, W610–W614
39. Dobbins, S.E., Lesk, V.I. & Sternberg, M.J.E. (2008). Insights into protein flexibility: The relationship between normal modes and conformational change upon protein-protein docking. Proc. Natl. Acad. Sci. U.S.A 105, 10390–10395
40. Yang, L.-W., Eyal, E., Chennubhotla, C., Jee, J., Gronenborn, A.M. & Bahar, I. (2007). Insights into equilibrium dynamics of proteins from comparison of NMR and X-ray data with computational predictions. Structure 15, 741–749
41. Abseher, R., Horstink, L., Hilbers, C.W. & Nilges, M. (1998). Essential spaces defined by NMR structure ensembles and molecular dynamics simulation show significant overlap. Proteins 31, 370–382
42. Philippopoulos, M. & Lim, C. (1999). Exploring the dynamic information content of a protein NMR structure: Comparison of a molecular dynamics simulation with the NMR and X-ray structures of Escherichia coli ribonuclease HI. Proteins 36, 87–110
43. Andersen, C.A.F., Palmer, A.G., Brunak, S. & Rost, B. (2002). Continuum secondary structure captures protein flexibility. Structure 10, 175–184
44. Nederveen, A.J., Doreleijers, J.F., Vranken, W., Miller, Z., Spronk, C.A.E.M., Nabuurs, S.B., Güntert, P., Livny, M., Markley, J.L., Nilges, M., Ulrich, E.L., Kaptein, R. & Bonvin, A.M.J.J. (2005). RECOORD: A recalculated coordinate database of 500+ proteins from the PDB using restraints from the BioMagResBank. Proteins 59, 662–672
45. Meyer, T., D’Abramo, M., Hospital, A., Rueda, M., Ferrer-Costa, C., Pérez, A., Carrillo, O., Camps, J., Fenollosa, C., Repchevsky, D., Gelpí, J.L. & Orozco, M.
21
(2010). MoDEL (Molecular Dynamics Extended Library): a database of atomistic molecular dynamics trajectories. Structure 18, 1399–1409
46. Zhou, Y., Vitkup, D. & Karplus, M. (1999). Native proteins are surface-molten solids: application of the lindemann criterion for the solid versus liquid state. J Mol Biol 285, 1371–1375
47. Berjanskii, M.V. & Wishart, D.S. (2005). A simple method to predict protein flexibility using secondary chemical shifts. J. Am. Chem. Soc. 127, 14970–14971
48. Bernado, P., Modig, K., Grela, P., Svergun, D.I., Tchorzewski, M., Pons, M. & Akke, M. (2010). Structure and Dynamics of Ribosomal Protein L12: An Ensemble Model Based on SAXS and NMR Relaxation. Biophys J 98, 2374–2382
49. Gunasekaran, K., Tsai, C.-J. & Nussinov, R. (2004). Analysis of ordered and disordered protein complexes reveals structural features discriminating between stable and unstable monomers. J. Mol. Biol 341, 1327–1341
50. Dosztányi, Z., Csizmók, V., Tompa, P. & Simon, I. (2005). The pairwise energy content estimated from amino acid composition discriminates between folded and intrinsically unstructured proteins. J. Mol. Biol 347, 827–839
51. Garbuzynskiy, S.O., Lobanov, M.Y. & Galzitskaya, O.V. (2004). To be folded or to be unfolded? Protein Sci. 13, 2871–2877
52. Galzitskaya, O.V., Garbuzynskiy, S.O. & Lobanov, M.Y. (2006). Prediction of amyloidogenic and disordered regions in protein chains. PLoS Comput. Biol. 2,
e177 53. Bhardwaj, N. & Gerstein, M. (2009). Relating protein conformational changes to
packing efficiency and disorder. Protein Sci 18, 1230–1240 54. Mao, A.H., Crick, S.L., Vitalis, A., Chicoine, C.L. & Pappu, R.V. (2010). Net
charge per residue modulates conformational ensembles of intrinsically disordered proteins. Proc. Natl. Acad. Sci. U.S.A. 107, 8183–8188
55. Marsh, J.A. & Forman-Kay, J.D. (2010). Sequence determinants of compaction in intrinsically disordered proteins. Biophys. J 98, 2383–2390
56. Müller-Späth, S., Soranno, A., Hirschfeld, V., Hofmann, H., Rüegger, S., Reymond, L., Nettels, D. & Schuler, B. (2010). Charge interactions can dominate the dimensions of intrinsically disordered proteins. Proc. Natl. Acad. Sci. U.S.A. 107, 14609–14614
57. Levitt, M. (1978). Conformational preferences of amino acids in globular proteins. Biochemistry 17, 4277–4285
58. Murzin, A.G., Brenner, S.E., Hubbard, T. & Chothia, C. (1995). SCOP: a structural classification of proteins database for the investigation of sequences and structures. J. Mol. Biol 247, 536–540
59. Galzitskaya, O.V., Reifsnyder, D.C., Bogatyreva, N.S., Ivankov, D.N. & Garbuzynskiy, S.O. (2008). More compact protein globules exhibit slower folding rates. Proteins 70, 329–332
60. Ivankov, D.N., Bogatyreva, N.S., Lobanov, M.Y. & Galzitskaya, O.V. (2009). Coupling between properties of the protein shape and the rate of protein folding. PLoS ONE 4, e6476
61. Lobanov, M.I., Bogatyreva, N.S. & Galzitskaia, O.V. (2008). [Radius of gyration is indicator of compactness of protein structure]. Mol. Biol. (Mosk.) 42, 701–706
62. Bordo, D. & Argos, P. (1994). The role of side-chain hydrogen bonds in the formation and stabilization of secondary structure in soluble proteins. J. Mol. Biol. 243, 504–519
63. Glyakina, A.V., Bogatyreva, N.S. & Galzitskaya, O.V. (2011). Accessible surfaces
22
of beta proteins increase with increasing protein molecular mass more rapidly than those of other proteins. PLoS ONE 6, e28464
64. Levy, E.D. (2007). PiQSi: protein quaternary structure investigation. Structure 15, 1364–1367
65. Krissinel, E. & Henrick, K. (2007). Inference of macromolecular assemblies from crystalline state. J. Mol. Biol 372, 774–797
66. Schröder, G.F., Levitt, M. & Brunger, A.T. (2010). Super-resolution biomolecular crystallography with low-resolution data. Nature 464, 1218–1222
67. Levy, E.D. (2010). A simple definition of structural regions in proteins and its use in analyzing interface evolution. J. Mol. Biol. 403, 660–670
68. Carugo, O. & Argos, P. (1997). Correlation between side chain mobility and conformation in protein structures. Protein Eng. 10, 777–787
69. Sheriff, S., Hendrickson, W.A., Stenkamp, R.E., Sieker, L.C. & Jensen, L.H. (1985). Influence of solvent accessibility and intermolecular contacts on atomic mobilities in hemerythrins. Proc. Natl. Acad. Sci. U.S.A. 82, 1104–1107
70. Zhang, H., Zhang, T., Chen, K., Shen, S., Ruan, J. & Kurgan, L. (2009). On the relation between residue flexibility and local solvent accessibility in proteins. Proteins 76, 617–636
71. Buck, M., Boyd, J., Redfield, C., MacKenzie, D.A., Jeenes, D.J., Archer, D.B. & Dobson, C.M. (1995). Structural determinants of protein dynamics: analysis of 15N NMR relaxation measurements for main-chain and side-chain nuclei of hen egg white lysozyme. Biochemistry 34, 4041–4055
72. Halle, B. (2002). Flexibility and packing in proteins. Proc. Natl. Acad. Sci. U.S.A. 99, 1274–1279
73. Zhang, F. & Brüschweiler, R. (2002). Contact model for the prediction of NMR N-H order parameters in globular proteins. J. Am. Chem. Soc 124, 12654–12655
74. Marsh, J.A., Dancheck, B., Ragusa, M.J., Allaire, M., Forman-Kay, J.D. & Peti, W. (2010). Structural diversity in free and bound states of intrinsically disordered protein phosphatase 1 regulators. Structure 18, 1094–1103
75. Schlessinger, A. & Rost, B. (2005). Protein flexibility and rigidity predicted from sequence. Proteins 61, 115–126
76. Vihinen, M., Torkkila, E. & Riikonen, P. (1994). Accuracy of protein flexibility predictions. Proteins 19, 141–149
77. Fuxreiter, M. (2012). Fuzziness: linking regulation to protein dynamics. Mol Biosyst 8, 168–177
78. Collaborative Computational Project, Number 4 (1994). The CCP4 suite: programs for protein crystallography. Acta Crystallogr. D Biol. Crystallogr 50,
760–763 79. Ulrich, E.L., Akutsu, H., Doreleijers, J.F., Harano, Y., Ioannidis, Y.E., Lin, J.,
Livny, M., Mading, S., Maziuk, D., Miller, Z., Nakatani, E., Schulte, C.F., Tolmie, D.E., Kent Wenger, R., Yao, H. & Markley, J.L. (2007). BioMagResBank. Nucleic Acids Res 36, D402–D408
23
Figures
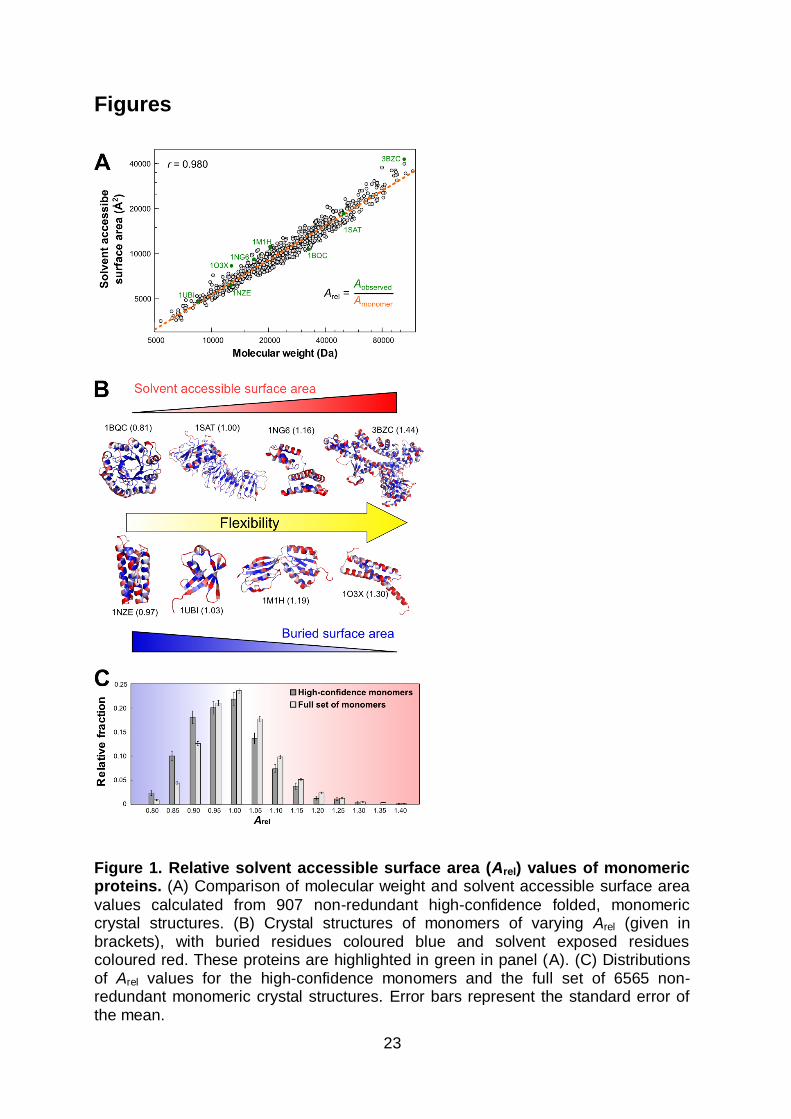
Figure 1. Relative solvent accessible surface area (Arel) values of monomeric proteins. (A) Comparison of molecular weight and solvent accessible surface area
values calculated from 907 non-redundant high-confidence folded, monomeric crystal structures. (B) Crystal structures of monomers of varying Arel (given in brackets), with buried residues coloured blue and solvent exposed residues coloured red. These proteins are highlighted in green in panel (A). (C) Distributions of Arel values for the high-confidence monomers and the full set of 6565 non-redundant monomeric crystal structures. Error bars represent the standard error of the mean.
24
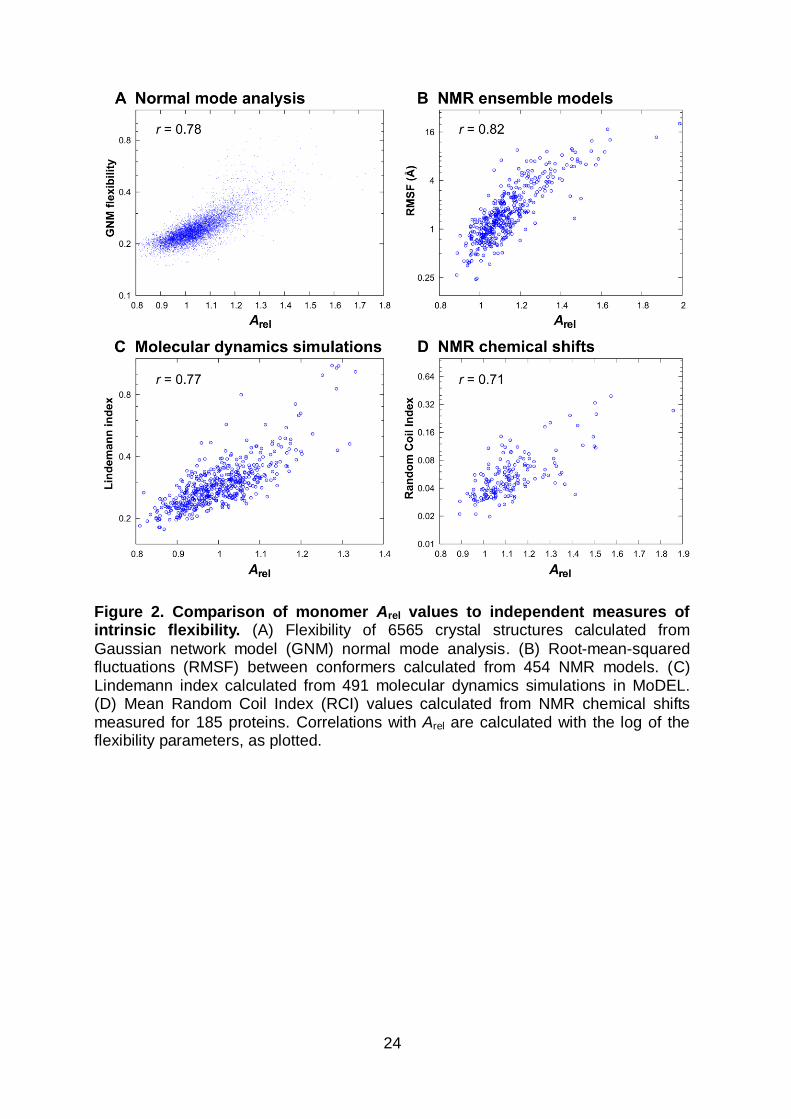
Figure 2. Comparison of monomer Arel values to independent measures of intrinsic flexibility. (A) Flexibility of 6565 crystal structures calculated from
Gaussian network model (GNM) normal mode analysis. (B) Root-mean-squared fluctuations (RMSF) between conformers calculated from 454 NMR models. (C) Lindemann index calculated from 491 molecular dynamics simulations in MoDEL. (D) Mean Random Coil Index (RCI) values calculated from NMR chemical shifts measured for 185 proteins. Correlations with Arel are calculated with the log of the flexibility parameters, as plotted.
25
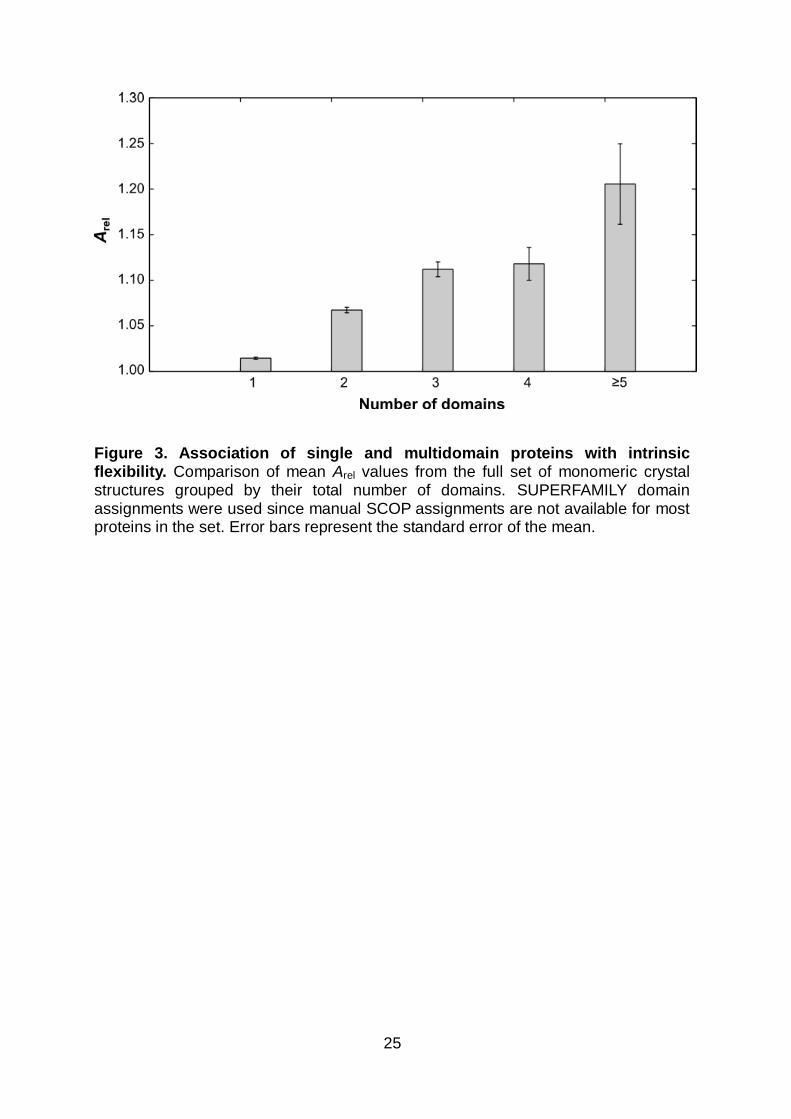
Figure 3. Association of single and multidomain proteins with intrinsic flexibility. Comparison of mean Arel values from the full set of monomeric crystal structures grouped by their total number of domains. SUPERFAMILY domain assignments were used since manual SCOP assignments are not available for most proteins in the set. Error bars represent the standard error of the mean.

26
Figure 4. Sequence and secondary structure propensities associated with intrinsic protein flexibility. (A) Pearson correlation coefficients (r) between the fractional amino acid content and Arel values of 6565 monomeric crystal structures. Error bars represent the standard error of the mean and were calculated from 1000 bootstrapping replicates in the same way as previously described 55. (B) Comparison of mean Arel values from monomeric crystal structures grouped by
SCOP class: all-, all-, + (segregated and regions) and / (-- units). Only proteins with a single SCOP domain assignment were considered. All P-values were calculated with the Wilcoxon rank-sum test. Error bar represent the standard error of the mean.
27
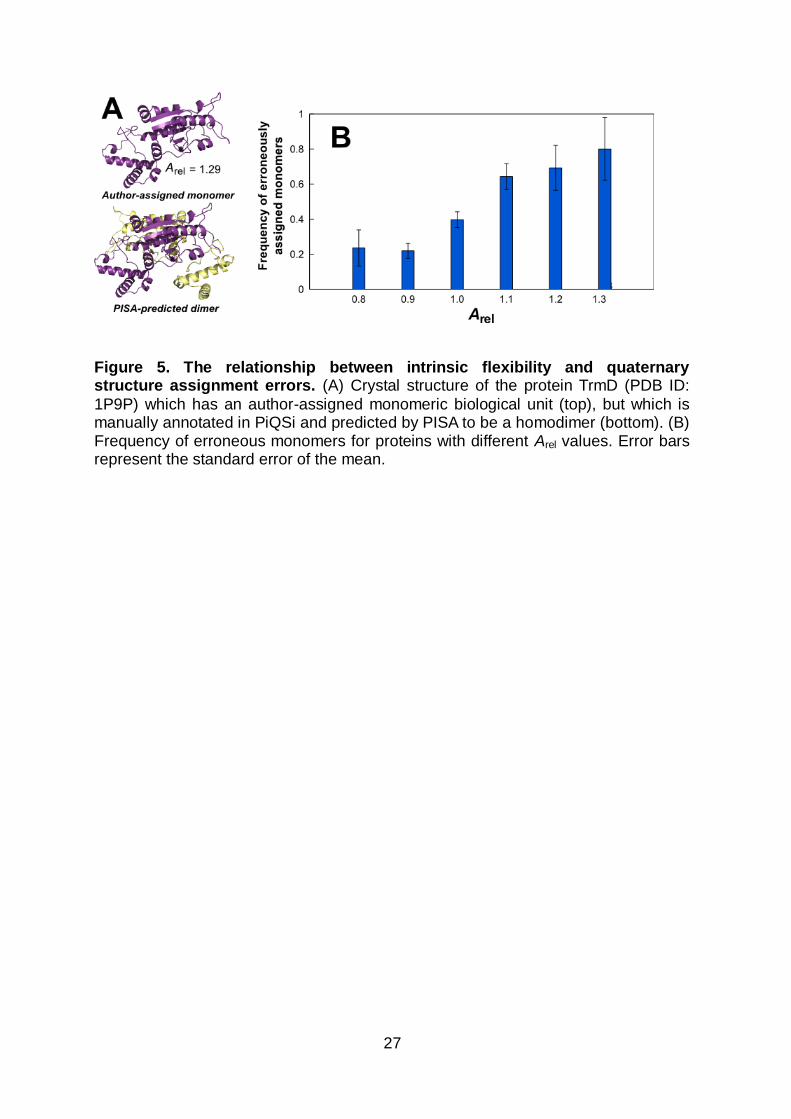
Figure 5. The relationship between intrinsic flexibility and quaternary structure assignment errors. (A) Crystal structure of the protein TrmD (PDB ID:
1P9P) which has an author-assigned monomeric biological unit (top), but which is manually annotated in PiQSi and predicted by PISA to be a homodimer (bottom). (B) Frequency of erroneous monomers for proteins with different Arel values. Error bars represent the standard error of the mean.
28
Figure 6. The relationship between intrinsic protein flexibility, crystal structure resolution and the year of structure determination. (A) Comparison of mean Arel values from 6565 monomeric crystal structures of different resolutions. (B) Comparison of crystal structure Arel values grouped by the year of structure determination. Error bars represent the standard error of the mean.
29
Figure 7. Comparison of local Arel values to residue-specific measures of protein flexibility. The distribution between Pearson correlation coefficients (r) for
individual proteins calculated between local Arel values and (A) flexibility values derived from GNM normal mode analysis, (B) local RMSF values from NMR ensemble models, and (C) Random Coil Index values. On the right, a typical example for each measure is compared to local Arel values. Correlations between different measures of local flexibility are provided in Table S6.
30
Supplementary Material
Figure S1. Comparison of Arel values from 489 non-redundant monomeric crystal
structures with the mean variance of C atoms calculated from MoDEL molecular dynamics simulations. Note that two of the proteins used for the Lindemann index comparison do not have variance values in MoDEL, thus explaining the slightly smaller dataset.

31
Figure S2. Correlations of different flexibility measures with amino acid and secondary structure content. (A) Exactly as in Figure 5A, except that different flexibility measures are used instead of Arel. Importantly, the trend of glycine < polar < hydrophobic < charged is largely preserved across different flexibility measures. There are, however, notable differences between the crystal structures and NMR models. In particular, histidine is associated with increased flexibility, probably reflecting the fact that NMR experiments are commonly performed in slightly acidic buffers in which the histidine side chain would be charged. Although RCI shows the largest deviations from Arel, note the large size of the error bars due to the much
smaller dataset. (B) Similar to (A), except that fractional -helix and -strand content
is used instead of amino acid content. Crucially, -helices are associated with
flexibility while -strands are associated with more rigid proteins using all measures of protein flexibility. Secondary structure content was calculated from protein structures with STRIDE1. Error bars represent standard error from 1000 bootstrapping replicates, as in Figure 4A.

32
Figure S3. Correlations between fractional amino acid content and Arel values for monomeric crystal structures from different SCOP classes. Note that although there are some differences, the main sequence determinants of flexibility are largely preserved across different secondary structural classes.
33
Figure S4. Comparison of different flexibility measures (A, Arel; B, GNM; C, Lindemann index) to crystal-structure resolution for monomeric structures with no missing residues. The dataset used for this analysis was filtered with the same criteria as the full dataset, except that no non-terminal disordered residues were allowed. Only bins containing at least 10 structures are shown, which accounts for the fewer bins in the smaller molecular dynamics dataset.
34
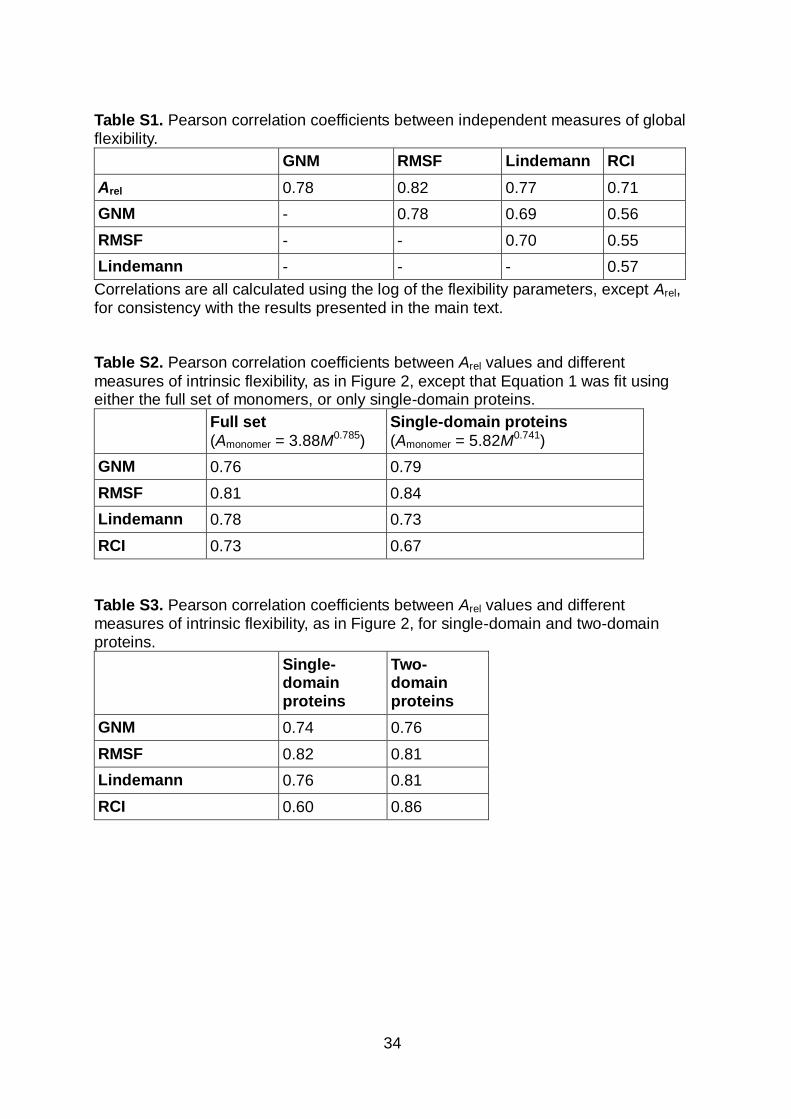
Table S1. Pearson correlation coefficients between independent measures of global flexibility.
GNM RMSF Lindemann RCI
Arel 0.78 0.82 0.77 0.71
GNM - 0.78 0.69 0.56
RMSF - - 0.70 0.55
Lindemann - - - 0.57
Correlations are all calculated using the log of the flexibility parameters, except Arel, for consistency with the results presented in the main text. Table S2. Pearson correlation coefficients between Arel values and different
measures of intrinsic flexibility, as in Figure 2, except that Equation 1 was fit using either the full set of monomers, or only single-domain proteins.
Full set
(Amonomer = 3.88M0.785)
Single-domain proteins
(Amonomer = 5.82M0.741)
GNM 0.76 0.79
RMSF 0.81 0.84
Lindemann 0.78 0.73
RCI 0.73 0.67
Table S3. Pearson correlation coefficients between Arel values and different measures of intrinsic flexibility, as in Figure 2, for single-domain and two-domain proteins.
Single-domain proteins
Two-domain proteins
GNM 0.74 0.76
RMSF 0.82 0.81
Lindemann 0.76 0.81
RCI 0.60 0.86
35
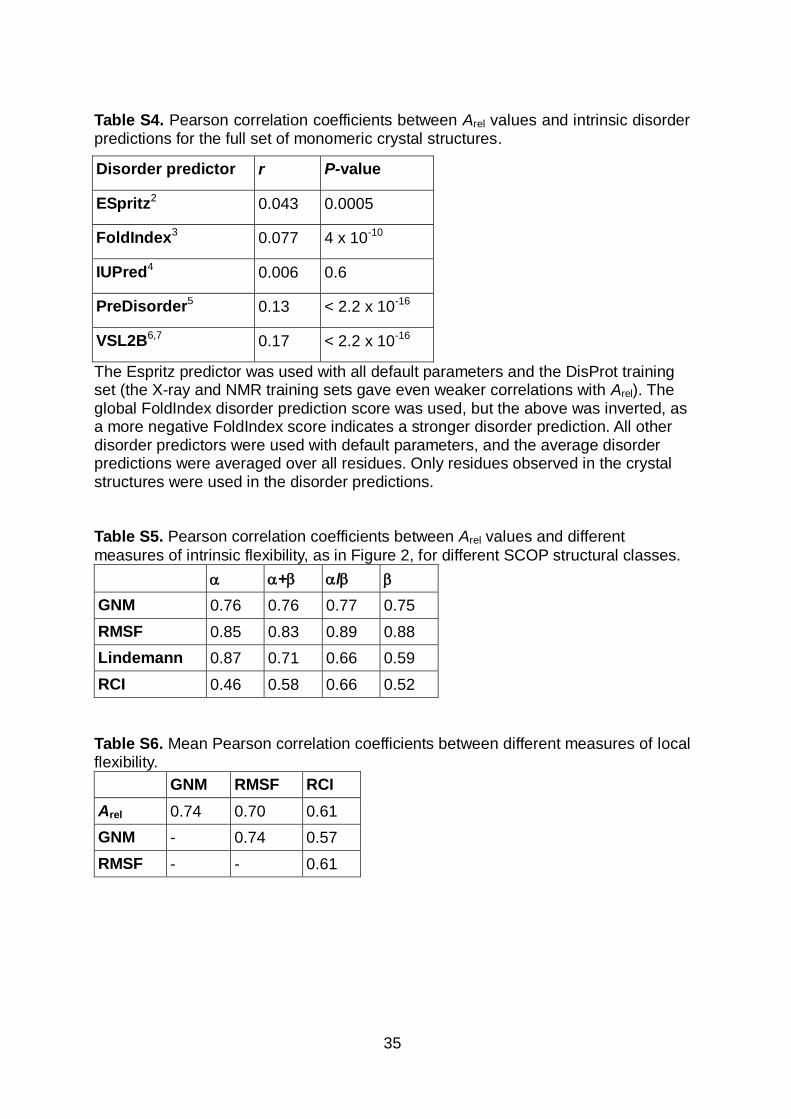
Table S4. Pearson correlation coefficients between Arel values and intrinsic disorder predictions for the full set of monomeric crystal structures.
Disorder predictor r P-value
ESpritz2 0.043 0.0005
FoldIndex3 0.077 4 x 10⁻¹⁰
IUPred4 0.006 0.6
PreDisorder5 0.13 < 2.2 x 10⁻¹⁶
VSL2B6,7 0.17 < 2.2 x 10⁻¹⁶
The Espritz predictor was used with all default parameters and the DisProt training set (the X-ray and NMR training sets gave even weaker correlations with Arel). The global FoldIndex disorder prediction score was used, but the above was inverted, as a more negative FoldIndex score indicates a stronger disorder prediction. All other disorder predictors were used with default parameters, and the average disorder predictions were averaged over all residues. Only residues observed in the crystal structures were used in the disorder predictions. Table S5. Pearson correlation coefficients between Arel values and different
measures of intrinsic flexibility, as in Figure 2, for different SCOP structural classes.
+ /
GNM 0.76 0.76 0.77 0.75
RMSF 0.85 0.83 0.89 0.88
Lindemann 0.87 0.71 0.66 0.59
RCI 0.46 0.58 0.66 0.52
Table S6. Mean Pearson correlation coefficients between different measures of local flexibility.
GNM RMSF RCI
Arel 0.74 0.70 0.61
GNM - 0.74 0.57
RMSF - - 0.61
36
Supplementary References
1. Frishman, D. & Argos, P. (1995). Knowledge-based protein secondary structure assignment. Proteins 23, 566–579
2. Walsh, I., Martin, A.J.M., Di Domenico, T. & Tosatto, S.C.E. (2012). ESpritz: accurate and fast prediction of protein disorder. Bioinformatics 28, 503–509
3. Prilusky, J., Felder, C.E., Zeev-Ben-Mordehai, T., Rydberg, E.H., Man, O., Beckmann, J.S., Silman, I. & Sussman, J.L. (2005). FoldIndex: a simple tool to predict whether a given protein sequence is intrinsically unfolded. Bioinformatics 21, 3435–3438
4. Dosztányi, Z., Csizmók, V., Tompa, P. & Simon, I. (2005). The pairwise energy content estimated from amino acid composition discriminates between folded and intrinsically unstructured proteins. J. Mol. Biol 347, 827–839
5. Deng, X., Eickholt, J. & Cheng, J. (2009). PreDisorder: ab initio sequence-based prediction of protein disordered regions. BMC Bioinformatics 10, 436
6. Obradovic, Z., Peng, K., Vucetic, S., Radivojac, P. & Dunker, A.K. (2005). Exploiting heterogeneous sequence properties improves prediction of protein disorder. Proteins 61 Suppl 7, 176–182
7. Peng, K., Radivojac, P., Vucetic, S., Dunker, A.K. & Obradovic, Z. (2006). Length-dependent prediction of protein intrinsic disorder. BMC Bioinformatics 7,
208