BURGER KING - LoopNet › d2 › fEjl2LMqUGqhNsmhWDvJ6K2hi88… · BURGER KING 167 S Main St •...
17
BURGER KING 167 S Main St • Albion, NY 14411 Representative Photo
Transcript of BURGER KING - LoopNet › d2 › fEjl2LMqUGqhNsmhWDvJ6K2hi88… · BURGER KING 167 S Main St •...

Offering Memorandum
BURGER KING167 S Main St • Albion, NY 14411
Representative Photo

N O N - E N D O R S E M E N T A N D D I S C L A I M E R N O T I C E
Confidentiality and DisclaimerThe information contained in the following Marketing Brochure is proprietary and strictly confidential. It is intended to be reviewed only by the party receiving it from Marcus & Millichap and
should not be made available to any other person or entity without the written consent of Marcus & Millichap. This Marketing Brochure has been prepared to provide summary, unverified
information to prospective purchasers, and to establish only a preliminary level of interest in the subject property. The information contained herein is not a substitute for a thorough due
diligence investigation. Marcus & Millichap has not made any investigation, and makes no warranty or representation, with respect to the income or expenses for the subject property, the
future projected financial performance of the property, the size and square footage of the property and improvements, the presence or absence of contaminating substances, PCB's or
asbestos, the compliance with State and Federal regulations, the physical condition of the improvements thereon, or the financial condition or business prospects of any tenant, or any
tenant's plans or intentions to continue its occupancy of the subject property. The information contained in this Marketing Brochure has been obtained from sources we believe to be
reliable; however, Marcus & Millichap has not verified, and will not verify, any of the information contained herein, nor has Marcus & Millichap conducted any investigation regarding these
matters and makes no warranty or representation whatsoever regarding the accuracy or completeness of the information provided. All potential buyers must take appropriate measures to
verify all of the information set forth herein. Marcus & Millichap is a service mark of Marcus & Millichap Real Estate Investment Services, Inc. © 2018 Marcus & Millichap. All rights reserved.
Non-Endorsement NoticeMarcus & Millichap is not affiliated with, sponsored by, or endorsed by any commercial tenant or lessee identified in this marketing package. The presence of any corporation's logo or
name is not intended to indicate or imply affiliation with, or sponsorship or endorsement by, said corporation of Marcus & Millichap, its affiliates or subsidiaries, or any agent, product,
service, or commercial listing of Marcus & Millichap, and is solely included for the purpose of providing tenant lessee information about this listing to prospective customers.
ALL PROPERTY SHOWINGS ARE BY APPOINTMENT ONLY.
PLEASE CONSULT YOUR MARCUS & MILLICHAP AGENT FOR MORE DETAILS.
BURGER KING
Albion, NY
ACT ID ZAA0280226
John KruegerRegional Manager, Manhattan, Lic.# 10311205789
2

N E T L E A S E D D I S C L A I M E R
Marcus & Millichap hereby advises all prospective purchasers of Net Leased property as follows:
The information contained in this Marketing Brochure has been obtained from sources we believe to be reliable. However, Marcus & Millichap has not and will
not verify any of this information, nor has Marcus & Millichap conducted any investigation regarding these matters. Marcus & Millichap makes no guarantee,
warranty or representation whatsoever about the accuracy or completeness of any information provided.
As the Buyer of a net leased property, it is the Buyer’s responsibility to independently confirm the accuracy and completeness of all material information before
completing any purchase. This Marketing Brochure is not a substitute for your thorough due diligence investigation of this investment opportunity. Marcus &
Millichap expressly denies any obligation to conduct a due diligence examination of this Property for Buyer.
Any projections, opinions, assumptions or estimates used in this Marketing Brochure are for example only and do not represent the current or future performance
of this property. The value of a net leased property to you depends on factors that should be evaluated by you and your tax, financial and legal advisors.
Buyer and Buyer’s tax, financial, legal, and construction advisors should conduct a careful, independent investigation of any net leased property to determine to
your satisfaction with the suitability of the property for your needs.
Like all real estate investments, this investment carries significant risks. Buyer and Buyer’s legal and financial advisors must request and carefully review all legal
and financial documents related to the property and tenant. While the tenant’s past performance at this or other locations is an important consideration, it is not
a guarantee of future success. Similarly, the lease rate for some properties, including newly-constructed facilities or newly-acquired locations, may be set based
on a tenant’s projected sales with little or no record of actual performance, or comparable rents for the area. Returns are not guaranteed; the tenant and any
guarantors may fail to pay the lease rent or property taxes, or may fail to comply with other material terms of the lease; cash flow may be interrupted in part or in
whole due to market, economic, environmental or other conditions. Regardless of tenant history and lease guarantees, Buyer is responsible for conducting
his/her own investigation of all matters affecting the intrinsic value of the property and the value of any long-term lease, including the likelihood of locating a
replacement tenant if the current tenant should default or abandon the property, and the lease terms that Buyer may be able to negotiate with a potential
replacement tenant considering the location of the property, and Buyer’s legal ability to make alternate use of the property.
By accepting this Marketing Brochure you agree to release Marcus & Millichap Real Estate Investment Services and hold it harmless from any kind of claim, cost,
expense, or liability arising out of your investigation and/or purchase of this net leased property.
3

TABLE OF CONTENTS
SECTION
INVESTMENT OVERVIEW 01Offering Summary
Location Overview
Regional and Local Map
Aerial Photo
FINANCIAL ANALYSIS 02Acquisition Financing
MARKET OVERVIEW 03Market Analysis
Demographic Analysis
BURGER KING
4

BURGER KING
5
INVESTMENT
OVERVIEW

OFFERING SUMMARY
Price $1,800,000
Net Operating Income $120,000
Capitalization Rate – Current 6.67%
Price / SF $514.29
Rent / SF $34.29
Lease Type Absolute Net
Gross Leasable Area 3,500 SF
Year Built / Renovated 2008 / 2019
Lot Size 0.84 acre(s)
#
EXECUTIVE SUMMARY
OFFERING SUMMARY
#
FINANCING
Down Payment All Cash
Net Cash Flow 6.67% / $120,000
Cash on Cash Return 6.67%
Total Return 6.67% / $120,000
BURGER KING
6
BURGER KING
6
OFFERING SUMMARY
MAJOR EMPLOYERS
EMPLOYER# OF EMPLOYEES
*
Albion Correctional Facility 600
Orleans Correctional Facility 500
Walmart 388
Orleans Community Health 233
Orleans Enterprises 210
Albion Central School District 200
Crfs 187
Nursing Home 170
Ace Hardware 148
Villages of Orleans The 141
Orleans County Nursing Home 140
Tops Friendly Markets 451 139
DEMOGRAPHICS
1-Miles 3-Miles 5-Miles
2018 Estimate Pop 5,247 9,831 12,535
2010 Census Pop 5,342 10,019 12,816
2018 Estimate HH 2,127 3,174 4,162
2010 Census HH 2,200 3,309 4,364
Median HH Income $37,795 $39,508 $43,517
Per Capita Income $20,087 $17,992 $20,211
Average HH Income $48,007 $51,143 $54,535
* # of Employees based on 5 mile radius

BURGER KING
OFFERING SUMMARY
Has Operated as Burger King in Same Location for 50 Years
New Concept Remodel Planned For End of 2019
Absolute NNN Sale-Leaseback
20 Year Base-3 (5) Year Options
Rent to Sales Ratio of 7.2% Contact L:isting Agent for Details
Franchise Guarantee by Operator (Family BK Franchisees for Over
30 Years)
5% Increases Every 5 Years
INVESTMENT HIGHLIGHTS
Marcus & Millichap is pleased to exclusively list a single tenant Burger King located in Albion (Orleans County), New York. Burger
King has been operating in this location since 1969. The approximately 3,500 square foot building is located at 167 South Main
Street and is within proximity to many national retail tenants, industrial corporations, educational institutions, and multi family
residential communities.
Albion is a village in Orleans County, New York, United States. The village is centrally located in the county and is partly within
the towns of both Albion and Gaines. It is the county seat of Orleans County and is home to multiple historical sites and scenic
spots. The Erie Canal passes through the community. Albion is the site of the junction of east-west highway NYS Route 31 (East
Avenue and West Avenue) and north-south highway NYS Route 98 (Main Street). NYS Route 279 joins NY-98 immediately north
of Albion.
The price of $1,800,000 represents a 6.67% Cap Rate.
INVESTMENT OVERVIEW
7
TENANT SUMMARY
#
Fiscal Year Ended December 31, 2017
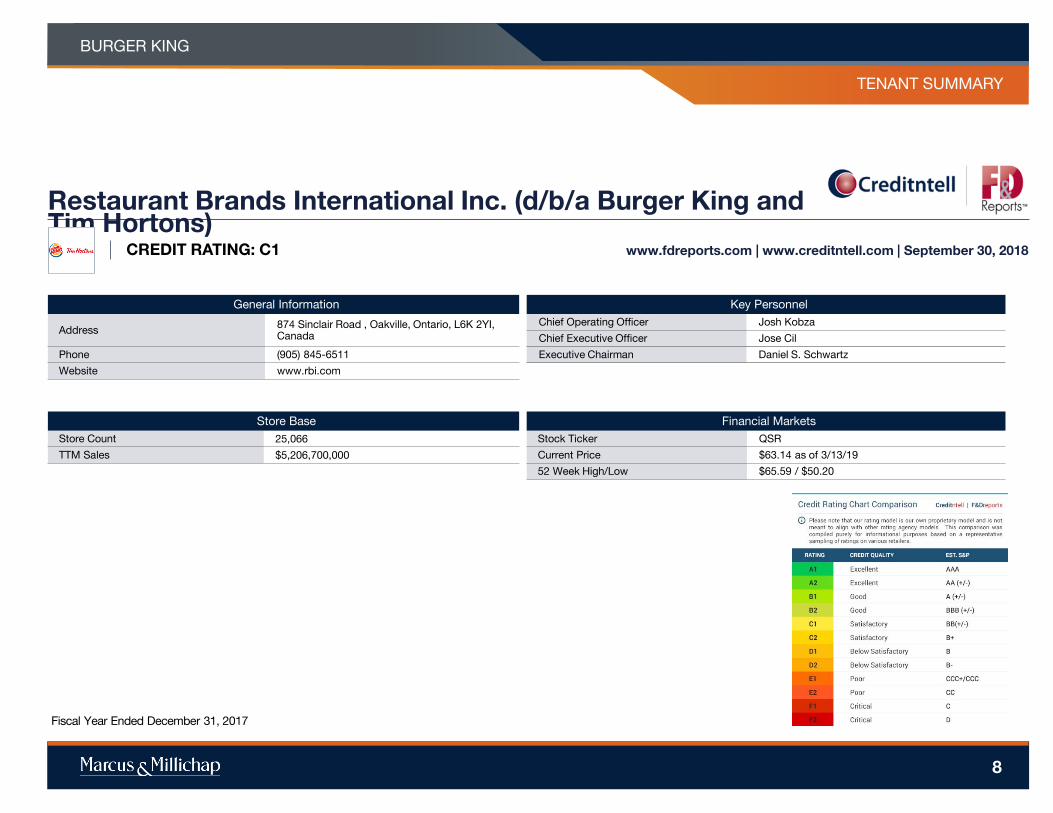
Restaurant Brands International Inc. (d/b/a Burger King and Tim Hortons)
CREDIT RATING: C1 www.fdreports.com | www.creditntell.com | September 30, 2018
PRICING AND VALUATION MATRIX
PROPERTY NAMEBURGER KING
PRICING AND VALUATION MATRIX
PROPERTY NAMEBURGER KING
8
TENANT SUMMARY
General Information
Address874 Sinclair Road , Oakville, Ontario, L6K 2YI, Canada
Phone (905) 845-6511
Website www.rbi.com
Store Base
Store Count 25,066
TTM Sales $5,206,700,000
Key Personnel
Chief Operating Officer Josh Kobza
Chief Executive Officer Jose Cil
Executive Chairman Daniel S. Schwartz
Financial Markets
Stock Ticker QSR
Current Price $63.14 as of 3/13/19
52 Week High/Low $65.59 / $50.20

#
167 S Main St, Albion, NY 14411
LOCATION OVERVIEWTENANT SUMMARYPRICING AND VALUATION MATRIX
PROPERTY NAMEBURGER KING
PRICING AND VALUATION MATRIX
PROPERTY NAMEBURGER KING
9
REGIONAL AND LOCAL MAP

AERIAL PHOTO
BURGER KING
10

BURGER KING
11
FINANCIAL
ANALYSIS

#
PROPERTY SUMMARY
OFFERING SUMMARY
#
NOTES
BURGER KING
12
OFFERING SUMMARY

MARCUS & MILLICHAP CAPITAL CORPORATION
CAPABILITIES
MMCC—our fully integrated, dedicated financing arm—is committed to
providing superior capital market expertise, precisely managed execution, and
unparalleled access to capital sources providing the most competitive rates and
terms.
We leverage our prominent capital market relationships with commercial banks,
life insurance companies, CMBS, private and public debt/equity funds, Fannie
Mae, Freddie Mac and HUD to provide our clients with the greatest range of
financing options.
Our dedicated, knowledgeable experts understand the challenges of financing
and work tirelessly to resolve all potential issues to the benefit of our clients.
National platform
operating
within the firm’s
brokerage
offices
$6.24 billion
billion total
national
volume in 2018
Access to
more capital
sources than
any other firm
in the industry
Optimum financing solutions
to enhance value
Our ability to enhance
buyer pool by expanding
finance options
Our ability to enhance
seller control
• Through buyer
qualification support
• Our ability to manage buyers
finance expectations
• Ability to monitor and
manage buyer/lender
progress, insuring timely,
predictable closings
• By relying on a world class
set of debt/equity sources
and presenting a tightly
underwritten credit file
WHY MMCC?
Closed 1,678
debt and equity
financings
in 2018
ACQUISITION FINANCING
BURGER KING
13
BURGER KING
14
MARKET
OVERVIEW
MARKET OVERVIEW
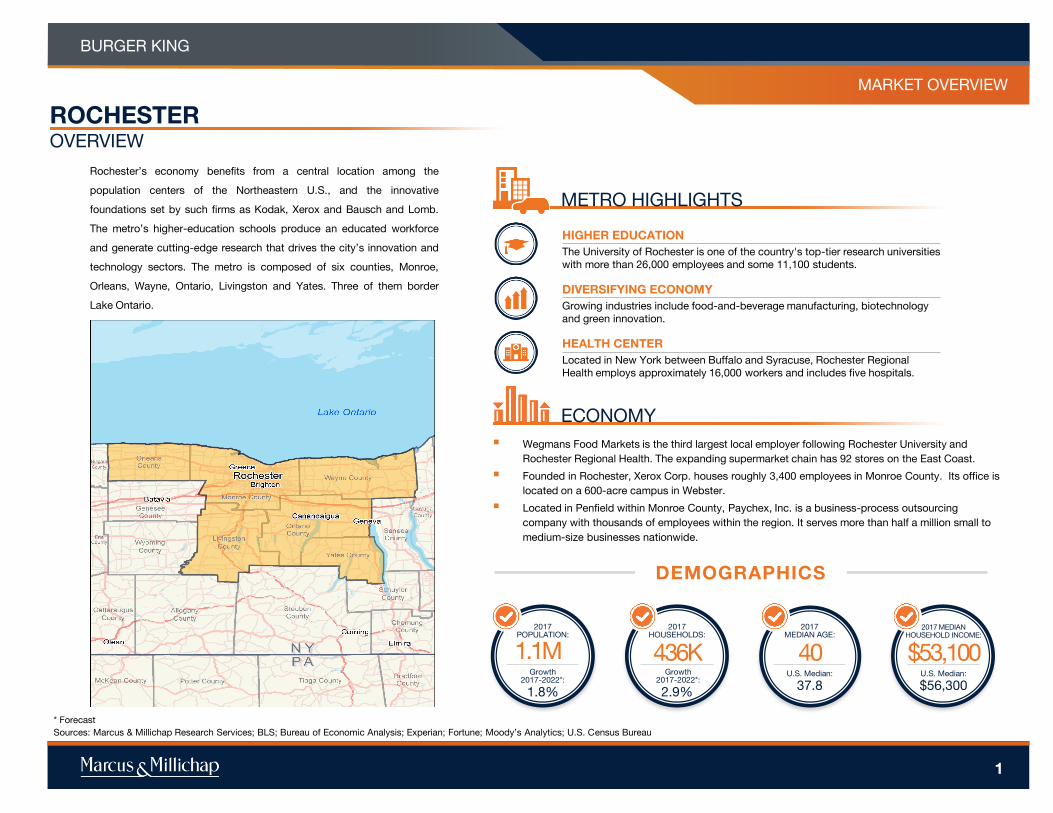
OVERVIEW
ROCHESTER
DEMOGRAPHICS
1
ECONOMY
METRO HIGHLIGHTS
* Forecast
Sources: Marcus & Millichap Research Services; BLS; Bureau of Economic Analysis; Experian; Fortune; Moody’s Analytics; U.S. Census Bureau
BURGER KING
Rochester’s economy benefits from a central location among the
population centers of the Northeastern U.S., and the innovative
foundations set by such firms as Kodak, Xerox and Bausch and Lomb.
The metro’s higher-education schools produce an educated workforce
and generate cutting-edge research that drives the city’s innovation and
technology sectors. The metro is composed of six counties, Monroe,
Orleans, Wayne, Ontario, Livingston and Yates. Three of them border
Lake Ontario.
Wegmans Food Markets is the third largest local employer following Rochester University and
Rochester Regional Health. The expanding supermarket chain has 92 stores on the East Coast.
Founded in Rochester, Xerox Corp. houses roughly 3,400 employees in Monroe County. Its office is
located on a 600-acre campus in Webster.
Located in Penfield within Monroe County, Paychex, Inc. is a business-process outsourcing
company with thousands of employees within the region. It serves more than half a million small to
medium-size businesses nationwide.
HIGHER EDUCATION
The University of Rochester is one of the country's top-tier research universities
with more than 26,000 employees and some 11,100 students.
DIVERSIFYING ECONOMY
Growing industries include food-and-beverage manufacturing, biotechnology
and green innovation.
HEALTH CENTER
Located in New York between Buffalo and Syracuse, Rochester Regional
Health employs approximately 16,000 workers and includes five hospitals.
1.1M
2017POPULATION:
436K
2017HOUSEHOLDS:
40
2017MEDIAN AGE:
$53,100
2017 MEDIAN HOUSEHOLD INCOME:
U.S. Median:
37.8U.S. Median:
$56,3002.9%
Growth2017-2022*:
1.8%
Growth2017-2022*:
PROPERTY NAME
MARKETING TEAM
BURGER KING
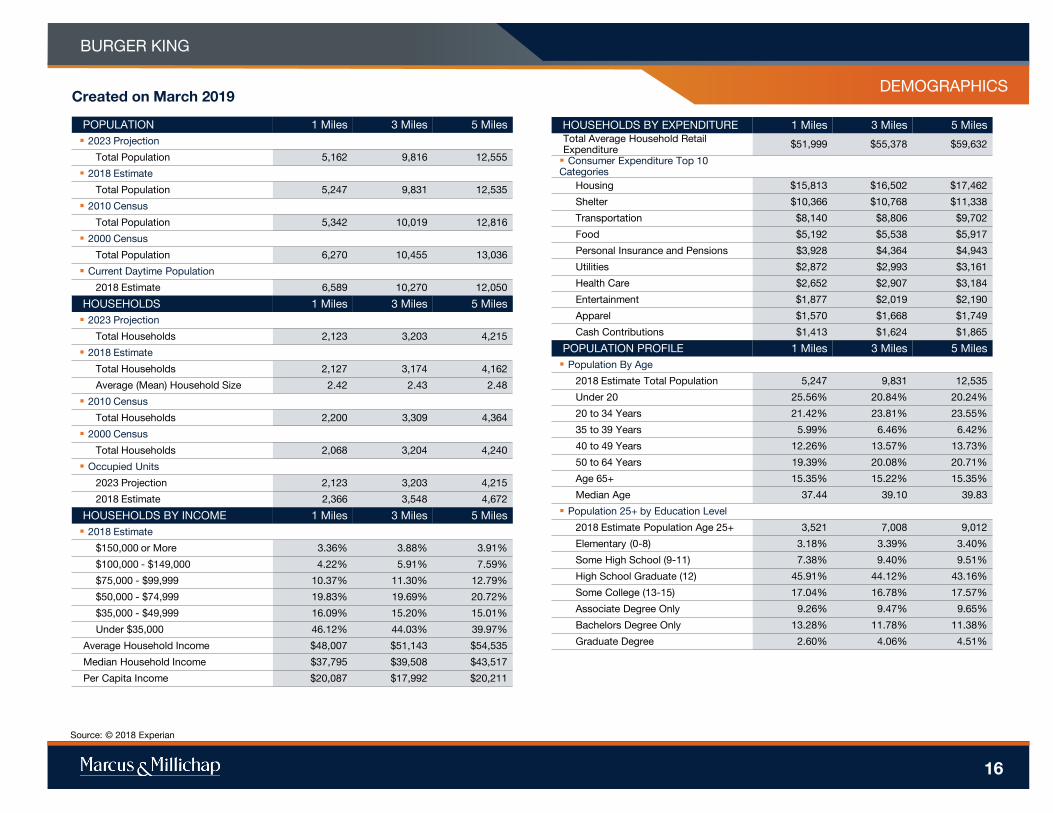
DEMOGRAPHICS
Source: © 2018 Experian
Created on March 2019
POPULATION 1 Miles 3 Miles 5 Miles
2023 Projection
Total Population 5,162 9,816 12,555
2018 Estimate
Total Population 5,247 9,831 12,535
2010 Census
Total Population 5,342 10,019 12,816
2000 Census
Total Population 6,270 10,455 13,036
Current Daytime Population
2018 Estimate 6,589 10,270 12,050
HOUSEHOLDS 1 Miles 3 Miles 5 Miles
2023 Projection
Total Households 2,123 3,203 4,215
2018 Estimate
Total Households 2,127 3,174 4,162
Average (Mean) Household Size 2.42 2.43 2.48
2010 Census
Total Households 2,200 3,309 4,364
2000 Census
Total Households 2,068 3,204 4,240
Occupied Units
2023 Projection 2,123 3,203 4,215
2018 Estimate 2,366 3,548 4,672
HOUSEHOLDS BY INCOME 1 Miles 3 Miles 5 Miles
2018 Estimate
$150,000 or More 3.36% 3.88% 3.91%
$100,000 - $149,000 4.22% 5.91% 7.59%
$75,000 - $99,999 10.37% 11.30% 12.79%
$50,000 - $74,999 19.83% 19.69% 20.72%
$35,000 - $49,999 16.09% 15.20% 15.01%
Under $35,000 46.12% 44.03% 39.97%
Average Household Income $48,007 $51,143 $54,535
Median Household Income $37,795 $39,508 $43,517
Per Capita Income $20,087 $17,992 $20,211
HOUSEHOLDS BY EXPENDITURE 1 Miles 3 Miles 5 Miles
Total Average Household Retail Expenditure
$51,999 $55,378 $59,632
Consumer Expenditure Top 10 Categories
Housing $15,813 $16,502 $17,462
Shelter $10,366 $10,768 $11,338
Transportation $8,140 $8,806 $9,702
Food $5,192 $5,538 $5,917
Personal Insurance and Pensions $3,928 $4,364 $4,943
Utilities $2,872 $2,993 $3,161
Health Care $2,652 $2,907 $3,184
Entertainment $1,877 $2,019 $2,190
Apparel $1,570 $1,668 $1,749
Cash Contributions $1,413 $1,624 $1,865
POPULATION PROFILE 1 Miles 3 Miles 5 Miles
Population By Age
2018 Estimate Total Population 5,247 9,831 12,535
Under 20 25.56% 20.84% 20.24%
20 to 34 Years 21.42% 23.81% 23.55%
35 to 39 Years 5.99% 6.46% 6.42%
40 to 49 Years 12.26% 13.57% 13.73%
50 to 64 Years 19.39% 20.08% 20.71%
Age 65+ 15.35% 15.22% 15.35%
Median Age 37.44 39.10 39.83
Population 25+ by Education Level
2018 Estimate Population Age 25+ 3,521 7,008 9,012
Elementary (0-8) 3.18% 3.39% 3.40%
Some High School (9-11) 7.38% 9.40% 9.51%
High School Graduate (12) 45.91% 44.12% 43.16%
Some College (13-15) 17.04% 16.78% 17.57%
Associate Degree Only 9.26% 9.47% 9.65%
Bachelors Degree Only 13.28% 11.78% 11.38%
Graduate Degree 2.60% 4.06% 4.51%
16

Income
In 2018, the median household income for your selected geography is
$43,517, compare this to the US average which is currently $58,754.
The median household income for your area has changed by 25.98%
since 2000. It is estimated that the median household income in your
area will be $50,333 five years from now, which represents a change
of 15.66% from the current year.
The current year per capita income in your area is $20,211, compare
this to the US average, which is $32,356. The current year average
household income in your area is $54,535, compare this to the US
average which is $84,609.
Population
In 2018, the population in your selected geography is 12,535. The
population has changed by -3.84% since 2000. It is estimated that
the population in your area will be 12,555.00 five years from now,
which represents a change of 0.16% from the current year. The
current population is 50.06% male and 49.94% female. The median
age of the population in your area is 39.83, compare this to the US
average which is 37.95. The population density in your area is 159.24
people per square mile.
Households
There are currently 4,162 households in your selected geography. The
number of households has changed by -1.84% since 2000. It is
estimated that the number of households in your area will be 4,215
five years from now, which represents a change of 1.27% from the
current year. The average household size in your area is 2.48 persons.
Employment
In 2018, there are 5,378 employees in your selected area, this is also
known as the daytime population. The 2000 Census revealed that
50.71% of employees are employed in white-collar occupations in
this geography, and 49.37% are employed in blue-collar occupations.
In 2018, unemployment in this area is 6.21%. In 2000, the average
time traveled to work was 25.00 minutes.
Race and Ethnicity
The current year racial makeup of your selected area is as follows:
79.53% White, 13.87% Black, 0.06% Native American and 0.68%
Asian/Pacific Islander. Compare these to US averages which are:
70.20% White, 12.89% Black, 0.19% Native American and 5.59%
Asian/Pacific Islander. People of Hispanic origin are counted
independently of race.
People of Hispanic origin make up 7.56% of the current year
population in your selected area. Compare this to the US average of
18.01%.
PROPERTY NAME
MARKETING TEAM
BURGER KING
Housing
The median housing value in your area was $81,588 in 2018, compare
this to the US average of $201,842. In 2000, there were 2,965 owner
occupied housing units in your area and there were 1,275 renter
occupied housing units in your area. The median rent at the time was
$419.
Source: © 2018 Experian
DEMOGRAPHICS
17