Bureau of Mineral Resources, Geology Geophysics · 0PY4-Bureau of Mineral Resources, Geology &...
45
0PY4- Bureau of Mineral Resources, Geology & Geophysics 6 Record 1990/92 MINOR METALS AND RARE EARTH ELEMENTS IN AUSTRALIAN BASE METAL ORES -A Reconnaissance Assay Survey by L J David Commodity Geologist (Base Metals) IH\I:' ,- if ACTUS (t ., .... ... 'i le': ')
Transcript of Bureau of Mineral Resources, Geology Geophysics · 0PY4-Bureau of Mineral Resources, Geology &...

0PY4-
Bureau of Mineral Resources, Geology & Geophysics
6 Record 1990/92
MINOR METALS AND RARE EARTH ELEMENTS IN AUSTRALIAN BASE METAL ORES
- A Reconnaissance Assay Survey
by L J David Commodity Geologist
(Base Metals) IH\I:' ,- Ir.Ur,\TTn'\~ ()}~, if ACTUS
(t ., .... ~t~·; ... ·~··~; :";.~·f 'i le': ')

Record 1990/92
MINOR METALS AND RARE EARTH ELEMENTS IN AUSTRALIAN BASE METAL ORES
- A Reconnaissance Assay Survey
by L J DavidCommodity Geologist
(Base Metals)
I11111 11111 0

~Commonwealth of Australia. 1990 This work is copyright. Apart from any fair dealing for the purposes of study, research, criticism or review, as permitted under the Copyright Act, no part may be reproduced by any process without written permission. Inquiries should be directed to the Principal Information Officer, Bureau of Mineral Resources, Geology and Geophysics, ·GPO Box 378, Canberra, ACT 2601.

ABSTRACT
INTRODUCTION
Sample Preparation
TABLE OF CONTENTS
Acid Digest and Assay Procedures
PREVIOUS VJORK
GEOLOGICAL OCCURRENCE
ECONOMIC GEOLOGY
Minor Metals
Rare Earth Elements and Yttrium
AUSTRALIAN PRODUCTION/RESOURCES
Minor Metals
Rare Earth Elements and Yttrium
ASSAY RESULTS
Cadmium and Antimony
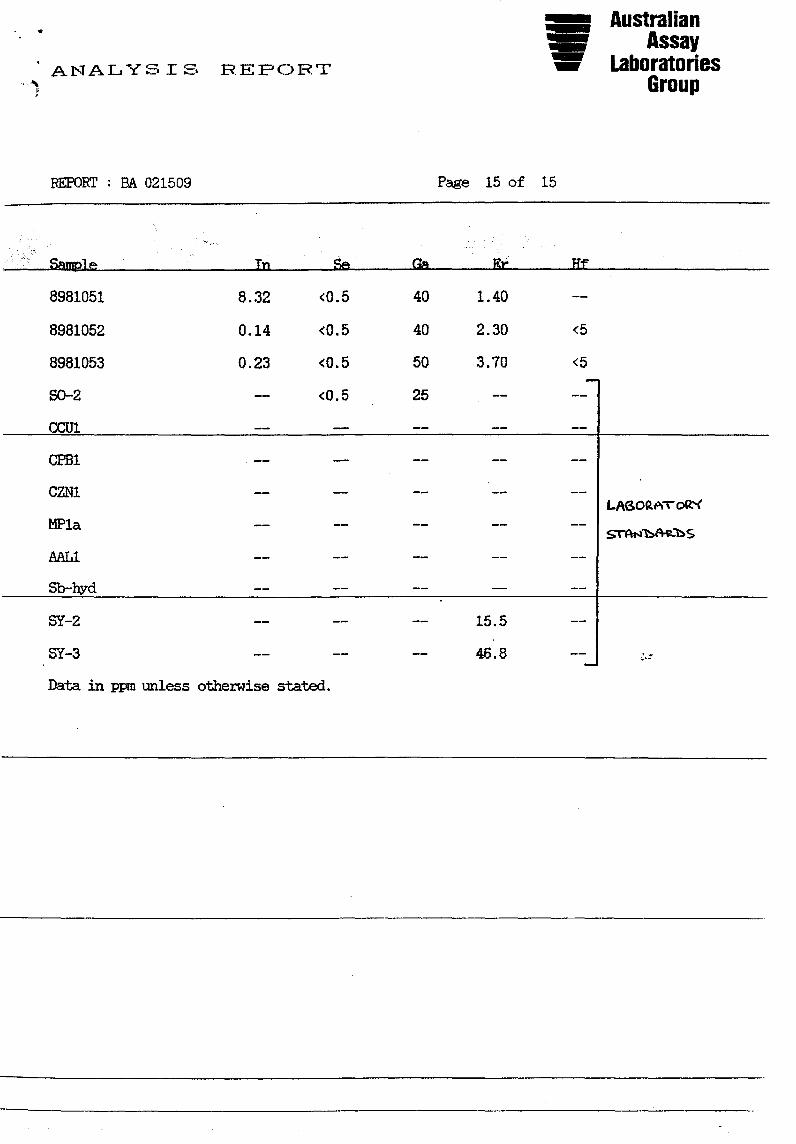
Scandium, Indium and Gallium
Selenium and Germanium
Rare Earth Elements
Hafnium, Tellurium and Thallium
CONCLUSIONS
ACKNOVJLEDGEMENTS
REFERENCES
APPENDIX 1: Assay Results
APPENDIX 2: Graphs of Assay Results
Page
1
1
1
2
2
2
3
3
4
5
5
5
6
6
6
7
7
7
8
8
9

1.
ABSTRACT
A reconnaissance assay survey of ore samples was undertaken to approximately gauge the content of the rare earth elements CREEs) and the so called minor metals in selected base metal sulphide deposits of Australia. With the exception of the anomalous Mt Lyell samples, the low REE contents recorded are consistent with contents reported in the small amount of work that has been done on other world sulphide deposits. Known associations of the surveyed minor metals with the various base metals are broadly confirmed. Production of REEs from Australian base metal sulphide deposits is unlikely in the foreseeable future.
INTRODUCTION
Significant interest in the use of the Rare Earth Elements (REEs) in high powered magnets and experimental "warm" superconductor materials, and of the minor metals in the electronics industry, was generated in the late 1980s. These metals should continue to playa role in the future, as research into new uses of these elements and new materials is undertaken.
A reconnaissance assay program commenced in early 1989, to approximately gauge the content of these minor metals in ores from major Australian base metal mines and in two deposits at an advanced stage of development.
In April/May 1989, three random samples (lkg weight) of crushed, ground ore (mill feed) and of any mill feed stockpiles were requested and received from the operating mines. Composite core samples were received from the two deposits being developed. Sample numbers and their sources are listed in Table 1. There were 53 samples, each of approximately 500 g weight dispatched to Australian Assay Laboratories, Perth, Western Australia on 2 June, 1989 for assay.
It is emphasised that because of the small number of samples taken they should not be considered to be representative of the relevant mill feed, orebodies or deposits. As a result only a broad interpretation of the assay results has been attempted, which should be regarded as approximate only.
Sample Preparation
Mill feed samples were riffle split into two 500 g (approx) samples. Single composite samples (also 500 g approx) were made from equal riffle splits of the samples from each of the stockpiles and selected core samples groups. The core samples were grouped according to designated "ore grade" category (high, medium or low) for the Lady Loretta deposit, and the source orebody for the Thalanga deposit.
Remnant sample split and laboratory residues, after analysis, were retained.

Table 1: Salple Nl..trbers arxl Min9s/Dep:leits Satpled.
S\MPIE # MINE/DEX'SIT 8981001 cadjeblt (Zn/Eb) mine,
VEst:ern Australia 002 "
003 "
004 <:sA (Cll/Zn/Eb) mine, New scuth wales
005 "
006 ..
007 Elura (Zn/Pb) mine, New Sooth wales
008 n
009 n
010 Mt Lyell (Cll/Pq/1w.) mine, Tasnania
011 ..
012 II
013 Lady IDretta (Zn/Eb) Dep:sit, Q.Ieenslarxl
014
015 ..
016 Selwyn (starra) OJ./1w. mine, Q,teenslarxl
017 II
018 North (Zn/Pb/lIg) mine, New Sooth wales
019 Selwyn (starra) Cll/1w. mine, Q.teenslarxl
020 WcirJ:a;;p (Cll/Bi/1w.) mine, Northern Territory
021 ..
022 ..
023 ZC (Zn/Pb/Ag) mine, New Sooth Wales
024 Woodcutters (Zn/Eb) mine, Northern Territory
025 "
IDtus File:SAMPINOM
S\MPIE TYPE Mill feed
"
..
Mill feed
..
..
M::I1thl.Y cmp:lSite mill feed
n
n
Mill feed
"
"
MeclliIn grade ore drill CXlt9
High grade ore drill CXlt9
IDI1 grade,bariti.c ore drill CXlt9
SUlpti.de ore mill feed
S1\MPI.E # MINE/'DEEWIT I 8981026 W::x:dl.awn (Zn/Pb/OJ) I mine, New south wales I 027 ..
028 ..
029 M::mlt rea (Zn/Pb/OJ) mine, Q.teenslaro
030 ..
031 ..
032 ..
033 .. 034 ..
035 North (Zn/Eb/lIg) mine, New scuth wales
036 Hellyer (Zn/Pb/OJ) mine, Tasnania
037 "
038 "
039 ..
040 ..
041 "
S1\MPI.E 'lYPE Q:nplex ore mill feed
"
"
Weekly c:x::np:>Site OJ mill feed ..
..
Weekly cx:np:site Eb/Zn mill feed ..
"
CHEXl{ S1\MPI.E mill feed annual cx:np:site
IDI1 grade Zn ore S1!G mill discharge
High As ore arsenic stockpile
Me:iiun Zn ore stockpile
High grade Zn ore stockpile ..
.. n
I I I 042 M::mlt rea (Zn/Pb/OJ) mine, Eb/Zn tail
I CHEXX Sl\MPLE I annual cmp::site I
SUlpu.de· ore I mill feed I
M::nt:hly o::rrp:lSite I mill feed I
"
.. I I I I
Annual Q:np:>site I mill feed I
Mill feed
.. I I I I I I I I I
043 .. 044 Lady IDretta (Zn/Pb)
Dep:sit, Q.teenslarxl 045 "
OJ tail
Macllirn grade ore drill core
High grade ore drill core
046 RosebeJ:y (Zn/Pb/OJ) mine, !blthl.y c:x::np:>Site Tas. (irx::l Q.1e River ore) mill feed
047 " "
048 .. ..
049 'lbalarga (Zn/Pb/OJ) CEntral orebody Dep:sit, Q.Ieenslarxl drill care
050 .. Eastern orebody drill core
051 .. Western orebody drill core
052 Selwyn (starra) Cll/1w. Isached ore mine, Q.teenslarxl stockpile
053 .. Oxide ore S 'pile

2.
Acid Digest and Assay Procedures
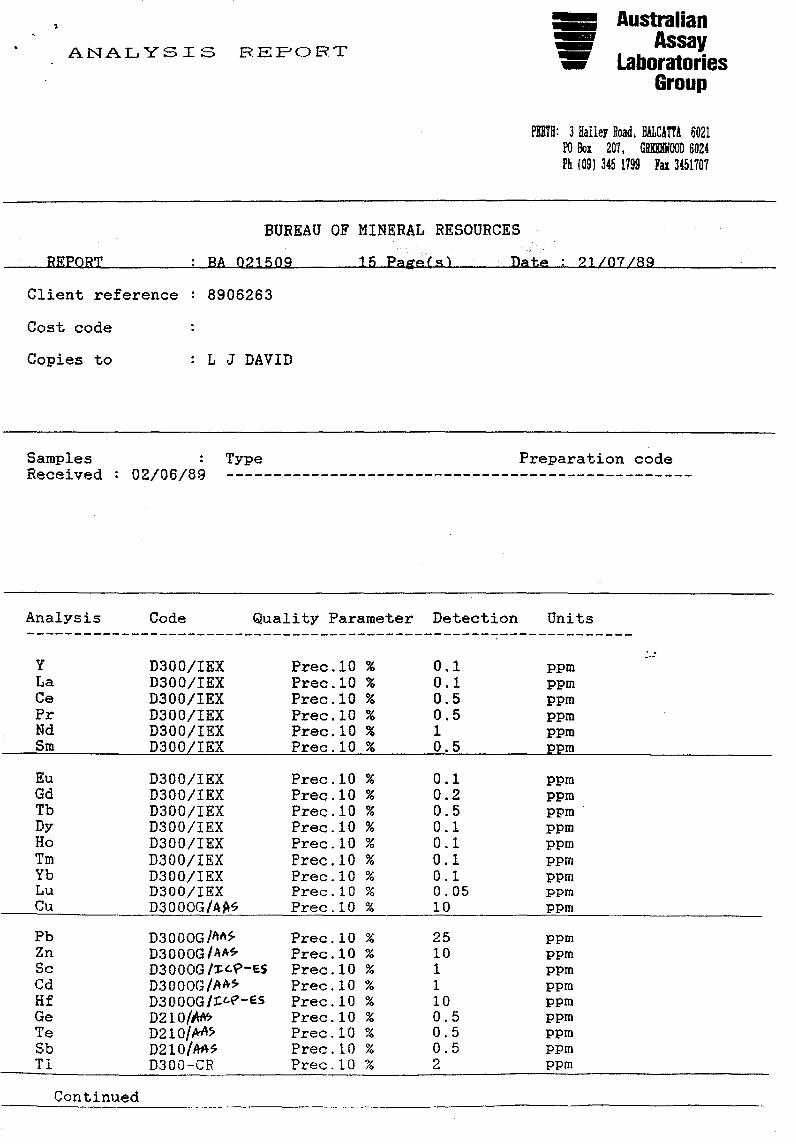
The elements assayed in each of the samples were:
copper (Cu) lanthanum (La) lead (Pb) cerium (Ce) zinc (Zn) praseodymium (Pr) cadmium (Cd) neodymium (Nd) antimony (Sb) samarium (Sm) scandium (Sc) europium (Eu) gallium (Ga) gadolinium (Gd) indium (In) terbium (Tb) thallium (Tl) dysprosium (Dy) selenium (Se) holmium (Ho) tellurium (Te) erbium (Er) germanium (Ge) thulium (Tm) hafnium (Hf) ytterbium (Yb) yttrium (Y) lutetium (Lu)
Sample break-down was by mixed acid digest for germanium, tellurium, antimony and selenium and a mixed acid/hydrofluoric acid leach was used for all other elements. For the REEs, an ion exchange process was then used to remove interference elements before assay by the Inductively Coupled Plasma (Iep) Spectrometry (Optical) method.
Scandium, hafnium (lOppm detection limit) and gallium were also assayed by ICP-Optical Spectrometry but indium assays were determined by Analabs, Perth, Western Australia using ICP-Mass Spectrometry. Copper, lead, zinc, germanium, tellurium, antimony and selenium were assayed by Atomic Absorption Spectroscopy (AAS). Hafnium (Sppm detection limit) was assayed using the pressed disc/X-Ray Fluorescence technique.
PREVIOUS WORK
A literature survey has indicated that very little work has been done on REE behaviour in and around sulphide deposits. Only scattered brief references are made to the other minor metals of this reconnaisance survey in publications which focus on other subjects. These mainly consist of analyses of specific minerals rather than the minor metal content of major metal ores.
GEOLOGICAL OCCURRENCE
Deposits in which the minor metals, other than the REEs, constitute the principal economic commodities are rare, despite the relative abundance of these metals in the earth's crust. Study of the geological setting of these minor metals has mainly been confined to economic deposits of the major metals such as aluminium, base metals, tungsten and tin in which they occur as minor constituents. Available data have been summarised in the "Economic Geology" section of this report.
Carbonatites contain by far the largest REE contents, which may exceed lS,OOOppm. REEs in the earlier phases of a carbonatite complex are relatively widely distributed in the minerals calcite, apatite and pyrochlore. In the later phases they become concentrated in the rare earth minerals (Henderson 1984).

3.
Kimber1ites (which may exceed 4500ppm) have the next highest REE content of the basic and u1trabasic rock suite, while most of the other members of the suite contain less than 1000ppm total REEs. Komatiites have especially low contents of less than 100ppm. Intermediate and acid rocks have generally low to moderate total REE contents of up to 400-500ppm, with some up to 1000ppm.
Most sulphide and oxide ore minerals are not good hosts for REEs.
Bence suggested (Whitford et a1, 1988) that europium is enriched in many polymetallic volcanogenic massive sulphide (VMS) deposits and in active mid-ocean ridge "black smokers". Whitford et a1 (1988) recorded much higher contents for each of the REEs in a massive pyrite sample (O.008-0.7ppm) compared to a massive ore sample (1.03-24.6ppm) both taken from the PQ lens at Que River, Tasmania. The REE contents in the massive pyrite sample are comparable to that in ore samples assayed, in this survey, from Hellyer and Rosebery, Tasmania.
ECONOMIC GEOLOGY
Minor Metals
Most of the material for this section has been drawn from US Bureau of Mines (1985) and US Geological Survey (1973).
Antimony is produced as a by-product of base metal and silver mInIng and may be extracted from tetrahedrite, a copper/silver/antimony sulphide. Stibnite is the main ore mineral of antimony, and often occurs in siliceous veins with small amounts of pyrite, other metal sulphides and minor gold. These veins are usually associated with granite, diorite or monzonite and are emplaced at shallow depths. Stibnite also occurs in more mineralogically complex deposits with pyrite, arsenopyrite, cinnabar or scheelite and base metal sulphides.
Cadmium is mainly sourced from zinc ores with minor contribution from copper and lead ores. Cadmium content of zinc ores is partially dependent on the ore formation temperature with higher temperature contact metamorphic and replacement deposits containing less cadmium than lower temperature hydrothermal or sedimentary-type deposits. Haw1eyite and greenockite are the principal independent cadmium sulphide minerals but are not known to form economic cadmium deposits.
Gallium is recovered during alumina production and the processing of some zinc ores. Up to 1% gallium has been recorded in sphalerite, up to SOOppm in galena and up to 100ppm in chalcopyrite. Sphalerite from the "lead belt" in the tri-State area of Kansas, Missouri and Oklahoma in the USA averages about 50ppm gallium and contains up to 200ppm. Bauxites have a similar average gallium content and may reach 100ppm.
Germanium is a minor constituent of some base metal ores and its main source is as a by-product of zinc production. It commonly reaches 0.01 -0.05% in sphalerite and 0.01 - 0.1% in enargite (a copper/arsenic sulphide). Minerals include germanite (which may also contain appreciable gallium), argyrodite, renierite and others which normally form in sulphide mineralisation at low to intermediate temperatures. Germanium can be concentrated in clays as a result of weathering.

4.
Brief production from the Apex deposit, Utah, USA of gallium/germanium ore hosted by leached iron oxides in dolomite/limestone occurred from 1985 to 1987. Recoverable reserves were estimated at 167,000 t grading 0.039% gallium, 0.079% germanium, 1.91% copper and minor zinc/silver (M J, 1985).
Indium is a trace constituent of mainly zinc, but also of lead, deposits. Concentration in zinc ores can vary widely but sphalerite commonly contains 10-20ppm indium and can reach levels of 1% indium. Chalcopyrite and tetrahedrite can contain up to l500ppm indium.
Scandium, in the mineral thortvietite, has been mined in small amounts from pegmatites in Norway and Madagascar. However, the major potential source is from tungsten deposits in which scandium is a minor constituent of wolframite and other tungsten minerals. Scandium has also been extracted as a by-product of uranium processing, although scandium contents are relatively low, and it can reach relatively high levels in phosphate minerals.
Selenium shows a preference for copper sulphides and pyrite, although it does occur in lead sulphides (1085ppm in galena from Mississippi Valley type mineralisation in West Canada, Mercer 1976). It is of relatively higher abundance in stratabound copper/lead/zinc deposits of volcanic origin.
Rare Earth Elements and Yttrium (Henderson 1984)
Until 1965 monazite (55-65% rare earth oxides or REOs) was the most important commercial rare earth elements bearing mineral. Beach sand placer deposits in Brazil provided the first major world source of monazite in 1895 and other placer deposits were developed in India. Since 1967 Australian mineral sands deposits have been the most important source of monazite, as a by-product of ilmenite, rutile and zircon production. Minor xenotime (yttrium phosphate) is also produced. Alluvial tin mining in Malaysia produces monazite and minor xenotime by-product concentrates.
Primary bastnasite, a fluocarbonate mineral (60-75% REOs) in carbonatite igneous rocks, has been the dominant source of Rare Earth Elements (REEs) in the world since 1965 with the Mountain Pass carbonatite deposit in California, USA, being the major producer (average REO content 5-15%). China is emerging as an important producer of REOs from primary bastnasite, monazite and other rare earth minerals associated with magnetite, specularite and hematite in the Bayan Obo iron ore deposit (up to 6.19% REO). The tabular iron orebodies occur in steeply dipping dolomites and are thought to have been derived from solutions of carbonatite affinity. Several REE bearing carbonatite bodies have been identified in Africa and bastnasite (with minor monazite) bearing veins were mined in Burundi, Central Africa until 1980. Secondary enrichment of REEs may result from deep weathering of carbonatite bodies such as in residual soils overlying carbonatites in Kenya (grading about 5% REO) and Brazil.
Although economic concentrations of REEs are normally associated with carbonatites, the major world production in the 1950s and early 1960s was from a monazite bearing shear at Steenkampskraal, South Africa. By-product recovery of monazite is being considered at the Buffalo fluorspar mine near Naboomspruit, South Africa.
The Korsnas mine in Finland produced a rare earth concentrate (ore minerals: monazite, apatite) between 1961 and 1972, as a by-product of the mining of galena from a vein in migmatitic mica gneiss.
Pegmatites provide a minor source of rare earth minerals.

5.
AUSTRALIAN PRODUCTION/RESOURCES
Minor Metals
Antimony is extracted, as an antimony-lead product, from Broken Hill lead ores by Broken Hill Associated Smelters at Port Pirie, South Australia. Antimony oxide is produced from stibnite ores of the Hillgrove Mine in the New England area of New South Wales (AMIAR 1987).
Cadmium is a by-product of the smelting of zinc concentrates from the Rosebery, Elura, Que River, Broken Hill and Mount Isa mines at the Risdon zinc refinery in Tasmania; lead-zinc smelting of Broken Hill and other concentrates at Cockle Creek, NSW, and smelting of the Broken Hill lead concentrates at Port Pirie, SA (AMIAR 1987).
Gallium content of the Brockman REE deposit, in the East Kimberleys of Western Australia, is reported to be significant. A plant built by Rhone-Poulenc Chemie, of France, commenced extraction of gallium as a by-product of alumina production at Pinjarra, Western Australia in mid 1989 but the company was considering curtailment of operations in early 1990, mainly as a result of low gallium prices. The gallium source is the caustic liquor containing aluminium and minor gallium piped from the nearby Alcoa alumina refinery.
Indium occurs at Broken Hill, NSW, and in a number of base metal deposits around Herberton, north Queensland. The Baal Gammon copper/silver/tin deposit is the most significant of a number of indium bearing deposits west of Herberton.
Scandium oxide (about l30kg) was extracted between 1954 and 1961 at Port Pirie, South Australia, from uranium ore mined at Radium Hill, South Australia. Uranium processing residues at Port Pirie are estimated to contain several tonnes of scandium. Tailings dams at Mary Kathleen, Queensland, also contain scandium (Bureau of Mineral Resources 1988).
Selenium is recovered from tankhouse slimes at the Port Kembla copper refinery and at the Cockle Creek lead/zinc refinery, Newcastle, both in New South Wales (AMIAR 1987).
Rare Earth Elements and Yttrium
Monazite and minor xenotime concentrates produced as a by-product of ilmenite, rutile and zircon extraction from mineral sands deposits on the east and west coasts are the only form of REE and yttrium production under way in Australia (AMIAR 1987).
Pronounced enrichment of REEs occurs in the weathered zone of carbonatites at Mt Weld, Western Australia. A previously published measured resource figure of 1.35Mt at 23.5% total rare earths (20% cut off) is now considered conservative (Carr Boyd Minerals Ltd, 1990).
Parts of the large Olympic Dam copper/uranium/gold deposit (450 Mt measured and indicated resource) in South Australia contain 2000-2700ppm cerium, 200ppm-1800ppm lanthanum and 35-l35ppm yttrium (Towner et al 1987). The REE minerals bastnasite and florencite have been identified (Roberts and Hudson 1983).

6.
The Brockman rare earths deposit near Halls Creek in Western Australia contains proved and probable reserves of 9 Mt at about 0.075% REO and 0.124% yttrium oxide (Towner et a1 1987).
The depleted Mary Kathleen uranium deposit, Queensland, contained significant levels of REEs, attributed to the uranium minerals allanite and stillwe1lite, but these were not recovered. Uranium production ceased in 1982.
There are numerous occurrences of REEs associated with uranium in the Mt Isa region in Queensland and the Olary district in South Australia and with pegmatites in several locations in Australia. Minor production was recorded from a pegmatite deposit at Coogle gong , WA (Towner et al 1987).
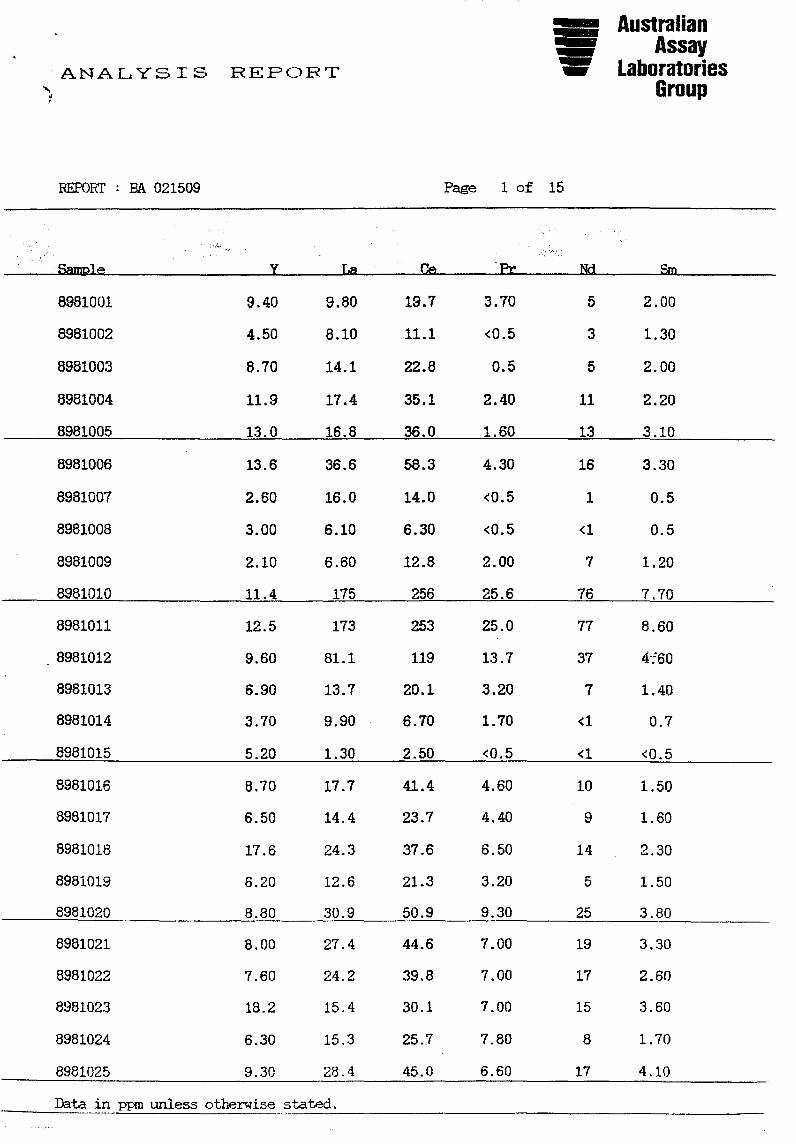
ASSAY RESULTS
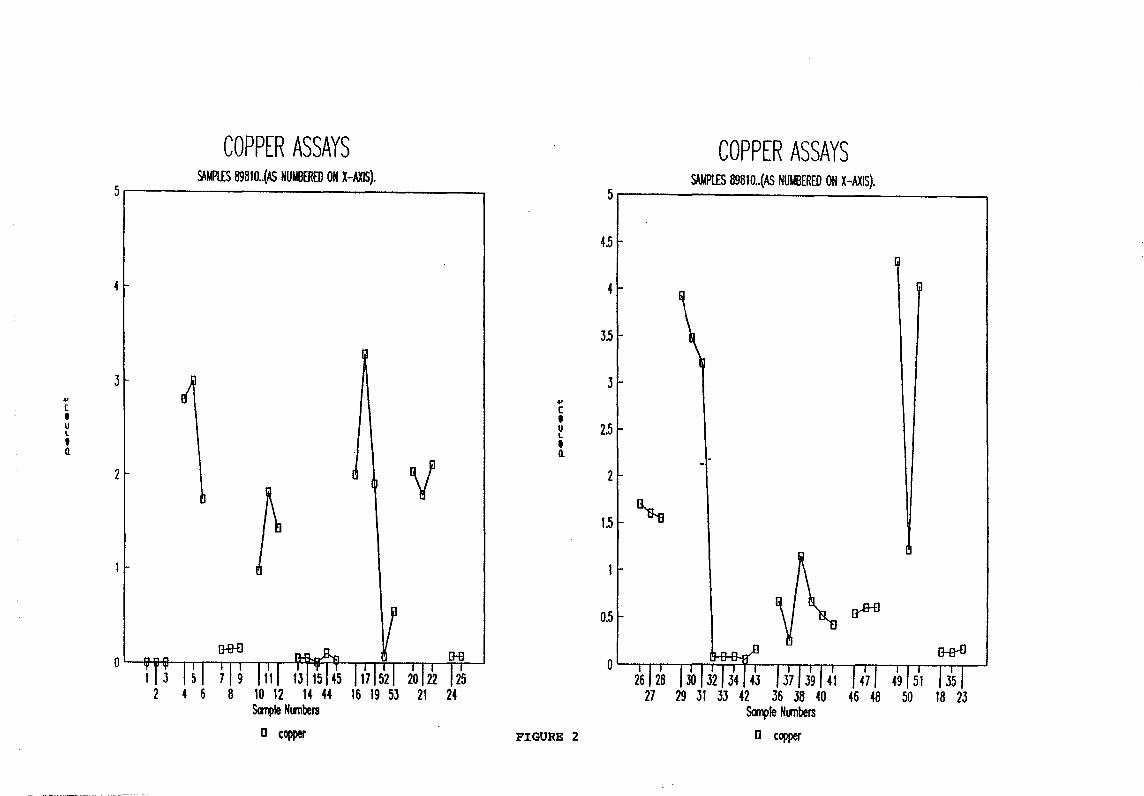
Assay results are presented in APPENDIX I and graphs of these results, plotted against sample number, are in APPENDIX 2. The mines and deposits sampled are shown on the copper, lead, zinc assays graph (APPENDIX 2, Figure 1 ). Elements are grouped arbitrarily, rather than with regard to any particular element association.
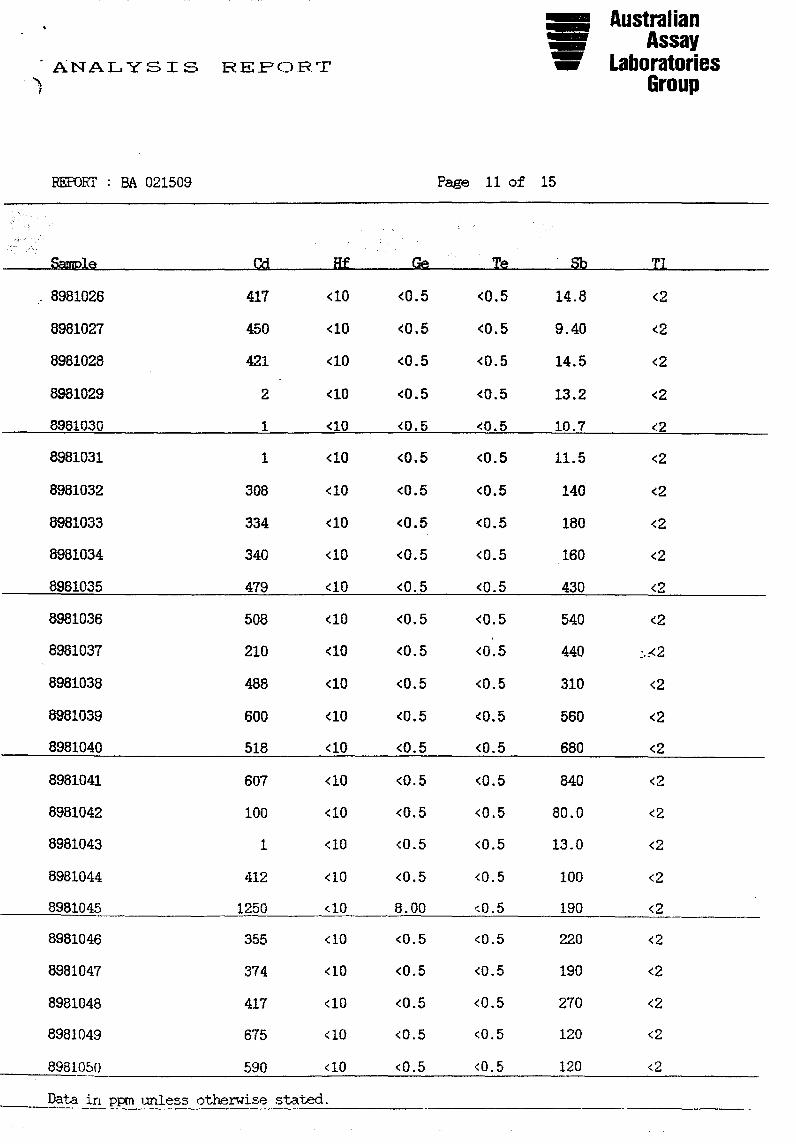
Cadmium and Antimony (APPENDIX 2, Figure 3)
Highly anomalous cadmium (1490ppm, 1570ppm) and exceptionally high antimony (5100ppm, 6700ppm) assays for the two Woodcutters samples are associated with only moderately elevated zinc and lead contents.
North Mine, Hellyer and E1ura samples gave the next highest antimony assays. Low antimony assays, relative to samples from the other lead-zinc and polymetallic mines and deposits, were recorded in the Cadjebut and Woodlawn samples
As could be expected, cadmium and antimony are broadly sympathetic with zinc and lead contents (respectively) and, in general, cadmium exceeds antimony content. However, E1ura, Woodcutters and some of the Hellyer samples exhibit the reverse relationship despite higher zinc than lead content.
Scandium, Indium and Gallium (APPENDIX 2, Figure 4)
Scandium assays are anomalous in two of the Mt Lyell samples and the high arsenic ore sample from Hellyer but no significant correlation with base metals is evident. Assays of the copper and the lead/zinc tail samples from Mt Isa indicate that sulphide concentration has no effect on scandium content of the copper tail but enriches scandium in the lead/zinc tail. This element is also enriched in the samples from the weathered zone of the Selwyn deposit.
Indium assays are highest in the high grade samples from Lady Loretta, one from the Eastern orebody at Thalanga and the Woodlawn samples. Samples from Lady Loretta (medium grade), Woodcutters, and the volcanogenic Hellyer, Rosebery and Thalanga deposits returned high assay results. The low grade baritic Lady Loretta ore and high arsenic ore at Hellyer yielded particularly low assays. An overall positive correlation exists between zinc and indium contents, although the Cadjebut, Elura and the Broken Hill samples are notable exceptions. A marked decrease of indium, relative to the mill feed ore samples, occurs in the Mt Isa lead/zinc tail while the copper tail shows only a marginal decrease after sulphide concentration.

7.
Gallium appears to be most abundant in the ore samples with significant copper (APPENDIX 2, Figs 2 and 4), especially those of the Selwyn and Warrego copper/gold mines. Exceptions are the relatively low gallium contents of the Mt Isa copper ore samples and the relatively high gallium contents of copper poor Elura samples. Gadjebut and Broken Hill samples gave relatively low gallium assays. Despite low gallium in the Mt Isa copper ore the affinity for copper is supported by the depletion of gallium in the copper tail and the enriched gallium content in the Mt Isa lead/zinc tail.
Selenium and Germanium (APPENDIX 3, Figure 5)
Many of the assays for these two elements were below the analytical detection limit.
Where selenium values are recorded, they are significantly elevated in samples taken from the VMS deposits of Tasmania and Woodlawn, particularly from the Hellyer mine. Samples from GSA Mine at Gobar and a medium grade core sample from Lady Loretta lead/zinc deposit also have significant selenium content. The Mt Isa copper tail sample exhibits enrichment of selenium.
Germanium assays were above the detection limit only in samples from Mt Lyell, Lady Loretta, and the ZG Mine. The high grade core samples from Lady Loretta gave much higher assays than the other Lady Loretta samples, and there appears to be some correlation with zinc content.
Rare Earth Elements (REEs) (APPENDIX 2, Figures 6-10)
The most obvious feature is the highly anomalous lanthanum (80-l75ppm) and cerium (119-256ppm) assays of the Mt Lyell mine samples. A high content of the other light REEs (through to gadolinium) is also evident. A REE bearing phosphatic layer has been mapped at the top of the main mineralised horizon of the Prince Lyell deposit, and contains apatite concretions with monazite-chalcopyrite intergrowths (Hendry 1981).
Marked enrichment in REEs, compared to primary ore samples, is observed in the two samples taken from the weathered portion of the Selwyn deposit.
The content of lanthanum, cerium, neodymium and terbium is higher in the GSA, Warrego, Woodcutters, high arsenic Hellyer, Rosebery, Thalanga and the Broken Hill ore samples. The Broken Hill samples also have a high yttrium content.
The europium content of the VMS deposits of Rosebery and Thalanga is much higher than in the genetically similar deposits of Woodlawn and Hellyer. Broken Hill samples also have elevated europium contents.
Hafnium, Tellurium and Thallium
As shown in APPENDIX I all the assay results for hafnium, tellurium and thallium were below the analytical detection limit.

8.
CONCLUSIONS
The association of gallium with copper ores is of interest as the traditional sources of gallium (as a by-product) are bauxite and zinc ores. Sphalerite is probably responsible for the elevated gallium content in the Elura lead/zinc samples and also, at least partially, in samples from the VMS deposits of Woodlawn, Hellyer, Rosebery and Thalanga.
Elevated indium content is observed in the samples from the Hellyer, Rosebery and Thalanga VMS deposits. The same or greater amounts of indium occur in the samples from the Woodcutters and the Lady Loretta deposits.
Selenium is also enriched in many of the VMS deposit samples and in one from Lady Loretta, together with two of the CSA samples. As selenium substitutes for sulphur in sulphides (US Bureau of Mines, 1985), the high content in the VMS deposits may reflect the generally high pyrite content, as found by Bence (1983).
With the exception of cadmium and antimony, only small amounts of the minor metals are recovered worldwide (range of about 50 kg for scandium to 95 t for tellurium, Bureau of Mineral Resources, 1988) compared to relatively large resources contained in base metal and other mineral deposits.
The high REE content of the Mt Lyell ore samples sets them apart from those of the other Tasmanian VMS deposits.
REE enrichment in the samples from the weathered portion of the Selwyn deposit is consistent with lower mobility of REEs in arid environments, compared to intense humid chemical weathering environments, as observed by Balashov (Henderson 1984).
Except in the case of Mt Lyell, the REE assay data in this survey are consistent with low REE contents of the few other world base metal deposits for which such data have been reported. The REE grade of monazite concentrates from mineral sands and the economic bastnasite bearing carbonatite intrusive deposits far exceeds the highest REE assays recorded in this survey. Thus economic extraction of these elements from sulphide ores in Australia appears unlikely in the foreseeable future.
The reconnaissance nature of the data collected in this survey has permitted some analysis of the more obvious relationships between base metal sulphides and the minor metals. Wider and more comprehensive sampling and more detailed analysis of resulting data is required if these relationships are to be confirmed and others observed.
ACKNOWLEDGEMENTS
The cooperation of the following m1n1ng companies in providing the samples and relevant data required for this survey is gratefully acknowledged:
Aberfoyle Resources Ltd BHP Minerals Ltd Cobar Mines Pty Ltd Cyprus Gold Australia Inc Denehurst Ltd Mt Isa Mines Ltd
Mt Lyell Mining and Railway Company Ltd
Pancontinental Mining Ltd Pasminco Mining Ltd Peko Mines Woodcutters Joint Venture
Critical review of the manuscript was done by I R McLeod, A Dreissen, M Huleatt and L Jaques of the Bureau of Mineral Resources, Canberra.

9.
REFERENCES
AMIAR (1987) - Australian Mineral Industry Annual Review. Bureau of Mineral Resources, Geology and Geophysics,
Bence, A E (1983) - Volcanogenic massive sulfides: rock/water interactions in basaltic systems and their effects on the distribution of the rare earth elements and selected first transition elements, Proc Int Assoc Geochem Cosmochem, Symposium on Water-Rock Interaction, Misasa, 4: 48-49 (abstract)
Bureau of Mineral Resources (1988) - Australian resources and availability of selected elements used in superconductors and related new materials. A submission to the Subcommittee on Superconductivity of the House of Representatives Standing Committee on Industry, Science and Technology, Parliament House. Canberra.
Carr Boyd Minerals Ltd (1990) - Quarterly Report on Activities 1st January to 31 March 1990. Carr Boyd Minerals Ltd.
Fleischer, M (1955) - Minor elements in some sulfide minerals. Econ Geol Fiftieth Anniv Vol. 970-1024
Henderson, P (ed), (1984) - Rare earth element geochemistry. Elsevier. Amsterdam,
Hendry, D A F (1981) - Chlorites, phengites and siderites from the Prince Lyell ore deposit, Tasmania. Econ Geol. 76, 285-303.
Knutson, J, Donnelly, T H and Tonkin, D G (1983) - Geochemical constraints on the genesis of copper mineralisation in the Mount Gunson area, South Australia. Econ Geol. 78, 250-274.
Mercer, W. (1976) - Minor elements in metal deposits in sedimentary rocks - a review of the recent literature. In Wolf. K H (ed) Handbook of Stratabound and Stratiform Ore Deposits, 2, 1-27.
M J (1985) - Mining Journal, July 5, 1985. The Mining Journal Ltd., 4-5.
Roberts, D E and Hudson, G R T (1983) - The Olympic Dam copper-uranium-gold deposit, Roxby Downs, South Australia. Econ Geol, 78, 799-822.
Towner, R, McLeod, I R and Ward, J (1987) - Australia - a major world source of rare earths. Proceedings of the Rare Earth Horizons Conference 1987. Lindfield. Sydney. Australia. Department of Industry. Technology and Commerce, September 1987.
US Bureau of Mines (1985) - Mineral facts and problems. United States Bureau of Mines Bulletin 675.
US Geological Survey (1973) - United States mineral resources. US Geological Survey Professional Paper 820.
Whitford, D J, Korsch, M J, Porritt, P M, Craven, S J (1988) - Rare earth element mobility around the volcanogenic polymetallic sulphide deposit at Que River, Tasmania, Australia. Chemical Geology, 68, 105-119.
Additional Reading: Dimmick, T D (1949) - Minor Metals. Bureau of Mineral Resources. Geology
and Geophysics, Mineral Resources of Australia Summary Report 35.

APPENDIX 1: Assay Results

Table 1: 8arrple Nwbe:rs and Mines/De};x>Sits 8arrpled.
SAMPLE # MINE/OEroSIT 8981001 cadjebut (Zn/Pb) mine,
Western Australia 002 "
003 "
004 CSA (CU/Zn/Pb) mine, New Sa.lth Wales
005 "
006 "
007 Elura (Zn/Pb) mine, New Sa.lth Wales
008 "
009 "
010 Mt Lyell (CU/PIJ/Au) mine, Tasnania
011 "
012 "
013 Lady IDretta (Zn/Pb) De};x>Sit, Q.leensland
014 "
015 "
016 Selwyn (starra) CU/Au mine, Q.leensland
017 "
018 North (Zn/Pb/PIJ) mine, New South Wales
019 Selwyn (starra) CU/Au mine, Q.leensland
020 Warrego (CU/Bi/Au) mine, Northern Territory
021 "
022 "
023 ZC (Zn/Pb/PIJ) mine, New South Wales
024 W:::x:ldcutters (Zn/Pb) mine, Northern '!erritory
025 "
lotus File:SAMPINl.JM
SAMPLE TYPE Mill feed
"
"
Mill feed
"
"
M:mthly CClllfOSite mill feed
"
"
Mill feed
"
"
Medium grade ore drill core
High grade ore drill core
IDW grade,baritic ore drill core
SUlphide ore mill feed
"
amx::K SAMPLE annual CClllfOSite
SUlphide ore mill feed
M:>nthly CClllfOSite I mill feed
"
"
Annual Q:np:>site mill feed
Mill feed
SAMPLE # MINE/OEroSIT 8981026 WJodlawn (Zn/Pb/CU)
mine, New Sa.lth Wales
027 "
028 "
029 M:1unt Iea (Zn/Pb/CU) mine, Q.leensland
030 "
031 "
032 "
033 "
034 "
035 North (Zn/Pb/PIJ) mine, New Sa.lth Wales
036 Hellyer (Zn/Pb/CU) mine, Tasnania
037 "
038 "
039 "
040 "
041 "
SAMPLE TYPE Cb:lplex ore mill feed
"
"
weekly CClllfOSite CU mill feed
"
"
weekly CClllfOSite Pb/Zn mill feed
"
"
amx::K SAMPLE mill feed annual CClllfOSite
IDW grade Zn ore S1\G mill discharge
High As ore arsenic stockpile
Medium Zn ore stockpile
High grade Zn ore stockpile
"
"
042 M:1unt Iea (Zn/Pb/CU) mine, Pb/Zn tail
043 "
044 Lady IDretta (Zn/Pb) Deposit, Q.leensland
045 "
CU tail
Madium grade ore drill core
High grade ore drill core
046 Rosebery (Zn/Pb/CU) mine, M:mtbly CXll1fOSite Tas. (incl Q.le River ore) mill feed
047 "
048 "
049 Thalanga (Zn/Pb/CU) Dep:>sit, Q.leensland
050 "
051 "
052 Selwyn (starra) CU/Au mine, Q.leensland
053 "
"
"
03ntral orebody drill core
Eastern orebody drill core
Western orebody drill core
Leached ore stockpile
Oxide ore s'pile
ANALYSIS B'.EPC)RT
Australian Assav
Laboratories Group
PKHTH: 3 Halley Road. BALCATTA 0021 PO Box 207, GRKKHWOOD 6024 Ph (09) 345 1799 Fax 3451707
BUREAU OF MINERAL RESOURCES
REPORT
Client reference
Cost code
Copies to
Samples Received 02/06/89
BA 021509 J5 Pa6te(s) Date 21/07/89
8906263
L J DAVID
Type Preparation code
Analysis Code Quality Parameter Detection Units ----------------------------------------------------------------
---y D300/IEX Prec .10 % 0.1 ppm La D300/IEX Pree.l0 % 0.1 ppm Ce D300/IEX Pree.l0 % 0.5 ppm Pr D300/IEX Pree.l0 % 0.5 ppm Nd D300/IEX Pree.l0 % 1 ppm Sm D300/IEX Pree .10 % 0.5 ppm
Eu D300/IEX Free.l0 % 0.1 ppm Gd D300/IEX Free .10 % 0.2 ppm Tb D300/IEX Free .10 % 0.5 ppm Dy D300/IEX Free .10 % 0.1 ppm Ho D300/IEX Pree.10 % 0.1 ppm Tm D300/IEX Pree.I0 % 0.1 ppm Yb D300/IEX Free.10 % 0.1 ppm Lu D300/IEX Pree.10 ~6 0.05 ppm Cu D3000G/A9t$ Pree .10 % 10 ppm
Pb D3000G/M$- Pree.10 % 25 ppm Zn D3000G IAAS- Pree .10 % 10 ppm Se D3000G /1:-<..t>-ES Free .10 % 1 ppm Cd D3000G/AA$ Pree .10 % 1 ppm Hf D3000G/:cc..~-ES Pree .10 ~6 10 ppm Ge D210/N6 Pree.10 % 0.5 ppm Te D210/A-A~ Free.10 01' 0.5 ppm '0
Sb D2101A1l~ Free .10 % 0.5 ppm Tl D300-CR Free .10 % 2 ppm
Continued

.. i
., i .. \ .. ~
--
In SPEC Pree .10 % Se D210/AIt~ Pree.10 % Ga D300/ICP-(;S Pree .10 % Er D300/IEX Pree .10 % Hf XRF/D410 Pree .10 %
Senior Chemist Alastair Inglis
. ,.," ".::'; ."
}~ >"~'"
0.05 0.5 10 0.3 5
. t:
ppm ppm ppm ppm ppm
<,,", '
Australian Assay
Laboratories Group
.. --
ANALYSIS REPC)RT
REPORT BA 021509
-4··
. Sample y [,a Ce
8981001 9.40 9.80 19.7
8981002 4.50 8.10 11.1
8981003 8.70 14.1 22.8
8981004 11.9 17.4 35.1
8981005 13.0 16.8 36.0
8981006 13.6 36.6 58.3
8981007 2.60 16.0 14.0
8981008 3.00 6.10 6.30
8981009 2.10 6.60 12.8
8981010 11.4 175 256
8981011 12.5 173 253
8981012 9.60 81.1 119
8981013 6.90 13.7 20.1
8981014 3.70 9.90 6.70
8981015 5.20 1.30 2.50
8981016 8.70 17.7 41.4
8981017 6.50 14.4 23.7
8981018 17.6 24.3 37.6
8981019 6.20 12.6 21.3
8981020 8.80 30.9 50.9
8981021 8.00 27.4 44.6
8981022 7.60 24.2 39.8
8981023 18.2 15.4 30.1
8981024 6.30 15.3 25.7
8981025 9.30 28.4 45.0
Data in ppm unless otherwise stated.
Page 1 of 15
Pr Nd
3.70 5
<0.5 3
0.5 5
2.40 11
1.60 13
4.30 16
<0.5 1
<0.5 <1
2.00 7
25.6 76
25.0 77
13.7 37
3.20 7
1.70 <1
<0.5 <1
4.60 10
4.40 9
6.50 14
3.20 5
9.30 25
7.00 19
7.00 17
7.00 15
7.80 8
6.60 17
Australian Assay
Laboratories Group
Sm
2.00
1.30
2.00
2.20
3.10
3.30
0.5
0.5
1.20
7.70
8.60
4-:60
1.40
0.7
<0.5
1.50
1.60
2.30
1.50
3.80
3.30
2.60
3.60
1.70
4.10

ANALYSIS REPORT
~)RT BA 021509
',,;
Sample Y La C&
8981026 10.6 13.6 25.7
8981027 8.30 14.6 25.3
8981028 12.9 16.7 27.0
8981029 4.20 10.3 14.5
8981030 3.40 10.5 14.9
8981031 6.20 11.3 18.0
8981032 5.40 11.6 18.1
8981033 7.10 13.7 20.6
8981034 9.60 13.0 24.0
8981035 17.2 21.9 38.8
8981036 4.40 9.00 13.5
8981037 12.9 25.1 42.5
8981038 1.80 3.50 4.80
8981039 1.20 2.60 1.10
8981040 3.30 7.80 12.9
8981041 1.10 3.20 5.70
8981042 6.70 13.1 22.3
8981043 4.60 11.0 17.7
8981044 5.50 16.9 24.9
8981045 3.90 2.80 5.70
8981046 9.60 25.0 44.6
8981047 8.90 24.9 44.6
8981048 11.1 31.4 55.7
8981049 11.1 13.8 25.2
8981050 13.2 24.8 45.8
Data in ppn unless otherwise stated.
Page 2 of 15
Pr Nd
3.50 13
1.30 9
4.00 12
1.00 8
0.6 5
1.10 6
1.30 7
1.60 8
0.5 11
6.00 13
3.70 7
5.20 17
<0.5 1
<0.5 <1
0.5 4
1.40 1
4.40 11
3.50 10
3.80 11
0.5 3
7.20 19
7.80 19
7.00 25
7.80 13
12.5 21
Australian Assay
Laboratories Group
Sm
2.00
1.50
2.60
1.50
1.00
1.30
1.00
1.80
1.50
2.50
1.50
3'.:10
<0.5
<0.5
0.5
<0.5
2.00
2.00
2.30
1.00
3.80
3.30
4.60
2.50
4.10

ANALYSIS REPORT .)
REPORT : BA 021509 Page
~. :'"
$ample y I.e r.e
8981051 9.50 10.5 23.8
8981052 15.9 31. 7 56.3
8981053 31.6 17.8 33.1
50-2
CCUl
CPB1
CZN1
MPla
AAL1
ffiJ...: d
SY-2 116 79.5 161
SY-3 650 1250 2100
Data in ppm unless otherwise stated.
3 of 15
Pr Nd
5.30 15
13.7 32
10.2 26
22.6 83
140 720
Australian Assay
Laboratories Group
8m
3.10
5.40
5.10
LA60~AtOQ. Y sn:\t-I'tl A9-bS
17.0
89.4

ANALYSI S REPC>B.T
REPORT BA 021509
';""" , ,. ":!.
Sample Ell Gd Tb
8981001 0.1 1.60 0.5
8981002 <0.1 0.5 <0.5
8981003 0.1 1.40 <0.5
8981004 0.1 2.00 <0.5
8981005 0.1 2.40 0.5
8981006 0.3 2.60 1.00
8981001 0.3 0.2 <0.5
8981008 0.3 0.3 <0.5
8981009 0.6 0.8 0.5
8981010 2.30 4.30 <0.5
8981011 2.90 4.90 <0.5
. 8981012 1.40 2.40 0.5
8981013 0.5 1.20 <0.5
8981014 0.2 0.5 0.5
8981015 <0.1 0.5 <0.5
8981016 0.2 1.40 <0.5
8981017 0.1 0.1 <0.5
8981018 1.40 3.10 1.00
8981019 0.2 1.30 <0.5
8981020 0.8 3.30 0.5
8981021 0.6 2.10 0.5
8981022 0.4 2.20 0.5
8981023 1.40 2.90 1.00
8981024 0.2 1.10 1.50
8981025 0.2 2.10 1.00
Data in ppm unless otherwise stated.
Page 4 of 15
J)y Ho
1.20 0.1
0.7 <0.1
1.00 0.1
2.10 0.2
2.20 0.4
2.10 0.4
0.2 <0.1
0.4 <0.1
0.5 0.2
2.20 0.4
2.50 0.6
1.10 0.3
1.20 0.2
0.6 0.1
0.7 0.1
1.30 0.1
1.10 0.1
2.90 0.5
1.20 0.1
2.00 0.3
1.80 0.3
1.70 0.3
3.00 0.5
0.9 0.3
1.30 0.1
Australian Assay
Laboratories Group
Tm
<0.1
<0.1
<0.1
0.1
0.2
0.1
<0.1
<0.1
0.1
<0.1
0.2
~O.l
<0.1
<0.1
<0.1
<0.1
<0.1
0.2
<0.1
0.2
0.1
0.1
0.2
0.2
0.2

ANALYSIS REPC)RT
BEFORT BA 021509
.,~:."
.":'.>
Sample Eu Gel Tb
8981026 0.2 1.90 0.5
8981027 0.3 1.40 <0.5
8981028 0.4 2.20 <0.5
8981029 0.3 1.50 0.5
8981030 0.2 0.9 <0.5
8981031 0.3 1.50 <0.5
8981032 0.4 1.10 <0.5
8981033 0.4 1.30 0.5
8981034 0.4 1.60 0.5
8981035 1.20 2.80 1.00
8981036 0.2 0.7 0.5
8981037 0.6 2.60 0.5
8981038 <0.1 <0.2 <0.5
8981039 <0.1 <0.2 <0.5
8981040 0.2 0.6 <0.5
8981041 <0.1 <0.2 <0.5
8981042 0.4 1.40 1.00
8981043 0.3 1. 70 0.5
8981044 0.4 1.20 1.00
8981045 0.2 0.9 <0.5
8981046 1.00 2.70 0.5
8981047 0.9 2.10 <0.5
8981048 1.10 3.20 1.00
8981049 1.00 2.20 1.50
8981050 1.30 2.90 2.50
Data in ppm l.mJ.ess otherwise st.9.ted.
page 5 of 15
> :. "
Dy Ho
2.00 0.3
1.50 <0.1
2.30 0.4
0.9 0.1
0.6 <0.1
0.9 0.1
1.00 0.1
1.20 0.2
1.40 0.3
2.80 0.5
1.00 0.4
2.40 0.4
0.3 <0.1
<0.1 <0.1
0.7 <0.1
0.2 <0.1
1.30 0.2
1.00 0.3
1.10 0.2
0.7 0.1
2.10 0.5
1. 70 0.4
2.40 0.8
1.70 0.8
2.30 0.9
Australian Assay
Laboratories Group
'I'm
0.2
0.2
0.2
0.1
<0.1
<0.1
0.1
0.1
0.2
0.3
0.2
:"0.2
0.1
<0.1
0.2
<0.1
0.2
0.2
0.1
0.1
0.3
0.2
0.3
0.4
0.5

ANALYSIS REPORT ')
BEFORT : BA 021509
"'''';'",. , ~. :<' ...
;'; ~. ~ .' Sample .. , ...... Ell Gd
8981051 0.7 2.30
8981052 0.9 4.20
8981053 1.00 4.70
50-2
CGOl
CPBl
CZNl
MPla
AALl
Sb-hyd .
SY-2 2.60 17.3
. SY-3 13.0 63.5
Data in ppn 1.IDless otherwise stated.
Page 6 of
Tb ; nY'
2.00 1.80
2.50 3.50
2.50 5.90
2.00 20.5 '.
9.50 73.1
15
. ,",
<.
Ho
0.6
1.10
1.60
4.80
18.1
Australian Assay
Laboratories Group
Tm
0.4
0.5
0.7
LA80~A\ORY
~A9-bS
2.10
7:20

ANALYSIS REPC>RT ')
REPORT BA 021509
~~:}>
:1 <. .. Sample Vb Lu Cu
8981001 0.9 0.10 31
8981002 0.4 0.05 32
8981003 0.9 0.10 33
8981004 1.50 0.20 2.81%
8981005 1.60 0.20 3.00%
8981006 1.10 0.20 1.73%
8981007 0.2 0.05 1440
8981008 0.2 <0.05 1480
8981009 0.2 0.05 1590
8981010 1.00 0.20 9730
8981011 1.20 0.20 1.81%
8981012 1.10 0.20 1.43%
8981013 0.6 0.10 504
8981014 0.2 0.05 560
8981015 0.7 0.10 90
8981016 0.8 0.20 2.00%
8981017 0.4 0.05 3.29%
8981018 1.20 0.20 1400
8981019 0.6 0.05 1.90%
8981020 0.7 0.10 2.03%
8981021 0.7 0.10 1.78%
8981022 0.6 0.10 2.11%
8981023 1.50 0.20 1760
8981024 0.4 0.10 750
8981025 0.5 0.10 750
Data in ppm unless othenlise stated.
Page 7 of 15
Ph Zn
2.19% 13.3%
2.20% 13.5%
2.22% 12.6%
450 1720
310 1520
620 1750
5.26% 7.52%
5.37% 7.40%
5.56% 7.91%
150 610
220 650
30 540
9.65% 19.5%
31.4% 34.3%
1.17% 16.1%
250 670
190 430
13.4% 10.3%
150 300
240 450
120 250
150 290
5.85% 8.61%
10.8% 15.5%
10.2% 15. 6"~
Australian Assay
Laboratories Group
Sc
7
6
4
5
4
5
1
<1
<1
12
10
; ..... 5
1
<1
<1
3
4
4
2
2
2
2
3
1
1

P.~NALYS I S REPC)RT
REPORT BA 021509 Page 8 of 15
Australian Assay
Laboratories Group

ANAL~£SIS REPC..JRT
REPORT : BA 021509
SampJe Vb In
8981051 0.8 0.20
8981052 1.70 0.30
8981053 2.50 0.40
50-2
CCU1
CPB1
CZN1
MP1a
AAL1
Sb-hvd
SY-2 17.6 3.00
SY-3 61.1 7.60
Data in ppm tmless otherwise stated.
Page 9 of 15
01 Ph Zn
4.04% 5.47% 12.0%
700 46 230
5490 <25 110
<10 <25 115
25.8% 1100 3.25%
2450 66.0% 4.29%
1400 7.61% 43.8%
1.39% 4.36% 18.6%
150 470 2000
Australian Assay
Laboratories Group
Sa
2
7
7
10
LA~ATORY
srAN~1)5
.. .. ---

ANALYSIS REPORT
REPORT BA 021509
:~., •...
Sample Cd Hf Ge
8981001 230 <10 <0.5
8981002 232 <10 <0.5
8981003 228 <10 <0.5
8981004 5 <10 <0.5
8981005 4 <10 <0.5
8981006 5 <10 <0.5
8981007 205 <10 <0.5
8981008 200 <10 <0.5
8981009 216 <10 <0.5
8981010 2 <10 <0.5
8981011 3 <10 2.00
8981012 2 <10 3.00
8981013 452 <10 2.00
8981014 . 1280 <10 11.0
8981015 318 <10 5.00
8981016 1 <10 <0.5
8981017 <1 <10 <0.5
8981018 460 <10 <0.5
8981019 <1 <10 <0.5
8981020 4 <10 <0.5
8981021 2 <10 <0.5
8981022 <1 <10 <0.5
8981023 310 <10 2.00
8981024 1490 <10 <0.5
8981025 1570 <10 <0.5
Data in ppm unless otherwise stated.
Page 10 of 15
Te Sb
<0.5 <0.5
<0.5 <0.5
<0.5 <0.5
<0.5 2.90
<0.5 2.80
<0.5 2.40
<0.5 360
<0.5 360
<0.5 420
<0.5 1.70
<0.5 0.5
<0.5 1.00
<0.5 80.0
<0.5 330
<0.5 35.7
<0.5 9.10
<0.5 3.50
<0.5 420
<0.5 8.80
<0.5 6.80
<0.5 7.00
<0.5 8.20
<0.5 110
<0.5 5100
<0.5 6700
Australian Assay
Laboratories Group
Tl
<2
<2
<2
<2
<2
<2
<2
<2
<2
<2
<2
~'~<2
<2
<2
<2
<2
<2
<2
<2
<2
<2
<2
<2
<2
<2
.'"
... ~
1
ANALYSIS REPC)R.T
REPORT SA 021509
Sample Cd Hf
. 8981026 417 <10
8981027 450 <10
8981028 421 <10
8981029 2 <10
8981030 1 <10
8981031 1 <10
8981032 308 <10
8981033 334 <10
8981034 340 <10
8981035 479 <10
8981036 508 <10
8981037 210 <10
8981038 488 <10
8981039 600 <10
8981040 518 <10
8981041 607 <10
8981042 100 <10
8981043 1 <10
8981044 412 <10
8981045 1250 <10
8981046 355 <10
8981047 374 <10
8981048 417 <10
8981049 675 <10
8981050 590 <10
Data_~~ppm lIDless otherwise stated.
Ge
<0.5
<0.5
<0.5
<0.5
<0.5
<0.5
<0.5
<0.5
<0.5
<0.5
<0.5
<0.5
<0.5
<0.5
<0.5
<0.5
<0.5
<0.5
<0.5
8.00
<0.5
<0.5
<0.5
<0.5
<0.5
Page 11 of 15
Te Sb
<0.5 14.8
<0.5 9.40
<0.5 14.5
<0.5 13.2
<0.5 10.7
<0.5 11.5
<0.5 140
<0.5 180
<0.5 160
<0.5 430
<0.5 540
<0.5 440
<0.5 310
<0.5 560
<0.5 680
<0.5 840
<0.5 80.0
<0.5 13.0
<0.5 100
<0.5 190
<0.5 220
<0.5 190
<0.5 270
<0.5 120
<0.5 120
Australian Assay
Laboratories Group
Tl
<2
<2
<2
<2
<2
<2
<2
<2
<2
<2
<2
~._..(2
<2
<2
<2
<2
<2
<2
<2
<2
<2
<2
<2
<2
<2

ANALYSIS REP()B.T
REPORT SA 021509
Sample
8981051
8981052
8981053
50-2
CCUl
CPBl
CZN1
MPla
!ALl
5b-hyd
5Y-2
. SY-3
~:,:
Cd Hf
398 <10
2 <10
2 <10
<1 15
115
150
1380
650
8
Data in ppn unless otherwise stated.
Page 12 of 15
.: .. , ,,': :? '" ' ....... ::.,
". ',:;;.
Ge Te Sb
<0.5 <0.5 110
<0.5 <0.5 1.00
<0.5 <0.5 0.5
<0.5
24.0
Australian Assay
Laboratories Group
Tl
<2
<2
<2
LA~A\OR"<
srAN1:>AAbS

ANALYS I S REPC')RT
REPORT SA 021509
'Sample In Sa
8981001 0.12 <0.5
8981002 0.09 <0.5
8981003 0.09 <0.5
8981004 4.28 <0.5
8981005 4.04 2.00
8981006 2.78 4.00
8981007 0.06 <0.5
8981008 0.07 <0.5
8981009 0.08 <0.5
8981010 0.66 4.00
8981011 0.79 <0.5
8981012 0.36 <0.5
8981013 11.2 <0.5
8981014 31.4 <0.5
8981015 1.25 <0.5
8981016 0.25 <0.5
8981017 0.28 <0.5
8981018 0.32 <0.5
8981019 0.13 <0.5
8981020 2.19 <0.5
8981021 1.58 <0.5
8981022 1.11 <0.5
8981023 0.92 <0.5
8981024 13.2 <0.5
8981025 10.2 <0.5
Datot in ppm lIDless otherwise stated.
Page 13 of 15
Ga Er
10 0.8
10 <0.3
10 0.9
30 1.00
30 1.60
30 1.60
40 <0.3
30 <0.3
40 0.6
30 0.9
30 1.10
20 0.7
20 0.3
20 <0.3
<10 <0.3
50 <0.3
40 <0.3
10 1.40
40 <0.3
40 0.7
40 0.4
50 0.5
10 1.70
20 0.5
20 0.5
Hf
<5
<5
<5
<5
<5
<5
<5
<5
<5
<5
<5
<5
Australian Assay
Laboratories Group
; • .!"

... i
, ~/ ,..<-.,,, ," .
ANALYSIS REPC)RT
REPORT BA 021509
Sample In Sa
8981026 19.9 4.00
8981027 18.9 4.00
8981028 18.5 5.00
8981029 1.73 <0.5
8981030 14.3 <0.5
8981031 1.58 <0.5
8981032 4.68 <0.5
8981033 4.72 <0.5
·8981034 5.16 <0.5
8981035 0.30 <0.5
8981036 10.0 8.00
8981037 1. 79 4.00
8981038 12.0 8.00
8981039 14.5 4.00
8981040 6.64 5.00
8981041 8.65 7.00
8981042 1.85 <0.5
8981043 0.33 2.00
8981044 13.4 3.00
8981045 21.5 <0.5
8981046 10.3 2.00
8981047 11.7 3.00
8981048 10.8 3.00
8981049 15.8 <0.5
8981050 30.1 2.00
Data in ppn lIDless otherwise stated. -
Ga
30
30
30
10
10
10
20
20
20
10
30
30
30
30
30
30
30
10
20
20
30
30
30
50
30
Page 14 of 15
Er
0.8
0.3
1.10
0.4
<0.3
<0.3
<0.3
0.3
0.9
1.40
0.3
1.10
<0.3
<0.3
<0.3
<0.3
0.8
0.7
0.7
0.3
1.10
0.6
1.10
1.00
2.00
Hi
<5
<5
<5
<5
Australian Assay
Laboratories Group
.:.~
.... , ~ i
ANALYS I S REPC>RT
REPORT : BA 021509 Page 15 of 15
Australian Assay
Laboratories Group

APPENDIX 2: Graphs of Assay Results

Table 1: Sarrple Nurcbers and Mines/f.lep:lsits Sarrpled.
SAMPLE # MINE/DEroSIT 8981001 cadjebut (zn/Pb) mine,
Western Australia 002 "
003 "
004 CSA (cu/zn/Pb) mine, New South Wales
005 "
006 "
007 E1ura (zn/Pb) mine, New South Wales
008 "
009
010 Mt Lyell (CU/kJ/Au) mine, Tasnania
011
012 "
013 lady loretta (zn/Pb) f.lep:lsit, Queensland
014 "
015
016 Selwyn (starra) CU/Au mine, Queensland
017 "
018 North (Zn/Pb/kJ) mine, New SOUth Wales
019 Selwyn (starra) OJ/Au
mine, Queensland 020 Warrego (CU/Bi/Au) mine,
Northern Territory 021
022 "
023 ZC (Zn/Pb/kJ) mine, New South Wales
024 W:lodcutters (Zn/Pb) mine, Northern Territory
025 "
Lotus File:SP.MPINUM
SAMPLE 'tYPE Mill feed
"
"
Mill feed
"
"
M:mthlyoorposite mill feed
"
"
Mill feed
"
Medium grade are drill core
High grade are drill core
IJ::M grade,baritic ore drill core
SUlphide are mill feed
"
amx::K S1\MPLE
armual oorposite Sulphide ore mill feed
M:mthlyoorposite mill feed
"
"
Annual Cl:xrp:)site mill feed
Mill feed
SAMPLE # MINE/DEroSIT 8981026 W::x:xllawn (Zn/Pb/CU)
mine, New South Wales
027 "
028 "
029 M:>unt lea (Zn/Pb/CU) mine, Queensland
030 "
031 "
032 "
033 "
034 "
035 North (Zn/Pb/kJ) mine, New South Wales
036 Hellyer (Zn/Pb/CU) mine, Tasnania
037 "
038 "
039 "
040 "
041 "
SAMPLE 'tYPE Cl::I1:plex are mill feed
"
"
weekly oorposite CU mill feed
"
"
weeklyoorposite Pb/Zn mill feed
"
"
amx::K SAMPLE mill feed annual oorposite
IJ::M grade Zn ore S1\G mill discharge
High As ore arsenic stockpile
Medium Zn are stockpile
High grade Zn are stockpile
"
"
042 M:>unt lea (Zn/Pb/CU) mine, Pb/zn tail
043 "
044 Lady loretta (zn/Pb) f.lep:lsit, Queensland
045 "
CU tail
Medium grade ore drill core
High grade are drill core
046 Rosebery (Zn/Pb/CU) mine, M:mthlyoorposite Tas. (incl Que River are) mill feed
047 "
048
049 Thalanga (Zn/Pb/CU) DepJsit, Queensland
050
051
052 selwyn (starra) CU/Au mine, Queensland
053 "
"
"
Central orebody drill core
Eastern orebody drill core
Western orebody drill core
I.eached are stockpile
Oxide are s'pile

o o !!I.
>oa
H g ~ ~
n .C
:: 'tI
0' .. r:.;
::J >
rn rn
III
'<
rn III
::J
g, ::: .... ;0
- '"
til j
<:.
.oN
<
:..0
-
(1)
<:..0
tt
l ..
.. "
"
o ~~-
tII •
.a e;
~:
ar <:
..0
tII[
zen
c...o
en ~~
.:::
III
CiJ
c...
o 3
0
....
u:>
'tl
0
~.
g,71.
.... en -co cD
P"~C."""1:
o U
I cs
u:
~
~
~
~
.- 0
f » C
adje
bu
t M
ine,
W
.A.
1 c-
:>
c::>
-0
M
ine,
NS
W
i '"
Elu
ra
Min
e,
NSW
.
Min
e,
Tas
man
ia.
-0
~S8
..,., r-
!~
Pc:;
::J
~::t>
I~
~
Lad
y L
ore
tta D
ep
osi
t,
Old
7
. ~2::
_ C
'J
~ S
elw
yn
(Sta
rra)
Min
e,
Old
.
Min
e,
N.T
.
4t
t W
oo
dcu
tter
s M
ine,
N
.T.
p.,
.c:.n
t
o c.
n c;
c::;
; ~
~
~
~
:1
} W
oodl
awn
Min
e,
NSW
.
Pb
jZn
Ore
~
Mt
Isa M
ine,
O
ld.
~::
} H
elly
er M
ine,
T
asm
ania
.
i Z
<<
* ~
Ro
seb
ery
Min
e,
Tas
man
ia.
~ T
hal
ang
a D
ep
osi
t,
Old
.
J t'--Nort~
Min
e,
NSW
. *
~ZC M~ne
, N
SW.
~G;
---(..
I")
::t>
~
a 1 C
'J
0 -0
-0
i~
m~
PC
)
~>
Z::
Z
I~
o :::
;:::::
:
=<:J
i;
:J>
..,.,
U
')
~c....n
==<
c....n
COPPER ASSAYS COPPER ASSAYS S4I.fPt.£S 89810 •• (AS NUMBERED ON X-AXIS). S\MPl.ES 89810 •• (AS NUMBERED ON X-AXIS).
5 5
4.5
4
3.5
3 3 .,
+' ( [ • • u u 2.5 l L • • (l 0.
2 2
1.5 ~
0.5
10 12 14 44 ~Ie NlITlbers
o copper FIGURE 2 o copper

CADMIUM AND ANTIMONY ASSAYS CADMIUM AND ANTIMONY ASSAYS WlPt.£S 89810 .. (AS NUUBERED ON X-AXlS~ m.ES 8981O •• (AS NUIlBERED ON X-AXIS). 1
1 2
1.9 1.9 1.8 t ~70 1.8 1.7 5100 + P 1.7 ppm 1.6
I 1.5
U
1.3 ,.. 1.2
" I , 11 1.1 "U
E ij E~ 0 1 1 0.' 0) Q.l 0 0.9 0 ! r l- t-v 0.8 v
0.1
\ 0.6
0.5
n 0.4 rI ~ 0.3
0.2 lHJ..O o.g.6 .~ 0.1 +-N 0 0
o tcmim .. ont~ FIGURE 3
o coctnitm .. onlinony

SCANDIUM,INDIUM, AND GALLIUM ASSAYS SCANDIUM,INDIUM, AND GALLIUM ASSAYS WflIS 89810 .• (AS NUIIIEREO ON X-AXIS).
~~---------------+--~~--~ SWPlES 898Io..(AS NUIIB£RED ON X-AXIS).
OO~-------------------4----~
40
JO 30 o-H 000000 ~
£ E It Q. It 0.
20 20 ~
10 ~ \ \
o SCOlWn f hIIm 0 gdlitm FIGURE 4 o sccRlium f ilditm 0 gdfnm

SELENIUM AND GERMANIUM ASSAYS SELENIUM AND GERMANIUM ASSAYS Sijf\£S 89810 •. (AS NUlIIERED ON X-AXIS). SAMPlES 89810 .. (AS NUloIBERED ON X-AXIS). 11 11
10 10
9 9
8
7
E 6
E Q 0. Q 0. 5
4 4
J 3 r 7 2
FIGURE 5

ynRIUM, lANTHANUM AND CERIUM ASSAYS WIPlIS 89810 .. (AS HUM8ERED ON X-AXIS).
OO~------~f--------------~
50
40
~ 30 It
O~56 ppm Of3 ppm
t 0119 ppm
+1 175 ppm
+t 173 ppm
+ 81.1 pp
o ~lriIm .. IanthcnIi1 0 em
~/.
YTTRIUM, LANTHANUM AND CERIUM ASSAYS SAJAPl£S 89810 .. (AS NUMBERED ON X-AXIS).
m~--------------------------____ ~
50
40
E Q. 30 J Q.
20
FIGURE 6
. .
[] yttrkm + lanlhcnrn 0 eM

E Q Q
PRASEO & NEODYMIUM AND SAMARIUM ASSAYS ~S 89810 .. (AS NUMBERED ON X-AXIS),
~~-----------------~t--------------~ +1 76 ppm
+ 77 ppm JO
f + 37 ppm
20
15 / 10
\
'I 0
2 4 6 8 10 12 14 44 Sclr4>1e Nmrs
o proseo<¥nftm .. ~ o S<ITKIIbn
PRASEO & NEODYMIUM AND SAMARIUM ASSAYS mfS 89810 .. (AS NUUBEREO ON X-AXIS).
~~------------------------------------------------~
30
25
20
E Q. Q.
15
to V ~ B-1
5
~;\~ 0
FIGURE 7 D~ .. neoa,mitm o sanoritm

E Q Q
EUROPIUM, GADOLINIUM & TERBIUM ASSAYS SWPlES 8981O .. {AS NIIMBERED ON X-AXIS).
5~--------~------------~
4
3
2 (
4 6 8
D europium + godoIinhm 0 terbhm
EUROPIUM, GADOLINIUM & TERBIUM ASSAYS SAMPlES 89810 .. (AS NUlIBERED ON X-AXIS). 5r-----------------------__ ~
4
J
E Q. IL
2
EtGURE 8 o europhm + godoliniun 0 lem

DYSPROSIUM, HOLMIUM & ERBIUM ASSAYS DYSPROSIUM, HOLMIUM & ERBIUM ASSAYS 6~----------------~~ __ ___ SNAPI.ES 89810 .. (AS NUMBERED ON X-AXIS).
6~----------------________ ~
5 5
4 4
£ E J
~ 0. 3 0. 0. 0. . .
2 n ~ \ 2 ~~J r I y¥\~ ~H 0 \
0
.. hoIrnhm 0 erbh.m FIGURE 9

E 0. 0.
THULIUM, ffiERBIUM & LUTETIUM ASSAYS SAMPlIS 89810 .. (AS NUMBERED ON X-AXlS~
2.6.------------_-.,
2.4
2.2
2
1.8
1.6
1.4
1.2
0.8
0.6
0.4 / 0.2
o thurnm + ytterbitm 0 kJteU\III
E Q. Q.
FIGURE 10
THULIUM, YTTERBIUM & LUTETIUM ASSAYS SAMPlfS 89810 .. (AS HUWERED ON X-AXIS).
2.6r-------------_-.,
J t 0.6
0.4
D Ihufitm + ytlerbitm 0 IuletilJTl