burden & pattern of illnesses among the tribal …icmr.nic.in/ijmr/2015/may/0523.pdfburden & pattern...
10
Burden & pattern of illnesses among the tribal communities in central India : a report from a community health programme Yogesh Jain, Raman Kataria, Sushil Patil, Suhas Kadam, Anju Kataria, Rachna Jain, Ravindra Kurbude & Sharayu Shinde Jan Swasthya Sahyog, Village and Post Ganiyari, Bilaspur (Chhattisgarh), India Received November 14, 2014 Tribals are the most marginalised social category in the country and there is little and scattered information on the actual burden and pattern of illnesses they suffer from. This study provides information on burden and pattern of diseases among tribals, and whether these can be linked to their nutritional status, especially in particularly vulnerable tribal groups (PVTG) seen at a community health programme being run in the tribal areas of Chhattisgarh and Madhya Pradesh States of India. This community based programme, known as Jan Swasthya Sahyog (JSS) has been serving people in over 2500 villages in rural central India. It was found that the tribals had significantly higher proportion of all tuberculosis, sputum positive tuberculosis, severe hypertension, illnesses that require major surgery as a primary therapeutic intervention and cancers than non tribals. The proportions of people with rheumatic heart disease, sickle cell disease and epilepsy were not significantly different between different social groups. Nutritional levels of tribals were poor. Tribals in central India suffer a disproportionate burden of both communicable and non communicable diseases amidst worrisome levels of undernutrition. There is a need for universal health coverage with preferential care for the tribals, especially those belonging to the PVTG. Further, the high level of undernutrition demands a more augmented and universal Public Distribution System. Key words Burden of illnesses - Cancer - diabetes - non communicable diseases - particularly vulnerable tribal groups (PVTG) - Tuberculosis - surgical needs - tribals - under nutrition Indian J Med Res 141, May 2015, pp 663-672 663 Status Paper Introduction While there is a broad consensus that tribals are among the poorest social groups in the country 1 , and figures about high levels of undernutrition among tribal adults and children are available 2 , a concomitant concern about the illnesses they suffer from is not so obvious 3,4 .There is little and scattered information on the actual burden and patterns of the illnesses that afflict them 1,4,5-7 . The challenge of inaccessibility to health services and their health care seeking behaviour seem to dominate the discourse in tribal health 1,6 . Further, it is still believed that tribals suffer mainly from infections and selected non-communicable diseases such as hypertension while other illnesses like cancer, diabetes, mental illnesses, illnesses that require surgery and heart diseases are thought to be uncommon among them 8-12 .
Transcript of burden & pattern of illnesses among the tribal …icmr.nic.in/ijmr/2015/may/0523.pdfburden & pattern...

burden & pattern of illnesses among the tribal communities in central India : a report from a community health programme
Yogesh Jain, Raman Kataria, Sushil Patil, Suhas Kadam, Anju Kataria, Rachna Jain, Ravindra Kurbude & Sharayu Shinde
Jan Swasthya Sahyog, Village and Post Ganiyari, Bilaspur (Chhattisgarh), India
Received November 14, 2014
Tribals are the most marginalised social category in the country and there is little and scattered information on the actual burden and pattern of illnesses they suffer from. This study provides information on burden and pattern of diseases among tribals, and whether these can be linked to their nutritional status, especially in particularly vulnerable tribal groups (PVTG) seen at a community health programme being run in the tribal areas of chhattisgarh and Madhya Pradesh States of India. This community based programme, known as Jan Swasthya Sahyog (JSS) has been serving people in over 2500 villages in rural central India. It was found that the tribals had significantly higher proportion of all tuberculosis, sputum positive tuberculosis, severe hypertension, illnesses that require major surgery as a primary therapeutic intervention and cancers than non tribals. The proportions of people with rheumatic heart disease, sickle cell disease and epilepsy were not significantly different between different social groups. Nutritional levels of tribals were poor. Tribals in central India suffer a disproportionate burden of both communicable and non communicable diseases amidst worrisome levels of undernutrition. There is a need for universal health coverage with preferential care for the tribals, especially those belonging to the PVTG. Further, the high level of undernutrition demands a more augmented and universal Public Distribution System.
Key words burden of illnesses - Cancer - diabetes - non communicable diseases - particularly vulnerable tribal groups (PVTG) - Tuberculosis - surgical needs - tribals - under nutrition
Indian J Med Res 141, May 2015, pp 663-672
663
Status Paper
Introduction
While there is a broad consensus that tribals are among the poorest social groups in the country1, and figures about high levels of undernutrition among tribal adults and children are available2, a concomitant concern about the illnesses they suffer from is not so obvious3,4.There is little and scattered information on the actual burden and patterns of the illnesses that
afflict them1,4,5-7. The challenge of inaccessibility to health services and their health care seeking behaviour seem to dominate the discourse in tribal health1,6. Further, it is still believed that tribals suffer mainly from infections and selected non-communicable diseases such as hypertension while other illnesses like cancer, diabetes, mental illnesses, illnesses that require surgery and heart diseases are thought to be uncommon among them8-12.

664 INDIAN J MED RES, MAY 2015
The context and the people
Jan Swasthya Sahyog (People’s Health Support Group or JSS) is a group of health professionals running a community health programme with a three tiered structure that includes a referral hospital accessed by people from over 2500 villages drawn from seven districts of bilaspur, Kawardha, Janjgir-Champa, and Korba of Chhattisgarh and Dindori, Anuppur and Shahdol of Eastern Madhya Pradesh (Fig. 1) for their major health care needs, three outreach clinics in forest fringe and forest village clusters serving about 150 villages and an intensive community programme served by two hamlet based village health workers each in 70 forest villages. In the intensive community programme 67 per cent of the people are tribals whereas 32 per cent patients who access the referral centre are tribals. The most common tribes in the area are the Gonds, Baigas, Kols, Kanwar, Oraons, Dhanuhar, Bhumias and Manjhis; 19 per cent of the total population in the intensive community programme and 2.4 per cent of those attending the referral centre belong to the particularly vulnerable tribal groups (PVTG) such as Baigas, Dhanuhars and Manjhis. In the community programme, 65.5 per cent families had
a below Poverty Line (bPL) card whereas 2.9 per cent had an Antyodyaya card. Twenty two per cent families were landless and the median land holding was 1.8 acres per household. At the referral centre, data from people attending one single outpatient clinic suggested that 77.5 per cent were living in kachcha houses, 14.8 per cent in semi-pucca houses and only 7.8 per cent were living in pucca houses. Fifty three per cent of the outpatients possessed a Rashtriya Swasthya Bima Yojana card, and almost 90.1 per cent had a food rations bPL card issued by the government of Chhattisgarh or Madhya Pradesh.
This community health programme has been running for the last 15 years. The demographic, nutritional and disease related information on these tribal communities has been collected. To understand the burden of illnesses we faced and tried to answer the following questions: (i) What are the burden and the spectrum of illnesses in a tribal population of this area when a reasonable effective health care service is provided?; (ii) Do tribals have a less complex pattern of illnesses than non-tribals?; (iii) Do tribals suffer from less or more proportion of common illnesses such as tuberculosis, diabetes, cancer and other illnesses
Fig. 1. Regions of Chattisgarh and Madhya Pradesh States from where patients come to Jan Swasthya Sahyog (JSS) health centres.
Ganiyari: Referral Centre
Bamhani, Semariya, Shivtarai: Subcenters
Population Served By-
Intensive Community Programme
Subcenters
Referral Center
Lormi
EastErnMadhya PradEsh
north-wEstErnchattisgarh
KotaMungeli
Mungeli

than non tribals?; (iv) What is the nutritional status of the people who present with these illnesses, and does it differ between various people belonging to different social categories?; and (v) Do people belonging to the PVTGs have worse nutritional status or illness presentations than among non PVTGs?
The referral centre provides comprehensive primary, secondary and where necessary appropriate tertiary care for many illnesses; for example, obstetric emergencies, ultrasonography, CT/MRI and laboratory investigations for serology, microbiology, hormonal assays, blood transfusion where necessary, treating drug resistant and complicated tuberculosis, severe anaemia, severe falciparum malaria, sickle cell disease including crisis, offering common surgeries, surgical and chemotherapy based cancer care, group therapy to people with alcohol dependence and secondary level care for mental health problems.
We present here data on pattern of illnesses and undernutrition, collected and analysed for over a period of 14 years, but majority of the data are for four years, 2010 to 2013.
Anthropometric data as a measure of the nutritional status and data of several major illnesses as well as demographic information of all people were recorded electronically. Weights to the nearest 100 grams and heights or lengths (below 2 yr of age) to the nearest centimetres were recorded for all patients who attended
the referral hospital and the sub-centres at each visit, and body mass index calculated.
Data were also collected for the serious manifestations of some illnesses in social categories. These manifestations included proportion of advanced forms of cancer cervix such as stages 2b, 3 and 4; proportion of sputum positive tuberculosis as proportion of all pulmonary tuberculosis; proportion of all extra-pulmonary tuberculosis as part of all patients with the disease; proportion of those illnesses that require major surgery; proportion of non-obese diabetes as proportion of all diabetes; and proportion of lepromatous or borderline lepromatous leprosy. The pattern of three indicative illnesses, tuberculosis, diabetes and cancers was studied. The overall health and nutritional status of the people belonging to the PVTG and other tribal groups was assessed.
In the JSS clinics, major illnesses such as tuberculosis, rheumatic heart disease (RHD), diabetes mellitus (DM), cancers, severe hypertension, illnesses that require surgery as their primary treatment and leprosy were seen in substantial numbers during 2010-2013 (Table I). The hospitalization rate for people who belonged to the community programme (n=35,669) at the JSS health service was 14.6 per 1000 in 2012, which was similar to that of other urban areas in India13. All tuberculosis, pulmonary tuberculosis and cancers were disproportionately more among tribals than non tribals (P<0.001), whereas diabetes and
Table I. Patients seen at Jan Swasthya Sahyog (JSS) clinics, 2010-2013
Illness All Non-adivasis Tribal excluding Baigas
Baigas P value
OPD attendance 59039 40115 17560 1364
All tuberculosis 1993 1070 (2.67) 812 (4.62) 111 (8.14) <0.001
Pulmonary tuberculosis 1272 (of 1993) 587 (54.86) 601 (74.01) 84 (75.68) <0.001
Sputum positive tuberculosis 894 (of 1272) 451 (76.83) 392 (55.92) 51 (60.71) <0.001
Rheumatic heart disease 383 258 (0.64) 118 (0.68) 7 (0.51) 0.792
Diabetes 1061 825 (2.06) 224 (1.28) 12 (0.88) <0.001
Severe hypertension (≥180 or diastolic≥110mm Hg) 1153 734 (1.83) 396 (2.26) 23 (1.69) 0.002
Cancers 1635 1037 (2.59) 559 (3.18) 39 (2.86) <0.001
Illnesses requiring major surgery 2192 1474 (3.67) 633 (3.60) 85 (6.23) <0.0001
Leprosy 513 337 (0.84) 156 (0.89) 20 (1.47) <0.05
Lepromatous leprosy 137 91 (27.0) 40 (25.64) 6 (30) 0.90
Values in parentheses represent percentages, P values according to Chi-square Test or Fisher’s exact test.
JAIN et al: buRDEN OF ILLNESS IN TRIbALS 665
sputum positive tuberculosis as a proportion of all pulmonary tuberculosis was more common among the non tribals (Table I). Further, those illnesses that require major surgery for their treatment and leprosy were significantly more common among people belonging to the particularly vulnerable tribal groups than among the non tribals. Rheumatic heart disease was not observed to be differently distributed among the social categories.
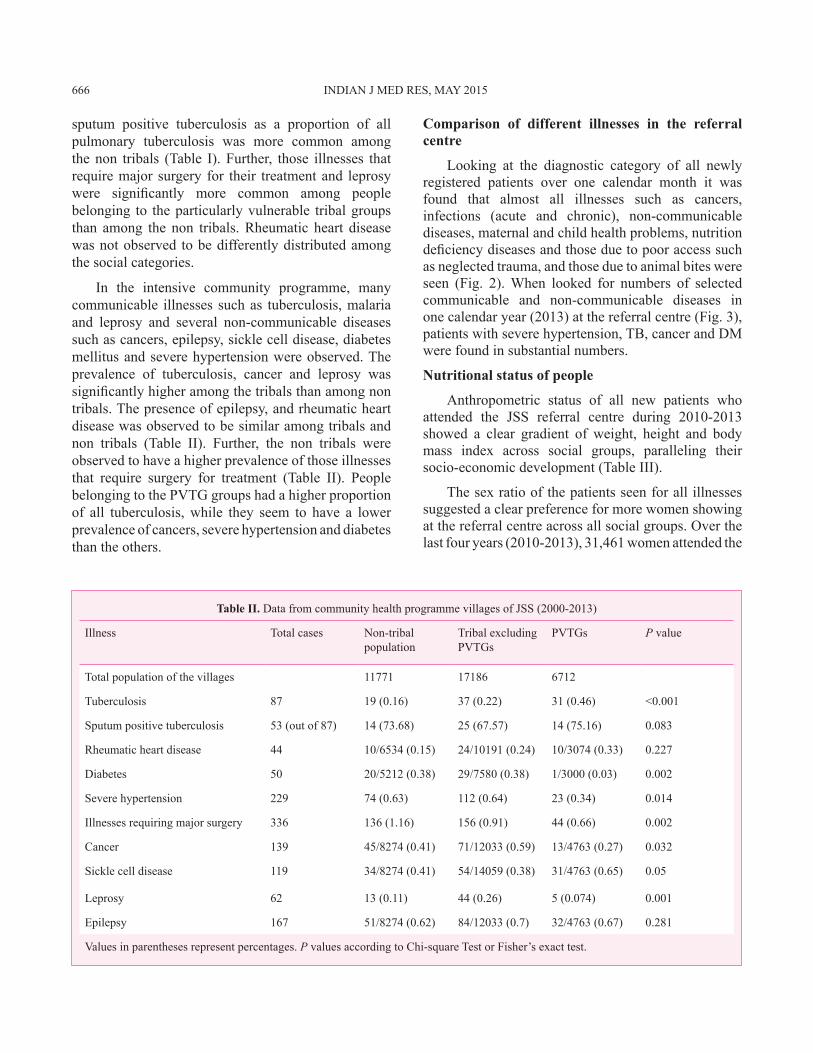
In the intensive community programme, many communicable illnesses such as tuberculosis, malaria and leprosy and several non-communicable diseases such as cancers, epilepsy, sickle cell disease, diabetes mellitus and severe hypertension were observed. The prevalence of tuberculosis, cancer and leprosy was significantly higher among the tribals than among non tribals. The presence of epilepsy, and rheumatic heart disease was observed to be similar among tribals and non tribals (Table II). Further, the non tribals were observed to have a higher prevalence of those illnesses that require surgery for treatment (Table II). People belonging to the PVTG groups had a higher proportion of all tuberculosis, while they seem to have a lower prevalence of cancers, severe hypertension and diabetes than the others.
comparison of different illnesses in the referral centre
Looking at the diagnostic category of all newly registered patients over one calendar month it was found that almost all illnesses such as cancers, infections (acute and chronic), non-communicable diseases, maternal and child health problems, nutrition deficiency diseases and those due to poor access such as neglected trauma, and those due to animal bites were seen (Fig. 2). When looked for numbers of selected communicable and non-communicable diseases in one calendar year (2013) at the referral centre (Fig. 3), patients with severe hypertension, Tb, cancer and DM were found in substantial numbers.
Nutritional status of people
Anthropometric status of all new patients who attended the JSS referral centre during 2010-2013 showed a clear gradient of weight, height and body mass index across social groups, paralleling their socio-economic development (Table III).
The sex ratio of the patients seen for all illnesses suggested a clear preference for more women showing at the referral centre across all social groups. Over the last four years (2010-2013), 31,461 women attended the
Table II. Data from community health programme villages of JSS (2000-2013)
Illness Total cases Non-tribal population
Tribal excluding PVTGs
PVTGs P value
Total population of the villages 11771 17186 6712
Tuberculosis 87 19 (0.16) 37 (0.22) 31 (0.46) <0.001
Sputum positive tuberculosis 53 (out of 87) 14 (73.68) 25 (67.57) 14 (75.16) 0.083
Rheumatic heart disease 44 10/6534 (0.15) 24/10191 (0.24) 10/3074 (0.33) 0.227
Diabetes 50 20/5212 (0.38) 29/7580 (0.38) 1/3000 (0.03) 0.002
Severe hypertension 229 74 (0.63) 112 (0.64) 23 (0.34) 0.014
Illnesses requiring major surgery 336 136 (1.16) 156 (0.91) 44 (0.66) 0.002
Cancer 139 45/8274 (0.41) 71/12033 (0.59) 13/4763 (0.27) 0.032
Sickle cell disease 119 34/8274 (0.41) 54/14059 (0.38) 31/4763 (0.65) 0.05
Leprosy 62 13 (0.11) 44 (0.26) 5 (0.074) 0.001
Epilepsy 167 51/8274 (0.62) 84/12033 (0.7) 32/4763 (0.67) 0.281
Values in parentheses represent percentages. P values according to Chi-square Test or Fisher’s exact test.
666 INDIAN J MED RES, MAY 2015

Fig. 2. Spectrum of illnesses for new patients over one calendar month (November 2010) in the referral centre. NCD, non communicable diseases
outpatient clinics compared to 27,578 men. Further, 47.9 per cent of people with body mass index (bMI) less than 16 kg/m2were tribals, but only 16.1 per cent of those with bMI more than 25 were tribals (Fig. 4). The proportion of tribals in the higher bMI categories appeared to have declined.
In the self-help groups in the community programme, the proportion of women with abnormally high waist-hip ratio was less in tribal women than in women of other social groups. The proportion of women
with abnormally high waist-hip ratio (more than 0.9) was 32.5 per cent among ObCs and Schedule Castes, where as it was 23.4 per cent among tribal women.
Tuberculosis
The median weights and bMI of people with tuberculosis were 42.4 kg and 16.2 kg/m2 in men and 36.4 kg and 15.8 kg/m2 in women, respectively among 1517 adult patients seen over 2010 to 2013. More women (260 of 481, 54 %) than men (485 of 1036, 46.8%) had severe undernutrition (bMI < 16 kg/m2)
Cancer
Diseases of poor access
Nutrition
Illness requiring surgery
Child and meternal problems
Infection
NCD
0 20 40 60 80 100 120
Fig. 3. Number of new diagnosis of selected major illnesses in one year (2013).
600
400
200
0
Severe
Hypert
ensio
nTu
berculosis
Cance
rs
Diabete
s
Illnes
ses r
equirin
g emerg
ency
surg
eryFalc
iparum M
alaria
Sickle
cell d
iseas
e
Lepro
sy
Rheumati
c hea
rt dise
ase
Chronic
renal
failure
Chronic
renal
failure
JAIN et al: buRDEN OF ILLNESS IN TRIbALS 667

Table III. Social group wise median weights, heights (cm), body mass index (bMI), gender disaggregated of patients seen at JSS referral centre OPD (2010-2013, n = 47,216 patients)
Social groups Weight (kg) (n=47601) Height (cm) (n=6336) bMI (kg/m2) (n=6329)
Men (n= 21706)
Women (n= 25895)
Men (n= 2888)
Women (n= 3448)
Men (n= 2883)
Women (n= 3446)
PVTGs 46.3 (41.8-52.1)
40.55 (36-45.6)
160(154-164)
151(147-153)
17.55 (15.77-19.25)
17.68 (16.08-20.30)
Non PVTGs tribal
49.4 (44.6-54.6)
42.6 (38.1-47.7)
162(158-166)
152(148-155)
18.65 (16.93-20.40)
18.56 (16.90-20.69)
Scheduled Caste 50.9 (45.6-57.1)
44.2 (39.3-50.8)
163(158-166)
151(148-155)
19.38 (17.36-21.62)
19.46 (17.51-22.40)
ObCs 50.6 (45.5-56.6)
44.1 (39.5-50.1)
162(158-166)
151(148-155)
19.18 (17.51-21.53)
19.68 (17.66-22.07)
General 55 (48.3-63.8)
48.8 (42.3-58.4)
165(161-169)
152(149-156)
19.78 (17.84-22.63)
20.46 (18.38-23.67)
ObC, other backward classes; PVTGs, particularly vulnerable tribal groups. Values in parentheses indicate 95% CI
Fig. 4. Proportion of people (in %) in different bMI categories in each social category. STs, scheduled tribes; SCs, scheduled ceastes; ObC, other backward classes.
(P=0.008). While people from several social categories such as tribal, Schedule Castes and ObCs had low median weights and BMI, no significant difference was observed between their anthropometric status. Median bMIs were not different between tribals and non tribals.
Not surprisingly, sputum positive tuberculosis was high as a proportion of all pulmonary tuberculosis in all groups of patients (894 of 1272; 70.2%), suggesting delayed presentation. Further, 443 of 685 tribals with pulmonary tuberculosis were sputum positive compared to 451 of 587 in the non tribals (P<0.001),
668 INDIAN J MED RES, MAY 2015
50.00
45.00
40.00
35.00
30.00
25.00
20.00
15.00
10.00
05.00
00.00≤16 16.01-18.50 18.5 - 20
BMI (kg/m2)
(% p
eopl
e)
20 - 25 ≥25
tribal
scheduled caste
other backward class
general
(Table I). There were 95 deaths (4.8%) in four years. Seventy two per cent of these deaths happened in those with bMI less than 16.
Diabetes mellitus
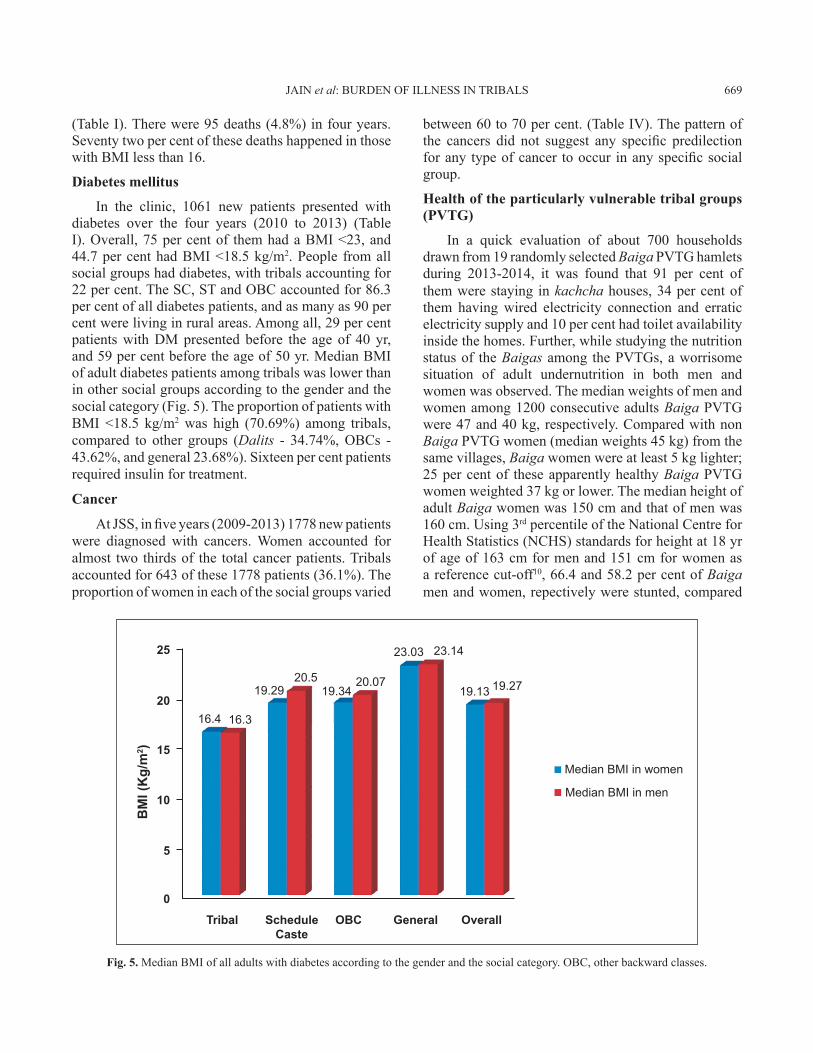
In the clinic, 1061 new patients presented with diabetes over the four years (2010 to 2013) (Table I). Overall, 75 per cent of them had a bMI <23, and 44.7 per cent had bMI <18.5 kg/m2. People from all social groups had diabetes, with tribals accounting for 22 per cent. The SC, ST and ObC accounted for 86.3 per cent of all diabetes patients, and as many as 90 per cent were living in rural areas. Among all, 29 per cent patients with DM presented before the age of 40 yr, and 59 per cent before the age of 50 yr. Median bMI of adult diabetes patients among tribals was lower than in other social groups according to the gender and the social category (Fig. 5). The proportion of patients with bMI <18.5 kg/m2 was high (70.69%) among tribals, compared to other groups (Dalits - 34.74%, ObCs - 43.62%, and general 23.68%). Sixteen per cent patients required insulin for treatment.
cancer
At JSS, in five years (2009-2013) 1778 new patients were diagnosed with cancers. Women accounted for almost two thirds of the total cancer patients. Tribals accounted for 643 of these 1778 patients (36.1%). The proportion of women in each of the social groups varied
between 60 to 70 per cent. (Table IV). The pattern of the cancers did not suggest any specific predilection for any type of cancer to occur in any specific social group.
Health of the particularly vulnerable tribal groups (PVTG)
In a quick evaluation of about 700 households drawn from 19 randomly selected Baiga PVTG hamlets during 2013-2014, it was found that 91 per cent of them were staying in kachcha houses, 34 per cent of them having wired electricity connection and erratic electricity supply and 10 per cent had toilet availability inside the homes. Further, while studying the nutrition status of the Baigas among the PVTGs, a worrisome situation of adult undernutrition in both men and women was observed. The median weights of men and women among 1200 consecutive adults Baiga PVTG were 47 and 40 kg, respectively. Compared with non Baiga PVTG women (median weights 45 kg) from the same villages, Baiga women were at least 5 kg lighter; 25 per cent of these apparently healthy Baiga PVTG women weighted 37 kg or lower. The median height of adult Baiga women was 150 cm and that of men was 160 cm. using 3rd percentile of the National Centre for Health Statistics (NCHS) standards for height at 18 yr of age of 163 cm for men and 151 cm for women as a reference cut-off10, 66.4 and 58.2 per cent of Baiga men and women, repectively were stunted, compared
Fig. 5. Median bMI of all adults with diabetes according to the gender and the social category. ObC, other backward classes.
JAIN et al: buRDEN OF ILLNESS IN TRIbALS 669
25
2016.4 16.3
19.2920.5
19.3420.07
23.03 23.14
19.13 19.27
Median BMi in women
Median BMi in men
15
10
5
0
Tribal Schedule Caste
OBC General Overall
BM
I (K
g/m
2 )

with 38.6 per cent of non Baiga women with stunted growth.
Table V shows that of the 1205 adult Baiga PVTG studied, about half (51.4%) had bMI <18.5 kg/m2 (47.7% men, 54.4% women). Of these, 10.8 per cent (7.2% men and 13.6 % women) had bMI<16 kg/m2 (Table IV). Only 1.3 per cent men and 1.8 per cent women had bMI >25 kg/m2.
This community health programme provides the estimates of disease burden largely reflecting passive case detection and is an underestimation of the true prevalence/incidence of most illnesses in the tribal community. An unequal high burden of illnesses was observed among tribals along with poor levels of nutrition.
There were several lacunae in the data such as completeness and small numbers in some illnesses. Further, data on maternal deaths were not collected. While there are studies documenting large numbers of people with hypertension and diabetes9,14, the large
numbers of tribals with rheumatic heart diseases, illnesses requiring surgical care, animal bites, chronic renal failure as well as large numbers and more complex presentations of major communicable diseases have not been documented before. With a relative risk of 4.49 for developing tuberculosis at a bMI 18.515 kg/m2(Ref. 15) and a RR of 2 in the risk of death with bMI lower than 1616, much higher burden as well as poorer outcomes would be expected in tribals due to their poorer nutritional status.
Falciparum malaria is one of the biggest illnesses being faced by tribals. Tribals constitute only 8.6 per cent of the population according to the census 2011 data but account for about 30 per cent of all cases of malaria and 50 per cent of malaria deaths17,18.
Within the tribals, it was found that the health condition of PVTGs was much worse. The levels of undernutrition among the PVTGs were a cause of concern considering the fact that these were all normal adults working in the community. Compared to the national data of bMI in adults as seen in the National Family Health Survey-3 (NFHS-3)19 which showed 35.6 per cent of women and 34.2 per cent of men in the age group of 15-49 yr were undernourished, among the Baigas 54.4 per cent men and 47.7 per cent women were at least 15 percentage points higher than them. As many as 13 per cent women and seven per cent men had severe undernutrition as suggested by a bMI < 16 kg/m2. The rates of undernutrition put half of all adult Baigas at five times higher risk of getting tuberculosis than if they had a normal nutritional status.
The Indian Council of Medical Research (ICMR) has recommended weights and heights of 60 kg and 172 cm for adult Indian men, and 55 kg and 162 cm for adult Indian women20. Only 1.3 per cent men
Table IV. Types of cancers by gender at JSS referral centre (2009-2013) Among men Among womenCancer types Number (%) of
patientsNumber (%) of patients
Genitourinary (Cancer cervix for women)
63 (10.34) 601 (51.41)
Ovary 0 (0) 68 (5.82)breast 0 (0) 154 (13.17)Oral 177 (29.06) 94 (8.04)Gastrointestinal 134 (22) 71 (6.07)Others 235 (38.59) 181 (15.48)Total 609 (100) 1169 (100)
Table V. body mass index (kg/m2) distribution among PVTG men and women
Category Total adults Per cent in all No. (%) Men No. (%) Women
bMI less than 18.5 620 51.4 251 (47.7) 369 (54.4)
bMI less than 16 • 130 10.8 38 (7.2) 92 (13.6)
bMI between 16.01 and 17 • 172 14.3 62 (11.8) 110 (16.2)
bMI between 17.01 and 18.49 • 318 26.4 151 (28.7) 167 (24.6)
bMI between 18.50 and 24.99 566 47 269 (51.0) 297 (43.8)
bMI 25 and above 19 1.6 7 (1.3) 12 (1.8)
Total 1205 100 527 (100 ) 678 (100 )
670 INDIAN J MED RES, MAY 2015

and 1.8 per cent women among Baigas had a bMI > 25 kg/m2.
An obvious association between undernutrition and the burden of illnesses has emerged among these social groups. In illnesses like tuberculosis, the relative risk for undernutrition is well known16, but similar associations for illnesses like diabetes, or hypertension or falciparum malaria are not so well known.
There is a need to have a more augmented and universal Public Distribution System (PDS) that is not only looking at cereals, but also has a focus on promoting pulses and oilseeds cultivation by offering minimum support prices, by regaining highlands for cultivation and by offering cheap and good quality seeds.
We observed a high proportion of tuberculosis among the tribals, and within them among the PVTG. Among tribals there was a high proportion of those with tuberculosis and severe undernutrition (bMI <16 kg/m2). This has been documented in the past21,22.
There is a need to understand diabetes that we see among people in tribal areas. The median bMI of tribals with diabetes were 16.3 and 16.4 kg/m2, respectively for men and women and over 70 per cent had bMI less than 18.5. This is in contrast with the usual association between obesity and diabetes22. This high prevalence of undernutrition was in contrast to other clinic/hospital based reports from urban India which indicated the prevalence of low body weight in type 2 DM in only a 3.5-29 per cent24. It is possible that there are different phenotypes of adult onset diabetes. At JSS, the median age of onset among diabetes patients was found to be 37.5 yr in women and 45 yr in men of Baiga tribe, while it was 50 yr for both women and men with diabetes belonging to other social groups. This accelerated age of onset of diabetes in India has been noted in other studies25,26 as well, but the reasons are unclear.
Given the spectrum of illnesses among tribals, universal health coverage is the only way forward as there is a heavy disease burden among the tribals.
Acknowledgment
Authors thank all the founding doctors- C Sathyamala,Anurag bhargava, biswaroop Chatterjee, Madhuri Chatterjee, Madhavi bhargava, Pramod upadhyay as well as Surabhi Sharma, Ramani Atkuri, Ravi D Souza and other doctors who worked in this health programme as over 200 other health professionals who work and run this work.
References balg1. ir R. Tribal health problems, disease burden and ameliorative challenges in tribal communities with special emphasis on tribes of Orissa; 2006. Available from: http://www.rmrct.org/files_rmrc_web/centre’s_publications/NSTH_06/NSTH06_22.RS.Balgir.pdf, accessed on September 28, 2014.Rao VG, Yadav R, Dolla CK, Kumar S, bhondeley MK, ukey 2. M. undernutrition & childhood morbidities among tribal preschool children. Indian J Med Res. 2005;122 : 43-7. Kshatriya G. Changing perspectives of tribal health in the 3. context of increasing lifestyle diseases in India. J Environ Soc Sci 2014; 1 : 1-7. Das S. Childhood undernutrition: A comparative analysis of 4. Scheduled Tribes and others in the mid-Indian Tribal Region. Social Change 2008; 38 : 64-83.Planning Commission of Government of India. 5. Report of the Working Group on Communicable Disease Burden for the 12th Five Year Plan. New Delhi: Planning Commission; 2011.Planning Commission of Government of India. 6. Report of the Working Group on Non-Communicable Disease Burden for 12th Five Year Plan. New Delhi: Planning Commission; 2011.Kasar PK, Toppo NA. Prevalence, awareness, treatment and 7. control of hypertension and diabetes among tribal population of central India : A cross-secttional study. IEA World Congr Epidemiol 2014; 1-2. Tribhuwan RD. 8. Health, medicine, and nutrition of the tribals. New Delhi: Discovery Publishing House Pvt. Ltd.; 2004: p. 72.Rizwan S, Kumar R, Singh AK, Kusuma YS, Yadav K, Pandav 9. CS. Prevalence of hypertension in Indian tribes: a systematic review and meta-analysis of observational studies. PLoS One 2014; 9(5) : e95896. Muniyadi M, Singh N. Tribal health inequity: Challenges 10. remain. Tribal Heal Bull 2013; 17 : 8-14.World Health Organization (WHO). In: 11. Global status report on noncommunicable diseases 2010: Burden: mortality, morbidity and risk factors. Geneva: WHO; 2010. p. 9-31.Kerketta AS, bulliyya G, babu b V, Mohapatra SS, Nayak 12. RN. Health status of the elderly population among four primitive tribes of Orissa, India: a clinico-epidemiological study. Z Gerontol Geriatr 2009; 42 : 53-9. Ranson M. Reduction of catastrophic health care expenditures 13. by a community-based health insurance scheme in Gujarat, India: current experiences and challenges. Bull World Health Organ 2002; 1 : 613-21. upadhyay RP, Misra P, Chellaiyan VG, Das TK, Adhikary 14. M, Chinnakali P, et al. burden of diabetes mellitus and prediabetes in tribal population of India: a systematic review. Diabetes Res Clin Pract 2013; 102 : 1-7. Cegielski JP, Arab L, Cornoni-Huntley J. Nutritional risk 15. factors for tuberculosis among adults in the united States, 1971-1992. Am J Epidemiol 2012; 176 : 409-22. bhargava A, Chatterjee M, Jain Y, Chatterjee b, Kataria A, 16. bhargava M, et al. Nutritional status of adult patients with
JAIN et al: buRDEN OF ILLNESS IN TRIbALS 671

pulmonary tuberculosis in rural central India and its association with mortality. PLoS One 2013; 8 : e77979. Sharma VP. Re-emergence of Malaria in India. 17. Indian J Med Res 1996; 103 : 26-45.Singh N. Tribal malaria, an update on changing epideomiology. 18. Available from: http://www.rmrct.org/files_rmrc_web/centre% 27s_publications/nsth_06/nsth06_6.n.singh.pdf, accessed on May 14, 2015.International Institute for Population Sciences (IIPS). 19. National Family Health Survey 3. (NFHS-3), 2005-2006, India. Mumbai: IIPS; 2007.Indian Council of Medical Research. 20. Nutrient requirements and recommended dietary allowances for Indians. Hyderabad: National Institute of Nutrition; 2010.Yadav R, Rao VG, bhat J, Gopi PG, Selvakumar N, Wares 21. DF. Prevalence of pulmonary tuberculosis amongst the baigas
Reprint requests: Dr Yogesh Jain, Village and PO-Ganiyari, bilaspur 495 112, Chhattisgarh, India e-mail: [email protected]
- a primitive tribe of Madhya Pradesh, central india. Indian J Tuberc 2010; 3 : 114-6.Chatterjee P, baag P, Hossain A. 22. TB in tribal community in Uttar Dinajpur (West Bengal) in 2011. Available from: www.mfcindia.org/main/bgpapers/bgpapers2014/..../bgpap2014c.pdf., accessed on May 21, 2015.Hossain P, Kawar b, El Nahas M. Obesity and diabetes in the 23. developing world--a growing challenge. N Engl J Med 2007; 356 : 213-5.Das S. Low body weight type 2 diabetes mellitus. 24. Int J Diab Dev Countries 2003; 23 : 66-74.Srivastava S. Early Onset of type 2 Diabetes in Pune. 25. Ethno Med 2013; 7 : 95-9.Mohan V, Sandeep S, Deepa R, Shah b, Varghese C. 26. Epidemiology of type 2 diabetes: Indian scenario. Indian J Med Res 2007; 125 : 217-30.
672 INDIAN J MED RES, MAY 2015