Burden of Child Malnutrition in India - cdn1.sph.harvard.edu · Transforming India (NITI) Aayog,...
13
SPECIAL ARTICLE JANUARY 12, 2019 vol lIV no 2 EPW Economic & Political Weekly 44 Burden of Child Malnutrition in India A View from Parliamentary Constituencies Akshay Swaminathan, Rockli Kim, Yun Xu, Jeffrey C Blossom, William Joe, R Venkataramanan, Alok Kumar, S V Subramanian In India, monitoring and surveillance of health and well-being indicators have been focused primarily on the state and district levels. Analysing population data at the level of parliamentary constituencies has the potential to bring political accountability to the data-driven policy discourse that is currently based on district-level estimates. Using data from the fourth National Family Health Survey 2016, two geographic information systems methodologies have been developed and applied to provide estimates of four child malnutrition indicators (stunting, underweight, wasting, and anemia) for the 543 parliamentary constituencies in India. The results indicate that several constituencies experience a multiple burden of child malnutrition that must be addressed concurrently and as a priority. (Appendix Figures A1–A5 and Tables A1–A4 accompanying this article are available on the EPW website.) Alok Kumar and R Venkataramanan would like to state that interpretations made in this article do not reflect the views of their respective affiliated institutions. This research was supported by the Harvard Center for Population and Development Studies, and the Tata Trusts. Akshay Swaminathan ([email protected]) is at the Department of Statistics, Harvard University, Cambridge. Rockli Kim ( [email protected] ) is at the Department of Social and Behavioral Sciences, Harvard TH Chan School of Public Health, Boston. Yun Xu ( [email protected]) and S V Subramanian (svsubram@hsph. harvard.edu) are at the Harvard Center for Population and Development Studies, Cambridge. Jeffrey C Blossom ( [email protected]) is at the Center for Geographic Analysis, Harvard University, Cambridge. William Joe ([email protected]) is at the Population Research Centre, Institute of Economic Growth, Delhi. R Venkataramanan ([email protected]) is with the Tata Trusts, Mumbai. Alok Kumar ([email protected]) is with the NITI Aayog, Government of India, New Delhi. I n India, monitoring and surveillance of health and well-being indicators have largely focused on states, and increasingly on districts. For instance, the National Institution for Transforming India (NITI ) Aayog, the premier think tank of the Government of India ( GoI ), continues to release financial, labour, education, health, infrastructure, and poverty statistics only at the state and district levels. Since many of the most prominent sources of population data now report district-level outcomes, districts have become the unit of interest and inter- vention in policy discourse. For instance, the fourth National Family Health Survey 2016 ( NFHS-4), conducted across India, released district-level data on a variety of health, nutrition and population indicators. The NITI Aayog Aspirational Districts Programme, which aims to prioritise 115 districts across India for intervention—identified due to their lagging development indicators—is one example of an increased focus on districts in development policy ( NITI Aayog 2018). An increased policy focus on districts creates a virtuous cycle, which in turn neces- sitates even more data collection at the district level, resulting in discourse that is evidence-based. Another decentralised geographical unit of substantial political influence in India is the parliamentary constituencies ( PCs ): the 543 geographical regions represented by the members of Parliament ( MPs ) of the Lok Sabha. The MPs of the Lok Sabha are elected by first-past-the-post universal adult suffrage and serve five-year terms in the lower house of the Parliament (Parliament of India 2017). Unlike districts that do not have any direct governmental accountability, a focus on PCs can bring a greater degree of accountability to policy vision and implementation since the MPs are directly responsible for the well-being of their constituents. Whereas health and de- velopment indicators and other population data are widely available at the district level, there is a notable scarcity of PC-level data. This lack of PC-level data steers policy discourse away from PCs, which in turn discourages data collection at the PC level. PCs are relevant not only due to their direct representation of people, but also because of the resources allocated to them by the national government. In 1993, the GoI established the Members of Parliament Local Area Development Scheme ( MPLADS ), wherein each year every MP may receive up to `5 crore to carry out development projects in their respective PCs ( MoSPI 2017a). To date, `31,833.35 crore has been disbursed to Lok Sabha MPs by the GoI as part of the MPLADS programme ( MoSPI 2017b). The appendix published on the website was erroneous and has been replaced by the correct one. The corresponding citations in the main text to the tables and figures in the appendix have been corrected. This is the corrected version of the article.
Transcript of Burden of Child Malnutrition in India - cdn1.sph.harvard.edu · Transforming India (NITI) Aayog,...

SPECIAL ARTICLE
JANUARY 12, 2019 vol lIV no 2 EPW Economic & Political Weekly44
Burden of Child Malnutrition in IndiaA View from Parliamentary Constituencies
Akshay Swaminathan, Rockli Kim, Yun Xu, Jeffrey C Blossom, William Joe, R Venkataramanan, Alok Kumar, S V Subramanian
In India, monitoring and surveillance of health and
well-being indicators have been focused primarily on
the state and district levels. Analysing population data at
the level of parliamentary constituencies has the
potential to bring political accountability to the
data-driven policy discourse that is currently based on
district-level estimates. Using data from the fourth
National Family Health Survey 2016, two geographic
information systems methodologies have been
developed and applied to provide estimates of four child
malnutrition indicators (stunting, underweight, wasting,
and anemia) for the 543 parliamentary constituencies in
India. The results indicate that several constituencies
experience a multiple burden of child malnutrition that
must be addressed concurrently and as a priority.
(Appendix Figures A1–A5 and Tables A1–A4 accompanying this article are available on the EPW website.)
Alok Kumar and R Venkataramanan would like to state that interpretations made in this article do not refl ect the views of their respective affi liated institutions.
This research was supported by the Harvard Center for Population and Development Studies, and the Tata Trusts.
Akshay Swaminathan ([email protected]) is at the Department of Statistics, Harvard University, Cambridge. Rockli Kim ([email protected]) is at the Department of Social and Behavioral Sciences, Harvard TH Chan School of Public Health, Boston. Yun Xu ([email protected]) and S V Subramanian ([email protected]) are at the Harvard Center for Population and Development Studies, Cambridge. Jeffrey C Blossom ([email protected]) is at the Center for Geographic Analysis, Harvard University, Cambridge. William Joe ([email protected]) is at the Population Research Centre, Institute of Economic Growth, Delhi. R Venkataramanan ([email protected]) is with the Tata Trusts, Mumbai. Alok Kumar ([email protected]) is with the NITI Aayog, Government of India, New Delhi.
In India, monitoring and surveillance of health and well-being indicators have largely focused on states, and increasingly on districts. For instance, the National Institution for
Transforming India (NITI) Aayog, the premier think tank of the Government of India (GoI), continues to release fi nancial, labour, education, health, infrastructure, and poverty statistics only at the state and district levels. Since many of the most prominent sources of population data now report district-level outcomes, districts have become the unit of interest and inter-vention in policy discourse. For instance, the fourth National Family Health Survey 2016 (NFHS-4), conducted across India, released district-level data on a variety of health, nutrition and population indicators. The NITI Aayog Aspirational Districts Programme, which aims to prioritise 115 districts across India for intervention—identifi ed due to their lagging development indicators—is one example of an increased focus on districts in development policy (NITI Aayog 2018). An increased policy focus on districts creates a virtuous cycle, which in turn neces-sitates even more data collection at the district level, resulting in discourse that is evidence-based.
Another decentralised geographical unit of substantial political infl uence in India is the parliamentary constituencies (PCs): the 543 geographical regions represented by the members of Parliament (MPs) of the Lok Sabha. The MPs of the Lok Sabha are elected by fi rst-past-the-post universal adult suffrage and serve fi ve-year terms in the lower house of the Parliament (Parliament of India 2017). Unlike districts that do not have any direct governmental accountability, a focus on PCs can bring a greater degree of accountability to policy vision and implementation since the MPs are directly responsible for the well-being of their constituents. Whereas health and de-velopment indicators and other population data are widely available at the district level, there is a notable scarcity of PC-level data. This lack of PC-level data steers policy discourse away from PCs, which in turn discourages data collection at the PC level.
PCs are relevant not only due to their direct representation of people, but also because of the resources allocated to them by the national government. In 1993, the GoI established the Members of Parliament Local Area Development Scheme (MPLADS), wherein each year every MP may receive up to `5 crore to carry out development projects in their respective PCs (MoSPI 2017a). To date, ̀ 31,833.35 crore has been disbursed to Lok Sabha MPs by the GoI as part of the MPLADS programme (MoSPI 2017b).
The appendix published on the website was erroneous and has been replaced by the correct one. The corresponding citations in the main text to the tables and fi gures in the appendix have been corrected.
This is the corrected version of the article.

SPECIAL ARTICLE
Economic & Political Weekly EPW JANUARY 12, 2019 vol lIV no 2 45
Determining the most appropriate interventions to fund requires understanding the local context. For example, an MP seeking to reduce the prevalence of stunting in their PC, fi rst and foremost, requires current, accurate stunting prevalence estimates for their PC. They also require PC-specifi c economic, infrastructural, and demographic data in order to carry out a successful intervention to prevent stunting.
Several efforts have been recently established to aid MPs in understanding their constituents’ needs. In early 2016, for instance, a select group of MPs, along with the Swaniti Initiative and Tata Trusts, launched an initiative, “Supporting Parliamen-tarians in Analysis and Research in the Constituency” (SPARC), which assigns 20 young professionals to 20 MPs across India to aid in implementing PC-specifi c development projects (Swaniti Initiative 2017). The SPARC programme arose when a group of MPs “came together to brainstorm ways through which Parlia-mentarians can become more effective leaders” (Swaniti Initi-ative 2017). Similarly, the Parliamentary Research Service (PRS), established in 2011, is a think tank and resource base that pro-vides PC-specifi c data and research to support MPs, but with a focus on legislative matters (PRS Legislative Research 2018). The PRS publishes legislation analyses, statistical reports, research notes, and has also established the PRS Legislative Assistants to Members of Parliament (LAMP) fellowship, which, similar to SPARC, pairs young professionals with MPs to aid in research and policymaking. The combination of federal funding programmes for PC deve lopment and supporting resources for MPs makes the PC an important focus for population data analysis.
In order to address the data gap for health and development indicators at the PC-level, we developed and applied two novel methodologies to generate estimates of child malnutrition at the PC level. Specifi cally, using the NFHS-4 data on indicators of child malnutrition, we do three things. First, we present a state-of-the-art geographic information system (GIS)-based metho-dology to use district-level estimates and create a “crosswalk” to generate PC-level estimates. Second, we present a method of generating PC-level estimates by directly aggregating indi-vidual data in instances where one can link individual data to their PCs. Third, we apply these methodologies to rank PCs on indicators of child malnutrition (that is, stunting, under-weight, wasting, and anaemia) and assess the patterns of PC variability across these indicators. We exemplify our methods using indicators of child malnutrition in order to provide time-ly evidence to inform current discussion on POSHAN Abhiyaan, a three-year programme launched in March 2018 that aims to “reduce the level of stunting, undernutrition, anaemia and low birth weight babies” (PIB 2018).
Data
We use three main sources of data for our analysis. The fi rst is the district-level fact sheet and individual data on child malnutrition indicators from the NFHS-4. The NFHS-4 is a national survey conducted by the Ministry of Health and Family Welfare, and has collected information from 6,01,509 households on socio-demographic characteristics, water and sanitation, child health, women’s and men’s health, and other
health-related variables (IIPS 2016). This survey also comes under the larger framework of the global demographic and health surveys (DHS) that are conducted across a wide range of low- and middle-income countries about every fi ve years (DHS 2018a). Although the individual data is available for NFHS-4, using the district-level aggregate data is relevant because one of our methodologies to generate PC-level estimates only re-quires data at the district level. In our case, individual data is not necessary, thus making this approach widely applicable to many data sets where district-level estimates are available, but indi-vidual data are not.
The second data source is the geographic data provided by the DHS, where sampling clusters—from which households are sampled—are geo-referenced by latitude and longitude coordi-nates and available via special request (Burgert et al 2013). These survey cluster coordinates are mostly collected in the fi eld us-ing global positioning system (GPS) receivers, which are accurate to +/- 15 metres. The GPS positions are then displaced randomly to maintain respondent confi dentiality. The displacement distance is a maximum of 2 kilometres (km) for urban clusters and 5 km for rural clusters. The displacement is restricted so that the displaced cluster locations stay within the districts. For clusters without GPS readings, coordinates are extracted from a paper map or a gazetteer of settlement names, or from pre-existing census data provided by the country’s census agency/ministry. We used the geographic data collected in 2015–16, which has a total of 28,526 clusters in India (DHS 2018b).
The third data source was the boundary shapefi les for PCs and districts. The “India–Map of Parliamentary Constitu-encies, 2014” GIS shapefi le was downloaded and used as the PC boundaries for this project (Github 2014a). This data set has boundaries mapped for 543 PCs in polygon format. The “India–District Map” GIS shapefi le was downloaded from GitHub, and contains 641 mapped district boundaries in polygon format, and will be referred hereafter as “Districts” (GitHub 2014b). Note that this shapefi le refl ects the district boundaries from the 2011 Census of India, and was published on 6 April 2016.
We considered four indicators of child malnutrition (Subramanian et al 2016; Corsi et al 2016; Balarajan et al 2011). These four indicators were: (i) the percentage of stunting for children under fi ve years (defi ned as height for age below -2 standard deviation (SD) of the age- and sex-specifi c median according to the World Health Organization [WHO] Child Growth Standards [Onis 2006]); (ii) the percentage of underweight children under fi ve years (weight for age < -2 SD); (iii) the per-centage of wasting for children under fi ve years (weight for height < -2 SD); and (iv) the percentage of children aged 6–59 months who are anaemic (haemoglobin concentration <11.0 g/dl) (Table 1, p 46).
Using the data sources described above, we generate PC-level estimates of child malnutrition through two distinct methodo-logies. The fi rst method involves using the boundary shapefi les to build a crosswalk between districts and PCs. Using this crosswalk, district-level data can be transformed and aggre-gated to generate PC-level estimates. We apply this crosswalk methodology to the district-level NFHS-4 malnutrition data to

SPECIAL ARTICLE
JANUARY 12, 2019 vol lIV no 2 EPW Economic & Political Weekly46
generate estimates for the PCs. The second method involves directly aggregating the individual malnutrition data to the PC level. Aggregation to the PC level is possible since the randomly displaced GPS locations of the sampling clusters are provided in the data source, so that the PC of each individual data point can be determined.
Developing a Crosswalk from Districts to PCs
Methods for geographic interpolation using GIS have been pre-viously described (Loganet al 2014; Hibbert et al 2009; Forsyth et al 2006), but their applications to public health have not been thoroughly explored. We apply these methods to interpo-late PC-level child malnutrition data given district boundaries. Briefl y, we superimposed the shapefi les for district and PC boundaries, revealing segments of districts contained within each PC (see Figure A1). A given district could have segments that fall in several different PCs. For each of these district seg-ments, the proportion of the total district area and population was calculated using raster maps, allowing us to calculate area and population estimates for PCs. For example, if a PC is made up of 40% district A and 60% district B, the total area and population of the PC can be calculated by computing the weighted average of the area and population of the two districts. A data set was generated in which each row corre-sponded to a segment of a district, and columns included the district ID, the PC ID in which the segment fell, the proportion of the district’s population in that segment, and the propor-tion of the district’s area in that segment.
Using ArcGIS Pro version 2.0 (Esri, Redlands, California), the geographic area in square kilometres of each district was calculated using the Kalianpur 1975/India Zone IIa coordinate system (EPSG:24379), and saved into a fi eld called Tot_Area. The Intersect command was used with the PCs and districts as the input shapefi les. This command creates a new shapefi le,
(named PC_District_Intersect) splitting the polygons where they are not identical, creating new geometric shapes. The new geometries are given the attributes of both, the overlap-ping PC and district. Next, the area in square kilometres of the new polygons was calculated using the Kalianpur 1975/India Zone IIa coordinate system into a fi eld named AREA_GEO. A new fi eld Pct_Area was calculated with the formula: “AREA_GEO/Tot_Area.” The values in this Pct_Area fi eld rep-resent the percentage of district area contained in each new shape. Next, all polygons with a Pct_Area value less than .0001 (less than a hundredth of a percent of the area) were deleted. These extremely small areas are “slivers” that act as noise, and are created from slight boundary inaccuracies be-tween the district and PC shapefi les.
Then, the Zonal Statistics command was performed using the district shapefi le as the “zone” and the AsiaPop2015 population raster (www.asiapop.org) as the underlying data raster. This raster contains population estimates for all of India at a resolution of 100 metres, updated as of 2015. Results from this were saved in the Tot_pop fi eld, and represent total population in the dis-trict. Then, the Zonal Statistics command was performed on the PC_District_Intersect shapefi le, using the AsiaPop2015 popula-tion raster. These results were saved in the POP fi eld, and rep-resent the population in each portion of the PC/district intersec-tion. Then the percentage of population for each apportioned area contains was calculated with a formula: “POP/Tot_pop.” This was saved in the Pct_pop fi eld. The PC_District_Intersect attribute table was exported to excel and eventually to R.
Table 1: Summary Statistics for Child Malnutrition Indicators across PCs, States and India (%)Indicator Description Mean India Min State Max State IQR State Min PC Max PC IQR PC
Stunting Children under 5 years who are stunted (height-for-age) 35.90 19.34 47.98 27.33, 13.71 61.69 28.47, 36.47 43.50
Underweight Children under 5 years who are underweight (weight-for-age) 33.58 14.85 48.58 22.62, 10.50 60.91 26.59, 34.83 41.30
Wasting Children under 5 years who are wasted (weight-for-height) 20.77 7.48 29.95 15.51, 7.34 40.60 16.60, 23.09 25.16
Anaemia Children aged 6–59 months who are anaemic (<11.0 g/dl) 56.83 20.17 76.75 45.66, 19.47 83.00 49.93, 62.19 66.06
Stunting Underweight Wasting Anaemia
Perc
enta
ge
85807570656055504540353025201510
5
Figure 1: Box Plots Showing the Distribution of Child Malnutrition Indicators across PCs
1
0.9
0.8
0.7
0.6
0.5
0.4
0.3
0.2
0.1
0
Anaemia Stunting Underweight
Wasting 0.4 0.23 0.62
Anaemia 0.44 0.55
Stunting 0.85
Figure 2: Correlation Matrix of Child Malnutrition Indicators across PCs

SPECIAL ARTICLE
Economic & Political Weekly EPW JANUARY 12, 2019 vol lIV no 2 47
The PC_District_Intersect attribute table contained 1,530 rows, corresponding to 1,530 segments of districts. In order to calculate PC-level estimates, this attribute table was merged with the NFHS-4 district-level data, and the district malnutrition data columns were multiplied by the Tot_pop fi eld, resulting in columns representing the estimated number of individuals in each district segment with a particular malnutrition state. The data set was then aggregated by PC ID, and the resulting malnutrition data columns represented the estimated number of individuals in each PC with a particular malnutrition state.
These columns were then divided by the Tot_pop fi eld and multiplied by 100, resulting in columns representing the esti-mated percent prevalence of malnutrition in each PC.
Generating Direct Estimates by Linking Clusters to PC
Direct aggregation from individual data to PCs was possible because the NFHS-4 utilised DHS sampling cluster locations, for which GPS coordinates are available. In the DHS geographic data, the centre of the populated place of each cluster is re-corded with a GPS receiver. These locations are listed in degrees
Figure 3: Geographic Distribution of Stunting (a), Underweight (b), Wasting (c), and Anaemia (d) across PCs
0 km 250 km 500 km
d
N
Prevalence 19.47–47.42% 47.43–54.49% 54.50–61.25% 61.26–67.44% 67.45–83% Not available
0 km 250 km 500 km
b
N
Prevalence 10.5–24.85% 24.86–30.63% 30.64–36.54% 36.55–42.51% 42.52–60.91% Not available
0 km 250 km 500 km
N
Prevalence 13.71–27.15% 27.16–32.5% 32.51–38.73% 38.74–44.77% 44.78–61.69% Not available
a
0 km 250 km 500 km
N
Prevalence 7.34–15.65% 15.66–18.48% 18.49–21.5% 21.51–26.13% 26.14–40.6% Not available
c
Colours indicate quintiles of prevalence (%) with the lowest quintile (lightest shade) and the highest (darkest shade). State boundaries are indicated by a thick black line. The maps in the article show the 2014 PC borders due to issues of data availability as the only existing shapefiles for India’s PCs are for the 2014 PC borders.

SPECIAL ARTICLE
JANUARY 12, 2019 vol lIV no 2 EPW Economic & Political Weekly48
of latitude and longitude. We generated a GIS map of cluster points using the latitude–longitude coordinates and the ArcGIS Add Data from the XY Coordinates tool. We then com-bined this map with the PC boundary map using the ArcGIS Spatial Join tool. This tool determines which PC each cluster falls into and adds this information to the cluster attribute table. Then, the number of individuals in clusters that linked to each PC constitute the “sample population” for that PC, and the prevalence was computed as number of individuals with anthro pometric failure divided by the total number of individuals in each PC.
Statistical Analysis
We adopted the following analytical approaches. First, summary statistics (mean, median, interquartile range) were calculated to describe the distribution of indicators of child malnutrition. Second, we present how the geographies of PC are correlated between the indicators. Then, maps were generated to visualise the geographic variation in the prevalence of child malnutrition and to identify “hotspots” of PCs with particularly high (that is,
darker shades in Figure 3, p 47) or low (that is, lighter shades in Figure 3) burdens. All maps show quintiles of prevalence on indicators of child malnutrition.
We also compare the district–PC crosswalk with the direct aggregation method by repeating the above analyses using the directly aggregated data (see Tables A1, A2, A3, and Figures A2, A3, A4 and A5). We also compare the PC rankings produced by both methodologies. For each malnutrition indi-cator, we rank the PCs using the district–PC crosswalk data, and then using the directly aggregated data. We then calculate the Pearson’s correlation coeffi cient between the crosswalk rank-ings and the direct aggregation rankings. Finally, we compare the two methods by calculating the difference bet ween the two prevalence estimates for each PC across all indicators. All statistical analyses were conducted using R version 3.2.
Results
While we have provided rankings of PCs using both GIS methodo-logies, we discuss the observed empirical patterns based on the results obtained from the district–PC crosswalk data. This is
Table 2: PCs in the Top Two and Bottom Two Quintiles of All Child Malnutrition Indicators Bottom Two Quintiles Top Two Quintiles Bottom Two Quintiles Top Two QuintilesPC State PC State PC State PC State
Chevella Telangana Bhagalpur Bihar
Nellore Andhra Pradesh Banka Bihar
Malkajgiri Telangana Arrah Bihar
Secunderabad Telangana Sasaram Bihar
Hyderabad Telangana Supaul Bihar
Arunachal West Arunanchal Pradesh Araria Bihar
Arunachal East Arunanchal Pradesh Amreli Gujarat
Jorhat Assam Bhavnagar Gujarat
Lakhimpur Assam Patan Gujarat
Autonomous District Assam Sabar Kantha Gujarat
Tezpur Assam Haveri Karnataka
North Goa Goa Davanagere Karnataka
Kangra Himachal Pradesh Belgaum Karnataka
Mandi Himachal Pradesh Bagalkot Karnataka
Hamirpur Himachal Pradesh Bijapur Karnataka
Srinagar Jammu and Kashmir Gulbarga Karnataka
Anantnag Jammu and Kashmir Raichur Karnataka
Udhampur Jammu and Kashmir Bidar Karnataka
Dakshina Kannada Karnataka Koppal Karnataka
Kasaragod Kerala Bellary Karnataka
Thrissur Kerala Morena Madhya Pradesh
Chalakudy Kerala Rewa Madhya Pradesh
Ernakulam Kerala Sidhi Madhya Pradesh
Kottayam Kerala Shahdol Madhya Pradesh
Alappuzha Kerala Vidisha Madhya Pradesh
Mavelikkara Kerala Bhopal Madhya Pradesh
Pathanamthitta Kerala Bhind Madhya Pradesh
Kollam Kerala Rajgarh Madhya Pradesh
Attingal Kerala Dewas Madhya Pradesh
Kannur Kerala Mandsaur Madhya Pradesh
Thiruvananthapuram Kerala Ratlam Madhya Pradesh
Vadakara Kerala Dhar Madhya Pradesh
Kozhikode Kerala Khargone Madhya Pradesh
Ponnani Kerala Khandwa Madhya Pradesh
Palakkad Kerala Betul Madhya Pradesh
Alathur Kerala Gwalior Madhya Pradesh
Sangli Maharashtra Guna Madhya Pradesh
Inner Manipur Manipur Khajuraho Madhya Pradesh
Mizoram Mizoram Satna Madhya Pradesh
Nagaland Nagaland Nandurbar Maharashtra
Cuttack Odisha Chandrapur Maharashtra
Kendrapara Odisha Yavatmal–Washim Maharashtra
Jagatsinghpur Odisha Bolangir Odisha
Puri Odisha Nabarangapur Odisha
Bhubaneshwar Odisha Koraput Odisha
Aska Odisha Jalore Rajasthan
Jajapur Odisha Udaipur Rajasthan
Bathinda Punjab Banswara Rajasthan
Khadoor Sahib Punjab Chittaurgarh Rajasthan
Faridkot Punjab Rajsamand Rajasthan
Jhunjhunun Rajasthan Jhalawar–Baran Rajasthan
Tiruvallur Tamil Nadu Shahjahanpur Uttar Pradesh
Chennai South Tamil Nadu Amethi Uttar Pradesh
Shivaganga Tamil Nadu Pratapgarh Uttar Pradesh
Theni Tamil Nadu Jalaun Uttar Pradesh
Kanyakumari Tamil Nadu Hamirpur Uttar Pradesh
Sriperumbudur Tamil Nadu Banda Uttar Pradesh
Kancheepuram Tamil Nadu Nagina Uttar Pradesh
Tripura West Tripura Kaushambi Uttar Pradesh
Tripura East Tripura Puruliya West Bengal
Krishnanagar West Bengal Rajmahal Jharkhand
Ranaghat West Bengal Singhbhum Jharkhand
Bangaon West Bengal Khunti Jharkhand
Barakpur West Bengal Lohardaga Jharkhand
Dum Dum West Bengal Hazaribagh Jharkhand
Barasat West Bengal Dumka Jharkhand
Basirhat West Bengal Godda Jharkhand
Shrirampur West Bengal Kodarma Jharkhand
Hugli West Bengal Giridih Jharkhand
Lakshadweep Lakshadweep Dhanbad Jharkhand
Ranchi Jharkhand
Jamshedpur Jharkhand
Bold values are in the top or bottom quintiles, and represent the highest priority and lowest priority PCs, respectively.

SPECIAL ARTICLE
Economic & Political Weekly EPW JANUARY 12, 2019 vol lIV no 2 49
because we believe that this methodology has the potential to be more widely utilised, since the direct aggregation method was only possible given the availability of the survey cluster GPS data, which is generally not provided in most population data sets. Furthermore, the substantive empirical patterns as well as PC rankings were highly similar between the two methods, as evidenced by the results obtained from repeating all analyses using the direct aggregation method (see Tables A1, A2 and A3, Figures A2, A3, A4 and A5).
Distribution and Correlation Indicators across PCs
Across India, over 20% of children under fi ve experienced wasting, over one-third were underweight, over one-third were stunted, and nearly 60% of children aged 6–59 months were anaemic (Table 1). India’s 57% prevalence of child anaemia is a “severe” public health problem, based on the WHO cut-off of greater than or equal to 40% prevalence (WHO 2015). Across PCs, stunting ranged from 13.7% to 61.7%, underweight ranged from 10.5% to 60.9%, wasting ranged from 7.3% and 40.6%, and anaemia ranged from 19.5% to 83.0%. Stunting, underweight, and wasting were approximately symmetrically distributed across PCs, while anaemia was left-skewed (Figure 1, p 46).
Across PCs, stunting was strongly correlated with under-weight (r = 0.85). PCs with higher levels of underweight were more likely to be also PCs with higher levels of wasting (r = 0.61). Anaemia showed moderate correlations with other malnutrition indicators (0.35 < r < 0.55) (Figure 2, p 46). In general, PCs with high prevalence of one form of child
malnutrition are also likely to suffer from high prevalence of other forms of malnutrition.
Mapping Indicators of Child Malnutrition across PCs
Stunting: PCs in central and north-eastern India show the highest burden of stunting, particularly in Uttar Pradesh, Jharkhand, Bihar, and Madhya Pradesh (Figure 3a, p 47). Shrawasti (Uttar Pradesh, 61.7%), Kaisarganj (Uttar Pradesh, 61.4%), and Bahraich (Uttar Pradesh, 60.6%) are the PCs with the highest burden of stunting. PCs in northern and southern India, in Punjab, Himachal Pradesh, Telangana, Tamil Nadu, and Kerala, show the lowest burden of stunting. Pathanamthitta (15.9%), Kottayam (15.8%), and Idukki (13.7%) in Kerala are the PCs with the lowest burden of stunting. Karnataka, Maharashtra, and Odisha, the states with the highest interquartile range (IQR) for stunting, contain several PCs in the top two and bottom two quintiles of stunting prevalence. Of these states, Karnataka and Maharash-tra have a similar distribution where northern PCs show higher prevalence of stunting than southern PCs.
Underweight: The distribution of underweight shows trends similar to that of stunting (Figure 3b, p 47). PCs in central and northeastern India show the highest burden of underweight, particularly in Uttar Pradesh, Jharkhand, Bihar, Chhattisgarh and Madhya Pradesh. The PCs with the highest prevalence of under-weight are Singhbhum in Jharkhand (60.9%), Puruliya in West Bengal (58.2%), and Shahjahanpur in Uttar Pradesh (54.3%).
Perc
ent
80
60
40
20
0
a b
Perc
ent
80
60
40
20
0
Man
ipu
rKe
rala
Jam
mu
and
Kas
hm
irM
izor
amN
agal
and
Sikk
imA
run
ach
al P
rad
esh
Him
ach
al P
rad
esh
An
dam
an a
nd
Nic
obar
Isla
nd
sPu
nja
bPu
du
cher
ryLa
ksh
adw
eep
Go
aTa
mil
Nad
uTr
ipu
raC
han
dig
arh
Utt
arak
han
dN
CT
of D
elh
iD
aman
an
d D
iuA
ssam
Kar
nat
aka
Meg
hal
aya
Har
yan
aW
est B
eng
alA
nd
hra
Pra
des
hM
ahar
ash
tra
Raj
asth
anO
dis
ha
Ch
hat
tisg
arh
Utt
ar P
rad
esh
Gu
jara
tD
adar
a an
d N
agar
Hav
elli
Mad
hya
Pra
des
hB
ihar
Jhar
khan
d
Kera
laG
oa
Jam
mu
and
Kas
hm
irA
nd
aman
an
d N
icob
ar Is
lan
ds
Trip
ura
Pun
jab
Pud
uch
erry
Laks
had
wee
pH
imac
hal
Pra
des
hTa
mil
Nad
uD
aman
an
d D
iuN
agal
and
An
dh
ra P
rad
esh
Ch
and
igar
hM
anip
ur
Aru
nac
hal
Pra
des
hK
arn
atak
aSi
kkim
Miz
oram
Utt
arak
han
dH
arya
na
Wes
t Ben
gal
NC
T of
Del
hi
Mah
aras
htr
aO
dis
ha
Ass
amC
hh
atti
sgar
hM
egh
alay
aR
ajas
than
Gu
jara
tM
adh
ya P
rad
esh
Dad
ara
and
Nag
ar H
avel
liJh
arkh
and
Utt
ar P
rad
esh
Bih
ar
c d
Perc
ent
80
60
40
20
0Pe
rcen
t
80
60
40
20
0
Nag
alan
dM
anip
ur
Miz
oram
Od
ish
aKe
rala
Ass
amJa
mm
u an
d K
ash
mir
Pud
uch
erry
Ch
and
igar
hA
run
ach
al P
rad
esh
Go
aA
nd
aman
an
d N
icob
ar Is
lan
ds
Trip
ura
Tam
il N
adu
Laks
had
wee
pM
ahar
ash
tra
Wes
t Ben
gal
Meg
hal
aya
Raj
asth
anH
imac
hal
Pra
des
hPu
nja
bK
arn
atak
aSi
kkim
An
dh
ra P
rad
esh
Utt
arak
han
dU
ttar
Pra
des
hB
ihar
NC
T of
Del
hi
Gu
jara
tD
adar
a an
d N
agar
Hav
elli
Mad
hya
Pra
des
hJh
arkh
and
Har
yan
aC
han
dig
arh
Dam
an &
Diu
Man
ipu
rM
izor
amN
agal
and
Ch
and
igar
hJa
mm
u an
d K
ash
mir
Him
ach
al P
rad
esh
Laks
had
wee
pPu
nja
bA
ssam
Kera
laSi
kkim
NC
T of
Del
hi
Aru
nac
hal
Pra
des
hU
ttar
Pra
des
hO
dis
ha
Pud
uch
erry
An
dh
ra P
rad
esh
Trip
ura
An
dam
an a
nd
Nic
obar
Isla
nd
sM
egh
alay
aW
est B
eng
alTa
mil
Nad
uG
oa
Bih
arH
arya
na
Utt
arak
han
dR
ajas
than
Mah
aras
htr
aC
hh
atti
sgar
hD
aman
& D
iuG
uja
rat
Mad
hya
Pra
des
hK
arn
atak
aD
adar
a an
d N
agar
Hav
elli
Jhar
khan
d
Figure 4: Boxplots Showing the Distribution across PCs for Stunting (a), Underweight (b), Wasting (c), and Anaemia (d), Showing Median, IQR, 95% Range, and Outliers in Each State

SPECIAL ARTICLE
JANUARY 12, 2019 vol lIV no 2 EPW Economic & Political Weekly50
PCs in northern, southern, and eastern India show the lowest burden of stunting, such as in Punjab, Himachal Pradesh, Uttara-khand, Telangana, Tamil Nadu, Kerala, Sikkim, Assam, Arunachal Pradesh, Nagaland, Manipur, Mizoram, and Tripura. Kottayam (12.3%), Kasaragod (11.6%), and Kannur (10.5%) in Kerala are the PCs with the lowest burden of underweight. Karnataka, Odisha, Rajasthan, Maharashtra and West Bengal, the states with the highest IQR for underweight, contain several PCs in the top two and bottom two quintiles. Of these states, Karnataka and Maharashtra have a similar distribution where northern PCs show higher prevalence of underweight than southern PCs. West Bengal and Rajasthan show the opposite pattern where southern PCs show a higher prevalence of underweight than northern PCs.
Wasting: Prevalence of wasting is highest in central and western India (Figure 3c, p 47), particularly in Madhya Pradesh, Gujarat, Maharashtra, Chhattisgarh, and Jharkhand. The PCs with the highest prevalence of wasting are Jamshedpur in Jharkhand (40.6%), Puruliya in West Bengal (34.6%), and Nandurbar in
Maharashtra (34.5%). Parts of southern, eastern and northern India show the lowest rates of wasting, such as in Himachal Pradesh, Punjab, Andhra Pradesh, Sikkim, West Bengal, Assam, Arunachal Pradesh, Naga-land, Manipur, Mizoram, and Tripura. The PCs with the lowest pre valence of wasting are Kanyakumari in Tamil Nadu (9.0%), and Inner Manipur (7.6%) and Outer Manipur (7.6%). West Bengal, Odisha, Raja s than, Karnataka, Bihar, and Tamil Nadu show high within-state, bet ween-PC variability. Of these states, Karnataka and Tamil Nadu have a similar distribution wh e r e northern PCs show higher prevalence of wasting than southern PCs. In West Ben-gal, western PCs show a higher prevalence of wast-ing than eastern PCs.
Anaemia: The highest rates of anaemia are found mostly throughout central India, particularly in Madhya Pra desh, south ern Rajas-than, Haryana, and Gujarat (Figure 3d, p 47). Madhya
Pradesh and Haryana have the highest rates of anaemia, with Haryana containing PCs only in the top two quintiles. The PCs with the highest prevalence of anaemia are Singhbum in Jharkhand (83.0%), Banswara in Rajasthan (79.3%), and Khargone in Madhya Pradesh (79.1%). States in southern, east-ern, and parts of northern India have PCs in the bottom two quintiles of anaemia, such as Tamil Nadu, Kerala, Maharashtra, Punjab, Chhattisgarh, Sikkim, West Bengal, Assam, Arunachal Pradesh, Nagaland, Manipur, Mizoram, and Tripura. The PCs with the lowest prevalence of anaemia are Nagaland (20.2%), Attingal (19.5%), and Kollam (19.5%) in Kerala. In Odisha, western PCs show higher rates of anaemia than eastern PCs. In Karnataka, northern PCs show higher rates of anaemia than southern PCs. In Rajasthan, southern PCs show higher rates of anaemia than northern PCs. And, in Gujarat, western PCs show higher rates of anaemia than eastern PCs.
A total of 72 PCs were in the top two quintiles of prevalence for all indicators of child malnutrition (Table 2, p 48). Of these, 12 PCs were in Jharkhand, 19 in Madhya Pradesh, 10 in Karnataka, six in Rajasthan and eight in Uttar Pradesh. Of these 72, 13 PCs were also in the top quintile of all variables (in bold in Table 2). Twenty-nine PCs were in the bottom quintile for all four outcome variables (in bold in Table 2). Of these, 12 were in Kerala, four were in West Bengal, and six in Odisha.
State-specific Variations and Deviant PCs
Kerala and Goa had the lowest median prevalence of stunting, and Bihar and Uttar Pradesh had the highest (Figure 4a, p 49). Karnataka had the highest IQR of stunting among PCs. Jammu and Kashmir, and Kerala had the lowest median prevalence of underweight, and Jharkhand and Bihar had the highest (Figure 4b, p 49). Odisha had the highest IQR of underweight among PCs. Manipur and Nagaland had the lowest median prevalence of wasting (Figure 4c, p 49). Daman and Diu, Dadra and Nagar Haveli, and Jharkhand had the highest median prevalence of wasting. West Bengal had the highest IQR of wasting among PCs. Nagaland and Manipur had the lowest median prevalence of anaemia, and Chandigarh and Daman and Diu had the highest (Figure 4d, p 49). Odisha had the highest IQR of anaemia among PCs. Overall, Nagaland, Manipur, Mizoram, and Kerala showed low median prevalence of the variables of interest. Jharkhand showed high median prevalence of all variables.
We identify positive deviant PCs, that is, PCs with low preva-lence nested within states with high prevalence (Table 3). The positive deviant PCs provide an opportunity to identify best practices within states that have a high prevalence of child malnutrition. Jamnagar in Gujarat is the only positive deviant for stunting. The positive deviants for underweight are located entirely in Maharashtra and Rajasthan, those for wasting are located almost entirely in Odisha and Rajasthan, and those for anaemia are located entirely in Uttar Pradesh and Gujarat. Jaipur, Jhunjhunun, and Sikar in Rajasthan are positive deviants for both wasting and underweight. Positive deviant PCs were not found in states other than Gujarat, Maharashtra, Rajasthan, Odisha, and Uttar Pradesh. Future studies should
Table 3: Positive Deviant PCsChild Malnutrition PC StateIndicator
Stunting Jamnagar Gujarat
Underweight Baramati Maharashtra
Shirur Maharashtra
Mumbai–South Maharashtra
Sangli Maharashtra
Pune Maharashtra
Jaipur Rajasthan
Jhunjhunun Rajasthan
Sikar Rajasthan
Wasting Vadodara Gujarat
Puri Odisha
Berhampur Odisha
Cuttack Odisha
Aska Odisha
Bhubaneshwar Odisha
Kendrapara Odisha
Jagatsinghpur Odisha
Jajapur Odisha
Dausa Rajasthan
Jaipur Rajasthan
Jhunjhunun Rajasthan
Sikar Rajasthan
Anaemia Agra Uttar Pradesh
Barabanki Uttar Pradesh
Hardoi Uttar Pradesh
Fatehpur Uttar Pradesh
Firozabad Uttar Pradesh
Farrukhabad Uttar Pradesh
Etah Uttar Pradesh
Kheri Uttar Pradesh
Bardoli Gujarat
Surat Gujarat
Navsari Gujarat
Positive deviant PCs are PCs with a low prevalence of child malnutrition in a state with high prevalence, where high and low prevalence are defined by the 75th and 25th percentile, respectively.

SPECIAL ARTICLE
Economic & Political Weekly EPW JANUARY 12, 2019 vol lIV no 2 51
focus on these PCs to fi nd positive practices or characteristics that can be applied to other PCs to improve child malnutrition outcomes. We found no negative deviant PCs, that is, PCs with high prevalence nested within states with low prevalence.
Comparison with Direct Aggregation Method
In order to directly compare the results of the district–PC crosswalk method and the direct aggregation method, we fi rst compare PC rankings. For each malnutrition indicator, the 543 PCs were ranked based on the crosswalk data and then by the directly aggregated data. The correlations between these two rankings were positive and strong for all indicators, as is refl ected by r = 0.92 for stunting, r = 0.92 for underweight, r = 0.84 for wasting, and r = 0.89 for anaemia. We also com-pared the two prevalence estimates generated by the two methodologies for each PC across all indicators. The absolute value of the difference in prevalence estimates between the two methods had a mean of 2.9% and a SD of 2.7% for stunting, a mean of 3.1% and a SD of 3.1% for underweight, a mean of 2.6% and a SD 2.8% for wasting, and a mean of 3.8% and a SD of 4.0% for anaemia.
The overall trends described above are recapitulated in the malnutrition data generated by direct aggregation to the PC level. Summary statistics (Table A1) are similar to those obtained with the crosswalk data, although the directly aggregated data shows a wider IQR across PCs. The list of PCs in the top and bottom quintiles showed overlap with that generated by the crosswalk method (Table A2). Twenty-eight out of 57 PCs that were in the bottom two quintiles of all indi-cators and 44 out of 62 PCs that were in the top two quintiles of all indicators also appeared on the list generated by the crosswalk method. The direct aggregation method led to identifi cation of notably more positive deviant PCs than the crosswalk method (Table A3). All-India box plots and correla-tions are very similar to those produced using the crosswalk method (Figures A2 and A3). Maps produced using the directly aggregated data show similar national and intra-state trends across PCs (Figure A4).
Discussion
Our study has three salient fi ndings. First, prevalence of child stunting, underweight, wasting, and anaemia was highly vari-able across PCs. State-specifi c analysis showed that the relative importance of the PC level may be different across states. Second, there were moderate/high correlations between malnutrition indicators at the PC level, indicating that several PCs experience a multiple burden of child malnutrition that must be addressed concurrently. Third, we found several PCs in Madhya Pradesh and Jharkhand that had high prevalence of all indicators of interest, and may represent the highest priority for health interventions. We also found PCs that show low prevalence for all indicators, and represent positive deviant PCs that should be investigated to elucidate best practices for child nutrition.
Why might one expect substantial variation at the PC level in indicators of child malnutrition? One, such variation may simply refl ect how risk factors for malnutrition are distributed
across PCs. For example, household poverty has been shown to be a signifi cant risk factor for stunting, wasting, and under-weight in India (Corsi et al 2016; Kim et al 2017), so certain PCs
that have a large proportion of poor households may also show high prevalence of child malnutrition. A prior multilevel analysis of household poverty and health spending indeed reported signifi cant variation at the local level (Kim et al 2016; Mohanty et al 2018). Thus, PC-level variation in malnutrition may be a result of the underlying distribution of malnutrition risk factors. This may also explain intra-state variation in states like Karnataka, Odisha and Maharashtra, which have PCs in the top two and bottom two quintiles across many indicators. Indeed, further research is required to determine the exact mechanism for intrastate malnutrition variation across PCs.
There are also factors relating to the MPs that may notably impact child malnutrition at the PC level, specifi cally with regards to the MPLADS. This programme has grown signifi -cantly since its inception, with the annual allotted budget per MP increasing 100-fold from `0.05 crore in 1993 to `5 crore in 2011 and onwards (MoSPI 2016). Since 2015, there have been several approved MPLADS relating to health, such as the equip-ment of local hospitals, purchase of ambulances and hearse vans, and the installation of outdoor gyms (MoSPI 2015a, 2015b, 2015c). Thus, the MPLADS has the potential to signifi cantly infl uence PC-level health outcomes, especially since “preference is given to works relating to national priorities, such as … public health” (MoSPI 2016). Given the distinct nutritional profi le of each PC, PC-level interventions should be developed consider-ing the local context. This is precisely where programmes such as SPARC, PRS, and LAMP are needed to support MPs in understanding their constituents’ needs and in making informed decisions about policy and resource allocation.
The role of MPs in MPLADS is of particular interest in the context of political business cycles, defi ned by Blair (2017) as “increased spending by governments just before elections in the hope of staying in power.” During the term of the 15th Lok Sabha from 2009 to 2014, MPs vying for re-election in 2014 strategically spent the bulk of their allotted MPLADS funds towards the end of their term (Blair 2017). Additionally, the age of the MP signifi cantly affects MPLADS spending to pro-mote political business cycles, with younger MPs utilising funds more uniformly across time than older ones (Pal and Das 2010). Overall, there was considerable variation in MPLADS spending, with a mean and SD of 0.46 and 0.38, respectively, for the proportion of allotted funds spent from May 2004 to October 2006. It is clear that several personal attributes of MPs, such as age and intention to rerun, all signifi cantly impact MPLADS spending and, thus, development and health at the PC level.
It may also be that constituents’ demands ultimately deter-mine PC-level spending. Pal and Das (2010) found that constit-uents’ awareness and demands signifi cantly have an impact on the implementation of MPLADS funds, with more awareness leading to more consistent usage of funds, and “[leave] less scope for the MPs to utilize funds with political motives.” This suggests that MPs may be less likely to spend funds as a means

SPECIAL ARTICLE
JANUARY 12, 2019 vol lIV no 2 EPW Economic & Political Weekly52
to promote political business cycles if their constituents are in-formed and proactive about their demands.
Our methods can be easily extended to estimate population outcomes at other geopolitical levels. One reasonable exten-sion, especially relevant for child malnutrition, is calculating estimates for the 4,120 assembly constituencies (ACs), repre-sented by members of the legislative assembly (MLAs) who are elected to the legislature of the state governments (ECI 2018). We found considerable intra-state variation of child malnutri-tion, which underscores the importance of understanding the local context when developing health interventions. Since MLAs are representatives of smaller geopolitical units than MPs, understanding AC-level outcomes may better inform local interventions and increase accountability for MLAs as well as MPs. Additionally, calculating AC-level estimates may promote the success of POSHAN Abhiyaan, since the impact of national efforts is supplemented by the support of representatives at all political levels.
In summary, the large variations across PCs suggest that one needs to focus on both describing the magnitude of differences across various health and development indicators, as well as
understanding to what extent these differences are a conse-quence of PC-specifi c processes as opposed to refl ecting the characteristics endogenous to the PC. In this article, we present a methodology that should enable researchers and policy-makers to generate PC estimates from abundant data avail-able at the district level from multiple sources. We believe that, in order for the policy discourse to be effective, there needs to be a complementary data-driven discourse in the political domain. Data can be empowering to the MPs as well as their constituents. The ranking of PCs on indicators of child malnutrition, we hope, will help prioritise which PCs need targeting in order to realise the goals of the national POSHAN Abhiyaan programme.
[S V Subramanian conceptualised and designed the study. Akshay Swaminathan contributed to the conceptualisation and led the data analysis, co-wrote the fi rst draft, and led the revision. Rockli Kim contri-buted to the conceptualisation, analysis and interpretation of the results, and writing. Jeffrey C Blossom, William Joe, Yun Xu and S V Subramanian contributed to the data analysis, interpretation of the results and writing. Alok Kumar and R Venkataramanan contributed to critical revisions. S V Subramanian provided overall supervision to the study. All authors approved the fi nal submission of the study.]
References
Balarajan, Y, U Ramakrishnan, E Özaltin, A H Shankar and SV Subramanian (2011): “Anaemia in Low-income and Middle-income Countries,” Lancet, Vol 378, No 9809, pp 2123–35.
Blair, H (2017): “Constituency Development Funds in India: Do They Invite a Political Business Cycle,” Economic & Political Weekly, Vol 52, No 31, pp 99–105.
Burgert, C R, J Colston, T Roy and B Zachary (2013): “Geographic Displacement Procedure and Geo-referenced Data Release Policy for the Demo-graphic and Health Surveys,” DHS Spatial Analysis Reports No 7, ICF International and United States Agency for International Devel-opment, Calverton, Maryland, United States.
Corsi, D J, I Mejía-Guevara and S V Subramanian (2016): “Improving Household-level Nutrition-specifi c and Nutrition-sensitive Conditions Key to Reducing Child Undernutrition in India,” Social Science & Medicine, Vol 157, pp 189–92.
Corsi, D J, I Mejía-Guevar and S V Subramanian (2016): “Risk Factors for Chronic Undernutri-tion Among Children in India: Estimating Rela-tive Importance, Population Attributable Risk and Fractions,” Social Science & Medicine, Vol 157, pp 165–85.
DHS (2018a): “DHS Overview,” DHS Program: Demo-graphic and Health Surveys, https://dhspro-gram.com/what-we-do/survey-Types/dHs.cfm.
— (2018b): “India Demographic and Health Surveys Geographic Dataset,” DHS Program: Demo-graphic and Health Surveys, 13 February, htt-ps://dhsprogram.com/Data/.
ECI (2018): “State/UT Wise Seats in the Assembly and Their Reservation Status,” Election Com-mission of India, Government of India, New Delhi, http://eci.nic.in/eci_main1/seat_in_leg-islativeassembilies.aspx.
Forsyth, A, K Schmitz, M Oakes, J Zimmerman and J Koepp (2006): “Standards for Environmental Measurement Using GIS: Toward a Protocol for Protocols,” Journal of Physical Activity and Health, Vol 3, No s1, pp S241–57.
Github (2014a): “India–Map of Parliamentary Con-stituencies, 2014,” https://github.com/datameet/ maps/tree/master/parliamentary-constituencies.
— (2014b): “India–District Map,” https://github.com/datameet/maps/tree/master/Districts.
Hibbert, J, A Liese, A Lawson, D Porter, R Puett, D Standiford et al (2009): “Evaluating Geo-graphic Imputation Approaches for Zip Code Level Data: An Application to a Study of Pediatric Diabetes,” International Journal of Health Geo-graphics, Vol 8, No 54, pp 1–11.
IIPS (2016): “National Family Health Survey-4: 2015–2016: India Fact Sheet,” International Institute for Population Sciences, Mumbai.
Kim, R, I Mejía-Guevara, D J Corsi, V M Aguayo and S V Subramanian (2017): “Relative Importance of 13 Correlates of Child Stunting in South Asia: Insights from Nationally Representative Data from Afghanistan, Bangladesh, India, Nepal, and Pakistan,” Social Science & Medicine, Vol 187, pp 144–54.
Kim, R, S Mohanty and S Subramanian (2016): “Multilevel Geographies of Poverty in India,” World Development, Vol 87, pp 349–59.
Logan, J, Z Xu and B Stults (2014): “Interpolating US Decennial Census Tract Data from as Early as 1970 to 2010: A Longtitudinal Tract Database,” Professional Geographer, Vol 66, No 3, pp 412–20.
MoSPI (2015a): “MPLADS: Purchas of Equipments for Government Hospitals/Dispensaries,” Ministry of Statistics and Programme Implementation, Government of India, New Delhi, http://www.mplads.gov.in/MPLADS/UploadedFiles/Circu-lar07-01-2015-E_494.pdf.
— (2015b). “MPLADS: Installation of Garden Gym Machines under the MPLADS,” Ministry of Statistics and Programme Implementation, Government of India, New Delhi, http://www.mplads.gov.in/MPLADS/UploadedFiles/circu-lar25-05-2015_338.pdf.
— (2015c): “MPLADS: Purchase of Ambulances/Hearse Vans,” Ministry of Statistics and Pro-gramme Implementation, Government of India, New Delhi, http://www.mplads.gov.in/MPLA -DS/UploadedFiles/circular05-06- 2015_499.pdf.
— (2016): “Annual Report 2015–16: MPLADS,” Ministry of Statistics and Programme Imple-mentation, Government of India, New Delhi, https://www.mplads.gov.in/mplads/upload-edfi les/AnnualReport2015-16E_38.pdf.
— (2017a): “Members of Parliament Local Area Development Scheme,” Ministry of Statistics
and Programme Implementation, Government of India, New Delhi, http://www.mplads.gov.in/mplads/Default.aspx.
— (2017b): “Summary of Funds Released by MPLADS,” Ministry of Statistics and Programme Implementation, Government of India, New Delhi, http://www.mplads.gov.in/MPLADS/U -pl oadedFiles/html/summ/s2016-2017_htm.htm.
Mohanty, S, R Kim, P K Khan and S Subramanian (2018): “Geographic Variation in Household and Catastrophic Health Spending in India: Assessing the Relative Importance of Villages, Districts, and States, 2011–2012,” Milbank Quarterly, Vol 96, No 1, pp 167–206.
NITI Aayog (2018): “Transformation of Aspirational Districts,” Governemnt of India, New Delhi, http://niti.gov.in/writereaddata/fi les/docum-e nt_publication/FirstDeltaRanking-of-Aspira-tional-Districts.pdf.
Onis, M (2006): “WHO Child Growth Standards Based on Length/Height, Weight and Age,” Acta Paediatrica, Vol 96, pp 76–85.
Pal, R and A Das (2010): “A Scrutiny of the MP-LADS in India: Who Is It For?” Economic & Political Weekly, Vol 45, No 2, pp 63–67.
Parliament of India (2017): Lok Sabha, https://par-liamentofi ndia.nic.in/.
PIB (2018): “POSHAN Abhiyaan to Address Malnu-trition through Convergence, Use of Technolo-gy and a Targeted Approach,” Press Informa-tion Bureau, 20 March, http://pib.nic.in/news-ite/PrintRelease.aspx?relid=177746.
PRS Legislative Research (2018): “What We Do,” http://www.prsindia.org/aboutus/what-we-do/.
Subramanian, S V, I Mejía-Guevara and A Krishna (2016): “Rethinking Policy Perspectives on Childhood Stunting: Time to Formulate a Structural and Multifactorial Strategy,” Mater-nal & Child Nutrition, Vol 12, No S1, pp 219–36.
Swaniti Initiative (2017): “SPARC: Supporting Par-liamentarians on Analysis and Research in Constituency,” http://www.sparc.swaniti.com/about-sparc/.
WHO (2015): “The Global Prevalence of Anaemia in 2011,” World Health Organization, Geneva, http://www.who.int/nutrition/publications/micronutrients/global_prevalence_anaem i a _ 2011/en/.
SPECIAL ARTICLE
Economic & Political Weekly EPW JANUARY 12, 2018 vol lIV no 2 1
Appendix (Ranking and prevalence of all indicators for all PCs can be made available upon request to the authors)
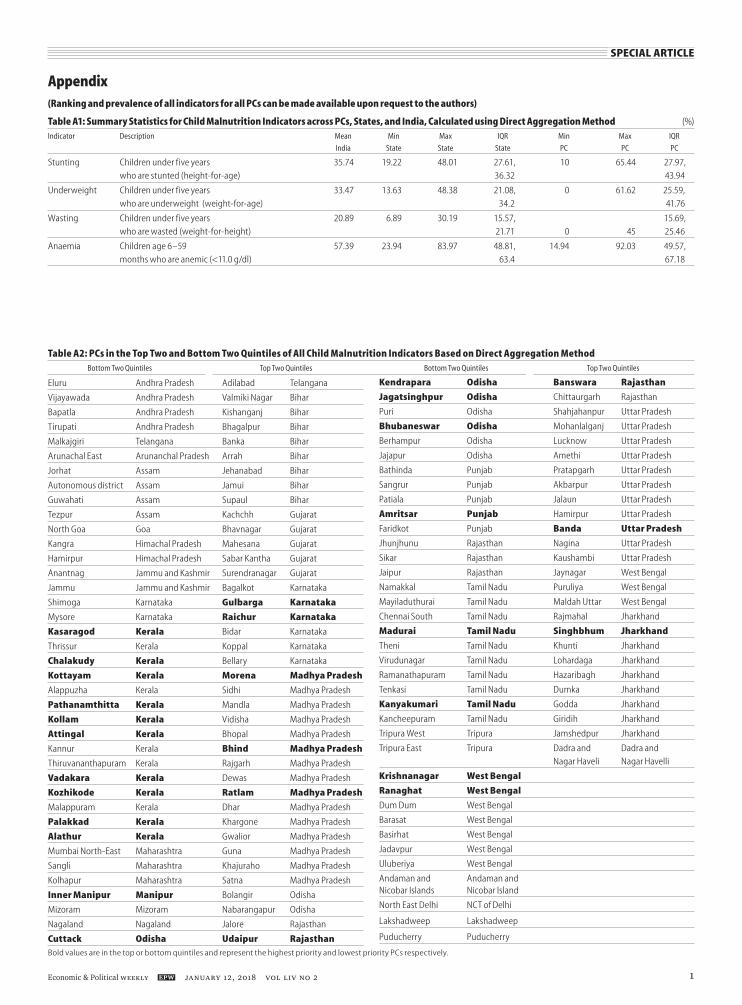
Table A1: Summary Statistics for Child Malnutrition Indicators across PCs, States, and India, Calculated using Direct Aggregation Method (%)Indicator Description Mean Min Max IQR Min Max IQR
India State State State PC PC PC
Stunting Children under five years 35.74 19.22 48.01 27.61, 10 65.44 27.97,
who are stunted (height-for-age) 36.32 43.94
Underweight Children under five years 33.47 13.63 48.38 21.08, 0 61.62 25.59,
who are underweight (weight-for-age) 34.2 41.76
Wasting Children under five years 20.89 6.89 30.19 15.57, 15.69,
who are wasted (weight-for-height) 21.71 0 45 25.46
Anaemia Children age 6–59 57.39 23.94 83.97 48.81, 14.94 92.03 49.57,
months who are anemic (<11.0 g/dl) 63.4 67.18
Table A2: PCs in the Top Two and Bottom Two Quintiles of All Child Malnutrition Indicators Based on Direct Aggregation Method Bottom Two Quintiles Top Two Quintiles Bottom Two Quintiles Top Two Quintiles
Eluru Andhra Pradesh Adilabad Telangana
Vijayawada Andhra Pradesh Valmiki Nagar Bihar
Bapatla Andhra Pradesh Kishanganj Bihar
Tirupati Andhra Pradesh Bhagalpur Bihar
Malkajgiri Telangana Banka Bihar
Arunachal East Arunanchal Pradesh Arrah Bihar
Jorhat Assam Jehanabad Bihar
Autonomous district Assam Jamui Bihar
Guwahati Assam Supaul Bihar
Tezpur Assam Kachchh Gujarat
North Goa Goa Bhavnagar Gujarat
Kangra Himachal Pradesh Mahesana Gujarat
Hamirpur Himachal Pradesh Sabar Kantha Gujarat
Anantnag Jammu and Kashmir Surendranagar Gujarat
Jammu Jammu and Kashmir Bagalkot Karnataka
Shimoga Karnataka Gulbarga Karnataka
Mysore Karnataka Raichur Karnataka
Kasaragod Kerala Bidar Karnataka
Thrissur Kerala Koppal Karnataka
Chalakudy Kerala Bellary Karnataka
Kottayam Kerala Morena Madhya Pradesh
Alappuzha Kerala Sidhi Madhya Pradesh
Pathanamthitta Kerala Mandla Madhya Pradesh
Kollam Kerala Vidisha Madhya Pradesh
Attingal Kerala Bhopal Madhya Pradesh
Kannur Kerala Bhind Madhya Pradesh
Thiruvananthapuram Kerala Rajgarh Madhya Pradesh
Vadakara Kerala Dewas Madhya Pradesh
Kozhikode Kerala Ratlam Madhya Pradesh
Malappuram Kerala Dhar Madhya Pradesh
Palakkad Kerala Khargone Madhya Pradesh
Alathur Kerala Gwalior Madhya Pradesh
Mumbai North-East Maharashtra Guna Madhya Pradesh
Sangli Maharashtra Khajuraho Madhya Pradesh
Kolhapur Maharashtra Satna Madhya Pradesh
Inner Manipur Manipur Bolangir Odisha
Mizoram Mizoram Nabarangapur Odisha
Nagaland Nagaland Jalore Rajasthan
Cuttack Odisha Udaipur Rajasthan
Kendrapara Odisha Banswara Rajasthan
Jagatsinghpur Odisha Chittaurgarh Rajasthan
Puri Odisha Shahjahanpur Uttar Pradesh
Bhubaneswar Odisha Mohanlalganj Uttar Pradesh
Berhampur Odisha Lucknow Uttar Pradesh
Jajapur Odisha Amethi Uttar Pradesh
Bathinda Punjab Pratapgarh Uttar Pradesh
Sangrur Punjab Akbarpur Uttar Pradesh
Patiala Punjab Jalaun Uttar Pradesh
Amritsar Punjab Hamirpur Uttar Pradesh
Faridkot Punjab Banda Uttar Pradesh
Jhunjhunu Rajasthan Nagina Uttar Pradesh
Sikar Rajasthan Kaushambi Uttar Pradesh
Jaipur Rajasthan Jaynagar West Bengal
Namakkal Tamil Nadu Puruliya West Bengal
Mayiladuthurai Tamil Nadu Maldah Uttar West Bengal
Chennai South Tamil Nadu Rajmahal Jharkhand
Madurai Tamil Nadu Singhbhum Jharkhand
Theni Tamil Nadu Khunti Jharkhand
Virudunagar Tamil Nadu Lohardaga Jharkhand
Ramanathapuram Tamil Nadu Hazaribagh Jharkhand
Tenkasi Tamil Nadu Dumka Jharkhand
Kanyakumari Tamil Nadu Godda Jharkhand
Kancheepuram Tamil Nadu Giridih Jharkhand
Tripura West Tripura Jamshedpur Jharkhand
Tripura East Tripura Dadra and Dadra and
Nagar Haveli Nagar Havelli
Krishnanagar West Bengal
Ranaghat West Bengal
Dum Dum West Bengal
Barasat West Bengal
Basirhat West Bengal
Jadavpur West Bengal
Uluberiya West Bengal
Andaman and Andaman and Nicobar Islands Nicobar Island
North East Delhi NCT of Delhi
Lakshadweep Lakshadweep
Puducherry Puducherry
Bold values are in the top or bottom quintiles and represent the highest priority and lowest priority PCs respectively.

SPECIAL ARTICLE
JANUARY 12, 2018 vol lIV no 2 EPW Economic & Political Weekly2
Table A3: Positive Deviant PCs, PCs with a Low Prevalence of Child Malnutrition In a State with High Prevalence, Where High and Low Are Defined by the 75th and 25th Percentiles; Based on Direct Aggregation MethodChild Malnutrition Indicator PC State
Stunting Surat Gujarat
Ahmedabad (West) Gujarat
Porbandar Gujarat
Gandhinagar Gujarat
Tura Meghalaya
Underweight Ahmedabad (West) Gujarat
Shirur Maharashtra
Mumbai North-West Maharashtra
Mumbai North-East Maharashtra
Mumbai South Maharashtra
Kalyan Maharashtra
Nagpur Maharashtra
Jhunjhunu Rajasthan
Sikar Rajasthan
Jaipur Rajasthan
Wasting Mysore Karnataka
Shirur Maharashtra
Mumbai North-East Maharashtra
Mumbai North-Central Maharashtra
Kalyan Maharashtra
Bhadrak Odisha
Kendrapara Odisha
Cuttack Odisha
Bhubaneswar Odisha
Jagatsinghpur Odisha
Jhunjhunu Rajasthan
Sikar Rajasthan
Jaipur Rajasthan
Jaipur Rural Rajasthan
Anaemia Surat Gujarat
Firozabad Uttar Pradesh
Mainpuri Uttar Pradesh
Etah Uttar Pradesh
Kheri Uttar Pradesh
Hardoi Uttar Pradesh
Unnao Uttar Pradesh
Farrukhabad Uttar Pradesh
Fatehpur Uttar Pradesh
Barabanki Uttar Pradesh
Figure A2: Boxplot Showing the Distribution of Child Malnutrition Indicators across PCs, Calculated Using Direct Aggregation Method
Stunting Underweight Wasting Anaemia
959085807570656055504540353025201510
50
Perc
ent
1
0.9
0.8
0.7
0.6
0.5
0.4
0.3
0.2
0.1
0
Anaemia Stunting Underweight
Wasting 0.33 0.17 0.59
Anaemia 0.4 0.47
Figure A3: Correlation Matrix of Child Malnutrition Indicators across PCs, Calculated Using Direct Aggregation Method
Stunting 0.81
Figure A1: Overlap between PC (Blue) and District (Yellow) Boundaries
N
PC
District
In areas where district and PC boundaries overlap exactly, PC boundaries are shown.

SPECIAL ARTICLE
Economic & Political Weekly EPW JANUARY 12, 2018 vol lIV no 2 3
Figure A4: Geographic Distribution of Stunting (a), Underweight (b), Wasting (c), and Anaemia (d) across PCs, Calculated Using Direct Aggregation Method
0 km 250 km 500 km
N
Prevalence 10%–26.24% 26.25%–32.41% 32.42%–38.68% 38.69%–45.41% 45.42%–65.44% NA
a
Prevalence 0%–23% 23.01%–30.83% 30.84%–36.96% 36.97%–43.24% 43.25%–61.62% NA
0 km 250 km 500 km
N
b
0 km 250 km 500 km
N
Prevalence 0%–14.77% 14.78%–18.67% 18.68%–22.08% 22.09%–27.06% 27.07%–45% NA
c
Prevalence 14.94%–47.1% 47.11%–55.37% 55.38%–62.5% 62.51%–68.54% 68.55%–92.03% NA
0 km 250 km 500 km
N
d
Colours indicate quintiles of prevalence (%) with lowest quintile in dark blue and highest in dark red. State boundaries indicated by thick black line.The maps in the article show the 2014 PC borders due to issues of data availability as the only existing shapefiles for India’s PCs are for the 2014 PC borders.

SPECIAL ARTICLE
JANUARY 12, 2018 vol lIV no 2 EPW Economic & Political Weekly4
Figure A5: Boxplots Showing the PC Distribution for Stunting (a), Underweight (b), Wasting (c), and Anaemia (d) Showing Median, IQR, 95% Range, and Outliers in Each State, Calculated Using Direct Aggregation Method
State State
Perc
ent
80
60
40
20
0
Perc
ent
80
60
40
20
0
Miz
oram
M
anip
urSi
kkim
Kera
laJa
mm
u an
d Ka
shm
irN
agal
and
Aru
nach
al P
rade
shH
imac
hal P
rade
shA
ndam
an a
nd N
icob
ar Is
land
sPu
njab
Pudu
cher
ryLa
ksha
dwee
pG
oaTa
mil
Nad
uTr
ipur
aU
ttar
akha
ndA
ssam
Chan
diga
rhN
CT o
f Del
hiM
egha
laya
Dam
an a
nd D
iuH
arya
naTe
lang
ana
Wes
t Ben
gal
And
hra
Prad
esh
Karn
atak
aM
ahar
asht
raCh
hatt
isga
rhRa
jast
han
Odi
sha
Dad
ra a
nd N
agar
Hav
eli
Utt
ar P
rade
shG
ujar
atM
adhy
a Pr
ades
hBi
har
Jhar
khan
d
Kera
laG
oaTr
ipur
aPu
njab
Pudu
cher
ryLa
ksha
dwee
pAn
dam
an a
nd N
icob
ar Is
land
sH
imac
hal P
rade
shTa
mil
Nad
uJa
mm
u an
d Ka
shm
irD
aman
and
Diu
Nag
alan
dM
anip
urAr
unac
hal P
rade
shTe
lang
ana
Sikk
imM
izor
amN
CT o
f Del
hiAn
dhra
Pra
desh
W
est B
enga
l Ch
andi
garh
H
arya
na
Utt
arak
hand
M
ahar
asht
raKa
rnat
aka
Ass
amO
dish
aCh
hatt
isga
rhRa
jast
han
Meg
hala
yaG
ujar
atM
adhy
a Pr
ades
hD
adra
and
Nag
ar H
avel
iJh
arkh
and
Utt
ar P
rade
shBi
har
c d
Perc
ent
80
60
40
20
0
Perc
ent
80
60
40
20
0M
izor
amM
anip
urN
agal
and
Ass
amKe
rala
Odi
sha
Chan
diga
rh
Pudu
cher
ryG
oaTr
ipur
aA
ndam
an a
nd N
icob
ar Is
land
sLa
ksha
dwee
pTa
mil
Nad
uW
est B
enga
lA
runa
chal
Pra
desh
Meg
hala
yaM
ahar
asht
raRa
jast
han
And
hra
Prad
esh
Sikk
imPu
njab
Karn
atak
a H
imac
hal P
rade
shJa
mm
u an
d Ka
shm
irU
ttar
akha
ndG
ujar
atBi
har
Utt
ar P
rade
shTe
lang
ana
NCT
of D
elhi
Mad
hya
Prad
esh
Jhar
khan
dH
arya
naD
aman
and
Diu
Chan
diga
rhD
adra
and
Nag
ar H
avel
i
Man
ipur
Miz
oram
Jam
mu
and
Kash
mir
Chan
diga
rhN
agal
and
Him
acha
l Pra
desh
Laks
hadw
eep
Kera
laA
ndam
an a
nd N
icob
ar Is
land
sPu
njab
Sikk
imA
ndhr
a Pr
ades
hA
ssam
Aru
nach
al P
rade
shM
egha
laya
Pudu
cher
ryTr
ipur
aU
ttar
Pra
desh
Wes
t Ben
gal
Odi
sha
Tela
ngan
aG
oaU
ttar
akha
ndBi
har
NCT
of D
elhi
Tam
il N
adu
Dam
an a
nd D
iuH
arya
naRa
jast
han
Chha
ttis
garh
Karn
atak
aM
ahar
asht
raG
ujar
atD
adra
and
Nag
ar H
avel
iM
adhy
a Pr
ades
hJh
arkh
and
a b