Bunker & Residual Fuel - Platts · Bunker & Residual Fuel ... Oil Service Global Gas Model LNG...
23
© Wood Mackenzie 0 Delivering commercial insight www.woodmac.com Bunker & Residual Fuel New Dynamics of Supply & Demand Platts Bunker Fuel and Residual Conference 22 nd June 2011, Houston, Texas Skip York Vice President - Downstream Consulting (Americas)
Transcript of Bunker & Residual Fuel - Platts · Bunker & Residual Fuel ... Oil Service Global Gas Model LNG...

© Wood Mackenzie 0
Delivering commercial insight
www.woodmac.com
Bunker & Residual FuelNew Dynamics of Supply & Demand
Platts Bunker Fuel and Residual Conference22nd June 2011, Houston, Texas
Skip YorkVice President - Downstream Consulting (Americas)

© Wood Mackenzie 1
Delivering commercial insight
www.woodmac.com
Calgary
Houston
BostonLondon
EdinburghMoscow
Beijing
Singapore
Sydney
Kuala Lumpur
Tokyo
New York
Dubai
Rio de Janerio
Mexico
Wood Mackenzie Offices
Perth Brisbane
AnnapolisDenver
Our global research, consulting, and account management team is a client advantage
Downstream Team Base Locations
Seoul

© Wood Mackenzie 2
Delivering commercial insight
www.woodmac.com
Our knowledge and expertise extends across the energy value chain

© Wood Mackenzie 3
Delivering commercial insight
www.woodmac.com
Our research is integrated across the energy value chain
ProductMarketsService
Refinery EvaluationModel
DownstreamOil Service
Global Gas Model
LNG Service
Gas & PowerService
Macro OilsService
UpstreamService
Global OilSupplyTool
© Wood Mackenzie 4
Delivering commercial insight
www.woodmac.com
11 Global fuel oil marketsGlobal fuel oil markets
2 Bunkers, ECAs and SECAs
3 Trade and balancing markets

© Wood Mackenzie 5
Delivering commercial insight
www.woodmac.com
Our ‘business as usual’ view of fuel demand sees growth in bunkers offsetting steady decline in Inland use
0
1,000
2,000
3,000
4,000
5,000
6,000
7,000
8,000
9,000
10,000
2005 2010 2015 2020 2025
Bp
d
Unconstrained Inland Marine
Global Fuel Oil Demand Outlook (unconstrained)
Kb
d

© Wood Mackenzie 6
Delivering commercial insight
www.woodmac.com
Expected refinery investments scheduled to come on-stream over the next 5 years will result in a growing theoretical ‘deficit’ in fuel oil
Global Fuel Oil ‘Deficit’ – Base Case Supply versus Base Case Demand
0
1,000
2,000
3,000
4,000
5,000
6,000
7,000
8,000
9,000
10,000
2005 2010 2015 2020 2025
Su
pp
ly /
De
ma
nd
, k
bd
0
200
400
600
800
1,000
1,200
1,400
1,600
1,800
Imb
ala
nc
e, k
bd
Global Demand Global Supply Theoretical Deficit (RHS)

© Wood Mackenzie 7
Delivering commercial insight
www.woodmac.com
Global rebalancing of fuel oil markets incentivised by higher fuel oil prices – but no step change in pricing mechanism is expected
Small increase in the fuel oil price relative to other products will incentivise additional production
Altering fuel oil production at one refinery also alters production of other products
Result is a complex process such that supply/demand for each individual product and every refinery are re-balanced
Fuel oil tightness is not expected to be solved via yields changes, but rather by higher prices destroying fuel oil demand
0
100
200
300
400
500
600
0 50 100 150 200 250
Cumulative FO Production, Mt
Complex &Coker
FCC &HCK
HCK
FCC
HSK
Pseudo-HSK
Refinery Fuel Oil Supply Dynamics
FCC refineries – as the most exposed in terms of refining margin – will switch to a pseudo hydroskimming mode through a relative reduction of their FCC unit throughputs
FCC refineries – as the most exposed in terms of refining margin – will switch to a pseudo hydroskimming mode through a relative reduction of their FCC unit throughputs
Fuel Oil supply increased through increases of price at the margin, rather than a step change to a different mechanism of
production
Fuel Oil supply increased through increases of price at the margin, rather than a step change to a different mechanism of
production
© Wood Mackenzie 8
Delivering commercial insight
www.woodmac.com
1 Global fuel oil markets
22 Bunkers, ECAs and SECAsBunkers, ECAs and SECAs
3 Trade and balancing markets
© Wood Mackenzie 9
Delivering commercial insight
www.woodmac.com
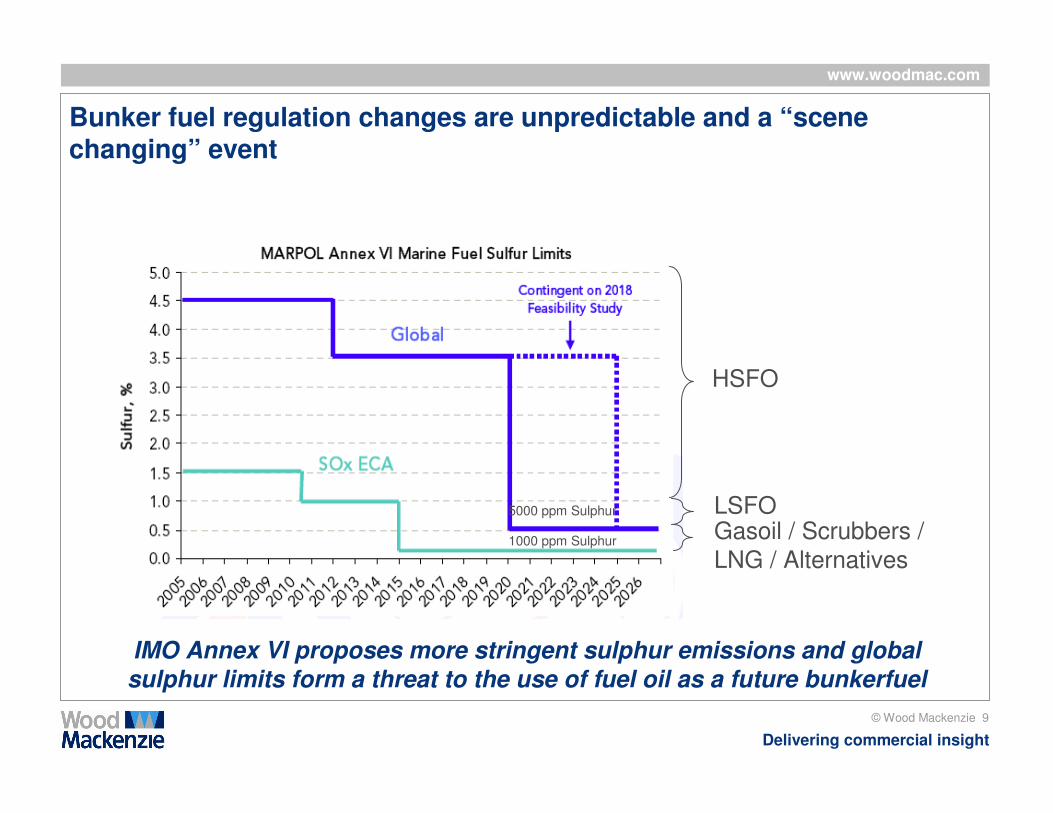
Bunker fuel regulation changes are unpredictable and a “scene changing” event
1000 ppm Sulphur
5000 ppm Sulphur
HSFO
LSFOGasoil / Scrubbers /
LNG / Alternatives
IMO Annex VI proposes more stringent sulphur emissions and global
sulphur limits form a threat to the use of fuel oil as a future bunkerfuel
Black Swan events?

© Wood Mackenzie 10
Delivering commercial insight
www.woodmac.com
2012 reduction to 3.5% sulphur in international bunkers is unlikely to cause any material issues in refining or fuel supply
Regional average bunker fuel sulphur content, and future changes
-
0.5
1.0
1.5
2.0
2.5
3.0
3.5
4.0
4.5
5.0
US West Coast US Gulf Coast US East Coast Rotterdam Fujairah Singapore
Su
lph
ur
co
nte
nt,
wt%
2012
Mandate2020
Mandate

© Wood Mackenzie 11
Delivering commercial insight
www.woodmac.com
Our analysis reflects a switch of over 500 kbd of heavy fuel oil demand to gasoil in 2015 in the European SECAs and the North American ECA
Current fuel sulphur limit for ECAs and SECA bunkers is
1.0% sulfur and further reduced to 0.1% sulphur in
January 2015
Shift to 0.1% would require switch from fuel oil to distillate
in the ECA and SECAs
EPA forecasts that by 2020, 290 kb/d (15.6 Mt) of residual
fuel oil (FO) would be consumed within the ECA if a
sulphur limit was not in force.
– We estimate the size of the market to be 250 kbd in 2015
– We assume all FO consumed in the ECA will be replaced
by distillate gasoil from 2015
Demand switch in the SECAs is similar in magnitude
ECA Zone. Source: US Environmental Protection Agency.

© Wood Mackenzie 12
Delivering commercial insight
www.woodmac.com
The 2020 IMO target – if met entirely by low sulphur fuels – would result in structural changes to the refining industry
Indicative Investment Costs of Fuel Oil Conversion to Meet 2020 IMO Specification
Our expectation is that either there will be an uptake of ship scrubbing technology by 2020, or a deferral of the specification implementation
Our expectation is that either there will be an uptake of ship scrubbing technology by 2020, or a deferral of the specification implementation
-
5.0
10.0
15.0
20.0
25.0
30.0
35.0
40.0
45.0
50.0
Asia
Pacific
Greater
Europe
North
America
Middle
East
FSU Sub-
Saharan
Africa
Latin
America
Nu
mb
er
of
pro
jec
ts
-
5.0
10.0
15.0
20.0
25.0
30.0
35.0
Cu
mu
lati
ve
co
sts
, U
S$
bil
No. of Cokers (LHS) Cumulative Cost, US$ bil (RHS)
Total cost for all
regions = US$85 bil

© Wood Mackenzie 13
Delivering commercial insight
www.woodmac.com
Ship flue gas scrubbing technology is commercially imminent providing an alternative to gasoil bunkers
Short shipping purely within the SECA probably would be met through FO use on vessels fitting seawater scrubbing
Extent and speed of retrofitting equipment to vessels are critical drivers
Price spread between gasoil and fuel oil is a powerful price signal
We expect significant up-take 2015+
Seawater Scrubbing Payback
0
10
20
30
40
50
60
10 20 30 40 50
Percent of time in SECA
Pa
yb
ac
k i
n y
ea
rs
Source Wood M ackenzie

© Wood Mackenzie 14
Delivering commercial insight
www.woodmac.com
Bunker market in NW Europe grows and shifts towards low sulphur fuel oil and gasoil use unless there up-take of seawater scrubbing
NWE bunker market consumed 60 kbd MGO in 2009, due to the nature of the vessels rather than legislation
SECA regulations drive demand for 1% S HFO, AND increases MGO demand for use in port (emission limit equivalent to 0.1%S)
Beyond 2015, we estimate 130 kbd of short sea shipping fuel demand, which could be met with HFO if vessels are fitted with scrubbing technology
NW European Bunkers
0
5,000
10,000
15,000
20,000
25,000
30,000
35,000
40,000
45,000
2009
2010
2011
2012
2013
2014
2015
2016
2017
2018
2019
2020
tho
us
an
d t
on
s
3.5%S 1.5%S 1.0%S 0.1%S
MGO demand based
on vessel engine type
SECA restrictions
on use in port
increase MGO
demand
SECA regulations
drive demand
shifts

© Wood Mackenzie 15
Delivering commercial insight
www.woodmac.com
1 Global fuel oil markets
2 Bunkers, ECAs and SECAs
33 Trade and balancing marketsTrade and balancing markets

© Wood Mackenzie 16
Delivering commercial insight
www.woodmac.com
N America heavy high sulphur fuel oil surpluses projected to grow
-600
-400
-200
0
200
400
600
800
1,000
LSFO HSFO
Bala
nces, kb/d
.
2005 2009 2010 2015 2020
Surplus
Deficit
Source Wood Mackenzie

© Wood Mackenzie 17
Delivering commercial insight
www.woodmac.com
Changes to the regional fuel oil supply/demand balance outlook are likely to result in new material trade flows by 2015 and beyond
Regional Fuel Oil Balances
Key shifts in regional balances driving new trade flowsKey shifts in regional balances driving new trade flows
-1,500
-1,000
-500
-
500
1,000
1,500
Asia Pacific Middle East North America Latin America Greater Europe FSU SSA
Re
gio
na
l im
ba
lan
ce
, k
bd
2005 2010 2015 2020
© Wood Mackenzie 18
Delivering commercial insight
www.woodmac.com
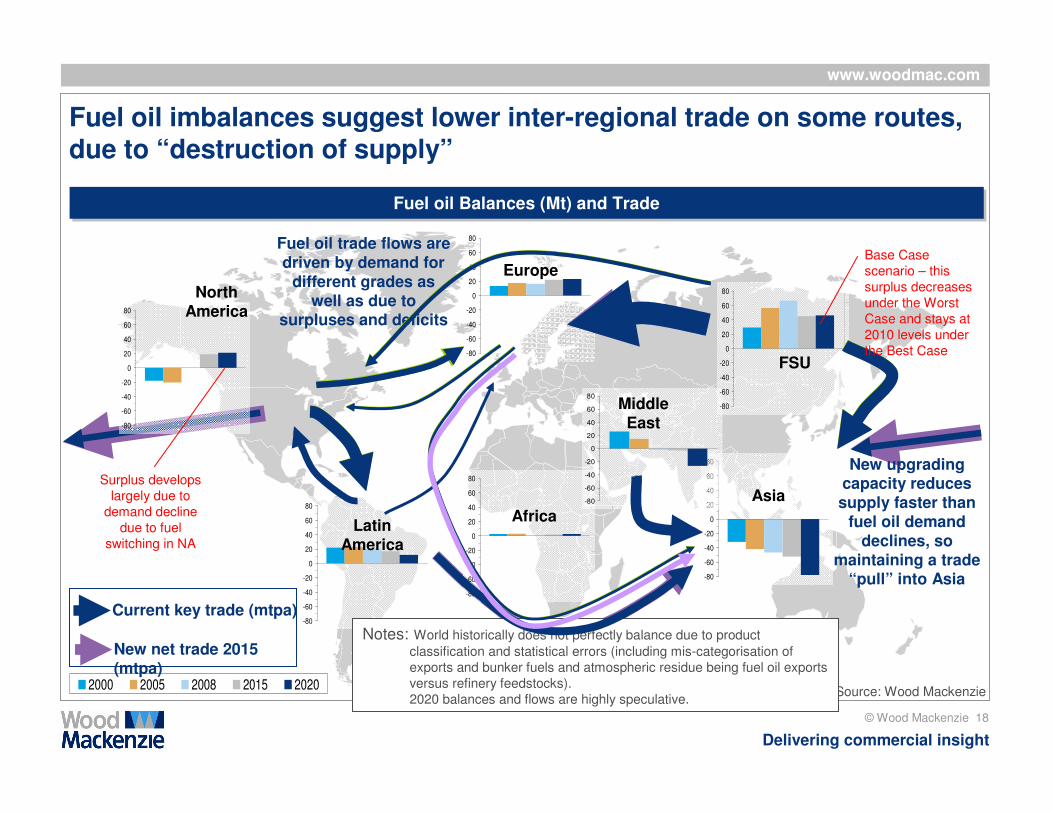
Fuel oil imbalances suggest lower inter-regional trade on some routes, due to “destruction of supply”
Current key trade (mtpa)
Fuel oil Balances (Mt) and TradeFuel oil Balances (Mt) and Trade
Source: Wood Mackenzie
-80
-60
-40
-20
0
20
40
60
80
2000 2005 2008 2015 2020
New net trade 2015 (mtpa)
Fuel oil trade flows are driven by demand for
different grades as well as due to
surpluses and deficits
-80
-60
-40
-20
0
20
40
60
80
-80
-60
-40
-20
0
20
40
60
80
-80
-60
-40
-20
0
20
40
60
80
-80
-60
-40
-20
0
20
40
60
80
-80
-60
-40
-20
0
20
40
60
80
Asia
FSU
Europe
Africa
Middle East
Latin America
New upgrading capacity reduces supply faster than
fuel oil demand declines, so
maintaining a trade “pull” into Asia
Notes: World historically does not perfectly balance due to product
classification and statistical errors (including mis-categorisation of
exports and bunker fuels and atmospheric residue being fuel oil exports
versus refinery feedstocks).
2020 balances and flows are highly speculative.
-80
-60
-40
-20
0
20
40
60
80
North America
Base Case
scenario – this
surplus decreases
under the Worst
Case and stays at
2010 levels under
the Best Case
Surplus develops
largely due to
demand decline
due to fuel
switching in NA

© Wood Mackenzie 19
Delivering commercial insight
www.woodmac.com
• Changes to the regional fuel oil supply/demand result in trade flows by 2015
• A consequence of change is almost always uncertainty which results in higher (price) volatility
• How does price volatility impact scrubbing investment decisions?
Conclusions and Implications

© Wood Mackenzie 20
Delivering commercial insight
www.woodmac.com
Harold “Skip” York Vice President – Downstream Oil (Americas)
T + 1 713 470 1667
Skip York is the global lead of Wood Mackenzie’s Downstream Transaction Support offering
and has almost 20 years of worldwide experience across the energy value chain. He has
deep expertise in petroleum market economics specializing in strategy, commercial
optimization (including asset valuation and transaction support), and market price-setting
mechanisms.
Skip has led a number of projects involving feasibility studies, valuations, and transaction due
diligence projects across the petroleum industry. In particular, he has experience in valuing
non-fungible crudes across a number of markets, such as supporting transactions involving
Canadian oil sands assets and target refineries.
Prior to joining Wood Mackenzie, Skip worked for ExxonMobil in a variety of strategic
planning assignments. He held roles as the global expert on joint venture negotiation best
practices, managing new business development downstream opportunities in Asia Pacific,
and leading research teams on studies of the economic impact of large-scale oil investments
on the economy of Russia. He also has consulted for clients at McKinsey & Company and
Charles River Associates.
Skip holds a PhD Economics from the University of Virginia, as well as, a Masters of Science
and Bachelor of Science also in Economics from the University of Wyoming.

© Wood Mackenzie 21
Delivering commercial insight
www.woodmac.com
Wood Mackenzie Disclaimer
This presentation has been prepared by Wood Mackenzie Inc for delivery at the PlattsBunker Fuel Conference in Houston in June 2011. It has not been prepared for the benefit of any particular attendee and may not be relied upon by any attendee or other third party. If, notwithstanding the foregoing, this presentation is relied upon by any person, Wood Mackenzie Inc does not accept, and disclaims, all liability for loss and damage suffered as a result.
The information contained in these slides may be retained by attendees. However, these slides and the contents of this presentation may not be disclosed to any other person or published by any means without Wood Mackenzie Inc's prior written permission.

© Wood Mackenzie 22
Delivering commercial insight
www.woodmac.com
Wood Mackenzie
Kintore House
74-77 Queen Street
Edinburgh EH2 4NS
Global Contact Details
Europe +44 (0)131 243 4400
Americas +1 713 470 1600
Asia Pacific +65 6518 0800
Email [email protected]
Global Offices
Australia - Canada - China - Japan - Malaysia - Russia - Singapore - South Africa - United Arab Emirates - United Kingdom - United States
Wood Mackenzie has been providing its unique range of research products and consulting services to the Energy industry for over 30 years. Wood Mackenzie provides forward-looking commercial insight that enables clients to make better
business decisions. For more information visit: www.woodmac.com