Buncombe County Competitive Demand Analysis
32
Buncombe County Competitive Demand Analysis August 30, 2017
Transcript of Buncombe County Competitive Demand Analysis

Buncombe CountyCompetitive Demand AnalysisAugust 30, 2017

2
Competitive Demand Analysis
• As we neared our fiscal year end, our data on hotel demand growth for the year raised some concerns
• It appeared that our growth – especially in early 2017 – was not as robust as that of some of our key competitors, including Charleston and Savannah
• We decided to dig in to available data to determine whether we were indeed underperforming on demand growth, and what the causes might be

3
Lodging Demand Data Sources
Source Inclusions Exclusions
Smith Travel
Hotel room supply, demand, revenue, ADR, occupancy and
other statistics by market, including actual data for
hotels participating in the research (estimated at 75-85%
of properties)
Actual data on non-participating hotels (While actual data is used for hotels that participate in theSmith Travel research, modeled data is used for hotels that do
not participate)
AirDNAAirBnB listings, bookings, ADR
and other statistics by listing type and by market
VRBO, Homeaway and other hotel-alternative lodging
sources

4
Competitors Included in Final Analysis
Destination Description
Buncombe County
Data shown represents Buncombe County, including but not limited to Asheville
Charleston Data shown represents the city of Charleston, South Carolina
Greenville Data shown represents the city of Greenville, South Carolina
Savannah Data shown represents the city of Savannah, Georgia

Findings(Please note that additional analysis was performed, but only data sources that yielded useful insights are included in this document.)

6
Competitive Demand Analysis• Lodging demand growth in Buncombe County is
outpacing that of key competitors• AirBnB is the beneficiary of that growth, and is changing
the dynamics of Buncombe County tourism• Airlift may also be a factor in growth versus key
competitors

7
After years of extraordinary growth, Buncombe County hotel demand is still growing, though perhaps not as fast as we would like.
FY 2016/2017Hotel Demand Growth*
• 3.7% Buncombe• 4.9% Charleston• 2.1% Greenville• 4.5% Savannah
*Growth rate of hotel demand (room nights) per Smith Travel data, the year ending 6/30/17 versus the year ending 6/30/16.

8
Hotel demand does not show the full picture, however, as Buncombe County outpaces competitors in AirBnB demand.
AirBnB Room NightsAirDNA data for July 1, 2016, through June 30, 2017. Includes AirBnB entire place demand (room nights), excludes private rooms and shared rooms. Does not include any VRBO or other hotel-alternative lodging sources.

9
All four destinations are seeingdramatic growth in AirBnB demand.
FY 2016/2017AirBnB
Demand Growth• 105% Buncombe• 165% Charleston• 205% Greenville• 169% Savannah
Source: AirDNA. AirBnB demand including entire place rentals only; shared rooms and private rooms in homes excluded.

10
AirBnB accounts for a much greater share of Buncombe County lodging demand than of competitors’ demand.
Number of Room Nights Percent of Room NightsAirDNA data for July 1, 2016, through June 30, 2017. Includes entire place demand, excludes private rooms and shared rooms.

11
With hotel and AirBnB demand combined, Buncombe County is outpacing key competitors’ growth.
FY 2016/2017Hotel + AirBnB
Demand Growth• 10.8% Buncombe• 7.8% Charleston• 2.7% Greenville• 7.3% Savannah
Growth rate of hotel plus AirBnB demand per Smith Travel and AirDNA data, the year ending 6/30/17 versus the year ending 6/30/16.Includes AirBnB entire place demand, not private room or shared room demand. VRBO and other hotel alternatives are not included.
213K incremental room nights

12
Source: Hotel demand data from Smith Travel and AirBnB data from AirDNA. Includes AirBnB entire place demand, not private room or shared room demand. Does not include VRBO, HomeAway or other hotel-alternative lodging.*Cyclocross event made for a better-than-expected January 2016. April 2016 was also a strong month for group sales.
Lodging demand growth was positive throughout FY17, with the exception of January, which was nearly flat*.
Combined DemandHotel + AirBnB
July Aug Sept Oct Nov Dec Jan Feb Mar Apr May June

13
Competitive Demand Analysis• Lodging demand growth in Buncombe County is
outpacing that of key competitors• AirBnB is the beneficiary of that growth, and is changing
the dynamics of Buncombe County tourism• Airlift may also be a factor in growth versus key
competitors

14
Source: Hotel demand data from Smith Travel and AirBnB data from AirDNA. Includes AirBnB entire place demand, not private room or shared room demand.
AirBnB accounts for 68% of demand growth in FY 2017.
.
68% AirBnB
32% Hotel
213K incremental room nights
FY17 vs. FY16

15
Source: Hotel demand data from Smith Travel and AirBnB data from AirDNA. Includes AirBnB entire place demand, not private room or shared room demand.
Increasingly throughout FY 2017, AirBnB was the primary beneficiary of demand growth.
Hotel DemandFY 2017FY 2016
AirBnB DemandFY 2017FY 2016
July Aug Sept Oct Nov Dec Jan Feb Mar Apr May June
16
The revenue implications are daunting, as ADR for AirBnB rentals in Buncombe County is
sharply lower than hotels’ ADR.
Smith Travel Research and AirDNA. AirBnB ADR is shown for hotel comparable listings only; 2+ bedroom rentals are excluded.
Hotel ADRAirBnB ADR
July Aug Sept Oct Nov Dec Jan Feb Mar Apr May June

17
It’s a challenge that is likely to continue to grow as younger generations are heavier users of AirBnB
than our core Boomer audiences.
52.2%
22.2%
18.0%
3.2%4.4%
Millennials Boomers Gen Xers Matures Gen Z
Source: MRI 2017 Spring (Wave 75-76), Airbnb – Hotels, Motels & Other Lodging – Personal/Vacation - Used in the last 12 months
Percent of AirBnB Users – Last 12 Months

18
Property owners in Buncombe County are eager participants: the number of AirBnB listings
continues to grow dramatically.
Source: AirDNA. Shows number of properties listed as available on AirBnB during the quarter.

19
Property owners in Asheville* are more likely than those in competing destinations to rent their properties via AirBnB.
*The city of Asheville specifically; the Buncombe County average is more in line with other tracked destinations.Sources: U.S. Census for number of households, AirDNA for number of properties (entire place or rooms) listed on AirBnB, shown as a percent of households in the geography.
3.5% of Asheville* households are offering properties or rooms on AirBnB.
City of Asheville Only – 1,319 AirBnB properties/37,672 households
Entire County – 2,044/101,860
1,531/52,450
1,024/52,798
262/26,636

20
In Buncombe County, compared to key competitors, AirBnB accounts for a far greater share of available rooms.
Sources: AirDNA for AirBnB listings; Smith Travel for hotel room census. All as of June 30, 2017. No other lodging sources included.*Only entire place listings included in AirBnB listings, not shared room or private room in home.
Destination AirBnBListings*
Hotel Rooms
AirBnB Share of Available Lodging
AirBnB Share of Booked Rooms
BuncombeCounty 1,337 7,229 15.6% 12.9%
Charleston 1,056 19,599 5.1% 4.4%Greenville 147 8,992 1.6% 0.9%Savannah 732 15,431 4.5% 4.1%

21
Competitive Demand Analysis• Lodging demand growth in Buncombe County is
outpacing that of key competitors• AirBnB is the beneficiary of that growth, and is changing
the dynamics of Buncombe County tourism• Airlift may also be a factor in growth versus key
competitors

22
Hub Airport AVL (4) SAV (13) CHS (19) GSP (11)Atlanta
CharlotteNewark
Chicago-O’HareChicago-Midway
Washington-DullesWashington-Reagan
Baltimore-WashingtonDallas-Fort Worth
Houston-BushHouston-Hobby
MiamiPhiladelphia
Fort LauderdaleDetroit
New York-LaGuardiaNew York-JFK
BostonNashville
Nonstop Destinations Served Daily, Year-Round
Source: Airline websites; Flightmapper.net

23
Airport AVL (6) SAV (6)** CHS (2) GSP (3)Orlando-SanfordFort Lauderdale
NewarkSt. Petersburg-TampaBaltimore-WashingtonPunta Gorda-Ft. Myers
PittsburghClevelandColumbusCincinnati
Seattle*Dallas-Love Field*
Nonstop Destinations Served Less Than Daily, Year-Round
* Flights to hub airports; all others point-to-point flights only (Allegiant) ** Most Savannah Allegiant flights do not run December and January
Source: Airline websites; Flightmapper.net

24
Hub Airport AVL (0) SAV (2) CHS (2) GSP (0)TorontoDetroit
St. LouisDenver
Nonstop Destinations Served Daily, Seasonal Only
Source: Airline websites; Flightmapper.net

25
Airport AVL (2) SAV (5) CHS (2) GSP (1)Vero Beach*
New York-LaGuardiaMinneapolis
BostonCleveland*
Indianapolis*Louisville*Lexington*
Punta Gorda/Ft. Myers*
Nonstop Destinations Served Less Than Daily, Seasonal Only
* Point-to-point flights only
Source: Airline websites; Flightmapper.net

26
Carrier ComparisonAirlines AVL (5) SAV (7) CHS (7) GSP (5)Delta
UnitedAmericanAllegiant
Elite*Air Canada*
JetBlueSouthwest
Sun Country*Alaska
Frontier*** Seasonal service only** Begins spring 2018
Source: Airline websites; Flightmapper.net

27
Comparison of Available SeatsSnapshot: Friday, 9/1/17
1,698
4,875
6,873
4,916
0
1000
2000
3000
4000
5000
6000
7000
8000
AVL SAV CHS GSP
Num
ber o
f Sea
ts in
to A
irpor
t
Source: Airline websites; Flightmapper.net
28
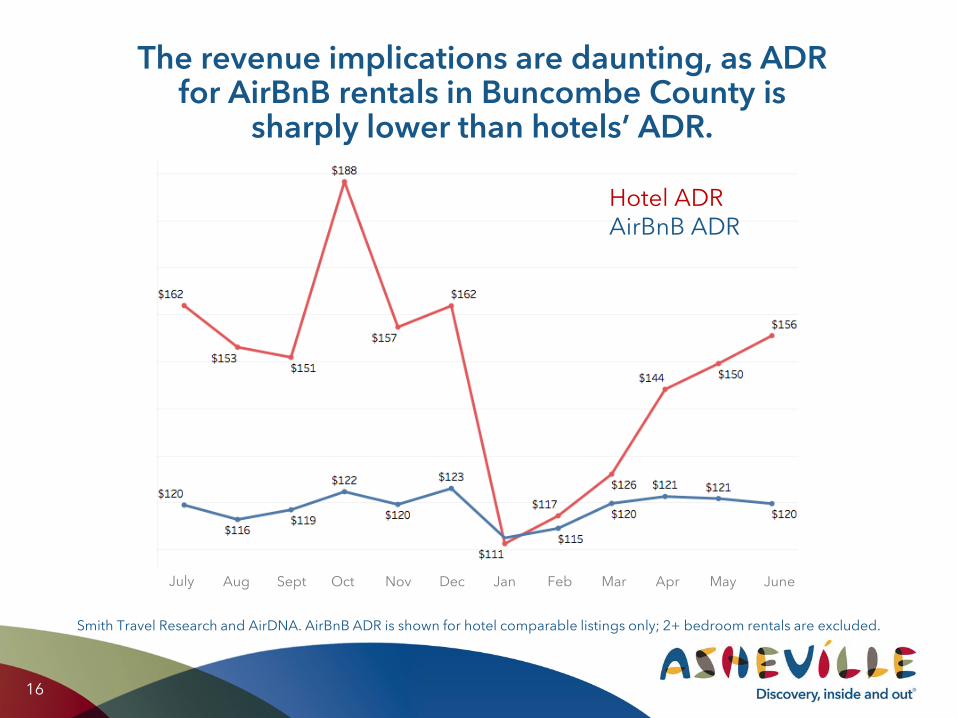
Allegiant • Newark (EWR), Baltimore/Washington (BWI), and Jacksonville (JAX)*
started in 2016, West Palm Beach (PBI)** in 2015, and Punta Gorda(PGD) in 2014
Elite• Vero Beach (VRB) seasonal service
United• Newark (EWR) service upgraded to mainline, year-round
American, Delta• Continued upgrades to larger equipment to CLT and ATL
Asheville – Recent Air Service Development
* Later discontinued** Station closed by Allegiant
29
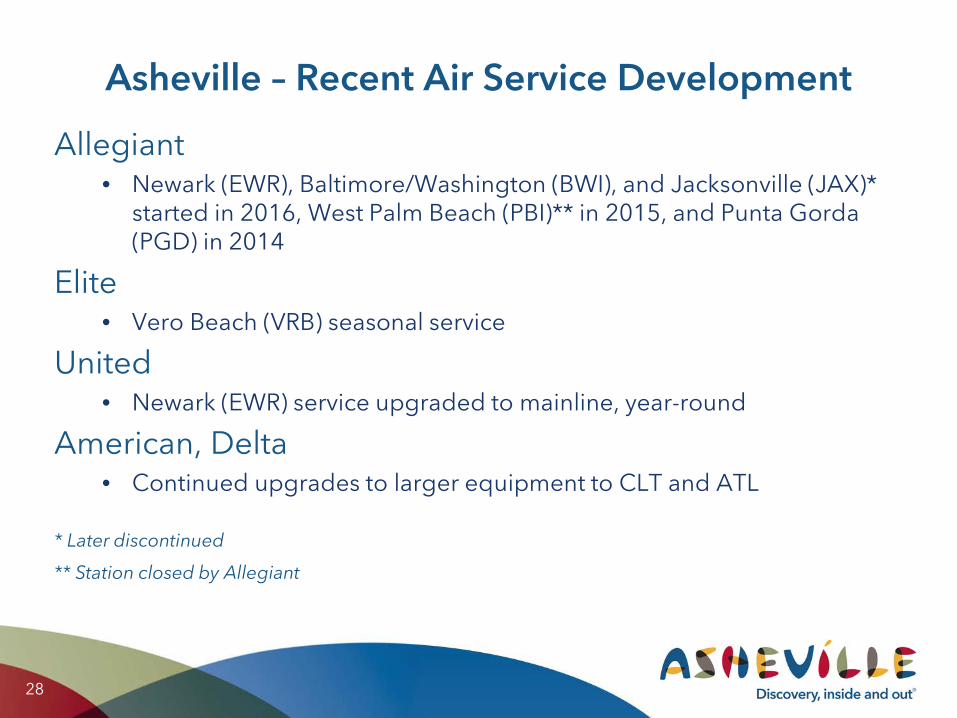
Southwest• Denver (DEN) & Saint Louis (STL), summer seasonal
JetBlue• New York (JFK) and Boston (BOS), expanded to Fort Lauderdale (FLL)
Delta• Boston (BOS), Saturday-only, seasonal service, beginning 2018
Frontier• Denver (DEN), beginning spring 2018
Charleston – Recent Air Service Development
30
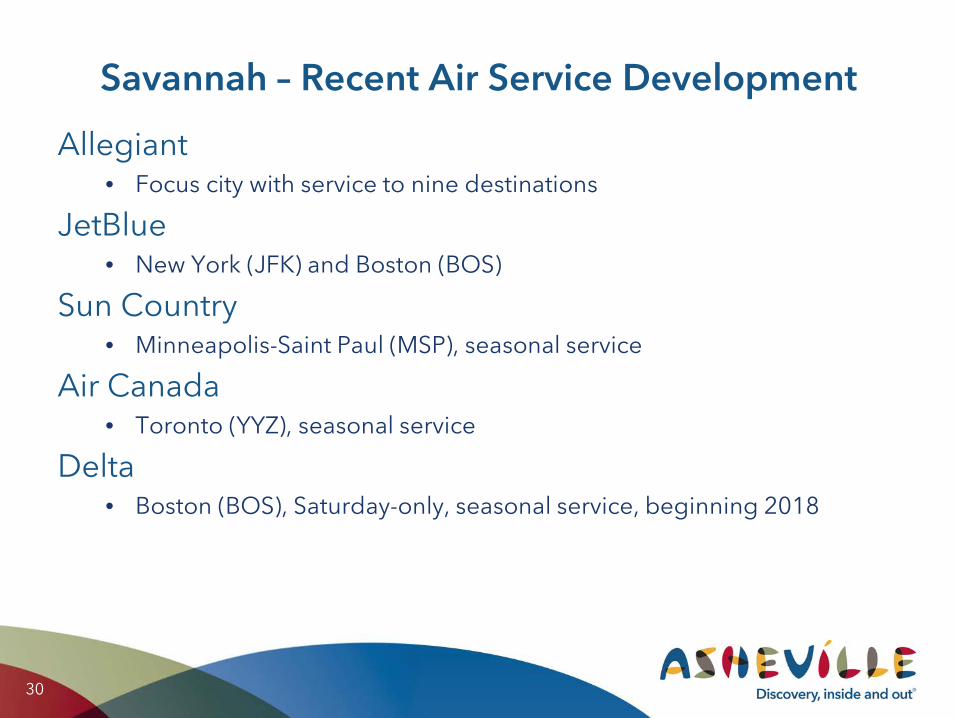
Allegiant• Focus city with service to nine destinations
JetBlue• New York (JFK) and Boston (BOS)
Sun Country• Minneapolis-Saint Paul (MSP), seasonal service
Air Canada• Toronto (YYZ), seasonal service
Delta• Boston (BOS), Saturday-only, seasonal service, beginning 2018
Savannah – Recent Air Service Development

31
Key Takeaways• AirBnB is a powerful force in Buncombe County, with
significant implications for the hotel industry and for bed tax revenues
It may make sense to study traveler behavior related to AirBnBin more detail, to help determine what – if anything – should be done to influence choice of lodging
• Limited airlift may also be a factor in relative growth, a factor Buncombe County may be able to influence

ThankYou.