
Built Environment Journal Built Environment Journal · BUILT ENVIRONMENT JOURNAL (BEJ) Chief Editor...
68
Built Environment Journal Built Environment Journal Faculty of Architecture, Planning and Surveying Volume 13 No. 2 July 2016 ISSN 1675-5022 GIS-based Noise Spatial Distribution Map Using Mobile Apps Syaza Rozali Siti Aekbal Salleh A Field Study of Indoor Air Quality in a Tropical Refectory Qi Jie Kwong Farah Yasmin Sulaiman Mohamad Sufian Hasim Redefining Urban Assessment Criteria towards Sufficient Future Cities Rostam Yaman Suwattana Thadaniti Hamimah Adnan Noraini Ahmad Appraising The Need to Study on the Format of Bills of Quantities Shamsulhadi Bandi Hamimah Adnan Fadhlin Abdullah Assessment of Solid Waste Management (SWM) Practices in Pangkor Island, Malaysia Kok Weng Tan Huoy Huoy Ong Nor Hanisah Mohd Hashim
Transcript of Built Environment Journal Built Environment Journal · BUILT ENVIRONMENT JOURNAL (BEJ) Chief Editor...

Built Environment Journal
Built Environment
Journal Faculty of Architecture, Planning and Surveying
Volume 13 No. 2 July 2016 ISSN 1675-5022
GIS-based Noise Spatial Distribution Map Using Mobile Apps
Syaza Rozali Siti Aekbal Salleh A Field Study of Indoor Air Quality in a Tropical Refectory
Qi Jie Kwong Farah Yasmin Sulaiman Mohamad Sufian Hasim Redefining Urban Assessment Criteria towards Sufficient Future Cities Rostam Yaman Suwattana Thadaniti
Hamimah Adnan
Noraini Ahmad Appraising The Need to Study on the Format of Bills of Quantities Shamsulhadi Bandi
Hamimah Adnan
Fadhlin Abdullah
Assessment of Solid Waste Management (SWM) Practices in Pangkor Island, Malaysia Kok Weng Tan Huoy Huoy Ong
Nor Hanisah Mohd Hashim
BUILT ENVIRONMENT JOURNAL (BEJ)
Chief Editor Professor Dr Abdul Hadi Hj Nawawi, Universiti Teknologi MARA, Malaysia
Managing Editor Assoc. Professor Datin Dr Hamimah Adnan, Universiti Teknologi MARA, Malaysia
Editorial Advisory and Review Board
Professor Dr Yusoff Abbas, Universiti
Teknologi MARA, Malaysia Professor Dr Zainal Mat Saat, Universiti
Teknologi MARA, Malaysia Assoc. Prof. Dr Norhati Ibrahim, Universiti
Teknologi MARA, Malaysia Professor Dr Dasimah Omar, Universiti
Teknologi MARA, Malaysia Professor Albert PC Chan, The Hong Kong
Polytechnic University Professor Dr Ismail Rahmat, Universiti
Teknologi MARA, Malaysia
Assoc. Prof. Dr Jamalunlaili Abdullah,
Universiti Teknologi MARA, Malaysia
Professor Dr Ir Siti Hawa Hamzah, Universiti
Teknologi MARA, Malaysia
Assoc. Prof. Dr Faridah Mohd Yusof,
Universiti Teknologi MARA, Malaysia
Assoc. Prof. Dr Oliver Ling Hoon leh,
Universiti Teknologi MARA, Malaysia Assoc. Prof. Dr Faisal Arain, Northen
Alberta Institute of Technology (NAIT) Professor Dr Charles Egbu, Salford
University, United Kingdom
Dr Asrul Nasid Masrom, Universiti Tun
Hussein Onn, Malaysia Dr Zaharah Yahya, Universiti Teknologi
MARA Professor Dr Azmi Ibrahim, Universiti
Teknologi MARA, Malaysia Professor Christopher Andrew Gorse, Leeds
Sustainability Institute
Sr. Dr Siti Aekbal Salleh, Universiti
Teknologi MARA, Malaysia
Dr Salina Mohamed Ali, Universiti
Teknologi MARA, Malaysia Professor Low Sui Pheng, National University
of Singapore Professor Dr George Ofori, National University
of Singapore, Singapore
Muhammad Redza Rosman, Universiti
Teknologi MARA, Malaysia
Copyright © July 2016 by Faculty of Architecture, Planning and Surveying, Universiti Teknologi
MARA, 40450 Shah Alam, Selangor, Malaysia.
All rights reserved. No part of this publication may be reproduced, stored in a retrieval system, or
transmitted in any form or any means, electronic, mechanical, photocopying, recording or otherwise,
without prior permission, in writing, from the publisher.
Built Environment Journal is jointly published by Faculty of Architecture, Planning and Surveying and
UiTM Press, Universiti Teknologi MARA, 40450 Shah Alam, Selangor, Malaysia.
The views and opinion expressed therein and those of the individual authors and the publication of these
statements in the Built Environment Journal do not imply endorsement by the publisher or the editorial
staff. Copyright vested in Universiti Teknologi MARA. Written permission is required to reproduce any
part of this publication.

Built Environment Journal
Built Environment
Journal Faculty of Architecture, Planning and Surveying
Volume 13 No. 2 July 2016 ISSN 1675-5022
1. GIS-based Noise Spatial Distribution Map Using Mobile Apps 1
Syaza Rozali Siti Aekbal Slleh
2. A Field Study of Indoor Air Quality in a Tropical Refectory 13
Qi Jie Kwong Farah Yasmin Sulaiman Mohamad Sufian Hasim
3. Redefining Urban Assessment Criteria towards Sufficient
Future Cities 26 Rostam Yaman Suwattana Thadaniti
Hamimah Adnan
Noraini Ahmad 4. Appraising The Need to Study on the Format of Bills of
Quantities 37 Shamsulhadi Bandi
Hamimah Adnan
Fadhlin Abdullah
5. Assessment of Solid Waste Management (SWM) Practices in
Pangkor Island, Malaysia 51 Kok Weng Tan Huoy Huoy Ong
Nor Hanisah Mohd Hashim

Built Environment Journal
1
GIS-BASED NOISE SPATIAL DISTRIBUTION MAP USING MOBILE
APPS
Syaza Rozali and Siti Aekbal Salleh*
Applied Remote Sensing and Geospatial Research Group
Faculty of Architecture, Planning and Surveying
Universiti Teknologi MARA
40450 Shah Alam, Selangor, Malaysia
ABSTRACT
Noisetube apps are used as a platform to collect noise data. However, the data from
crowdsourcing are shown as points of locations that is difficult for interpretation.
Therefore, to visualize better presentation of noise maps, interpolation method from GIS
software tools is used for data processing and analysis. The aim of this study is to prepare
noise pollution distribution using mobile apps in UiTM Shah Alam. Based on the aim, the
objective is to measure and record sound level data by apps and investigate suitable
interpolation methods for creating a continuous surface from discrete points for noise
analysis. With the global positioning system (GPS) provided in a smartphone and internet
data, NoiseTube apps will run their system for measuring noise data with location. The
data will be sent, stored and processed in NoiseTube server so that it can be downloaded
and viewed by the user. An accuracy of data is considered by performing calibration
process. ArcGIS desktop software is used to perform data processing and analysis by
testing difference interpolation method such as Kriging, CoKriging and Inverse Distance
Weighting (IDW). Analysis is carried out to identify the crowded place in Education zone.
The result shows that ordinary CoKriging is the suitable interpolation method for
mapping the noise distribution based on data collected in this study area. The calibration
result shows that smartphone is less accurate for noise measuring based on the
calibration test result about 7 decibel unit compared to the actual reading from the sound
level meter instrument.
Keywords: noise, interpolation, kriging, cokriging, inverse distance weighting
INTRODUCTION
Noise pollution will give significant impact to our environment and disturbing the quality of
human life. By scientific definition, noise or sound is a pressure oscillation in the air or water or any
medium, which conducts and travels (radiates) away from the source [2]. Noise impacts existed almost
from all types of development, such as during a construction and the activities happen after the
development. Noise pollution is a problem comes with time due to several factors such as increasing
population, industrialization, urbanization and changes in technology.
Technology that is rapidly growth will make easier for data collecting. Apps or application software
is developed in replacing the actual instrument but still apply the same function to measure sound. With
the global positioning system (GPS) provided in a smartphone and internet data, NoiseTube apps will
run their system for measuring noise data together with their location. The data will be sent, stored and
processed in NoiseTube server so that it can be downloaded and viewed by the user. Mapping noise
GIS-Based Noise Spatial Distribution Map Using Mobile Apps
2
pollution become more interesting with the various method and tools for generalization and analyzing
the noise distribution.
Noise can be described as a pollution when its value of sound reaches to danger level and cause to
disturb human privacy, physical and psychological health. In order to avoid this disturbance, people
should take earlier precaution to decide suitable living environment area. To have an instrument such as
a sound level meter (SLM) is not a big problem when the technologies nowadays give some effort to
develop apps for mobile device that can give same function as SLM but not as accurately because of
different types of microphone detection for each device use. User can use the application to detect the
level of sound together with the location by downloading, installing the apps and activate the GPS
available on their mobile. The measuring processes require expensive equipment and complex
procedures, the publishing is difficult to up-to-date noise pollution information to society.
Crowdsourcing for noise pollution can be applied to monitor the noise level by using smartphones with
microphone and GPS-enables. In this dissertation, Noisetube apps are used as a platform to collect noise
data. However, the data from crowdsourcing are shown as points of locations that is difficult for
interpretation. Therefore, in order to visualize better presentation of noise maps, interpolation method
from GIS software tools is used for data processing and analysis.
METHODOLOGY
Study Area and Research flow
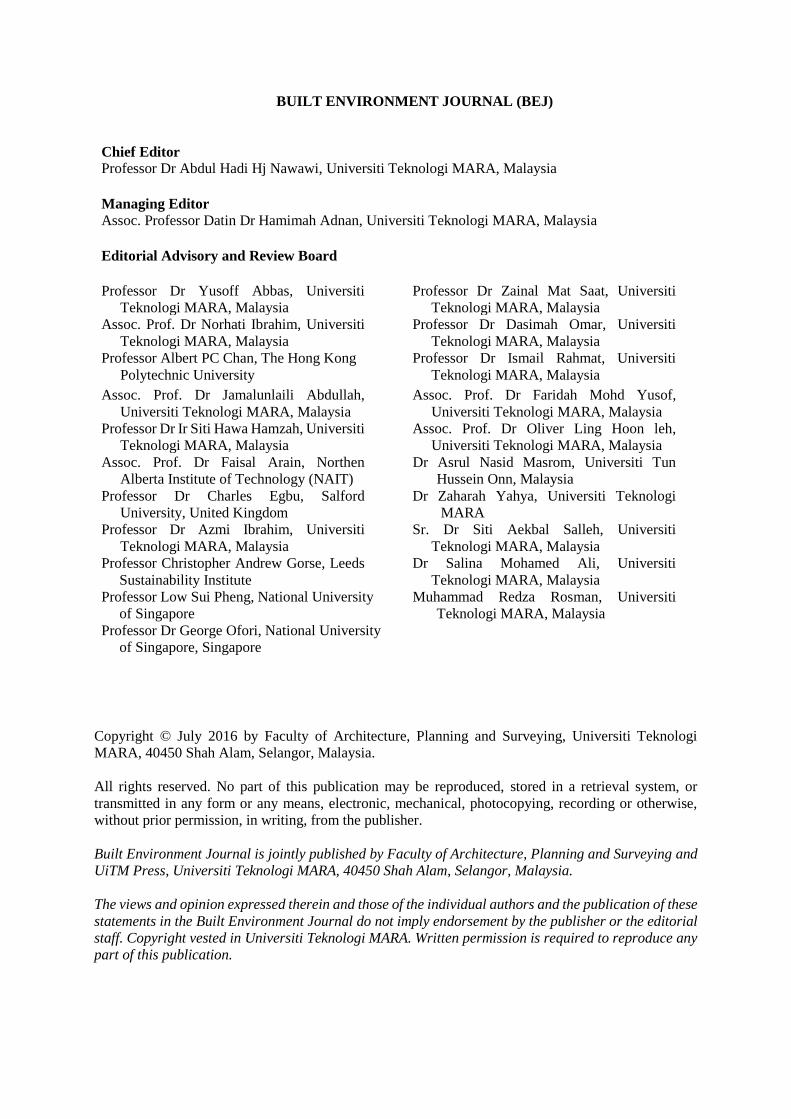
Site Location: Universiti Teknologi Mara (UiTM) Shah Alam, Selangor Darul Ehsan (Figure 1).
This site is located in Section 1. UiTM’s main campus started on 14 October 1967 by Tun Abdul Razak
and in the mid-70s, the campus was already in full operation. It acts as the main center of development
and expansion of a network of other campuses. This campus is very close to Shah Alam city center.
Therefore, public facilities and services are within easy reach. An added advantage is the fact that Shah
Alam is the hub of information technology and multimedia applications. It is also easily accessible via
the major highways that link the city to strategic locations in the country.
Figure 1: The Study Area.
Built Environment Journal
3
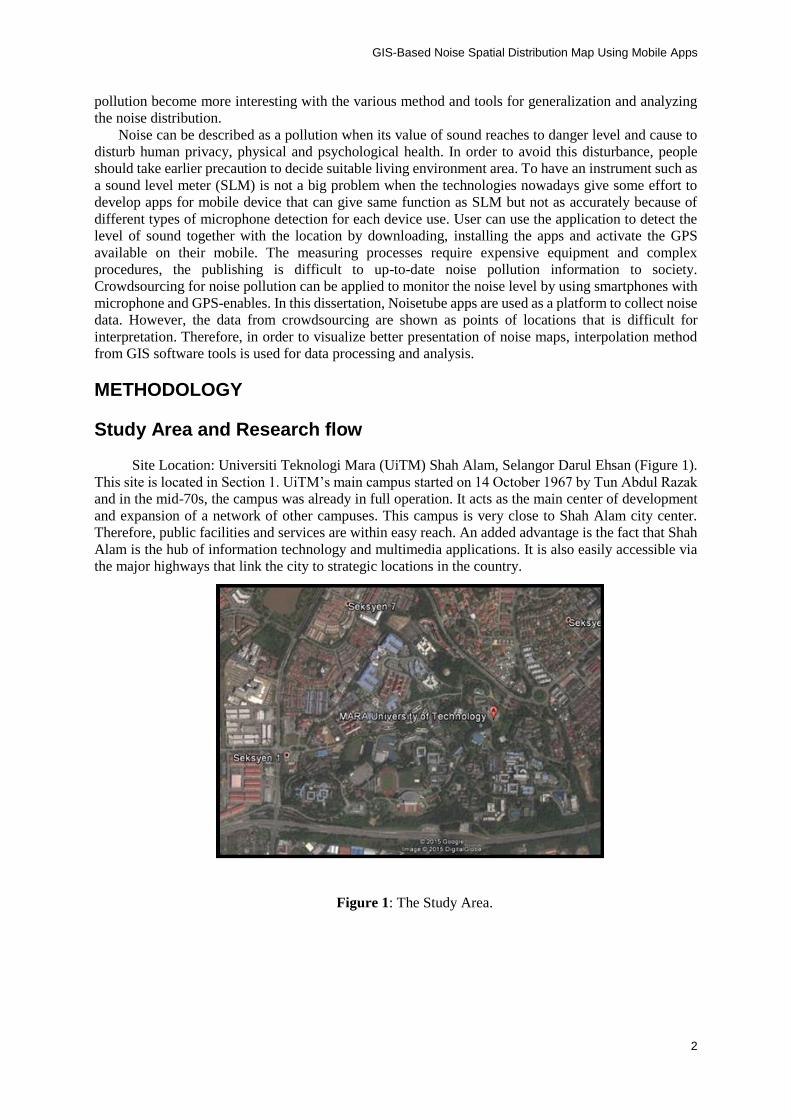
Figure 2:
Methodological Flowchart
Software Apps & Mobile requirement for data collection
The software application uses in this study are NoiseTube apps. This apps will be downloaded
and installed on a mobile device, HTC Desire 300. It collects information from different sensors
(microphone, GPS receiver, user input) which is logged locally and/or sent to NoiseTube community
memory server in real-time. There is no specific condition since all smartphones can be used to measure
noise level as long as it contains GPS, mobile data (internet connection) and apps.
The requirement for mobile device use:
i. The data plan for Internet access to transmit measurements in real time
ii. A GPS receiver
iii. Platform specifics:
-For Android phones: Android OS version 2.1 or later (minimal API level 7).
Ground Control and Noise Level Data To establish the ground control or point station, proper planning must be done so that the
distribution of noise data can be interpolate very well. The point station is chosen by marking it in the
paper obtained from the Google Earth image. Measurement of noise level for each point station has been
done in 5 minutes.
Phase 1 - Background study
Phase 3 - Data Management
Phase 4 - Data Processing &
Analysis
Phase 2 - Data Acquisition
Identify problem
Reconnaissance
Software Apps &
Mobile Testing
- Noisetube
ArcGIS (Interpolation
method)
- CoKriging
- IDW
Software Apps & Mobile requirement for data collection
Noise level data
Ground Control
Quality of data
-Eliminate of excessive
value of sound
-Data correction (calibrate)
Data storage
-Noisetube server
-Imported from kml to
shapefile

GIS-Based Noise Spatial Distribution Map Using Mobile Apps
4
Elimination of excessive data is required because it was the process to reduce error by deleting
the obtained data that occurred because of sudden phenomenon. It is because the data will generate
almost 200 point measurement in 5 minutes. Therefore, the point will be deleted if its value reaches
excessive levels more than 120 db (A) or maybe there is a redundant point produced same value.
The data measure by mobile apps is controlled by the real instrument, sound level meter (SLM).
The calibration is carried out in a lab where it is free from noise or sound. The instrument involves is
calibrator, SLM, HTC Desire 300 with NoiseTube apps and Spectrum Analyzer Pro Lab software.
GIS Techniques for Mapping Noise Distribution
Spatial interpolation is carried out to estimate values at others point by using the known values of
the points. The precipitation value at a location can be estimate with no recorded data by using known
precipitation value at nearby weather stations. Interpolation is performed in order to create a continuous
surface from point data. Interpolation is required when the discrete surface contains different levels of
resolution or cell size, a continuous surface is represented by a data model different from required and
the data do not cover the domain of interest completely.
There are two methods of interpolation used to test the noise data, kriging and IDW. In the
figure 3 shows the workflow of two different interpolation methods. The noise data are explored by
semivariogram analysis from kriging/cokriging method in order to obtain the best fitted model for better
predictive value. For IDW method, the power value is used to determine the RMS error.
Figure 3: Work flow of two different interpolation methods
RESULTS AND DISCUSSIONS
Calibration
The table 1 shows the result of calibration that is carried out in the lab. The error is calculated and
average of the overall error is used for correcting the data in the field measurement. The final error
(average) obtained is 7.778.

Built Environment Journal
5
Table 1: Calibration error result.
The graph shows the calibration of noise level apps. The graph indicates comparison between the
noise level before and after calibration with the reference calibrated from the sound level meter
instrument. There is very big difference of error between the sound level apps and sound level meter.
Figure 4: NoiseTube level comparison between before and after calibrated.
Cross Validation and Error Evaluation
Kriging method
The result in the table 2 and 3 are obtained using the geostatistical analyst tool by kriging method.
Table 2: Error obtained from different types of model.
Table 3: Parameter of semivariogram model.
To determine the degree of spatial dependence of the variable by referring to the nugget/sill ratio.
Nugget/sill ratio less than 25% have a strong spatial dependence, between 25% and 75% has moderate
spatial dependences and ratio above 75% has low spatial dependent variable. The result in table 2
shows that spherical and exponential model has a moderate spatial dependence variable while
No. ofmeasurement(each 5minutes)
Measured db(A) SLM db(A) ErrorValues aftercalibrated
1 85.54 94 8.46 93.318
2 86.73 94 7.27 94.508
3 86.43 94 7.57 94.208
4 86.15 94 7.85 93.928
5 86.26 94 7.74 94.038
Model Gaussian Spherical Exponential
Standardized RMS 0.9062478 0.9063944 0.9019401
RMS 11.33025 11.30711 11.28396
Model Nugget Sill Range Nugget/sill ratio
(%)
Gaussian 105.48892 145.67098 0.002878 72
Spherical 90.34858 144.64533 0.002878 62
Exponential 77.10807 146.9547 0.002878 52

GIS-Based Noise Spatial Distribution Map Using Mobile Apps
6
Gaussian has a low spatial dependence variable. When referred to the RMS error from table 3,
the exponential model gives the less error compared to Gaussian and spherical model. The best
model for fitting on variogram is selected based on less RMS error with the closest value to 1
for standardized RMS error.
Inverse Distance Weighted (IDW)
The result shows that less power value gives lowest error. In order to select the best method for
interpolation process, RMSE is used to make comparisons.
Table 4: RMSE for different power value.
Power value RMS
1 11.30435
2 11.44759
3 12.20171
Figure 5: Cross validation comparison between IDW and Kriging method.
Cross Validation Comparison Between Kriging And Cokriging
A better interpolation method should obtain smaller RMS. From the result, CoKriging method
gives the lowest RMS error. Figure 6, 7 and 8 shows the comparison of cross validation result between
kriging and Cokriging method.
Figure 6: Kriging and CoKriging comparison for morning period.
Built Environment Journal
7
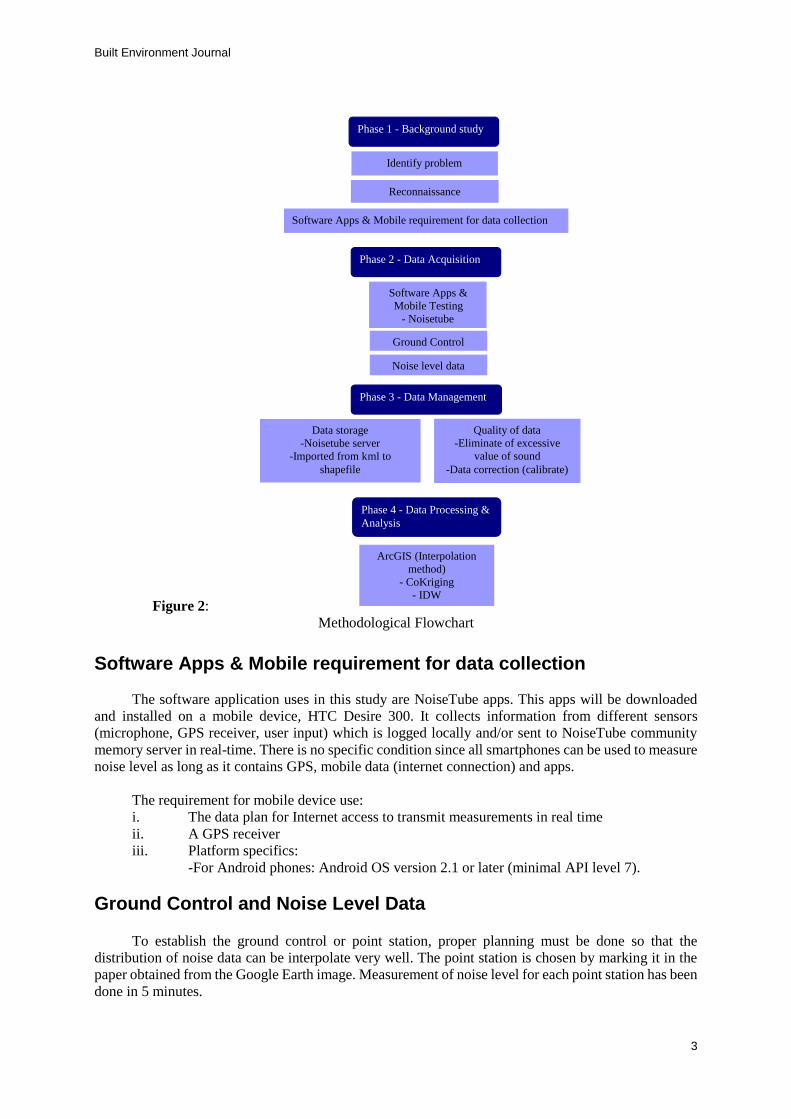
Figure 7: Kriging and CoKriging comparison for afternoon period.
Figure 8: Kriging and CoKriging comparison for evening period.
Table 5: RMS value between difference interpolation method.
Method RMS
Morning Afternoon Evening
Kriging 11.284 8.435 7.880
CoKriging 4.218 1.264 1.144
IDW 11.448 8.514 8.141
The predictive value of noise data for cokriging is better than kriging where the point is closed to
the model line. The predictions should be unbiased, indicated by a mean prediction error as close to 0
as possible. The standard errors are accurate, indicated by the root-mean-square standardized prediction
error close to 1.00. The predictions do not deviate much from the measured values, indicated by root-
meansquare error and average standard error that are as small as possible. Overall result shows that
ordinary Cokriging method with exponential model type is more accurate than kriging and IDW method
for preparing noise maps.
Noise Distribution By Cokriging Method
The following figures shows the result of prediction map from CoKriging interpolation method
with the range of predicted values.
GIS-Based Noise Spatial Distribution Map Using Mobile Apps
8
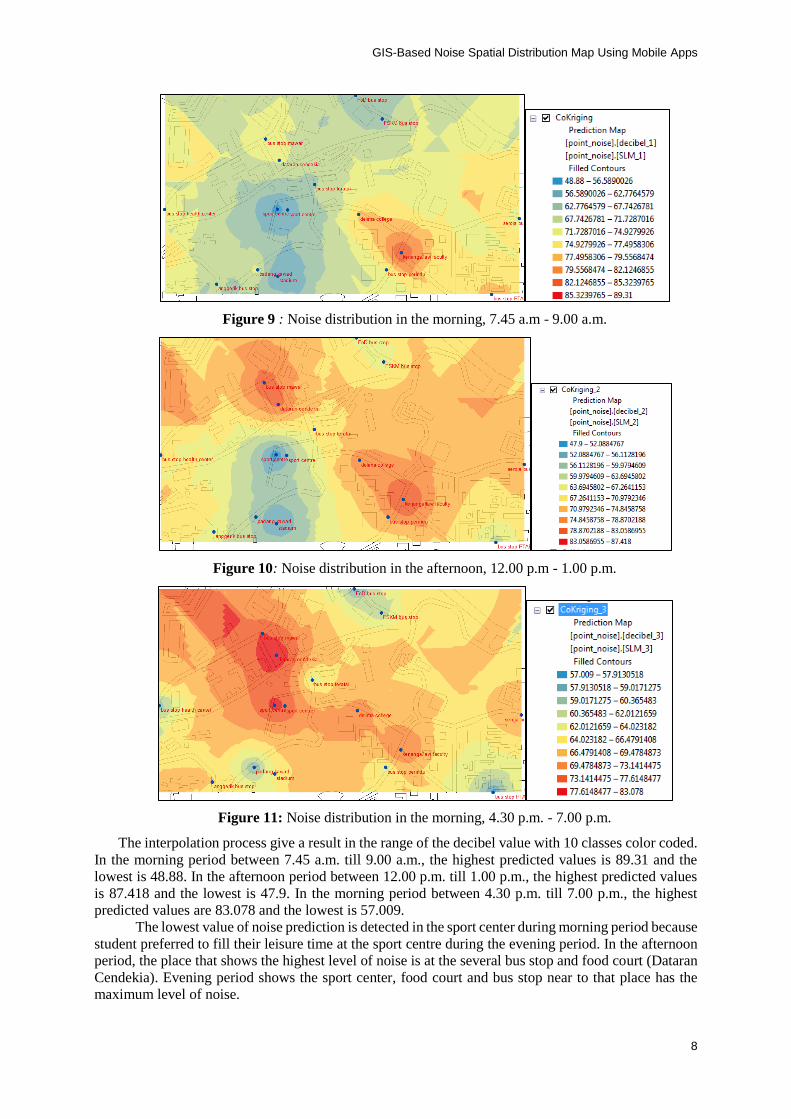
Figure 9 : Noise distribution in the morning, 7.45 a.m - 9.00 a.m.
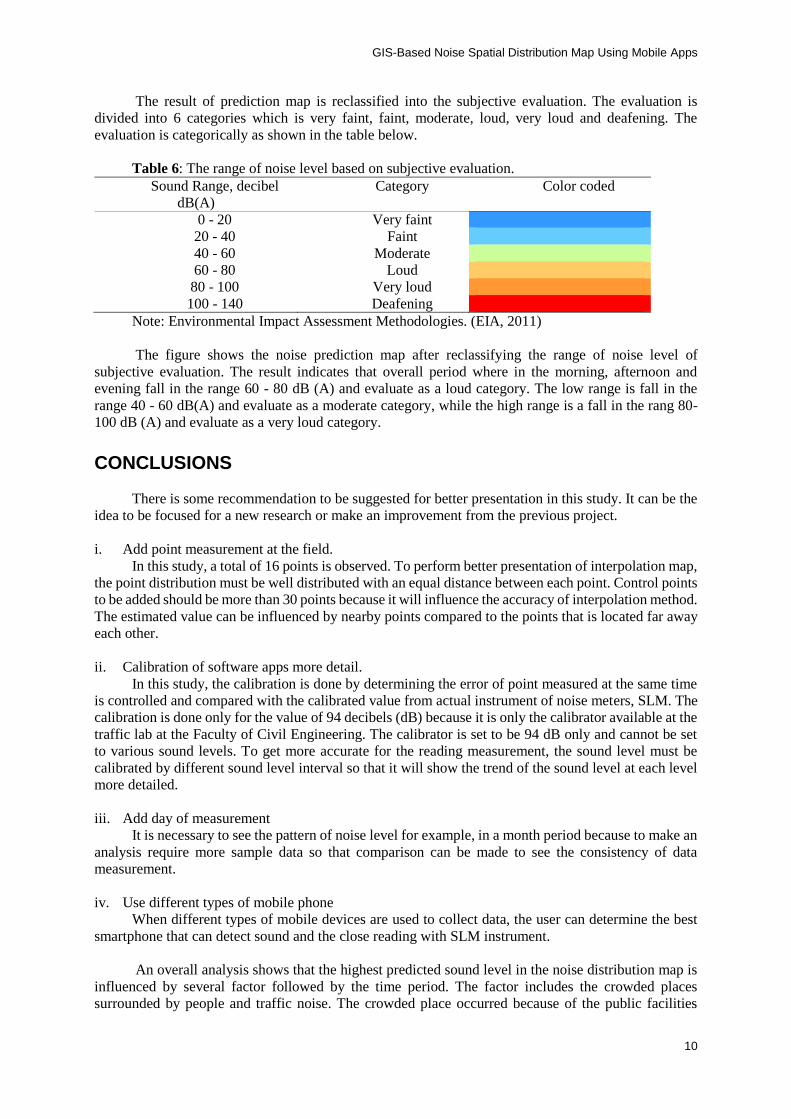
Figure 10: Noise distribution in the afternoon, 12.00 p.m - 1.00 p.m.
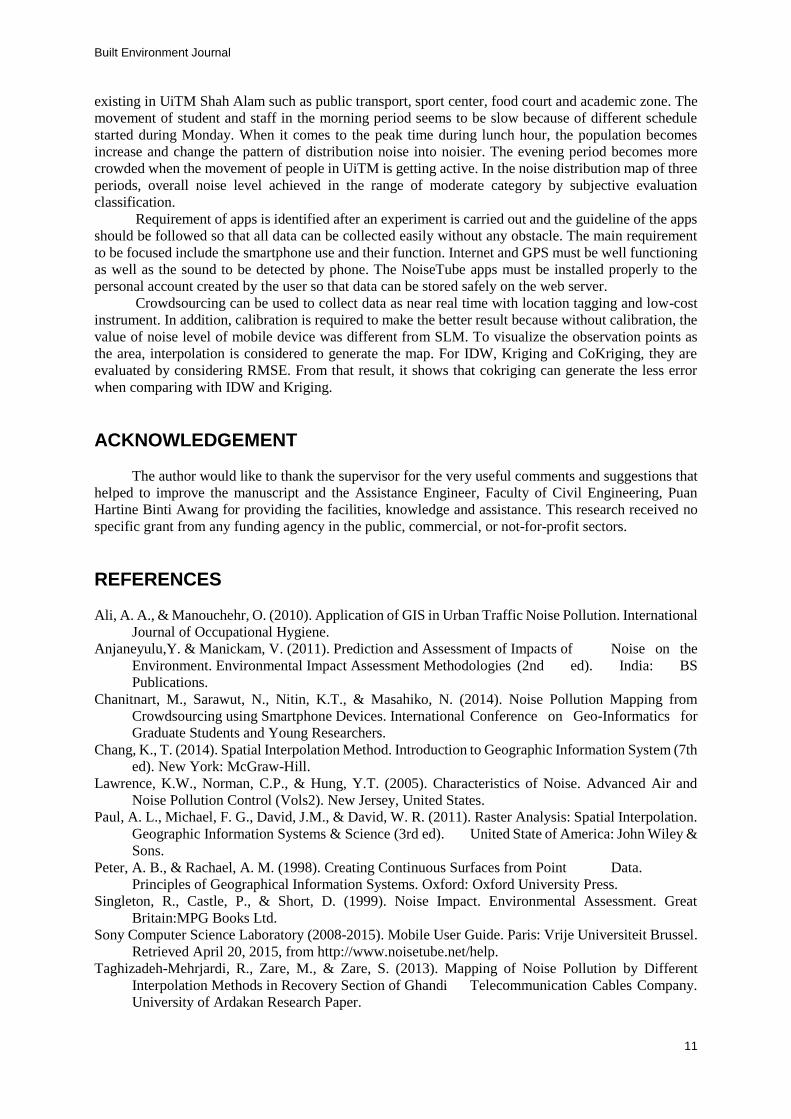
Figure 11: Noise distribution in the morning, 4.30 p.m. - 7.00 p.m.
The interpolation process give a result in the range of the decibel value with 10 classes color coded.
In the morning period between 7.45 a.m. till 9.00 a.m., the highest predicted values is 89.31 and the
lowest is 48.88. In the afternoon period between 12.00 p.m. till 1.00 p.m., the highest predicted values
is 87.418 and the lowest is 47.9. In the morning period between 4.30 p.m. till 7.00 p.m., the highest
predicted values are 83.078 and the lowest is 57.009.
The lowest value of noise prediction is detected in the sport center during morning period because
student preferred to fill their leisure time at the sport centre during the evening period. In the afternoon
period, the place that shows the highest level of noise is at the several bus stop and food court (Dataran
Cendekia). Evening period shows the sport center, food court and bus stop near to that place has the
maximum level of noise.

Built Environment Journal
9
Noise Distribution By Reclassify (Cokriging Method)
The following figures show the prediction map after reclassified based on the specific category.
Figure 12: Noise prediction map in the morning period.
Figure 13: Noise prediction map in the afternoon period.
Figure 14: Noise prediction map in the evening period.
GIS-Based Noise Spatial Distribution Map Using Mobile Apps
10
The result of prediction map is reclassified into the subjective evaluation. The evaluation is
divided into 6 categories which is very faint, faint, moderate, loud, very loud and deafening. The
evaluation is categorically as shown in the table below.
Table 6: The range of noise level based on subjective evaluation.
Sound Range, decibel
dB(A)
Category Color coded
0 - 20 Very faint
20 - 40 Faint
40 - 60 Moderate
60 - 80 Loud
80 - 100 Very loud
100 - 140 Deafening
Note: Environmental Impact Assessment Methodologies. (EIA, 2011)
The figure shows the noise prediction map after reclassifying the range of noise level of
subjective evaluation. The result indicates that overall period where in the morning, afternoon and
evening fall in the range 60 - 80 dB (A) and evaluate as a loud category. The low range is fall in the
range 40 - 60 dB(A) and evaluate as a moderate category, while the high range is a fall in the rang 80-
100 dB (A) and evaluate as a very loud category.
CONCLUSIONS
There is some recommendation to be suggested for better presentation in this study. It can be the
idea to be focused for a new research or make an improvement from the previous project.
i. Add point measurement at the field.
In this study, a total of 16 points is observed. To perform better presentation of interpolation map,
the point distribution must be well distributed with an equal distance between each point. Control points
to be added should be more than 30 points because it will influence the accuracy of interpolation method.
The estimated value can be influenced by nearby points compared to the points that is located far away
each other.
ii. Calibration of software apps more detail.
In this study, the calibration is done by determining the error of point measured at the same time
is controlled and compared with the calibrated value from actual instrument of noise meters, SLM. The
calibration is done only for the value of 94 decibels (dB) because it is only the calibrator available at the
traffic lab at the Faculty of Civil Engineering. The calibrator is set to be 94 dB only and cannot be set
to various sound levels. To get more accurate for the reading measurement, the sound level must be
calibrated by different sound level interval so that it will show the trend of the sound level at each level
more detailed.
iii. Add day of measurement
It is necessary to see the pattern of noise level for example, in a month period because to make an
analysis require more sample data so that comparison can be made to see the consistency of data
measurement.
iv. Use different types of mobile phone
When different types of mobile devices are used to collect data, the user can determine the best
smartphone that can detect sound and the close reading with SLM instrument.
An overall analysis shows that the highest predicted sound level in the noise distribution map is
influenced by several factor followed by the time period. The factor includes the crowded places
surrounded by people and traffic noise. The crowded place occurred because of the public facilities
Built Environment Journal
11
existing in UiTM Shah Alam such as public transport, sport center, food court and academic zone. The
movement of student and staff in the morning period seems to be slow because of different schedule
started during Monday. When it comes to the peak time during lunch hour, the population becomes
increase and change the pattern of distribution noise into noisier. The evening period becomes more
crowded when the movement of people in UiTM is getting active. In the noise distribution map of three
periods, overall noise level achieved in the range of moderate category by subjective evaluation
classification.
Requirement of apps is identified after an experiment is carried out and the guideline of the apps
should be followed so that all data can be collected easily without any obstacle. The main requirement
to be focused include the smartphone use and their function. Internet and GPS must be well functioning
as well as the sound to be detected by phone. The NoiseTube apps must be installed properly to the
personal account created by the user so that data can be stored safely on the web server.
Crowdsourcing can be used to collect data as near real time with location tagging and low-cost
instrument. In addition, calibration is required to make the better result because without calibration, the
value of noise level of mobile device was different from SLM. To visualize the observation points as
the area, interpolation is considered to generate the map. For IDW, Kriging and CoKriging, they are
evaluated by considering RMSE. From that result, it shows that cokriging can generate the less error
when comparing with IDW and Kriging.
ACKNOWLEDGEMENT
The author would like to thank the supervisor for the very useful comments and suggestions that
helped to improve the manuscript and the Assistance Engineer, Faculty of Civil Engineering, Puan
Hartine Binti Awang for providing the facilities, knowledge and assistance. This research received no
specific grant from any funding agency in the public, commercial, or not-for-profit sectors.
REFERENCES
Ali, A. A., & Manouchehr, O. (2010). Application of GIS in Urban Traffic Noise Pollution. International
Journal of Occupational Hygiene.
Anjaneyulu,Y. & Manickam, V. (2011). Prediction and Assessment of Impacts of Noise on the
Environment. Environmental Impact Assessment Methodologies (2nd ed). India: BS
Publications.
Chanitnart, M., Sarawut, N., Nitin, K.T., & Masahiko, N. (2014). Noise Pollution Mapping from
Crowdsourcing using Smartphone Devices. International Conference on Geo-Informatics for
Graduate Students and Young Researchers.
Chang, K., T. (2014). Spatial Interpolation Method. Introduction to Geographic Information System (7th
ed). New York: McGraw-Hill.
Lawrence, K.W., Norman, C.P., & Hung, Y.T. (2005). Characteristics of Noise. Advanced Air and
Noise Pollution Control (Vols2). New Jersey, United States.
Paul, A. L., Michael, F. G., David, J.M., & David, W. R. (2011). Raster Analysis: Spatial Interpolation.
Geographic Information Systems & Science (3rd ed). United State of America: John Wiley &
Sons.
Peter, A. B., & Rachael, A. M. (1998). Creating Continuous Surfaces from Point Data.
Principles of Geographical Information Systems. Oxford: Oxford University Press.
Singleton, R., Castle, P., & Short, D. (1999). Noise Impact. Environmental Assessment. Great
Britain:MPG Books Ltd.
Sony Computer Science Laboratory (2008-2015). Mobile User Guide. Paris: Vrije Universiteit Brussel.
Retrieved April 20, 2015, from http://www.noisetube.net/help.
Taghizadeh-Mehrjardi, R., Zare, M., & Zare, S. (2013). Mapping of Noise Pollution by Different
Interpolation Methods in Recovery Section of Ghandi Telecommunication Cables Company.
University of Ardakan Research Paper.

GIS-Based Noise Spatial Distribution Map Using Mobile Apps
12
Tessmer, M., & Harris, D. (1992). Acoustics. Analysing The Instructional Setting. Environmental
Analysis. London: Clays Ltd.
Universiti Teknologi MARA Official Website (2015). Profile & History. Retrieved Jun 25, 2015,
from http://www.uitm.edu.my/index.php/en/about-uitm/uitm-profile-history/university-
profile


Built Environment Journal
A FIELD STUDY OF INDOOR AIR QUALITY IN A TROPICAL
REFECTORY
Qi Jie Kwong, Farah Yasmin Sulaiman, Mohamad Sufian Hasim
Faculty of Architecture, Planning & Surveying,
Universiti Teknologi MARA, Shah Alam, Selangor, Malaysia.
ABSTRACT
A refectory is the building area in educational institutions where meals and beverages are
served. Since these areas are often occupied by a large number of students and staff during
mealtime, the provision of good indoor air quality (IAQ) is of utmost importance. To supplement
the available information about conditions of indoor air in many building areas which have
been reported in other studies and to identify the levels of indoor air parameters (IAPs) in a
Malaysian refectory, a field study has been carried out in a local university using electronic
environmental monitoring sensors and questionnaire survey and the results are reported in this
paper. The mean air temperature and concentration level of the carbon dioxide gas were found
to be higher than the acceptable ranges stipulated in both DOSH and ASHRAE IAQ standards,
while other IAPs were generally within the recommended levels. The split air-conditioning
units, albeit installed near the dining zones of the refectory, were found to be inefficient at
removing the occupant heat gain during peak hours and provided very limited ventilation
effectiveness since there is no fresh air intake for this type of air conditioner. High prevalence
of sick building syndrome (SBS) was also found in this building area, possibly due to the high
occupancy levels. Increased ventilation with the aid of exhaust fans and retrofitting of the
existing air conditioning system to a centralised one were required to lower the CO2 level as
well as removing other airborne contaminants.
Keywords: Refectory, educational institutions, indoor air quality (IAQ), indoor air parameters
(IAPs), field survey, ventilation
INTRODUCTION Given the fact that human spend most of their time indoors (Klepeis et al., 2001), a good indoor
environment is essential to maintain the comfort, safety and health of building users. Therefore, many
experimental studies on indoor air quality (IAQ) and occupant comfort conditions in offices,
laboratories, classrooms and other building spaces have been carried out since decades back (Ehsanol
et al., 2012; Asadi and Hussein, 2014; Travers and Vogl, 2015; Yousef et al., 2013; Kwong et al., 2014;
Rawi et al., 2014). Some of the main parameters that affect indoor air conditions are air temperature,
ventilation rate, humidity level and concentration levels of both chemical and biological air pollutants,
which would in turn affect human comfort, productivity and learning ability (Kumar and Fisk, 2002;
Kosonen and Tan, 2004; Karimipanah et al., 2007; Yu et al., 2009, Frontczak and Wargocki, 2011). As
most modern buildings are well insulated and tightly sealed for the protection of occupants, the use of
mechanical ventilation equipment to reduce concentration levels of pollutants become inevitable in
various places around the world (Lin & Chen, 2014; AIHA, 2015) and the importance of ventilation
towards controlling the concentrations and exposures released by indoor sources was also reported
(Nazaroff, 2013). However, some previous works had identified the prevalence of sick building
syndrome (SBS) in air-conditioned spaces at which some health related issues and dissatisfaction

A Field Study of Indoor Air Quality in a Tropical Refectory
15
towards the existing IAQ were reported by the occupants (Mui et al., 2011; McGill et al., 2015). Sekhar
and William (2004) specifically noted that air supply volume, location of supply and return air plenums,
space design and heat sources had significant impact on IAQ in tropical buildings. Besides, old
malfunctioning air conditioning system was found as one of the major reasons for poor IAQ in buildings
(Hirshberg, 2011).
A refectory or cafeteria is a dining area located within academic institutes with several unique
features compared to other building areas: it is usually designed to accommodate a large number of
consumers during peak periods (recess and meal time) of a typical academic session and the occupants
are generally exposed to a higher level of air pollutants in this area, as cooking is considered as a major
source of producing indoor pollutants in the form of exhaust particles (Sofuoglu et al., 2015). Lee et al.
(2001) found that the air contaminant levels were significantly higher at locations where cooking
activities were held, and different cooking methods may have different impact on the quality of indoor
air. The environmental conditions in the kitchen had been found to be closely related to the respiratory
symptoms of the workers (Svendsen et al., 2003). Therefore, setting up partitions to separate the cooking
area with other zones has been found to be effective in preventing the spread of the air particles generated
by cooking (Zhao et al., 2010). Besides, the effectiveness of the mechanical ventilation systems installed
at a food centre in a tropical country was studied and poor thermal environments were identified in
several locations (Wong et al., 2006). A more recent study has found that the equipment used in the
cafeteria often contributed to the increase of heat gain, which may lead to thermal discomfort among
occupants (Zainuddin et al., 2014). Although the abovementioned studies have pointed out the issue
related to IAQ in the eateries, the current information on the indoor air conditions in tropical refectories
is lacking, which proposed that more work in this field of study is required.
Since indoor contaminants are among the many factors that lead to poor IAQ, experimental studies
on IAQ often focus on determining the levels of important indoor air parameters (IAPs) and also the
occupants’ opinion. This paper examines issues related to indoor air conditions in the main refectory of
a local academic institute. The major indoor air parameters (IAPs) were measured in a series of field
measurements and occupant perception of their immediate surroundings were also studied. Based on the
results obtained from field surveys, recommendations were made for the improvement of indoor air
conditions in this building type.
DESCRIPTION OF THE REFECTORY UNDER STUDY The selected refectory is a part of the administrative building of a local university, which is conveniently
sited at the heart of the campus. It provides a diverse catering service to over 200 students and staff at
one time. The building layout is a multi-concept plan and is divided into two sections – the air-
conditioned indoor area where the kitchen, food serving stations and eating areas were located and the
naturally ventilated outdoor space where independent stalls were set up. The main area of the building
is concentrated on the right side, which is the indoor section. The dining area consists of both indoor
and outdoor areas, circulating the row of food stalls and catering serving counters. Other services like
cleaning and kitchen are placed indoors. The semester opening hours of the refectory are from 8.00 am
to 5.00 pm and served breakfast, lunch and evening meals. The main entrance is located at the right side
of the building. Besides, there are two sub-entrances located between the indoor and outdoor sections
of the building, but only one is accessible. Although ceiling mounted air conditioners are available in
the refectory, not all units are switched on during the air sampling period. Three windows are located
near to the entrance doors and were kept closed throughout the field survey due to the use of air
conditioners. The indoor environment of the refectory is shown in Figure 1. Since this academic
institution is a public one, smoking within its compound is strictly prohibited.

Built Environment Journal
16
Figure 1: Indoor environment of the refectory under study
METHODOLOGY
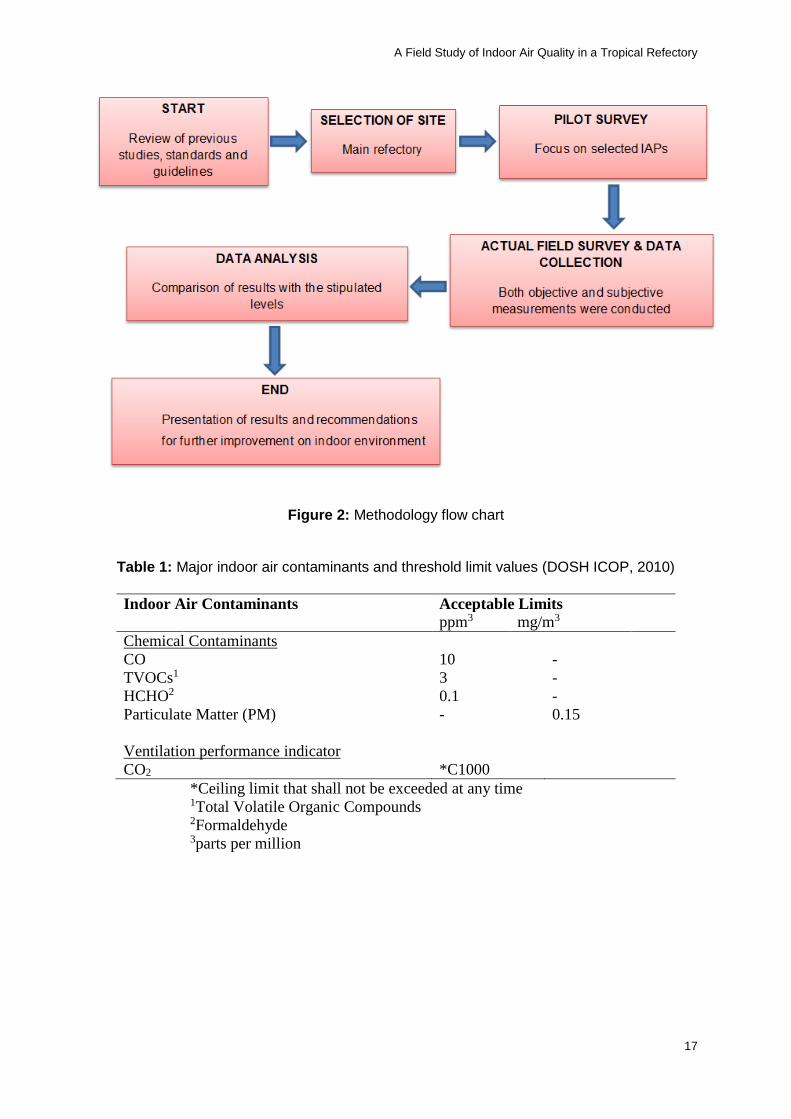
The methodology of this study (as presented in Figure 2) was developed based on the recommendations
in IAQ standards and guidelines. In this work, only the IAPs at the interior (air-conditioned) part of the
refectory were measured as that was the area where cooking activities were carried out and most of the
consumers were seated. A pilot study was first carried out to identify the existing air conditions in the
refectory. After that, four measuring points at the dining areas were selected so as to identify the levels
of IAPs at different locations, as highlighted in Figure 3. Two of the measuring points (L1 and L4) were
nearer to the entrance doors while the remaining points (L2 and L3) were more confined.
Two indoor environmental standards were referred to in this work – ASHRAE Std 62.1 (2016) and
DOSH ICOP (2010). ASHRAE Std 62.1 (2016) specifies minimum ventilation rates and other measures
intended to create an indoor environment with acceptable IAQ for the occupants and this standard has
been widely used by mechanical consulting engineers, building contractors, architects and government
agencies worldwide. For instance, this standard specifies that the concentration of interest of the Carbon
Monoxide (CO) gas is 9 ppm (8-hour observation period) and Carbon Dioxide (CO2) level in indoor
rooms should be controlled below 700 ppm. A sample questionnaire form is attached together with the
code so that industrial hygienists/ building engineers can use it freely to assess the quality of air in the
interior spaces. On the other hand, DOSH ICOP (2010) is a code of practice introduced by the
Department of Occupational Safety and Health, Malaysia to ensure that workers and building occupants
are protected from poor IAQ conditions that could adversely affect their comfort, safety and well-being
which would in turn lower their productivity. The acceptable ranges of IAPs are listed in this code of
practices, as shown in Table 1.
In this work, four IAQ monitoring instruments - Direct Sense-IAQ, VOC meter, HCHO sensor and
handheld CO-CO2 meter were used to measure the IAPs with an 8-hour observation period The
instruments were positioned at approximately 1.0 meter above the floor level at the selected measuring
points from 9 am to 5 pm daily during the field survey period, following the requirements stated in the
standards mentioned above. A questionnaire survey was carried out concurrently to assess the
perceptions of consumers towards their immediate surroundings. Consumers were selected randomly in
this case study as it was difficult to determine the occupancy duration of each individual, but the majority
of the respondents were those who had just finished their meals and those who were standing up waiting
to pay for their dishes. Field data were checked and compiled daily for analysis purposes.
A Field Study of Indoor Air Quality in a Tropical Refectory
17
Figure 2: Methodology flow chart
Table 1: Major indoor air contaminants and threshold limit values (DOSH ICOP, 2010)
Indoor Air Contaminants Acceptable Limits
ppm3 mg/m3
Chemical Contaminants
CO 10 -
TVOCs1 3 -
HCHO2 0.1 -
Particulate Matter (PM) - 0.15
Ventilation performance indicator
CO2 *C1000
*Ceiling limit that shall not be exceeded at any time 1Total Volatile Organic Compounds 2Formaldehyde 3parts per million

Built Environment Journal
18
Figure 3: Locations selected for data collection
RESULTS AND DISCUSSION
Physical Measurements
The measurement of IAPs was carried out in September to October 2016 in the main refectory of an
educational institution in Malaysia. Each day of the field survey was dedicated to one measuring location
(as shown in Figure 3) and no repetition of measuring work at the same location was performed in this
work. The measurements targeted CO, CO2, HCHO, VOCs, air temperature, air velocity and relative
humidity levels only.
A Field Study of Indoor Air Quality in a Tropical Refectory
19
Carbon Monoxide
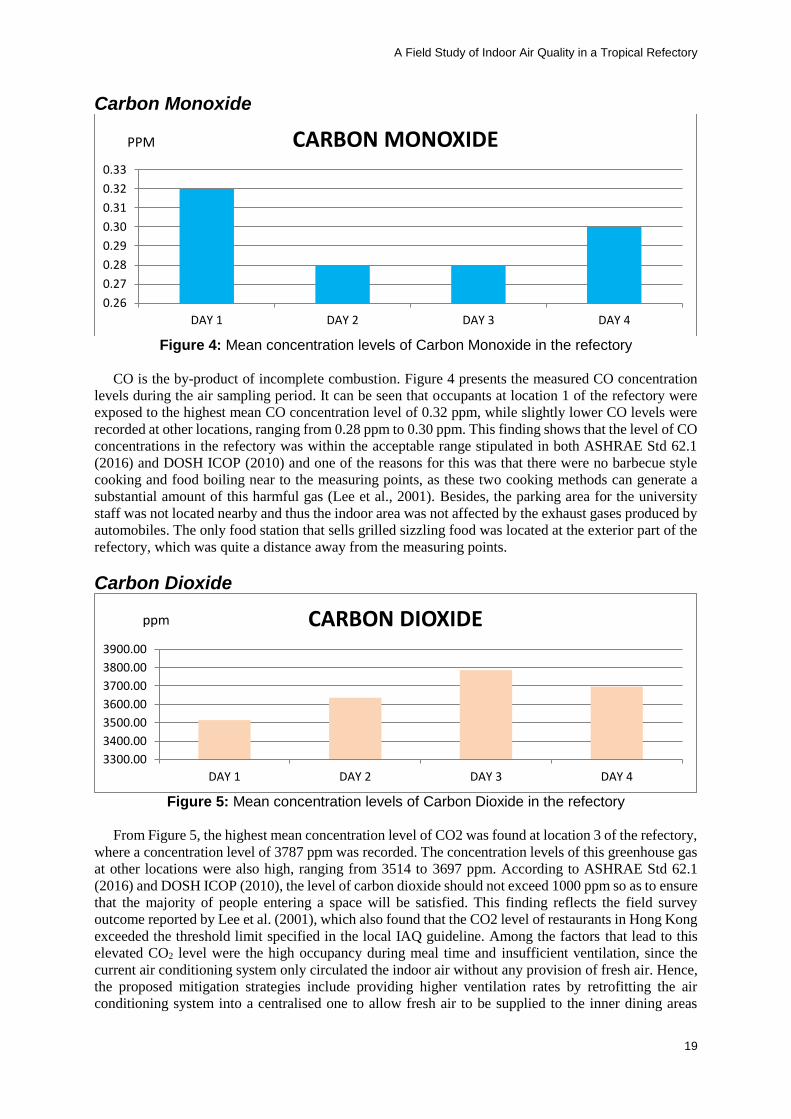
Figure 4: Mean concentration levels of Carbon Monoxide in the refectory
CO is the by-product of incomplete combustion. Figure 4 presents the measured CO concentration
levels during the air sampling period. It can be seen that occupants at location 1 of the refectory were
exposed to the highest mean CO concentration level of 0.32 ppm, while slightly lower CO levels were
recorded at other locations, ranging from 0.28 ppm to 0.30 ppm. This finding shows that the level of CO
concentrations in the refectory was within the acceptable range stipulated in both ASHRAE Std 62.1
(2016) and DOSH ICOP (2010) and one of the reasons for this was that there were no barbecue style
cooking and food boiling near to the measuring points, as these two cooking methods can generate a
substantial amount of this harmful gas (Lee et al., 2001). Besides, the parking area for the university
staff was not located nearby and thus the indoor area was not affected by the exhaust gases produced by
automobiles. The only food station that sells grilled sizzling food was located at the exterior part of the
refectory, which was quite a distance away from the measuring points.
Carbon Dioxide
Figure 5: Mean concentration levels of Carbon Dioxide in the refectory
From Figure 5, the highest mean concentration level of CO2 was found at location 3 of the refectory,
where a concentration level of 3787 ppm was recorded. The concentration levels of this greenhouse gas
at other locations were also high, ranging from 3514 to 3697 ppm. According to ASHRAE Std 62.1
(2016) and DOSH ICOP (2010), the level of carbon dioxide should not exceed 1000 ppm so as to ensure
that the majority of people entering a space will be satisfied. This finding reflects the field survey
outcome reported by Lee et al. (2001), which also found that the CO2 level of restaurants in Hong Kong
exceeded the threshold limit specified in the local IAQ guideline. Among the factors that lead to this
elevated CO2 level were the high occupancy during meal time and insufficient ventilation, since the
current air conditioning system only circulated the indoor air without any provision of fresh air. Hence,
the proposed mitigation strategies include providing higher ventilation rates by retrofitting the air
conditioning system into a centralised one to allow fresh air to be supplied to the inner dining areas
0.26
0.27
0.28
0.29
0.30
0.31
0.32
0.33
DAY 1 DAY 2 DAY 3 DAY 4
CARBON MONOXIDEPPM
3300.00
3400.00
3500.00
3600.00
3700.00
3800.00
3900.00
DAY 1 DAY 2 DAY 3 DAY 4
CARBON DIOXIDEppm

Built Environment Journal
20
(Location 2 and 3) and allowing more openings to be made in the refectory to enhance natural ventilation
especially at location 1. The site observation showed that exhaust fans can be installed in the wall area
between location 3 and 4 to enhance the contaminant removal effectiveness. A previous work has also
concluded that the loss of occupant productivity in office buildings was often affected by the level of
airflow rate (Kosonen and Tan, 2004).
Volatile Organic Compounds (VOCs) VOCs are chemical contaminants that are emitted by several indoor sources like paints, aerosol sprays,
cleansers, air fresheners, sealants, adhesives, partition boards and office equipment. Many sources have
reported that VOCs can easily enter the air and cause various SBS, which include headache, shortness
of breath, nausea, dry and watery eyes, flu-like symptoms and others. During the field measurement, the
readings of the electronic sensor showed no sign of this indoor gas within the refectory. The main reason
for this was that this location was unlike office spaces where large numbers of equipment are available.
The only possible sources of VOCs were the detergents used for floor and table cleaning, which were
only carried out after operating hours and no measurement was held. Moreover, this area has been in
use since the past decades and there was no recent renovation or repainting of the interior walls.
Formaldehyde (HCHO) HCHO is a type of VOC and is widely used in manufacturing domestic products, such as furniture and
other household items due to its abundance and low cost (Hirshberg, 2011). New building materials and
household equipment often emit HCHO gas at different rates. In this study, a separate handheld
electronic sensor was used to measure the HCHO level because of the limitation of the VOC meter,
which used a photoionisation detector (PID) that was not able to detect HCHO gas. Similar to the VOC,
it was found that the HCHO level was significantly lower than the prescribed value in DOSH ICOP
(2010). Most of the time the samples were below the equipment detection limit. The level of HCHO
measured in the refectory was within the range of 0 – 0.01 ppm, which is negligible. Therefore, it can
be concluded that both VOCs and HCHO levels were generally very low in the refectory and do not
pose any major health threat to the occupants.
Air Temperature
Figure 6: Measured mean air temperature
Good distribution of air flows in buildings is important for overall IAQ improvement (Clements-
Croome et al., 2008). The range of air temperature in the refectory is presented in Figure 6. It was
identified that the warmest place within the refectory was at location 4, at which an average temperature
of 28.2 oC was measured. On the other hand, location 2 and 3 had the lowest mean temperature where
the mean air temperature at both locations was about 28.0 oC. The results also showed that the air
27.90
27.95
28.00
28.05
28.10
28.15
28.20
28.25
DAY 1 DAY 2 DAY 3 DAY 4
AIR TEMPERATURE°C
A Field Study of Indoor Air Quality in a Tropical Refectory
21
temperature was higher than the recommended temperature range of 23 – 27°C in DOSH ICOP (2010),
which may cause thermal discomfort among occupants. It was found that some of the air conditioning
units were not functioning properly during the field survey, where an increase of air temperature was
observed during peak hours. Therefore, there was need to retrofit the existing air-conditioning units in
the refectory to provide a lower supply air temperature, especially at the dining areas. This suggestion
was echoed by the results of a previous study, which proposed the use of additional air-conditioning unit
to improve the thermal environment in an air-conditioned cafeteria (Zainuddin et al., 2014).
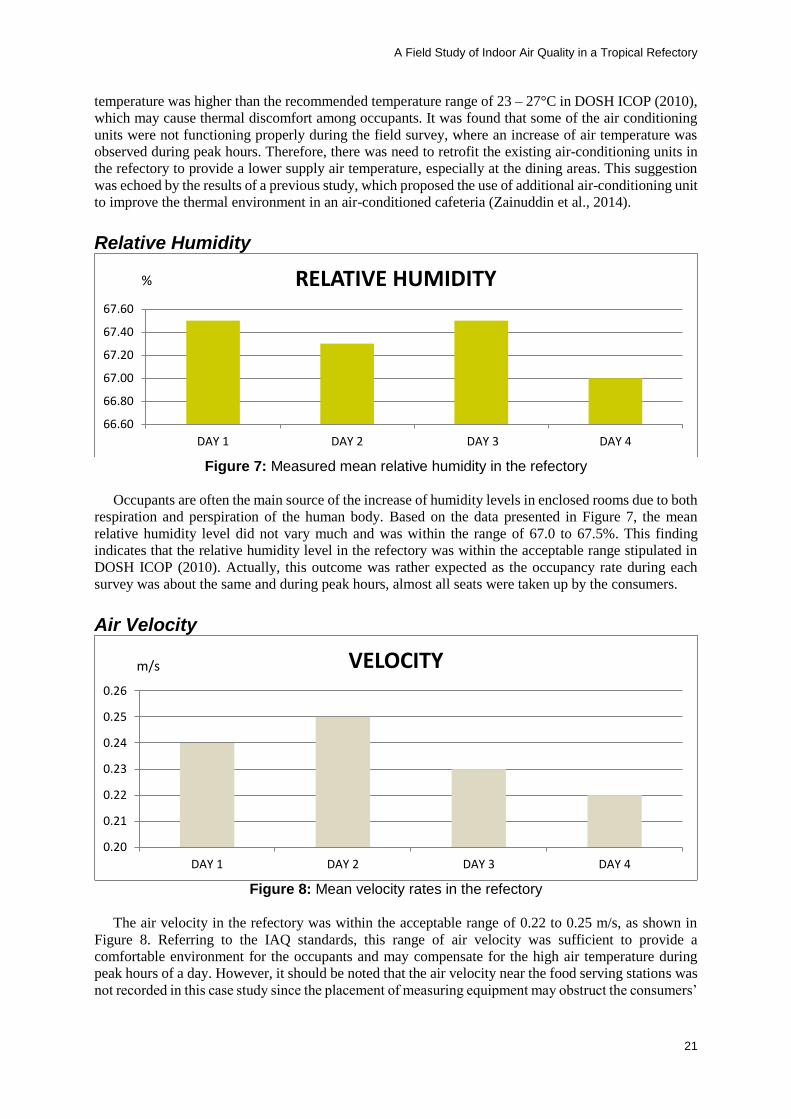
Relative Humidity
Figure 7: Measured mean relative humidity in the refectory
Occupants are often the main source of the increase of humidity levels in enclosed rooms due to both
respiration and perspiration of the human body. Based on the data presented in Figure 7, the mean
relative humidity level did not vary much and was within the range of 67.0 to 67.5%. This finding
indicates that the relative humidity level in the refectory was within the acceptable range stipulated in
DOSH ICOP (2010). Actually, this outcome was rather expected as the occupancy rate during each
survey was about the same and during peak hours, almost all seats were taken up by the consumers.
Air Velocity
Figure 8: Mean velocity rates in the refectory
The air velocity in the refectory was within the acceptable range of 0.22 to 0.25 m/s, as shown in
Figure 8. Referring to the IAQ standards, this range of air velocity was sufficient to provide a
comfortable environment for the occupants and may compensate for the high air temperature during
peak hours of a day. However, it should be noted that the air velocity near the food serving stations was
not recorded in this case study since the placement of measuring equipment may obstruct the consumers’
66.60
66.80
67.00
67.20
67.40
67.60
DAY 1 DAY 2 DAY 3 DAY 4
RELATIVE HUMIDITY%
0.20
0.21
0.22
0.23
0.24
0.25
0.26
DAY 1 DAY 2 DAY 3 DAY 4
VELOCITYm/s

Built Environment Journal
22
queue for picking up food and to make payment. The architectural design of the refectory, which had a
very narrow queuing path, had also limited the locations available for measurement.
Questionnaire Survey The occupant perception of the indoor environmental conditions was studied in this work using
questionnaire survey. Questionnaires were distributed during the peak hours only where almost all seats
in the refectory were occupied. A total of 53 responses was collected throughout the field survey. The
outcome of the questionnaire survey is tabulated in Table 2.
Table 2: Subjective response to indoor environment in the refectory
IAPs ASHRAE 7-scale Point
-3 -2 -1 0 1 2 3
Indoor Temperature Cold 0% 0% 0% 33% 51% 16% 0% Hot
Relative Humidity Dry 0% 0% 46% 22% 32% 0% 0% Wet
Air Movement Still 0% 28% 43% 29% 0% 0% 0% Draughty
Air Quality Smelly 0% 31% 59% 10% 0% 0% 0% Odourless
As shown in Table 2, most of the respondents found that their immediate surroundings were slightly
warm, which concurs with the physical measurement results and therefore the air-conditioning supply
air temperature should be lowered. The votes on relative humidity perception focused on the three centre
categories of the scale, which was somehow expected because of the small variation of this IAP. As for
the air movement, a large number of the respondents, especially those who were seated or standing near
to the food serving stations, opined that the air was too still even when the air velocity was generally
within the acceptable range stated in the IAQ standards. One of the obvious reasons for this was the
crowded environment during peak hours, which directly resulted in restricted air movement.
Furthermore, the vendor had to make sure that some of the food to be served while warm due to both
hygienic and consumer preference purposes. Therefore, increasing the ventilation rate near the food
stations may not be appropriate in this case. Other than that, the general perception of air quality also
demonstrated the need for more air movement, since the majority of the votes regardless of the
respondents’ seating position was placed on the less desirable side of the comfort scale. Many of the
respondents were seen either queuing or sitting close to each other because of the limited seats available
in the refectory. Based on the findings obtained, the use of commercial electric fan can be considered at
locations where low air velocities were measured so as to enhance the cooling effect, especially during
lunch break where a sudden increase in occupancy level was observed. Besides, enhanced ventilation
can be made through making more openings at the fenestration of the building, which allows more
infiltration of outdoor air since people in the tropics were found to be more adapted to the warmer
environment if more ventilation is available (Khedari et al., 2006).
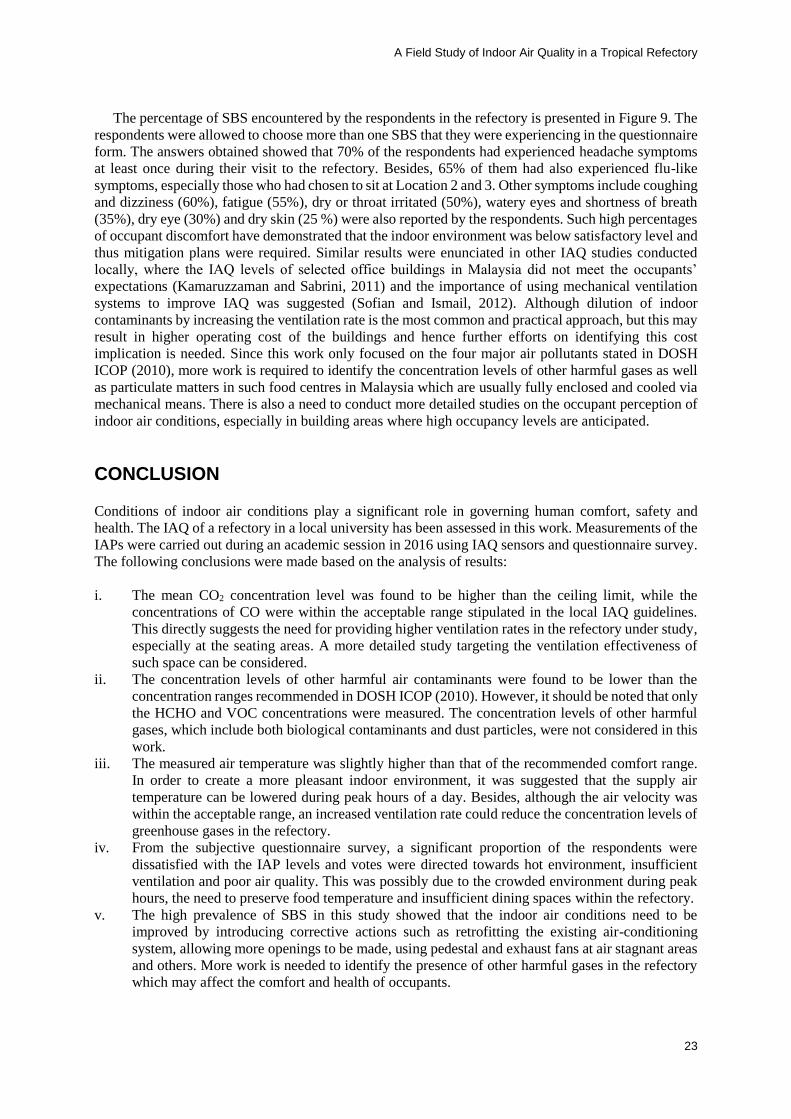
Figure 9: SBS experienced by respondents
30%35%
55%
60%
50%70%
65%
35%
60%
25%
Dry eyes
Watery eyes
Tiredness/ Lethargy
Coughing
Dry or irritated throat
Headaches
Flu-like Symptoms
Breathing Difficulty
Dizziness/ Lightheaded
Dry Skin
A Field Study of Indoor Air Quality in a Tropical Refectory
23
The percentage of SBS encountered by the respondents in the refectory is presented in Figure 9. The
respondents were allowed to choose more than one SBS that they were experiencing in the questionnaire
form. The answers obtained showed that 70% of the respondents had experienced headache symptoms
at least once during their visit to the refectory. Besides, 65% of them had also experienced flu-like
symptoms, especially those who had chosen to sit at Location 2 and 3. Other symptoms include coughing
and dizziness (60%), fatigue (55%), dry or throat irritated (50%), watery eyes and shortness of breath
(35%), dry eye (30%) and dry skin (25 %) were also reported by the respondents. Such high percentages
of occupant discomfort have demonstrated that the indoor environment was below satisfactory level and
thus mitigation plans were required. Similar results were enunciated in other IAQ studies conducted
locally, where the IAQ levels of selected office buildings in Malaysia did not meet the occupants’
expectations (Kamaruzzaman and Sabrini, 2011) and the importance of using mechanical ventilation
systems to improve IAQ was suggested (Sofian and Ismail, 2012). Although dilution of indoor
contaminants by increasing the ventilation rate is the most common and practical approach, but this may
result in higher operating cost of the buildings and hence further efforts on identifying this cost
implication is needed. Since this work only focused on the four major air pollutants stated in DOSH
ICOP (2010), more work is required to identify the concentration levels of other harmful gases as well
as particulate matters in such food centres in Malaysia which are usually fully enclosed and cooled via
mechanical means. There is also a need to conduct more detailed studies on the occupant perception of
indoor air conditions, especially in building areas where high occupancy levels are anticipated.
CONCLUSION Conditions of indoor air conditions play a significant role in governing human comfort, safety and
health. The IAQ of a refectory in a local university has been assessed in this work. Measurements of the
IAPs were carried out during an academic session in 2016 using IAQ sensors and questionnaire survey.
The following conclusions were made based on the analysis of results:
i. The mean CO2 concentration level was found to be higher than the ceiling limit, while the
concentrations of CO were within the acceptable range stipulated in the local IAQ guidelines.
This directly suggests the need for providing higher ventilation rates in the refectory under study,
especially at the seating areas. A more detailed study targeting the ventilation effectiveness of
such space can be considered.
ii. The concentration levels of other harmful air contaminants were found to be lower than the
concentration ranges recommended in DOSH ICOP (2010). However, it should be noted that only
the HCHO and VOC concentrations were measured. The concentration levels of other harmful
gases, which include both biological contaminants and dust particles, were not considered in this
work.
iii. The measured air temperature was slightly higher than that of the recommended comfort range.
In order to create a more pleasant indoor environment, it was suggested that the supply air
temperature can be lowered during peak hours of a day. Besides, although the air velocity was
within the acceptable range, an increased ventilation rate could reduce the concentration levels of
greenhouse gases in the refectory.
iv. From the subjective questionnaire survey, a significant proportion of the respondents were
dissatisfied with the IAP levels and votes were directed towards hot environment, insufficient
ventilation and poor air quality. This was possibly due to the crowded environment during peak
hours, the need to preserve food temperature and insufficient dining spaces within the refectory.
v. The high prevalence of SBS in this study showed that the indoor air conditions need to be
improved by introducing corrective actions such as retrofitting the existing air-conditioning
system, allowing more openings to be made, using pedestal and exhaust fans at air stagnant areas
and others. More work is needed to identify the presence of other harmful gases in the refectory
which may affect the comfort and health of occupants.

Built Environment Journal
24
ACKNOWLEDGEMENT
The authors would like to thank the FSPU, UiTM Shah Alam for supporting this research and the
students and staff of the university who have taken part in the questionnaire survey held in the main
refectory.
REFERENCES American Industrial Hygiene Association (AIHA) (2015). Improving Indoor Air Quality at Work, AIHA
Protecting Worker Health.
ASHRAE Standard 62.1 (2016). Ventilation for Acceptable Indoor Air Quality, ANSI/ASHRAE. ISSN
1041 – 2336.
A. Zainuddin, N.M. Adam, I. H. Rusli and Q. J. Kwong (2014). Simulation of thermal comfort
conditions of an air-conditioned cafeteria in the tropics. Applied Mechanics and Materials, Vol.
564, 263 – 268.
B. A. A. Yousef, A. A. D. Elshareef, M. A. K. Ibraheem, S. S. Alsayed (2013). Assessment of Indoor
Air Quality in Medical Facilities in Sudan. International Journal of Scientific & Technology
Research Volume 2, Issue 1, 23-29.
B.F. Yu, Z.B. Hu, M. Liu, H.L. Yang, Q.X. Kong Y.H. Liu (2009). Review of research on air-
conditioning systems and indoor air quality control for human health. International Journal of
Refrigeration, Vol.32(1), 3 – 20.
C.C. Lin, H.Y. Chen, (2014). Impact of HVAC filter on indoor air quality in terms of ozone
removal and carbonyls generation. Atmospheric Environment, Vol. 89(1), 29-34.
D.J. Clements-Croome, H.B. Awbi, Z.B., Biro, N. Kochhar and M. Williams (2008). Ventilation rates
in schools. Journal of Building and Environment. 43(3): 362 – 367.
Department of Occupational Safety and Health (DOSH) (2010). Industrial Code of Practice on Indoor
Air Quality (ICOP-IAQ).Department of Occupational Safety and Health, Putrajaya.
G. McGill, L.O. Oyedele and K. McAllister (2015). Case study investigation of indoor air quality in
mechanically ventilated and naturally ventilated UK social housing. International Journal of
Sustainable Built Environment, Vol. 4, 58 – 77.
I. Asadi and I. Hussein (2014). Indoor Air Quality (IAQ) Acceptance in Universiti Tenaga
National, Issue 1, 44-50.
J. Hirshberg (2011). IAQ and your health: A deeper look at VOCs and Formaldehyde emissions. Green
Building Supply. Retrieved November 13, 2016, from
http://www.greenbuildingsupply.com/Learning-Center/Paints-Coatings-LC/IAQ-and-Your-
Health-A-Deeper-Look-at-VOCs-and-Formaldehyde
J. Khedari, N. Yamtraipat, N. Pratintong and J. Hirunlabh (2000). Thailand ventilation comfort chart.
Journal of Energy and Buildings, Vol. 32, 245 – 249.
K. Ehsanul, K.H. Kim, J.R. Sohn, B. Y. Kweon, J. H. Shin (2012). Indoor air quality assessment
in child care and medical facilities in Korea. Environmental Monitoring and Assessment, Vol.
184 (10), 6395-6409.
K. Svendsen, A.K.Sjaastad and I. Sivertsen (2003). Respiratory symptoms in kitchen workers. American
Journal of Industrial Medicine, Vol. 43 (4), 436 – 439.
K.W. Mui, P.S. Hui and L.T. Wong (2011). Diagnostics of unsatisfactory indoor air quality in air-
conditioned workplaces. Indoor and Built Environment, Vol. 20 (3), 313 – 320.
K. Zhao, X. Zhou, B. Zhou (2010). Indoor Air Quality of University Cafeteria. Building Simulation,
vol. 3, No. 1, 15 - 23.
M. Frontczak, P. Wargocki (2011). Literature review on how different factors influence human comfort
in indoor environments. Journal of Building and Environment, Vol. 46, 922 – 937.
M.J. Travers and L. Vogl (2015). Indoor Air Quality Monitoring Study, Department of Health
Behavior and Aerosol Pollution Exposure Research Laboratory (APERL).
N.A.M.N. Rawi, J. Jalaludin, and P.C. Chua (2014). Indoor Air Quality and Respiratory Health
among Malay Preschool Children in Selangor, Department of Environmental and Occupational
Health, Faculty of Medicine and Health Sciences, Universiti Putra Malaysia.
A Field Study of Indoor Air Quality in a Tropical Refectory
25
N.E. Klepeis, W.C. Nelson, W.R. Ott, J.P. Robinson, A.M. Tsang, P. Switzer, J.V. Behar, S.C. Hern,
W.H. Engelmann (2001). The National Human Activity Pattern Survey (NHAPS): A resource for
assessing exposure to environmental pollutants. Journal of Exposure Analysis and Environmental
Epidemiology, 11(3), 231-252. - Report Number: LBNL-47713.
N.H. Wong, J. Song, A.D., Istiadji (2006). A study of the effectiveness of mechanical ventilation
systems of a hawker center in Singapore using CFD simulations. Building and Environment, Vol.
41 (6), 726 – 733.
N.Z.M. Sofian and M. Ismail (2012). Indoor and outdoor relationships of respirable suspended
particulate matter at primary schools in Kuala Terengganu, Malaysia. Indoor and Built
Environment, Vol. 21 (3), 423 – 431.
Q.J. Kwong, N.M. Adam, T. Cionita, V.R. Raghavan and M.F.A. Malek (2014). Indoor air quality
assessment in a radiantly cooled tropical building: A case study. Iranian Journal of Public Health,
Vol. 43 (3), 89 – 93.
R. Kosonen and F. Tan (2004). The effect of perceived indoor indoor air quality on productivity loss.
Energy and Buildings, Vol. 36, 981 – 986.
S.C. Lee, W. Li, L.Y. Chan (2001). Indoor air quality at restaurants with different styles of cooking in
metropolitan Hong Kong. The Science of the Total Environment, Vol. 279, 181 – 193.
S.C. Sekhar and H.C. Willem (2004). Impact of airflow profile on indoor air quality—a tropical study.
Journal of Building and Environment, Vol. 39, 255 – 266.
S.C. Sofuoglu, M. Toprak, F. Inal and A.H, Cimrin (2015). Indoor air quality in a restaurant kitchen
using margarine for deep-frying. Environmental Science and Pollution Research, Vol. 22 (20),
15703 – 15711.
S. Kumar and W.J. Fisk (2002). IEQ and the impact on building occupants. ASHRAE Journal, July 2002
Issue, 50 – 52.
S.N. Kamaruzzaman, N.A. Sabrini. (2011). The effect of indoor air quality (IAQ) towards occupants'
pscyhological performance in office buildings. Journal Design + Built, Vol. 4(1), 49-61.
T. Karimipanah, H.B. Awbi, M. Sandberg and C. Blomqvist (2007). Investigation of air quality, comfort
parameters and effectiveness for two floor-level air supply systems in classrooms. Journal of
Building and Environment, Vol. 42, 647 – 655.
W. N. Nazaroff (2013). Exploring the Consequences of Climate Change for Indoor Air Quality.
Environment Residential, vol. 1(20), 25-36.
Built Environment Journal
REDEFINING URBAN ASSESSMENT CRITERIA TOWARDS SUFFICIENT FUTURE CITIES
Rostam Yamana*, Suwattana Thadanitia, Hamimah Adnanb & Noraini Ahmadc
a*Chulalongkorn University, Thailand
Email: [email protected] bUniversiti Teknologi MARA, Malaysia
cInternational Islamic University Malaysia
ABSTRACT
Urbanized areas are typically the most significant sources of environmental degradation, thus,
an urban assessment criteria tools aiming at sufficient/self-sustain of the natural environment
needs to be firmly embedded in benchmarking planning and design framework. The theoretical
model of Sufficient Future Cities (SFC) criteria framework of both qualitative and quantitative
evaluation and benchmarking will be develop toward urban sufficient/self-sustain. The SFC
sets out a vision for sustainability within the built environment and provides guidance to deliver
sustainable townships through six primary dimensions of environmental design and planning.
The SFC framework runs on four primary methodology process and sequence in order to
optimize urban sufficiency and self-sustaining criteria. Even though the SFC framework is one
of the many methods in which to evaluate and benchmark tools to be developed for a
comprehensive sustainable township, the principal argument is that comprehensive
sufficient/self-sustain is certainly possible if it is properly conceived and implemented through
responsible urban design and planning developments.
Keywords: sufficient, urban assessment criteria, cities.
INTRODUCTION
The world is experiencing the largest wave of urban growth in history and this process is mainly a
domain of developing countries. With approximately 3.4 billion people (in 2009), more than 50 percent
of the world population living in cities and both human activities and the use of energy also concentrated
in cities, the urban areas have become the root cause of orientating societies toward mass production,
mass consumption and mass dumping of waste (Yantovski and Gorski, 2010). The mainstream of
sustainable development was progressively developed through the World Conservation Strategy (1980),
the Brundtland Report (1987), and the United Nations Conference on Environment and Development in
Rio (1992). The aim of the World Conservation Strategy is to help advance the achievement of
sustainable development through the conservation of living resources and provide policy guidance on
how sustainable development can be carried out (IUCN, 1980) The concept of ‘Sustainable Townships’
are liveable places that meet the diverse needs of the community, both now and in the future (GBI
Malaysia, 2010; McGregor & Roberts, 2010).
The need for integral systematic rating systems is recognized in order to evaluate the performance of
Green Township and promote the regenerative development. However, the current available assessment
framework is based on low carbon city (LCC) and low carbon society (LCS), the future of green
township development should beyond LCC + LCS; and toward zero carbon and regenerative city. The
idea of sufficient and sustainable modelled on ‘bio-mimicry’ regeneration system is way to the future.
In recent years there has been a proliferation of urban regeneration initiatives focused on the health and
Redefining Urban Assessment Criteria Towards Sufficient Future Cities
27
well-being of urban citizens and the urban fabric – the ‘inner-urban environment’ (Girardet, 2010).
While major sources of environmental degradation, deterioration, and depletion on Earth are irrefutably
embedded in urban areas there appears to be an unjustifiable absence of research and development
aiming for the comprehensive sufficient / self-sustaining criteria of assessment framework through
improved urban planning, management and development.
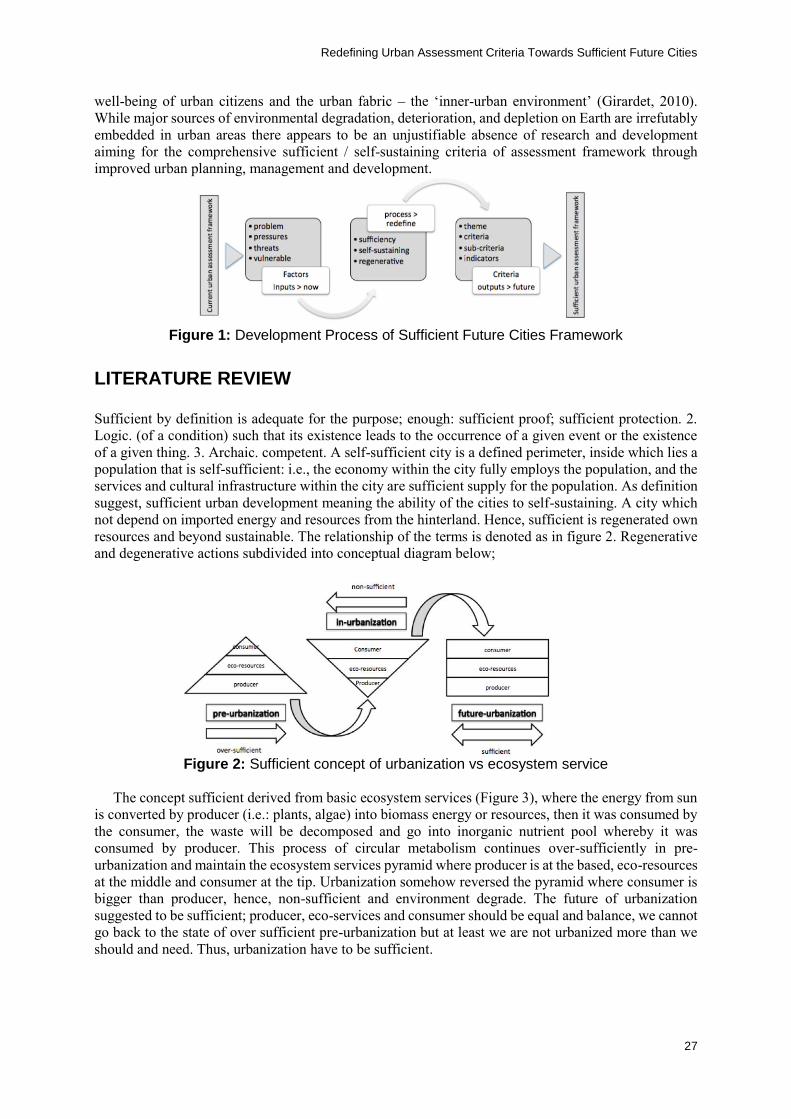
Figure 1: Development Process of Sufficient Future Cities Framework
LITERATURE REVIEW Sufficient by definition is adequate for the purpose; enough: sufficient proof; sufficient protection. 2.
Logic. (of a condition) such that its existence leads to the occurrence of a given event or the existence
of a given thing. 3. Archaic. competent. A self-sufficient city is a defined perimeter, inside which lies a
population that is self-sufficient: i.e., the economy within the city fully employs the population, and the
services and cultural infrastructure within the city are sufficient supply for the population. As definition
suggest, sufficient urban development meaning the ability of the cities to self-sustaining. A city which
not depend on imported energy and resources from the hinterland. Hence, sufficient is regenerated own
resources and beyond sustainable. The relationship of the terms is denoted as in figure 2. Regenerative
and degenerative actions subdivided into conceptual diagram below;
Figure 2: Sufficient concept of urbanization vs ecosystem service
The concept sufficient derived from basic ecosystem services (Figure 3), where the energy from sun
is converted by producer (i.e.: plants, algae) into biomass energy or resources, then it was consumed by
the consumer, the waste will be decomposed and go into inorganic nutrient pool whereby it was
consumed by producer. This process of circular metabolism continues over-sufficiently in pre-
urbanization and maintain the ecosystem services pyramid where producer is at the based, eco-resources
at the middle and consumer at the tip. Urbanization somehow reversed the pyramid where consumer is
bigger than producer, hence, non-sufficient and environment degrade. The future of urbanization
suggested to be sufficient; producer, eco-services and consumer should be equal and balance, we cannot
go back to the state of over sufficient pre-urbanization but at least we are not urbanized more than we
should and need. Thus, urbanization have to be sufficient.

Built Environment Journal
28
Figure 3: Basic Ecosystem Services
The city development scenarios and challenges today is no longer just to create sustainable cities but
truly regenerative cities: to assure that they do not just become resource-efficient and low carbon
emitting, but that they positively enhance rather than undermine the ecosystem services they receive
from beyond their boundaries. A wide range of technical and management solutions towards this end
are already available, but so far implementation has been too slow and too little (Girardet, 2010). The
current approach of how city works is very much linear in operation. This linear, open loop approach is
entirely unsustainable. In an urbanizing world aiming for long-term viability it cannot continue. The
environmental externalities of urban resources use can no longer be ignored. Unless we learn from nature
how to create circular systems, an urbanizing world will continue to be an agent of global environmental
decline.
Bio mimicry or emulating nature is how to moved forward. Bio mimicry is an approach to innovation
that seeks sustainable solutions to human challenges by emulating nature’s time-tested patterns and
strategies (Benyus, 2002). Similar to nature’s organisms, cities as ‘eco-technical super-organisms’ have
a definable metabolism – the trans- formation of resources into vital functions (Girardet, 2008). Nature
essentially has a circular zero-waste metabolism: every output by an organism is also an input, which
replenishes and sustains the whole living environment. In contrast, the metabolism of many modern
cities is essentially linear, with resources flowing through the urban system without much concern about
their origin, and about the destination of wastes. Inputs and outputs are considered as largely unrelated.
One of the primary tasks at the start of the 21st century is to try and map out what is necessary to
create a sustainable city that emulate nature. The challenge is to find ways of making cities function
differently from the way they do today without increasing the costs to financially challenged city
administrations. The new task facing of city planners, engineers and managers, in close cooperation with
the general public, is to create spatial structures that satisfy the needs of city people whilst also assuring
their ecological and economic resilience (Girardet, 2004). Efforts consolidated need to provide secure
habitats that allow people to move about in the cities efficiently, and the need to provide pleasant spaces
for work, recreation and human interaction. What needed are urban environments that are free from
pollution and waste accumulation. But also at the same time need to get to grips with the impacts of
cities beyond their boundaries especially the medium that makes cities operable and functions. Cities
should be seen as the places where solutions to the world’s environmental and climate problems can
most easily be implemented because as places where most people live closely together they have the
potential to make efficient use of resources. It is also in cities where people interact most strongly and
where key decisions, and particularly financial decisions, are being made all the time. This is where the
concept of regeneration and urban forestry or an ‘Eco-polis’; the ecologically as well as an economically
restorative city (Downton, 2009).

Redefining Urban Assessment Criteria Towards Sufficient Future Cities
29
The framework in determining the positions of green, sustainability and regenerative related to key
terminology of below displayed. It is written in a simplified, clarified and depoliticized manners as three
main listed terms;
i. ‘degenerative’: to decline in value or worth
ii. ‘sustainable’:3 to maintain; to keep from failing
iii. ‘regenerative’: to give new life, strength, or vigour
The tier-relationship of the terms is denoted as in figure below (Figure 4). Regenerative and
degenerative actions subdivided into twofold spheres of activity on a gradient measure, with the point
of neutral set at in between spheres where lies the concept of sustainability. Other used terms that are
assigned with clear, simple definitions are: ‘living’: alive; having animation and vitality; not dead; and
‘environments’: surroundings or places.
Figure 4: Degenerative and regenerative spheres. Source: Jossette, 2012.
The term living environments was used to avert the distinction concerning human centred, dominated
environments and ‘nature’. It is likely to be counterproductive to segregate humans and man-made
developments isolated from nature. All dwelling environments comprise all or any kind of places. Be it
a project of a one particular building, a path system in any national park, a swamplands restoration or a
regional urbanization, it would all be life-supporting schemes (Reed, 2007 and Benyus,1997).
The conception of inter-twining sequential between green, sustainable and regenerative methods and
viable transition from existing comprehension is the overall ideation of regenerative development. There
are varies definitions of the term ‘sustainability’ used today, but the most conveyed concept is of where
humankind is co-exist within the carrying capacity of the planet Earth (Gibberd, 2003). By virtue,
therefore, the key notions in sustainability discussion will contain the ever-going relationship of
mankind and nature systems. Sustainability by concept underpins; that people are integral parts of
ecosystems and that a dynamic interaction exists between them and other parts of ecosystems, with the
changing human condition driving, both directly and indirectly, changes in ecosystems and thereby
causing changes in human well-being (Millennium Ecosystem Assessment, 2005).
The significance in assuring the condition and integrity of nature eco-systems and the adverse impact
cause by human act on it is very vital. The main issues in notioning regenerative framework is as listed
below;
Within the regenerative literature, ‘sustainability’ is often presented as an intermediate
stage between green and regenerative – a ‘neutral’ state that, once attained, provides the
necessary base condition that permits regenerative capabilities to evolve (McDonough
and Braungart, 2002; Pedersen Zari and Jenkin, 2008).

Built Environment Journal
30
Figure 5: Living systems model of community development. Source: Larrick (1997)
Few frameworks were surfaced in an attempting to grasp the fundamental factors or citeria of
regenerative conception. One of the earliest graphic on regenerative conception is by Larrick (1997), it
offers a degenerative and regenerative processes and actions and their consequence for human and
natural systems (Figure 5). Larrick statuses pre-eminence of ecosphere as the ‘basis source of all
benefits, thus of entire wealth’ conclude that, the superseding goal of an ecological society must be to
maintain the critical order of the natural world.
Larrick line-up of key significance criteria of regenerative concept in his model are:
The right and left halves of the framework represent the human and ecological domains
respectively that must be brought into harmonious coexistence (Larrick, 1997).
The lower and upper halves represent degenerative and regenerative actions and
consequences. The degenerative consequences of consuming or polluting at rates greater
than productive and assimilative capability speed up entropy. By contrast, the shift that
both human and non-human life has made toward more complex and integrated levels of
existence is premised on ‘using unique regenerative powers to resist entropy’ (Larrick,
1997).
Larrick’s model framework also suggests a basis to begin in defining regenerative conception, to
clarify and position the green, sustainable and regenerative conceptual approaches (Jossete et al, 2012):
Regerate - upper half circle of the ecosphere embraces the sustainable state, with an
apparent recognition of the roles of ecological and social regeneration as necessary
attributes, along with their harmonious co-evolution, required to attain it. Here, continual
evolution through regeneration is presented as a primary requirement of sustainability.
Degenerate - lower half characterizes an unsustainable state, where human activity has
initiated degradation of natural systems. Provided Larrick’s model conviction regarding
the dependence of human ‘wealth’ on the ‘critical order of the natural world,’ both
increasingly degenerate.

Redefining Urban Assessment Criteria Towards Sufficient Future Cities
31
Green township planning and design is a compulsory consideration in reducing this degeneration. As
therefore, it’s practical to imply that both ‘green’, as presently delineated, and regenerative planning and
development discourses are essentials to support the moulding of future cities concept. The outlining of
the discussion of urban design as indivisible from sense of locale: place, conveys the insinuation that it
is equally important, proviso not more than, to comprehend how development design, construction and
purpose positively impact the social, environment and economic wellbeing of the context setting where
it exist within it.
Within that context, this research is motivated by several driving questions:
i. At the largest outset, how can the sufficient future cities assessment framework be
successfully developed and incrementally implemented?
ii. If such guiding sufficient framework is not aimed for, is it likely to ever arrive on its own?
iii. What are most significant urban framework assessment criteria on the environment?
iv. How can these criteria be implemented through urban redevelopment?
At this juncture, the necessities of sufficient assessment framework have to be brought to the
forefront of contemporary academic as well as professional research and development. Overarching
argument of this inquiry is that sufficient framework is not only theoretically possible but also practically
feasible if it is responsibly planned and designed for. This research seeks to develop an economically,
socially and environmentally balance and responsive approach to Green Township Indexing Criteria,
i.e. Sufficient Future Cities (SFC) framework, by which the principles and strategies of assessing and
benchmarking are positioned to facilitate sufficiency and self-sustaining criteria through incremental
improvements in green urban indexing. The SFC methodology is conceived to address a critical yet
currently non-inclusive aspect of Green Township Indexing Criteria, that is, an exclusive focus on the
sufficiency and self-sustaining criteria through urban growth and redevelopment. While the SFC
framework (Figure 6) is not the only possible venue to implement broad based and widespread
sufficient/self-sustain criteria it does form a foundation not only for other urban research and
developments to follow but also for countless other regenerative efforts to transform the current urban
realities.
This research is to redefined and develop an urban framework based on sufficient/self-sustain
criteria, which is intended to stimulate public policy as well as private implementation toward urban
regenerative at varying scales of community development and urban redevelopment. The sufficient
principles and strategies that shape the Sufficient Assessment Framework hold great potentials to
provide feedback in public and private processes of policy- and decision making based on scientific
analyses. Perhaps more importantly, these principles and strategies aim to incrementally bring
neighbourhoods-scale redevelopments that will culminate in large-scale transformations of urbanized
areas. The alternative – lack of regenerative action – is certain to lead to the future consequences of
current development patterns, which do not aim at recovery or rehabilitation of natural balances within
the living biosphere of the Earth.
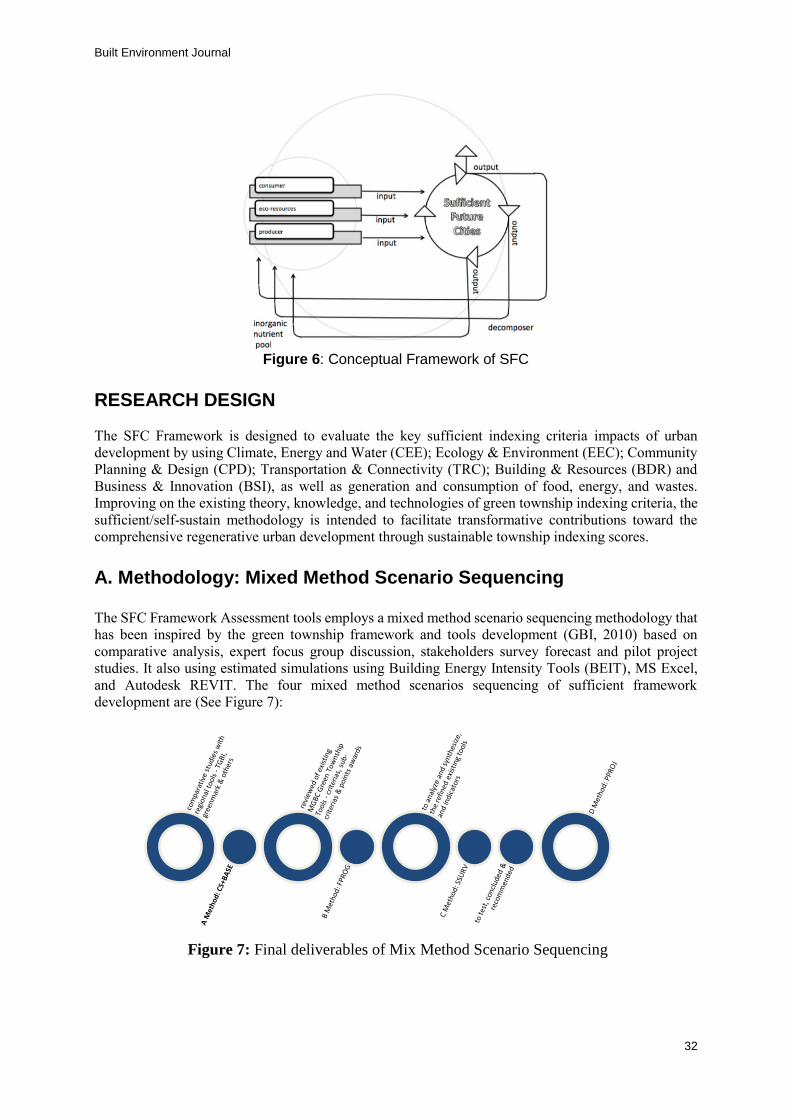
Built Environment Journal
32
Figure 6: Conceptual Framework of SFC
RESEARCH DESIGN
The SFC Framework is designed to evaluate the key sufficient indexing criteria impacts of urban
development by using Climate, Energy and Water (CEE); Ecology & Environment (EEC); Community
Planning & Design (CPD); Transportation & Connectivity (TRC); Building & Resources (BDR) and
Business & Innovation (BSI), as well as generation and consumption of food, energy, and wastes.
Improving on the existing theory, knowledge, and technologies of green township indexing criteria, the
sufficient/self-sustain methodology is intended to facilitate transformative contributions toward the
comprehensive regenerative urban development through sustainable township indexing scores.
A. Methodology: Mixed Method Scenario Sequencing The SFC Framework Assessment tools employs a mixed method scenario sequencing methodology that
has been inspired by the green township framework and tools development (GBI, 2010) based on
comparative analysis, expert focus group discussion, stakeholders survey forecast and pilot project
studies. It also using estimated simulations using Building Energy Intensity Tools (BEIT), MS Excel,
and Autodesk REVIT. The four mixed method scenarios sequencing of sufficient framework
development are (See Figure 7):
Figure 7: Final deliverables of Mix Method Scenario Sequencing

Redefining Urban Assessment Criteria Towards Sufficient Future Cities
33
B. Data Analyses Consistent through all six dimensions, the analyses start with comparative analyses in determining of
criteria for CC+S Baseline (CS+Base) and beyond on all indicators (See Figure 5). This data set
represents the baseline criteria, which can be either available criteria researched and compared to exist
before or ideal or presumed conditions that are preferable (beyond CC+S or redefined sufficient). The
indicators, which are simply not be applicable within a particular study area, may be either left out or
assumed to be within normal range for analysis purposes. Second step is the collection of previous and
present data representing the green township scoring impacts for the same set of indicators (See Figure
6). For the required and redefined criteria in Expert Focus Group Discussion Progression (FProg)
method at least two reference states of criteria are needed, the baseline criteria and the beyond. These
reference states are flexible, however, they are expected to represent the refinement and sufficient shift
from recent available tools conditions and suggest regenerative principles and values. At this stage the
SFC Framework Tools development is preliminary draft.
And, upon, as for the present stage, the preliminary draft will be available for end users and
stakeholders perceptional appraisal and comments. Targeted qualified green township industry
stakeholders are the policy maker (public authority), building professionals and other similar
professionals involved in an urban development projects. When there are gaps in the available data
appropriate statistical methods can be applied to interpolate the lacking data. The Stakeholders Survey
(SSurv) method is estimated by non-regression analyses based on the data from stakeholder
perceptional survey conditions (See Figure 5). The calculated values from these analyses provide a
valuable input on applicability and workability of preliminary draft tools that are used for the purposes
of evaluating results and optimizing sustainable township indexing scores. The Pilot Project Projection
(PProj) method is to appraised the workability, to test and commissioned the redefined Green Township
Indexing Criteria based on Sufficient Future Cities Assessment Frameworks. The differences
sustainable township indexing scores between the existing tools and newly developed tools are targeted
for minimization and offsets. The sufficient criteria conditions are determined by the level of
minimization and offsets applied in this step, thus suggest for future recommendation.
C. Data Collection, Interpretation, and Application This research is conceived to rely almost entirely on secondary data and is not intended to collect or
generate new primary data in the form of traditional surveys or questionnaires. Generation of new data
is typically limited to data obtained from presumed conditions that are preferable (beyond CC+S or
redefined sufficient) of from the BEIT software calculations and reports in the modelling/simulation
process. The GBI Indexing data for the indicators analysed in the SFC Framework are typically supplied
by freely accessible, non-classified, online public sources. Some of the most popular ones include
Ministry of Science, Technology, & Innovation (MOSTI), Ministry of Natural Resources &
Environment (NRE), Department of Surveying & Mapping (JUPEM), Malaysian Institute of Planners
(MIP), Malaysian Green Building Confederations (MGBC), Singapore BCA Greenmark, Thailand
Green Building Institute (TGBI), Geo-Data.gov, data.gov, esri.com, and so forth. Depending on the
location of the study area, it is possible to run into breaks and gaps in the coverage of publicly available
data, in which case statistical estimations may be utilized.
In addition to the norms and standards reported in the published literature, the SFC Framework
development relies on secondary data for most of its data analyses. There is ample amount of public
green township indexing data electronically and digitally available to be used for comparative analyses
as long as the selected case studies fall within well-developed metropolitan areas. Majority of local
jurisdictions i.e. city, county, or regional governments and planning organizations offer the kinds of data
that SFC Framework requires. For most of the qualitative analyses in the SFC Framework, the need to
collect new data through onsite measurements, focus group discussions, surveys, and/or via
questionnaires. Open source secondary data such as online photographs, satellite imagery, and other

Built Environment Journal
34
geospatial visualization are adequate for most evaluations. Nevertheless, a moderate level of difficulty
in collecting, combining, and synthesizing appropriate parcel data for the entire study area is to be
anticipated.
D. Application of SFC Assessment Framework: A Pilot Study The application area of the SFC Assessment Framework can show significant and appraised the
workability of the developed tools. From a theoretical urban regenerative perspective, of course, the
more advanced assessment criteria the better outcomes will be for future urban development. The
breadth and depth of real-world applications are also highly likely to be clouded by various social,
cultural, economic, and political circumstances unique to each locality. The population, area,
development density or demographic composition of the study area can be anywhere within a wide
spectrum. While the actual size and locations of study areas are expected to be different typically there
are several research advantages to selecting a large neighbourhood or a small township within a
relatively well-developed metropolitan area. Studying these areas not only ensures the availability,
reliability, and generalizability of inputs and outputs but also contributes to the spread of knowledge,
experience, and expertise for sufficient/self-sustaining principles within urbanized development.
EXPECTED RESULTS AND DISCUSSIONS
The results of this research are expected to inform and improve the current assessment criteria in Green
Township Indexing Tools in Malaysia. Following are a few ways that the expected results provide
contributions to redefined Green Township Indexing Criteria.
A. Findings Data Analyses The expected result upon the completion of the research is to identify, compare and understand the
conception of sustainable township assessment framework for tropical climate region; to revise and
develop sufficient township assessment criterias for tropical climate region and to promote and introduce
the redefined (sufficient) Green Township Assessment Tools for future urban development in tropical
climate region. In the criteria dimension analyses of the SFC Assessment Framework, the normalized
or standardized scoring on each indicator is estimated for each parcel of the study sub-criteria under
both CC+S Baseline (LC+Base) and expert focus group discussion progression (FProg) methods
combined. During the consensus process, depending on the intensity level of scoring impacts in each
sub-criterion, each indicator receives a numerical assessment score ranging from minimum 1.0 to
maximum 8.0 where a score of 1.0 represents most basic applicable (closest deviation from baseline)
and a score of 8.0 represents most intensive sufficiency (furthest approximation to baseline). The
assessment criteria weight is determined by the standard weight factors assigned in the SFC Assessment
Framework for each criteria indicator of the sufficiency requirement and refinement. The sub-criteria of
assessment criteria and weighting determines the assessment scores for indexing classification.
B. Evaluation of Results One of the most critical parts of this research is to redefined the criteria and the evaluation of assessment
scores for each indicator via the CS+Base and FProg methods. Since the end goal of the SFC Assessment
Framework is to produce a single set of green township indexing criteria for future urban development
or redevelopments. The mutual consensus from these two methodologies are finalised and critically
evaluated in order to determine which aspects of the redefined criteria can be optimized so that expected
results from assessment score is optimum alas highly sufficient. All analysis is represented qualitatively
in visual representation. The results from all indicator categories are expected to remain within the

Redefining Urban Assessment Criteria Towards Sufficient Future Cities
35
sufficiency criteria spectrum, and to require a certain level of refinement in order to achieved high
sufficiency scoring impacts. At this juncture, the sufficiency measures – such as increased efficiency in
CEW, EEC, CPD, TRC, BRD and BSI – are introduced to mitigate the environmental impacts and
improved urban sustainability
C. Optimization of Benchmarking Criteria Assumptions The next important step in the process the optimization of benchmarking criteria assumptions and
appraise workability of the PProj methodology. The initial evaluation results from the previous step are
expected to be continually redefined until the most optimum sufficiency concept conditions – furthest
to the baseline conditions – are achieved. The strategies to be used in optimization of benchmarking
criteria assumptions can be found in a wide range of concepts that are in practice today, which focus on
sufficient and self-sustaining of natural ecologies within urban development. Strategies most relevant to
restoration can be found in Green Urbanism, Resilient Cities: EcoVillages, Eco-Cities, Living Buildings,
Neighbourhoods and Cities, Regenerative Design principles.
The ultimate goal of sufficient and regenerative urban developments may cover beyond efficiency in
climate energy and water such as aim for zero net carbon emissions – by maximising passive design
principles, minimising the impact of heat island effect, minimising energy consumption, adopting onsite
energy generation, utilising renewable energy technologies such as co-generation and micro-generation.
It also suggests water neutral – through the reduction of mains water consumption, rainwater harvesting
and greywater recycling. Sufficient urban development strives for environment and ecology
conservation; the natural cycles and balances within urban ecology would be to integrate number of
possible categories of plants and animals, which can naturally coexist within a well-balanced urban
community. Cycles of growth from birth to decay in such urban ecology also needs to be carefully
considered to approximate the natural cycles and balances as closely as possible. Environment and
ecology criteria highlight sensitive to the needs of the local ecology & biodiversity and aims to preserve
and enhance the ecological value of the natural environment. It assists in stabilising land – subsidence
by reducing the impact of flooding and erosion. Reduction of consumption; Reuse and recycling of local
resources; Green Infrastructure; Climatically appropriate passive technologies; Optimization of land
uses and redevelopment (interconnectedness and compactness); Protection and rehabilitation of open
space, farmland, grassland, and ecosystems; Expanding biodiversity, vegetation cover, wildlife species
and habitats; Ecosystem restoration and integration in open lands, grasslands, watersheds, bioswales,
wetlands; Minimization of non-renewable consumption; Reliance on local generation of renewable
energies; Management of resources and wastes; Diversified modes of transportation (walkability,
bicycle, streetcar, bus transit, light-rail, commuter, and heavy rail).
CONCLUSIONS
One of the key conclusions is expected to be the realization that sufficient assessment framework is not
only possible but also highly achievable if properly adapted, applied, designed and planned for. This
research is designed to heighten the future goals of ecologically responsive and environmentally
responsible urban development practices. Another expected outcome is the development of a viable
redefined green townships assessment tools for guiding and referencing environmentally sufficient
urban agenda. And finally, through pilot project studies the SFC Assessment Framework is tested,
commission and recommended for sufficiency significance and effectiveness. The sufficiency
considerations include such significant interventions as management of urban growth and expansion,
infusion of renewable materials and energy, expansion of open space and resource conservation policies
despite formidable limitations and constraints. Improving on the existing theory, knowledge, and
technologies of urban design and planning, the sufficient methodology is intended to make
transformative contributions toward the comprehensive regenerative urban co-existence with natural
environment, which aim to identify significant SFC Framework Criteria of Green Township, redefined
scoring impacts & definitions originated in core criteria & sub criteria, form a cluster criteria of
ecologically responsive and environmentally responsible urban development sustainable benchmark and
Built Environment Journal
36
build a green township assessment tools of sufficient redevelopment.
REFERENCES Benyus, M, J,. (2002). Biomimicry: Innovation Inspired by Nature. Harper Perennial, New York,
NY. ISBN-10: 0060533226 & ISBN-13: 978-0060533229
Chrisna du Plessis (2012) Towards a regenerative paradigm for the built environment, Building
Research & Information, 40:1, 7-22, DOI: 10.1080/09613218.2012.628548
Downton, F, P,. (2009). Ecopolis: Architecture and Cities for a Changing Climate. Springer
Science+Business Media B.V., with ISBN 978-1-4020-8495-9 springer.com
GBI Malaysia, “Buildings certificates criteria,” vol. 2010, no. 15. GBI Malaysia , Kuala Lumpur, 2010.
Girardet, H,. (2010). Regenarative Cities: World Future Council and HafenCity University Hamburg
(HCU) Commission on Cities and Climate Change Stiftung World Future Council Mexikoring
29, 22297 Hamburg, German, from: http://www.worldfuturecouncil.org.
ICLEI,. (2015). Low Carbon City. [online] http://www.iclei.org/our-activities/our-agendas/low-carbon-
city.html
IUCN, ‘Living Resource Conservation for Sustainable Development’, The World Conservation
Strategy, International Union for Conservation of Nature and Natural Resources (IUCN), United
Nations Environment Programme (UNEP), World Wildlife Fund (WWF), 1980.
Katie Williams (2012) Regenerative design as a force for change: thoughtful, optimistic and evolving
ideas, Building Research & Information, 40:3, 361-364, DOI: 10.1080/09613218.2012.662389
Kielbaso, J, J,. (2008). Management of Urban Forests in the United States. Springer. Ecology, Planning,
and Management of Urban Forests. 2008, pp. 240-258
Maibritt Pedersen Zari (2012) Ecosystem services analysis for the design of regenerative built
environments, Building Research & Information, 40:1, 54-64, DOI:
10.1080/09613218.2011.628547
Peter Clegg (2012) A practitioner's view of the ‘Regenerative Paradigm’, Building Research &
Information, 40:3, 365-368, DOI: 10.1080/09613218.2012.663557
Phaedra Svec , Robert Berkebile & Joel Ann Todd (2012) REGEN: toward a tool for regenerative
thinking, Building Research & Information, 40:1, 81-94, DOI: 10.1080/09613218.2012.629112
Raymond J. Cole (2012) Transitioning from green to regenerative design, Building Research &
Information, 40:1, 39-53, DOI: 10.1080/09613218.2011.610608
Raymond J. Cole (2012) Regenerative design and development: current theory and practice, Building
Research & Information, 40:1, 1-6, DOI: 10.1080/09613218.2012.617516
Raymond J. Cole , Peter Busby , Robin Guenther , Leah Briney , Aiste Blaviesciunaite & Tatiana
Alencar (2012) A regenerative design framework: setting new aspirations and initiating new
discussions, Building Research & Information, 40:1, 95-111, DOI:
10.1080/09613218.2011.616098
Evgeny Yantovski and Jan Gorski (2010). Zero Emissions Future City, Clean Energy Systems and
Experiences, Kei Eguchi (Ed.), ISBN: 978-953-307-147-3, InTech, Available from:
http://www.intechopen.com/books/clean-energy-systems-and-experiences/zero-emissions-
future-city
Built Environment Journal
APPRAISING THE NEED TO STUDY ON THE FORMAT OF BILLS OF QUANTITIES
Shamsulhadi Bandi1, Hamimah Adnan2 and Fadhlin Abdullah1
1Department of Quantity Surveying, Faculty of Built Environment, Universiti Teknologi
Malaysia, Johor Bahru 2Department of Quantity Surveying, Faculty of Architecture, Planning and Surveying,
Universiti Teknologi Mara (UiTM), Shah Alam
Corresponding author: [email protected]
ABSTRACT
There are concerns reported on various aspects of Bills of Quantities (BQ). This includes
concerns over the BQ format that helps to organise and convey critical information to parties
in construction. Although concerns over the BQ format are mentioned in various literature,
these however have been highlighted in fragment. Consequently, there is limited opportunity to
demonstrate its enormity, in justifying a study to be conducted. Therefore, by reviewing,
analysing and synthesising various issues concerning the uses of BQ, this paper seeks to
provide theoretical justification on whether a study to re-examine the BQ format is impending.
In adopting to the issues-driven-approach, two objectives were outlined: (1) to critically review
the literatures to identify the issues on the application of the BQ; and (2) to synthesise the
outcome of the review process to identify relevant research focus. The study which had
essentially employed an extensive literature review had synthesised three categories of issues
related to: (1) information; (2) format; and (3) working methods. It was found that issues
concerning BQ information have been mentioned more frequently in the synthesis. Following
the approach, it implies that concerns over BQ format is not considered impending. Rather, a
study to re-examine BQ information is much needed and may contribute by offering substantial
improvement to the uses of BQ.
Keywords: Bills of Quantities, Construction industry, Format, quantity surveying
INTRODUCTION The Bills of Quantities (BQ) itemise information collected from the process of measurement
and provides the descriptions, quantities and information of items required in a contract
(Kwakye, 1997). The BQ is unique to the Quantity Surveyor and could be used for many
purposes. Among its main purpose is to provide the necessary information to the construction
participants which according to Hughes (1978), Wilcox and Snape (1980) and Ashworth (2004)
imperative to arrive at the following: (1) obtaining competitive tender; (2) serving as a
contractual document; (3) uniform basis for tendering; (4) the basis for interim certificates and
valuing of variations; (5) assisting the contractor in organizing his works; (6) facilitating
financial control by the employer; (7) a basis for feedback of information for the contractor and
(8) a data source for the Quantity Surveyor’s future estimating. Hence, due to the purposes it
serves, the BQ should be regarded as an indispensable tool for the management of a construction
project and an important source of information in the process of construction.
In relation to the Malaysian construction industry, the BQ has been recognised as an
important component in the overall process of construction. This was largely caused by the
extensive domination of the traditional lump sum system of construction procurement

Appraising the Need to Study on the Format of Bills of Quantities
38
(Khairuddin, 2002, Khairuddin and Samer, 2014) which fundamentally placed the BQ as an
integral element in its process (Jaggar et al., 2001, Seeley, 1997). Data from the Construction
Industry Development Board (CIDB) shown in Table 1 indicates that the adoption of the
traditional lump sum system (TLS) of construction procurement has been consistently strong.
Hence, the data reaffirmed the representativeness of the BQ in the Malaysian construction
industry.
Table 1: The frequencies on the use of TLS as compared to other types of procurement (2012
– September 2016 - latest)
Procurement types Year/Percentage
2012 % 2013 % 2014 % 2015 % 2016* %
TLS 7450 94 7685 96 7692 96 7060 96 3793 97
Others 442 6 355 4 333 4 284 4 106 3
Total: 7892 100 8040 100 8025 100 7344 100 3899 100 Source: Adapted from CIDB Quarterly Statistical Bulletin (CIDB, 2014, CIDB, 2015, CIDB, 2016). *Data as at Sept. 2016.
In the context of the Malaysian construction industry, the BQ is generally used for the
purpose of tendering and contracting (Rosli et al., 2006, Rosli et al., 2008, Khairuddin et al.,
2016). Besides this general use, the BQ could also be used to serve the industry in a variety of
other purposes. According to Rosli et al. (2006), the use of the BQ could essentially be viewed
from the perspective of the contractors, clients and consultants. To the author, the BQ is used
to provide the parties with necessary information that enable them to manage the project
effectively and pivotal as the base for making an informed decision. The facts thus situate the
BQ as important and indispensable component in the process of construction.
Despite, there have been concerns reported on various aspects of Bills of Quantities (BQ)
(Baccarini and Davis, 2002). This includes concerns over the BQ format that helps to organise
and convey critical information to parties in construction (Kodikara, 1990, Khairuddin, 2011,
Hamimah et al., 2011). Although concerns over the BQ format are mentioned in various
literature, these however have been highlighted in fragment. Consequently, there is limited
opportunity to demonstrate its enormity, in justifying a study to be conducted. Therefore, by
reviewing, analysing and synthesising various issues concerning the uses of BQ, this paper aims
to provide theoretical justification on whether a study to re-examine the BQ format is
impending. Accordingly, two objectives were outlined: (1) to critically review the literatures to
identify the issues on the application of the BQ; and (2) to synthesise the outcome of the review
process to identify relevant research focus. The fulfilment of the objectives outlined in this
paper has enabled substantial information to be gathered which allowed critical inferences to
be made as the basis to support or refute the need to re-examine the BQ format.
Accordingly, this paper is structured to firstly review the development of BQ formats. This
is followed by a review of issues that are affecting its uses. The paper ends by discussing
important insights gained from the study as well as some recommendations for the stakeholders
to consider.
METHODOLOGY This paper has essentially employed an extensive literature review and applied techniques
which are common in content analysis. According to Bowen (2009), the technique involves
skimming, reading and interpreting the documents which according to Bryman (2008),
necessary in searching-out underlying themes and omission in the materials being analysed. In

Built Environment Journal
39
this paper, relevant literatures were reviewed to identify the themes in the form of issues before
detail categorization is established to represent the aggregated information. The process was
considered crucial in identifying the omission or gaps in the existing literature and act as the
foundation which links the previous researches which were discrete in nature, into a single
interwoven framework for suggesting the research focus aimed in this paper.
DEVELOPMENT OF BQ FORMATS Prior to 1950s, the common form of BQ produced and used particularly in the UK has been in
the form of trade format. As interest in cost planning grew, the Elemental Bill was introduced
in which works are measured and organised into its functional elements. This bill however was
far from being satisfactory (Seeley and Winfield, 1999). At the time, there were no standard
elements to follow and different bodies had used different elements to produce the bill
(Kodikara et al., 1993, Rose, 1956, Nott, 1963). In addition, the format which sorted dimensions
under elements had resulted repetition of items across the billing elements. This had affected
sub-quotation enquiries (Turner, 1983, Kodikara et al., 1993, Lee et al., 2011) and making
pricing a time consuming process (Skinner, 1979).
Following the resentment, a Sectionalised Trades Bill was introduced in the 1960s (Nott,
1963). It aims to mediate the arrangement between the popular trade bill and the Elemental Bill.
The Sectionalised Trades Bills were basically trade BQ with each trades sectionalised into
elements (Kwakye, 1997). It retained its appeal as a trade BQ but at the same time, capable to
be re-collated as an Elemental Bill for subsequent use in construction management (Kodikara,
1990, Skinner, 1979, Kwakye, 1997). Although it had removed the objections raised against
the Elemental Bill, the industry implementation of this format had been reportedly poor
(Kodikara, 1990, Skinner, 1979). It was summed up by the Quantity Surveying Techniques
Working Party of the Cost Research Panel that neither bills appear to be amended to relate site
costs to bill prices (Kodikara, 1990, RICS, 1962). Hence efforts were stalled without significant
improvement to the BQ format.
Further development has coined for a new concept known as the Operational Bill (OB). It
moved from the traditional concept of measuring works as it fixed in place to new concept
which measured the labour and materials as a separate item in the bill (Skoyles, 1964, Skinner,
1979). In this regard, a scheme was divided in neither trades nor elements but in actual site
operations shown with the aid of the precedence diagram (Skinner, 1979, Seeley and Winfield,
1999, Kodikara, 1990, Kwakye, 1997, Skoyles, 1964). In this concept, operation is defined as
the amount of work that can be produced by a gang of operatives at some definite stage in the
construction process without any interruptions (Skoyles, 1964, Kwakye, 1997, Seeley and
Winfield, 1999). These were sequentially arranged and formed the basis of which information
was structured in the bill (Skinner, 1979).
One of the major changes brought about by the OB was the separation between labour,
materials and factory made components (Skinner, 1979). To illustrate, information on plant
required was given together with the labour as a single description without quantities, while
materials were given in a unit which corresponded to the contractor’s purchasing units (Turner,
1983). These changes involved fundamental divergence from the rules of measurement
prescribed in the SMM (Seeley and Winfield, 1999, Turner, 1983). This however was
compensated with advantages posed to benefit the contracting organisations. The prime
advantage from the OB was its ability to give the contractor’s estimator as much information
for the purpose of estimating (Skoyles, 1964). This was considered innovative and responded
Appraising the Need to Study on the Format of Bills of Quantities
40
to the needs of the contracting organisations. It was also lauded to include wider application
apart from tendering which has been the BQ’s only function.
However, the concept behind OB had received fairly little use (Wood and Kenley, 2004,
Seeley and Winfield, 1999, Mohd Hisham and Azman, 2008) due to various issues. It was bulky
and costly to produce (Seeley and Winfield, 1999) and the operational arrangement had required
similar items to be repeated across the bill (Mohd Hisham and Azman, 2008). This seems to
repeat the issue with the Elemental Bill. In addition to this, substantial works was involved in
the preparation of drawings. It required conventional drawings to be prepared first before the
designer could prepare the operational drawings (Mohd Hisham and Azman, 2008, Kodikara,
1990). This requirement has forced the designers to pre-judge the contractor’s method of
working which was not in accordance with the actual method (Turner, 1983). This hampered
OB’s implementation in the industry hence reduced its popularity.
In response to the criticism towards OB, an Activity Bill (AB) was later introduced. AB was
an intermediary between OB and later the BQ in operational format (BQOF) (Lear, 1966). In
terms of preparation, AB was a mixed between the traditional bill and that of OB (Lear, 1966,
Skoyles, 1968b). Gradually, extensive works on AB has enabled BQOF to be introduced (Lear,
1966). In terms of measurement, items in BQOF were measured in accordance with the SMM.
Subsequently, these items were billed in sections that were related to the network diagram.
Therefore, the approach has retained the features of a traditional bill. This however had removed
the separation between labour and materials which was the main feature of OB (Lear, 1966).
Despite the changes, uptake was still reportedly poor (Skoyles and Fletcher, 1970). This implies
that the industry at the time was not fully prepared to adapt to the changes introduced (Turner,
1983). Hence, this stalled further improvement towards the BQ particularly in aspect related to
its format.
The period after BQOF saw efforts to improve the BQ were rather slowing. This was until
1983 when the British Property Federation (BPF) introduces a format called the BPF System
(British Property Federation, 1983). In the new format, BQ was replaced by the Schedule of
Activities (SOA) (Hodgetts, 1984, Kodikara, 1990, Seeley, 1997, Sierra, 1984). The SOA was
prepared by the contractor by specifying and pricing all activities within the total programme
(Kodikara, 1990). This was based on the idea that cost model is best represented by the
contractor’s work programme. It will align the documentation directly to how cost will be
incurred on site, thus becoming the basis for planning and control (Hodgetts, 1984, Jaggar et
al., 2001). Similar with other formats introduced, the BPF had received very little use (Ramus
et al., 2006). This was mainly caused by mind-set issues and some technical problems
(Kodikara, 1990). It was also considered too revolutionary to the existing practice in
construction (Jaggar et al., 2001).
The effort to develop BQ format later came with the introduction of the Builder’s Quantities
in 1985 (Kodikara, 1990). This was developed by Pasquire and McCaffer (1985) and aim to
suggest alternative to contract where BQ is not supplied as part of the tender document.
Together with this, a complete set of measurement guidelines has been prepared to guide on the
preparation of quantities. The format was similar to OB but with more advance features of
operations, taking-off and buying units (Kodikara, 1990). To justify the operability of this
format, field trials were conducted to gauge its performance in live setting. The result indicated
that it was well received for contract without BQ and not for contract where BQ is supplied.
Further records on this format were sparse, hence placing limit on the elaboration.

Built Environment Journal
41
Regardless of this scarcity, more generic Builder’s Quantities or better known as abridged
bill has been mentioned and popular in Australia (Odeyinka et al., 2009, Slattery, 1994, Davis
et al., 2009). This followed a drop in principal’s sponsored BQ (Davis and Baccarini, 2004,
Davis et al., 2009). Although an abridged bill is prepared without following any specific rules
(Davis et al., 2009), the inception of BQ in this format indicate a strong desire to simplify the
measurement process but at the same time, providing appropriate and sufficient information for
tendering purposes (Davis and Baccarini, 2004). In the turn of the 21st century, extensive focus
had shifted from proposing further alternative to the BQ to the idea for coordinated project
information.
ISSUES CONCERNING THE USES OF BQ IN THE CONSTRUCTION INDUSTRY
Twenty-nine issues impeding the uses of the BQ were identified from various sources of
literature as showed in Table 2. To facilitate interpretation, the distinct concepts that underlie
the issues were defined, accentuated and reincorporated back in the list of issues identified from
various sources of literature (Shamsulhadi and Fadhlin, 2014). In the process, the variables of
‘concept identified’, ‘concern identified’ and ‘categories of issues’ were featured to explicate
the identified issues. This process helps in disclosing the gist of the issues and provides a
preliminary appreciation on the category of issues embodied in the literature (Bryman, 2008).
The process consequently allows the general topography of the issues to be viewed and
highlight the pertinent concerns conveyed through the literature.
Following this, a thematic analysis is carried out by enumerating the frequency which certain
accentuated concepts have occurred (Bryman, 2008). This is to reveal the predilections that
have exaggerated certain number of concepts and disclosing any considerable weightage from
the concepts. To assist with the thematic analysis, a word cloud as showed in Figure 1 is used
to demonstrate the weight of the identified concepts. Accordingly, it shows that ‘information’,
‘format’ and ‘methods’ are the three most occurring concepts from the issues identified and
presumably are the three main concepts by which the issues can be categorised. In relation to
weightage, ‘information’ contain the most number of issues followed by ‘format’ and ‘methods’
respectively. The analysis implies that issues concerning ‘information’ pose a considerable
concern with the uses of the BQ, hence suggesting a focus for consideration.
Figure 1: The main concepts underlying the issues identified from the literature
To relate the main concepts identified in Figure 1 with the array of issues concerning the
BQ, the issues presented in Table 1 are restated to correspond with ‘information’, ‘format’ and

Appraising the Need to Study on the Format of Bills of Quantities
42
‘methods’. This is conducted within an interpretative context and aim to provide details that
can describe the categories developed from the thematic analysis (Hart, 1998, Booth et al.,
2012, Shamsulhadi and Fadhlin, 2014). The result from the process is presented in Figure 2. In
this respect, pertinent matters related to quantities/quantities location/quantity units, BQ
descriptions, material specifications, time, preliminaries and temporary works have described
the concern related to ‘information’. The weightage implores that ‘information’ related issues
have underlain much concern on the uses of the BQ. This in relation to two other categories
prompted from the analysis. The analysis and synthesis carried out provided an insight to
understand the issues hence denotes the theoretical framework on the issues impeding the uses
of the BQ.

Built Environment Journal
43
Table 2: The literature review outcome – issues impeding the uses of the BQ No. Issues identified from the literature review Authors Concept identified Concern identified Category of issues
1. BQ does not provide (*information) on the (time) and quantity schedule for the on-site delivery of materials required for the works.
Hamimah et al. (2011), Smith and Hoong (1985)
Time/duration Insufficient Issues related to information
2. BQ (*information) provide no assistance to anyone drawing up a pre tender
programme (*time).
Contributed (1964) Time/duration Insufficient Issues related to information
3. BQ (*information) only represent cost breakdown structure with no link to actual project schedule (*time).
Time/duration Insufficient Issues related to information
4. SMM based BQ (*information) unable to provide a useful basis for
contractor’s work programme (*time).
Jaggar et al. (2001), Smith and
Hoong (1985)
Time/duration Insufficient Issues related to information
5. Preliminaries bill and specification (*information) documents contain many
unnecessary (*insufficient/ inadequate) items as a result of direct copy and
'standardised' document.
Hamimah et al. (2011) Preliminaries/ specification Insufficient/ Inadequate Issues related to information
6. BQ quantities and descriptions (*information) do not accurately provide information on work sequence and contractor's methods of operation
(*working methods and planning).
Hamimah et al. (2011), Leon (1966)
Quantities/descriptions/ working methods
Inaccurate/wrong quantities/Inaccurate
description/ Insufficient
Issues related to information/ Issues related
to contractor’s work
planning
7. The specialist trades contractors consider that the tasks of planning (*time) could not be achieved by using the bills (*information).
Morledge and Kings (2006) Time/duration Insufficient Issues related to information
8. BQ (*information) is unnecessary for compiling (*format) sub-contractor’s
quotations and is inadequate for reviewing materials quotations from potential supplier as quality of materials (*specification) are not clearly stated.
Hamimah et al. (2011), Kinlay
(1984b)
Specification/Unsuitable
format
Inadequate/ Unsuitable Issues related to
information/format
9. (*Information) in BQ are uncoordinated, aggregation on similar materials
rather than operation (*format and working methods).
Kodikara et al. (1993) Unsuitable format Unsuitable Issues related to format
10. BQ (*format) is not in final forms for direct use by site personnel. Kodikara and McCaffer (1993), Kodikara et al. (1993)
Unsuitable format Unsuitable Issues related to format
11. BQ (*information) requires sub-processes as the information are not
presented in a standardised (*format).
Cornick and Osbon (1994) Unsuitable format Unsuitable Issues related to format
12. BQ fail to become a mechanism to determine construction processes
(*working methods). It does not consider input (*information) to the
construction process (*working methods) but only identifies the end result or
product of construction.
Holes (1990), Jaggar et al. (2001)
Working methods Insufficient Issues related to contractor’s work planning
13. BQ only present (*information) that have been processed and in final form (*format). Detail (*information) such as supporting details on quantities
measured, work location and types of operations (*working methods) the
contractors have to employ are of use by estimators should access is given.
Hamimah et al. (2011), Turner (1983), Wood and Kenley
(2004)
Inflexible format/Quantities location
Inflexible/ Insufficient Issues related to format
14. BQ (*information) had inadequacies for utilisation by contractors.
(*Quantities) Location of quantified information was not adequate for its
purpose.
Baccarini and Davis (2002),
Wood and Kenley (2004)
Quantities location Insufficient Issues related to information
Note: Bold lettering/italics are the accentuated concepts and are reincorporated back in the list of issues.
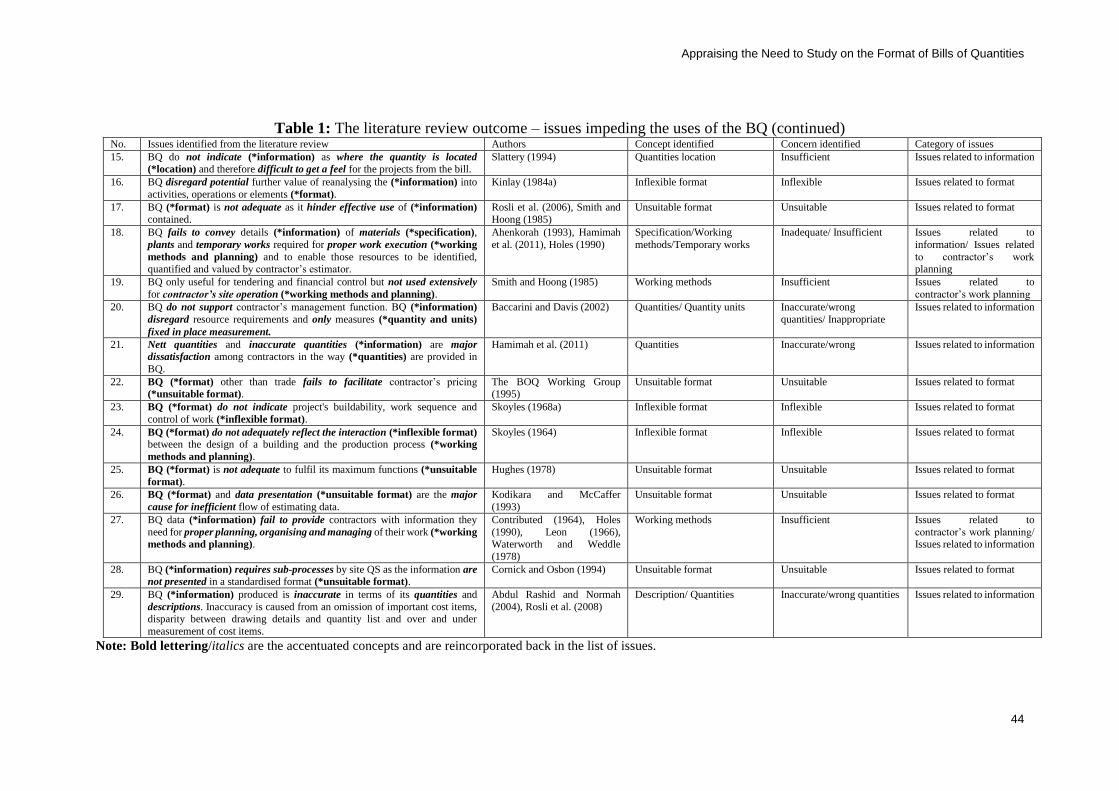
Appraising the Need to Study on the Format of Bills of Quantities
44
Table 1: The literature review outcome – issues impeding the uses of the BQ (continued) No. Issues identified from the literature review Authors Concept identified Concern identified Category of issues
15. BQ do not indicate (*information) as where the quantity is located
(*location) and therefore difficult to get a feel for the projects from the bill. Slattery (1994) Quantities location Insufficient Issues related to information
16. BQ disregard potential further value of reanalysing the (*information) into
activities, operations or elements (*format).
Kinlay (1984a) Inflexible format Inflexible Issues related to format
17. BQ (*format) is not adequate as it hinder effective use of (*information) contained.
Rosli et al. (2006), Smith and Hoong (1985)
Unsuitable format Unsuitable Issues related to format
18. BQ fails to convey details (*information) of materials (*specification),
plants and temporary works required for proper work execution (*working
methods and planning) and to enable those resources to be identified, quantified and valued by contractor’s estimator.
Ahenkorah (1993), Hamimah
et al. (2011), Holes (1990)
Specification/Working
methods/Temporary works
Inadequate/ Insufficient Issues related to
information/ Issues related
to contractor’s work planning
19. BQ only useful for tendering and financial control but not used extensively
for contractor’s site operation (*working methods and planning).
Smith and Hoong (1985) Working methods Insufficient Issues related to
contractor’s work planning
20. BQ do not support contractor’s management function. BQ (*information)
disregard resource requirements and only measures (*quantity and units)
fixed in place measurement.
Baccarini and Davis (2002) Quantities/ Quantity units Inaccurate/wrong
quantities/ Inappropriate
Issues related to information
21. Nett quantities and inaccurate quantities (*information) are major
dissatisfaction among contractors in the way (*quantities) are provided in
BQ.
Hamimah et al. (2011) Quantities Inaccurate/wrong Issues related to information
22. BQ (*format) other than trade fails to facilitate contractor’s pricing (*unsuitable format).
The BOQ Working Group (1995)
Unsuitable format Unsuitable Issues related to format
23. BQ (*format) do not indicate project's buildability, work sequence and
control of work (*inflexible format).
Skoyles (1968a) Inflexible format Inflexible Issues related to format
24. BQ (*format) do not adequately reflect the interaction (*inflexible format) between the design of a building and the production process (*working
methods and planning).
Skoyles (1964) Inflexible format Inflexible Issues related to format
25. BQ (*format) is not adequate to fulfil its maximum functions (*unsuitable
format).
Hughes (1978) Unsuitable format Unsuitable Issues related to format
26. BQ (*format) and data presentation (*unsuitable format) are the major
cause for inefficient flow of estimating data.
Kodikara and McCaffer
(1993)
Unsuitable format Unsuitable Issues related to format
27. BQ data (*information) fail to provide contractors with information they
need for proper planning, organising and managing of their work (*working
methods and planning).
Contributed (1964), Holes
(1990), Leon (1966), Waterworth and Weddle
(1978)
Working methods Insufficient Issues related to
contractor’s work planning/ Issues related to information
28. BQ (*information) requires sub-processes by site QS as the information are
not presented in a standardised format (*unsuitable format). Cornick and Osbon (1994) Unsuitable format Unsuitable Issues related to format
29. BQ (*information) produced is inaccurate in terms of its quantities and
descriptions. Inaccuracy is caused from an omission of important cost items, disparity between drawing details and quantity list and over and under
measurement of cost items.
Abdul Rashid and Normah
(2004), Rosli et al. (2008)
Description/ Quantities Inaccurate/wrong quantities Issues related to information
Note: Bold lettering/italics are the accentuated concepts and are reincorporated back in the list of issues.

Built Environment Journal
45
Figure 2: The theoretical framework on the issues impeding the uses of the BQ
IDENTIFYING THE FOCUS FOR A STUDY The issues identified have prompted several solutions to be proposed to improve the situation.
It has centred on suggesting various forms of new BQ format and has concentrated on this
aspect to improve its uses to the contracting organisations. Accordingly, the solutions identified
and discussed from the review are:
(1) Elemental Bill (Rose, 1956);
(2) Sectionalised Trades Bill (Nott, 1963);
(3) Operational Bill (Forbes and Skoyles, 1963, Skoyles, 1964);
(4) Bills of Quantities (Operational Format) (Skoyles, 1969, Skoyles, 1968a, Skoyles,
1968b);
(5) Activity Bill (Lear, 1966);
(6) BPF System (schedule of activities) (British Property Federation, 1983);
(7) Builder’s Quantities (Pasquire and McCaffer, 1985); and
(8) Abridged bill (Davis et al., 2009, Slattery, 1994).
Aspect on format has been the focus of past researches and was proposed to ameliorate
concerns over the uses of the BQ (RICS, 1965). It posed to restore confidence over its presence
in the construction industry (Mohd Hisham and Azman, 2008).
Apparently, it implies that the solutions had placed much focus in developing new BQ
formats. This despite the call made by the Quantity Surveying Techniques Working Party of
the Cost Research Panel to focus on improving the usefulness of the BQ data (RICS, 1962). To
add, further researches by Skoyles and Fletcher (1970), Turner (1983), Kodikara (1990); Jaggar
et al. (2001) and Ramus et al. (2006) have concluded that improving the BQ format seemed not
in the best interest of the industry. Within the context of this paper, the solutions proposed show
that only issues concerning the BQ format had been considered. This despite issues concerning
BQ information was mentioned more frequently in the literature. Besides, as there was too much
focus in developing new BQ format, little is known whether the information contain in BQ has
truly accorded with the requirements of its main user. For this reason, a study to re-examine
BQ information is considered timely. This refute the need to focus a study on BQ formats.
Hence, this complies with the evidence synthesised from the literature and stood as the gap for
current research concerning the BQ.
Appraising the Need to Study on the Format of Bills of Quantities
46
Following the gap identified from the past researches, pertinent questions need to be asked
which should centre on the contracting organisations which have been identified as the primary
user of the BQ. Accordingly, the questions that could be asked concerning the gap are as follow:
i. What are the uses of the BQ to the contracting organisations?
ii. What is the BQ information required by the contracting organisations to achieve the uses
of the BQ?
iii. What are the significant issues impeding the uses of the BQ to the contracting
organisations?
As the step to answer the questions which will ultimately lead to satisfy the focus, this paper
is suggesting the following approach:
i. To determine the uses of the BQ to the contracting organisations;
ii. To determine the important BQ information requirements for achieving the uses of the
BQ to the contracting organisations;
iii. To determine the significant issues impeding the uses of the BQ to the contracting
organisations.
By following the suggested approach, it is expected that the research could be able to gather
evidences which indicates the important BQ information requirements and the significant issues
to be considered for improving the uses of the BQ. Hence, the evidences collected could serve
as the basis to ameliorate improvements to the uses of the BQ and in line with the gap identified
from the synthesis carried out.
DISCUSSION ON THE CONTRIBUTION OF THE PROPOSED STUDY Narrowing the gap conceptualised in this paper will be of significant value in addressing the
current and the future needs of the industry. It will extend the current knowledge on the BQ by
placing the actual requirements of the contracting organisations as the focus for improvement
which imperative at re-extending the BQ usage to wider groups in a project. This effort is
considered timely given the lack of attention currently given to this aspect of research although
concerns were reported through the literature. This research is posed to contribute to the
contracting organisations in at least one of the following:
i. Determining the uses of the BQ;
ii. Determining the BQ information requirements; and
iii. Determining the impeding issues concerning the uses of the BQ.
Although been focused at the contracting organisations, the outcome of the research is also
expected to benefit other parties in a project; hence improving the current construction
environment which the industry is currently operates.
Besides focusing the gain to the current needs of the industry, the outcome of the research
could also be useful in relation to the development and advancement of the Building
Information Modelling or BIM. According to Azhar (2011); Lee et al. (2014), Porwal and
Hewage (2013), Succar et al. (2013) and Love et al. (2014), the BIM technology which is still
at its formative stage would require much research input before total deployment could be
achieved. Following the requirements, several attempts have been identified from the literatures
which aim at helping the technology to advance. The work of Taylor and Bailey (2011) for
instance, have stressed the need to establish a standard coding structure to streamline
construction processes in BIM environment while Jung and Joo (2011) have been
acknowledged in developing the BIM practical framework for deployment. Though works

Built Environment Journal
47
which revolve around the requirements are currently underway, its development is also found
to bear some challenges. According to Becerik-Gerber and Kensek (2010); Keat (2012) and
Monteiro and Martins (2013), in order to enable the BIM technology to advance, the industry
must first address the issues of interoperability and software integration while letting the
technology to evolve as it respond to user’s specific need. Although the outcome would be far
from addressing the major issues related to BIM deployment, yet this research is fundamental
and posed to contribute by providing input to the coding structure which was poised as the most
important aspect of its development. Accordingly, it is in this regard that the research proposed
in this paper would come in to contribute to advance the BIM technology for deployment. This
contribution however, is still small in comparison with the actual requirement of the technology.
Regardless, it is a fundamental attempt that will situate BQ related research with the need of
the BIM and hence, justifying its appropriateness with the current need of the construction
environment.
CONCLUSION
The identified research gap has been substantiated with rigorous synthesis of the past
researches. This is conducted to propose current research focus in the area concerning the BQ.
Following the analysis conducted to the works of past researchers, the incapacity of the BQ to
address the information need of its main user has been elevated as the primary concern and is
considered as the gap that need to be filled and focused. This is in addition to the identification
of issues impeding the uses of the BQ to the contracting organisations. It is proposed that a
research concerning the aspects outlined is imperious and currently in need. This is also in line
with the categories of issues synthesised from the literature. It is expected that the findings from
focusing to the aspect highlighted offers benefit, not only to the immediate need of the
construction industry, but also to the emerging concern over the BIM which is envisaged to
elevate the quantity surveying profession higher with the need of the current construction
environment.
ACKNOWLEDGEMENT The authors wish to thank Universiti Teknologi Malaysia (UTM) for the funding provided
under the Research University Grant Scheme (GUP: Q. J130000.2621.06J90).
REFERENCES
Abdul Rashid, A. A. & Normah, A. 2004. Outsourcing And Quality Performance: Malaysia’s Public
Works Department. Structural Survey, 22, 53–60.Https://Doi.Org/10.1108/02630800410530927
Ahenkorah, K. 1993. Exploring The Bills Of Quantities. The Building Economist, Dec., 23-25.
Ashworth, A. 2004. Cost Studies Of Building (4th Ed.), Essex, Pearson Prentice Hall.
Azhar, S. 2011. Building Information Modeling (Bim): Trends, Benefits, Risks, And Challenges For
The Aec Industry. Leadership And Management In Engineering, 11, 241-252.
Baccarini, D. & Davis, P. 2002. Bills Of Quantities - A Literature Review. The Building Economist,
Sept., 10-16.
Becerik-Gerber, B. & Kensek, K. 2010. Building Information Modeling In Architecture, Engineering,
And Construction: Emerging Research Directions And Trends. Journal Of Professional Issues In
Engineering Education & Practice, 136, 139-147.10.1061/(Asce)Ei.1943-5541.0000023
Booth, A., Papaioannou, D. & Sutton, A. 2012. Systematic Approaches To A Successful Literature
Review, London, Sage Publications Limited.

Appraising the Need to Study on the Format of Bills of Quantities
48
Bowen, G. A. 2009. Document Analysis As A Qualitative Research Method. Qualitative Research
Journal, 9, 27-40.
British Property Federation 1983. Manual Of The Bpf System. The British Property Federation System
For Building Design And Construction. British Property Federation.
Bryman, A. 2008. Social Research Methods - 3rd Ed., New York, Oxford University Press.
Cidb. 2014. Buletin Statistik Pembinaan Suku Tahunan - Suku Keempat 2014 (Sehingga Disember
2014). Available:
Http://Www.Cidb.Gov.My/Cidbv4/Images/Pdf/Buletin/2014/Bahagian%202%20q4.Pdf.
Cidb. 2015. Buletin Statistik Pembinaan Suku Tahunan - Suku Pertama 2015 (Sehingga Mac 2015).
Available:
Http://Www.Cidb.Gov.My/Cidbv4/Images/Pdf/Buletin/2015/Bahagian%202%20q1%202015.P
df.
Cidb. 2016. Cidb Construction Quarterly Statistical Bulletin - Third Quarter 2016 (January - September)
- Part 2. Available:
Http://Www.Cidb.Gov.My/Cidbv5/Images/Content/Bisnes/Buletin/2016/Bahagian-2.Pdf.
Contributed 1964. Operational Bills Of Quantities. The Quantity Surveyor, 21, 13-14.
Cornick, T. & Osbon, K. 1994. A Study Of The Contractor's Quantity Surveying Practice During The
Construction Process. Construction Management And Economics, 12, 107-
111.Https://Doi.Org/10.1080/01446199400000017
Davis, P. & Baccarini, D. The Use Of Bills Of Quantities In Construction Projects - An Australian
Survey. In: Ellis, R. & Bell, M., Eds. International Construction Research Conference Of The
Royal Institution Of Chartered Surveyors (Cobra 2004), 7-8 September 2004 2004 Leeds
Metropolitan University, Leeds. Rics Foundation.
Davis, P., Love, P. & Baccarini, D. 2009. Bills Of Quantities: Nemesis Or Nirvana. Structural Survey,
27, 99-108.Https://Doi.Org/10.1108/02630800910956434
Forbes, W. S. & Skoyles, E. 1963. The Operational Bill. The Chartered Surveyor, 95, 429-434.
Hamimah, A., Abdul Hadi, M. N., Siti Maimunah, M. A., Azizan, S. & Chong, H. Y. 2011. Bills Of
Quantities: Perspectives Of Contractors In Malaysia. Australian Journal Of Basic And Applied
Sciences, 5, 863-873.
Hart, C. 1998. Doing A Literature Review - Releasing The Social Science Research Imagination,
London, Sage Publications Limited.
Hodgetts, M. F. 1984. Tomorrow's Qs - Will There Be One? A Challenge For The Institute And Us All.
The Building Economist, 22, 397-399.
Holes, L. 1990. Finding An Alternative. Chartered Quantity Surveyors, 10-11.
Hughes, G. A. 1978. The Anatomy Of Quantity Surveying, Lancaster, England, The Construction Press
Ltd.
Jaggar, D., Ross, A., Love, P. E. D. & Smith, J. 2001. Overcoming Information Opacity In Construction:
A Commentary. Logistics Information Management, 14, 413 -
420.Https://Doi.Org/10.1108/Eum0000000006253
Jung, Y. & Joo, M. 2011. Building Information Modelling (Bim) Framework For Practical
Implementation. Automation In Construction, 20, 126-133.10.1016/J.Autcon.2010.09.010
Keat, Q. J. Identifying Areas Of Research Relevant To Quantity Surveyors For The Adoption Of
Building Information Modelling (Bim) - Balancing Between Priority And Impact Level. 16th
Pacific Association Of Quantity Surveyors Congress (Paqs 2012), 7-10 July 2012 Bandar Seri
Begawan Brunei. Persatuan Ukur Jurutera Dan Arkitek (Brunei) Puja (B).
Khairuddin, A. R. 2002. Construction Procurement In Malaysia - Processes And Systems, Constraints
And Strategies, Kuala Lumpur, Iium Press.
Khairuddin, A. R. In Need To Assess The Effectiveness Of Bills Of Quantities. 10th Management In
Construction Researchers (Micra) Conference (26 - 27 July 2011), 2011 International Islamic
University Malaysia, Kuala Lumpur, Malaysia.
Khairuddin, A. R. & Samer, S. K. Dominant Procurement Systems In Use In Malaysia. Management
In Construction Researcher Association (Micra) Postgraduate Conference 2014, 6th Nov. 2014
International Islamic University Malaysia (Iium). Kulliyyah Of Architecture And Environmental
Design (Kaed).
Built Environment Journal
49
Khairuddin, A. R., Sharina Farihah, H., Puteri Nur Farah Naadia, M. F., Srazali, A. & Azila, A. S. 2016.
A Review On The Application Of Bills Of Quantities (Bq) In Construction Project Procurement
Journal Of Scientific Research And Development, 3, 102-105.
Kinlay, G. 1984a. Bills Of Quantities - "Form Follows Function" Or Does It? The Building Economist,
23, 2-3.
Kinlay, G. 1984b. Bills Of Quantities - You Pay The Piper - Why Not Call The Tune! The Building
Economist, 23, 5-6.
Kodikara, G. W. 1990. Data Flow In Building Contractor Organizations. Phd Thesis, Loughborough
University Of Technology.
Kodikara, G. W. & Mccaffer, R. 1993. Flow Of Estimating Data In Sri Lankan Building Contractor
Organizations. Construction Management And Economics, 11, 341 -
346.Https://Doi.Org/10.1080/01446199300000038
Kodikara, G. W., Thorpe, A. & Mccaffer, R. 1993. The Use Of Bills Of Quantities In Building
Contractor Organizations. Construction Management And Economics, 11, 261-
269.Https://Doi.Org/10.1080/01446199300000038
Kwakye, A. A. 1997. Construction Project Administration In Practice, Essex, Addison Wesley
Longman Limited.
Lear, R. F. 1966. Notes On Activity Bills. The Quantity Surveyor, 23, 31-33.
Lee, S.-K., Kim, K.-R. & Yu, J.-H. 2014. Bim And Ontology-Based Approach For Building Cost
Estimation. Automation In Construction, 41, 96-105.
Lee, S., Trench, W. & Willis, A. 2011. Willis's Elements Of Quantity Surveying, Sussex, Wiley-
Blackwell.
Leon, G. 1966. Tendering Documents And Final Costs. The Quantity Surveyor, 23, 65-67.
Love, P., Matthews, J., Simpson, I., Hill, A. & Olatunji, O. 2014. A Benefit Realization Management
Building Information Modelling Framework For Asset Owners. Automation In Construction, 37,
1-10.
Mohd Hisham, A. & Azman, W. N. Bringing Back The Dead: Operationalizing The Bills Of Quantitites.
International Conference For Project Management (18-20 November 2008), 2008 Universiti
Malaya.
Monteiro, A. & Martins, J. P. 2013. A Survey On Modeling Guidelines For Quantity Take-Off Oriented
Bim Based Design. Automation In Construction, 35, 238-253.
Morledge, R. & Kings, S. Bills Of Quantities - A Time For Change? In: Torrance, J. V., Hamimah, A.
& Roshana, T., Eds. International Conference In The Built Environment In The 21st Century
(Icibe 2006), 2006 Mara University Of Technology, Shah Alam. 49-56.
Nott, C. M. 1963. Sectionalised Trades Bills. The Chartered Surveyor, 95, 595-602.
Odeyinka, H., Kelly, S. & Perera, S. An Evaluation Of The Budgetary Reliability Of Bills Of Quantities
In Building Procurement. Rics Foundation Construction And Building Research Conference
(Cobra 2009), 2009 University Of Cape Town 435-446.
Pasquire, C. L. & Mccaffer, R. 1985. Builder's Quantities And Their Use In Contracting Organisations.
Report To Science And Engineering Research Council, Department Of Civil Engineering. U.K:
Loughborough University Of Technology.
Porwal, A. & Hewage, K. N. 2013. Building Information Modelling (Bim) Partnering Framework For
Public Construction Projects. Automation In Construction, 31, 204-214.
Ramus, J., Birchall, S. & Griffiths, P. 2006. Contract Practice For Surveyors Oxford, Butterworth-
Heinemann.
Rics 1962. Working Party Report - The Function And Uses Of The Bill Of Quantities. The Chartered
Surveyor, Dec., 324-325.
Rics 1965. Working Party Report - Presentation And Format Of Bills Of Quantities. Royal Institution
Of Chartered Surveyors, 1965.
Rose, N. 1956. Billing By Elements. The Chartered Surveyor, 88, 605-607.
Rosli, A. R., Muzani, M. & Siti Nurhuda, A. W. Bills Of Quantities - Are They Still Useful And Relevant
Today? International Conference On Construction Industry (21 - 25 June 2006), 2006 Padang,
Indonesia.
Rosli, A. R., Muzani, M. & Siti Nurhuda, A. W. 2008. Bills Of Quantities - Are They Still Useful And
Relevant Today? The Building Economist, March, 16-23.
Appraising the Need to Study on the Format of Bills of Quantities
50
Seeley, I. H. 1997. Quantity Surveying Practice (2nd Ed.), London, Macmillan Press Ltd.
Seeley, I. H. & Winfield, R. 1999. Building Quantities Explained (5th Ed.), London, Macmillan And
Co. Ltd.
Shamsulhadi, B. & Fadhlin, A. The Procedures For Reviewing The Issues Concerning The Application
Of The Bq. Management In Construction Researcher Association (Micra) Postgraduate
Conference 2014, 6th Nov. 2014 International Islamic University Malaysia (Iium). Kulliyyah Of
Architecture And Environmental Design (Kaed).
Sierra, J. 1984. Bills Of Quantities -The Roots Of The Quantity Surveyor (Part 2). The Building
Economist, 23, 10.
Skinner, D. W. H. 1979. An Analysis Of The Utility Of Bills Of Quantities In The Process Of Building
Contracting. Ph.D Thesis, University Of Aston In Birmingham.
Skoyles, E. 1964. Introduction To Operational Bills. The Quantity Surveyor, 21, 27-32.
Skoyles, E. 1968a. Introducing Bills Of Quantities (Operational Format). The Quantity Surveyor, 24,
139-146.
Skoyles, E. 1968b. Introducing Bills Of Quantities (Operational Format). Brs Current Paper, Cp62/68.
Building Research Station.
Skoyles, E. 1969. Examples Bills Of Quantities (Operational Format). The Quantity Surveyor, 25, 151-
157.
Skoyles, E. & Fletcher, L. 1970. Bills Of Quantities Or The Operational Bill? The Architects Journal,
1970, 233-240.
Slattery, P. 1994. Bills Of Quantities - The Builder's View. The Building Economist, June, 13-14.
Smith, J. & Hoong, W. K. 1985. Bills Of Quantities In Singapore - A Survey Of Their Use And
Application. The Building Economist, 24, 18-22.
Succar, B., Sher, W. & Williams, A. 2013. An Integrated Approach To Bim Competency Assessment,
Acquisition And Application Automation In Construction, 35, 174-189.
Taylor, S. & Bailey, C. 2011. Unlocking Bim Data. Royal Institution Of Chartered Surveyors [Online].
Available:
Http://Questantinc.Com/Images/Articles%20and%20news%20media/Articles/Bim%20coding%
20paper%20dec%202%20final.Pdf [Accessed 15th May 2012].
The Boq Working Group 1995. Act (Australian Capital Territory) Bills Of Quantities Working Group -
Special Report. The Building Economist, Dec., 5-7.
Turner, D. 1983. Quantity Surveying - Practice And Administration (3rd Ed.), New York, George
Godwin.
Waterworth, H. W. & Weddle, A. E. 1978. Bills Of Quantities For Landscape Works. The Quantity
Surveyor, 35, 244-245.
Wilcox, C. & Snape, J. 1980. Measurement Of Construction Work (Second Edition), London, George
Godwin Limited.
Wood, B. & Kenley, R. 2004. The Effectiveness Of The Bills Of Quantities In Australia. Journal Of
Construction Research, 5, 291 - 309.Https://Doi.Org/10.1142/S160994510400019x
Built Environment Journal
ASSESSMENT OF SOLID WASTE MANAGEMENT (SWM)
PRACTICES IN PANGKOR ISLAND MALAYSIA
Kok Weng Tan*1, Huoy Huoy Ong1 & Nor Hanisah Mohd Hashim2
1Department of Environmental Engineering, Faculty of Engineering and Green Technology,
Universiti Tunku Abdul Rahman (UTAR), 31900 Kampar, Perak, Malaysia.
2Centre of Studies for Park and Amenity Management,
Faculty of Architecture, Planning and Surveying,
Universiti Teknologi MARA, 40450 Shah Alam, Selangor, Malaysia
Email: [email protected]
ABSTRACT
This study aimed to characterize recyclable and non-recyclable solid waste generation and
identify the impacts of solid waste to the Pangkor island ecology. Methods used in this study
were field investigation, opinion survey and domestic waste sampling. The data obtained from
field sampling was analyzed by using reliability test (0.753), descriptive test, ANOVA single
factor and Pearson Correlation Analysis. Through field investigation and sampling activity, the
waste generated in Pangkor Island was found to be 0.34 kg/capita/day which slightly lower
than Malaysian average waste generation of 1.3 kg/capita/day. Opinion survey and interview
which included 34 items were conducted to local community for understanding; awareness and
practice of local communities towards solid waste management (SWM). Result showed that
total 34.0 % of respondents chose dumped solid waste into ocean, river or land. Only 43.6 %
of respondents practiced recycling and composting in their own house. Result from Pearson
Correlation analysis shows that knowledge of local communities towards SWM does not
influence their attitude towards recycling (Pr > 0.05). Due to time restraints, language barrier,
lack of numerators and expert’s opinion, the study did not carry out the field sampling in Malay
and Indian communities in Pangkor Island which became major limitation for this study.
Keywords: Solid waste management (SWM), Municipal waste management (MWM),
sustainable development, Pangkor Island
INTRODUCTION Increases of population, rapid economy growth and urbanization have posed challenge to sustainable
solid waste management. In developing countries, the generation rate of solid waste has increased
dramatically (Minghua et al., 2009). Main waste management responsibility is dedicated to local
authorities in most developing countries which encounter issues pertaining to human and financial
resources constraints as well as identify suitable landfill for disposal (Sujauddin et al., 2008). Apart from
waste management, water resources pollution due to illegal solid waste disposal are often reported and
become major environmental problem.
There are some issues and challenges in managing waste in places such as islands in Malaysia and
Pangkor Island is one of the examples. Firstly, the dumpsites are poorly located on the island, combined
with uncontrolled scavenging and lack of rubbish bin in the island, it makes the issue worst. Inefficient

Assessment of Solid Waste Management (SWM) Practices in Pangkor Island Malaysia
52
waste collection and transportation are due to inadequate management and maintenance of equipment
where there also poses a problem in solid waste management (SWM). Lack of public awareness on solid
waste management issues leads to low waste separation and rarely practice of reduce, reuse and recycle
(3R) of the waste. Illegal burning and ocean dumping is common in Pangkor Island. Wastes generated
in the island are causing environmental pollution, safety hazards and aesthetic problems in the site. The
crucial part of the SWM is the high transportation cost and inadequate budget for the waste management
(Agamuthu and Nagendran, 2010).
Waste collection in Pangkor Island is contracted out to a private firm yearly. In term of disposal
methods, Pangkor Island depends on the location of landfill in the island. Landfill in Pangkor Island is
operating as mere open-dumps, which lack proper lining system and leachate treatment. At the open-
dumps, there is a layer of natural lining layer, which composed of clay as prevention for leachate leakage
to the water table buried beneath the landfill. Currently, no cell system is being practiced at the site and
no proper treatment or drainage is allocated for the leachate produced by the waste. Thus, landfill in
Pangkor Island has a waste-related aesthetic problem, leachate contamination, and landfill gas or odour
problems which are the concurrent problem in Malaysia. Obviously it shows that waste collection in
Pangkor Island is an ineffective disposal method. Hence, it gives negative impacts to the environment
consequently. Since there is a limitation on landfill disposal site in Pangkor Island, an alternative landfill
site is not available. Thus, the incinerator is used as the disposal method for the waste (Agamuthu and
Nagendran, 2010).
The municipal solid waste (MSW) is increasing daily and without any preventive action, substantial
negative environmental impacts such as air, soil and water pollutions will continue to occur and become
the major environmental challenge to Malaysia (Siti and Noraziah, 2014). To further elaborate on its
negative pressure to Malaysia, the existing of health and safety problem will skyrocket as the garbage
heaps attracted insects and rodents. Besides, the vector diseases associated with different forms of
pollution will grow exponentially. Meanwhile, landfill leachate will contaminate the groundwater and
adjacent water bodies, whereas the gases of the landfill; greenhouse gases (GHG) are released freely
into the atmosphere and contributing to climate change (Zeeda and Jaron, 2013). Thus, the efficiency of
the SWM in Pangkor Island becomes a major social and environmental concern (Suna Erses Yay, 2015).
Pangkor Island is located in the state of Perak and under the authority of Manjung Municipal Council
(MMC) (MMC, 2010). It is coordinated at 4.2200 oN, 100.5550 oE. It is surrounded by Dinding Straits
and Malacca Straits. Pangkor Island experiences a tropical climate and temperature ranges from 25 to
35oC. The size of Pangkor Island is 18 km2 while the population is approximately 20,000 people (MMC,
2010). Fishing, exportation of marine products and tourism are the major industries on the island (Pazim
and Rosli, 2011).
Definition of Solid Waste Management (SWM) A Waste Management Hierarchy (Figure 1) is introduced to minimize the amount of waste entering
landfill. In the Waste Management Hierarchy, the top three initiatives are 3R (Reduce, Reuse and
Recycle). It is vital to educate the public by organizing awareness program towards implementation of
the 3R. By implementing 3R, it can reduce human ecological footprint and improve waste management
system. Besides that, it also allows prevention of the loss of resources and reduces environmental
impacts from waste disposal; simultaneously lengthen the lifespan of landfills operation. 3R is a
successive process in developed countries compare with the developing countries (Jayashree et al.,
2012).
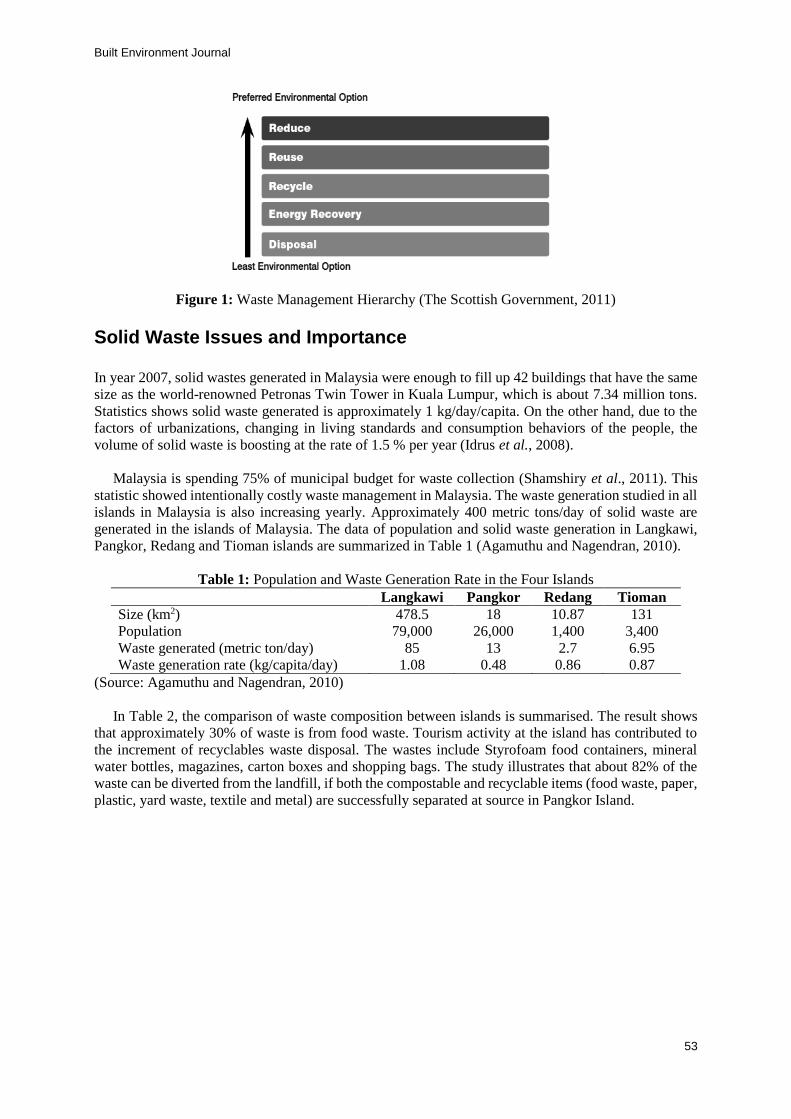
Built Environment Journal
53
Figure 1: Waste Management Hierarchy (The Scottish Government, 2011)
Solid Waste Issues and Importance
In year 2007, solid wastes generated in Malaysia were enough to fill up 42 buildings that have the same
size as the world-renowned Petronas Twin Tower in Kuala Lumpur, which is about 7.34 million tons.
Statistics shows solid waste generated is approximately 1 kg/day/capita. On the other hand, due to the
factors of urbanizations, changing in living standards and consumption behaviors of the people, the
volume of solid waste is boosting at the rate of 1.5 % per year (Idrus et al., 2008).
Malaysia is spending 75% of municipal budget for waste collection (Shamshiry et al., 2011). This
statistic showed intentionally costly waste management in Malaysia. The waste generation studied in all
islands in Malaysia is also increasing yearly. Approximately 400 metric tons/day of solid waste are
generated in the islands of Malaysia. The data of population and solid waste generation in Langkawi,
Pangkor, Redang and Tioman islands are summarized in Table 1 (Agamuthu and Nagendran, 2010).
Table 1: Population and Waste Generation Rate in the Four Islands
Langkawi Pangkor Redang Tioman
Size (km2) 478.5 18 10.87 131
Population 79,000 26,000 1,400 3,400
Waste generated (metric ton/day) 85 13 2.7 6.95
Waste generation rate (kg/capita/day) 1.08 0.48 0.86 0.87
(Source: Agamuthu and Nagendran, 2010)
In Table 2, the comparison of waste composition between islands is summarised. The result shows
that approximately 30% of waste is from food waste. Tourism activity at the island has contributed to
the increment of recyclables waste disposal. The wastes include Styrofoam food containers, mineral
water bottles, magazines, carton boxes and shopping bags. The study illustrates that about 82% of the
waste can be diverted from the landfill, if both the compostable and recyclable items (food waste, paper,
plastic, yard waste, textile and metal) are successfully separated at source in Pangkor Island.

Assessment of Solid Waste Management (SWM) Practices in Pangkor Island Malaysia
54
Table 2: Waste Composition in Malaysian Islands (% by weight)
Component Redang Pangkor Langkawi Tioman
Food waste 31.0 30.3 36.3 29.8
Paper 24.7 20.7 19.5 18.9
Plastic 13.1 15.1 15.1 13.9
Yard waste 11.8 10.8 8.4 14.1
Diapers 4.7 5.5 4.8 4.8
Glass 5.2 3.4 3.7 5.6
Wood 3.2 5.3 2.9 4.2
Rubber/Leather 2.4 2.8 3.6 3.4
Textile 2.3 2.6 3.2 3.4
Metal 1.0 2.2 1.8 1.0
Hazardous waste 0.1 0.2 0.1 0.2
Others 0.6 0.9 0.7 0.7
(Source: Agamuthu and Nagendran, 2010)
TECHNOLOGIES FOR WASTE DISPOSAL AND MANAGEMENT Different Types of disposal technologies are applied in Malaysia namely landfill, incineration,
composting and recycling.
Incineration Incineration provides a solution to deal with the problems of solid waste, especially in the country where
the land is limited and the rate of SWM is escalating speedily. In fact, incineration is reducing 90% of
the wastes volume and only the remaining ash will go to landfill. So, the life span of the landfill will be
extended. Besides, incineration could offer energy recovery and the income would offset the high
operation cost of incineration if the technology of zero to waste is available (Idrus et al., 2008).
Advantages of incineration are listed in the following, such as less emission during the waste transfer.
Meanwhile, decrease in the weight of waste effectively hinder the production of methane after it was
disposed to landfill. Since the production of ashes during incineration, majority of the components is an
inorganic material which, is in a stable form, where it can be recycled to make profit. Therefore,
incineration may be treated as a pre-treatment for landfill. Other than to reduce the waste amount, the
main objective of incineration is for the generation of renewable energy. Hence, the function of this
waste disposal method will become more attractive. If waste combustion is used sustainably, it is a vital
source of energy for energy recovery. Incineration is about introducing another option to burn fossil
fuels in an environmental friendly way from the perspective of energy. In a nutshell, incineration is
providing a great source of solid waste reduction in terms of volume and weights. It is expensive when
waste enters to the landfill, as it requires higher funds for construction of landfill. In addition, there is
the need of a principal to monitor and maintain the landfill in long term, once the landfill is established.
Next, due to the odour of the landfill, there is reduction of the land value of surrounding areas
(Shamshiry et. al., 2014).
However, there are some disadvantages from incineration; such as the incinerated ash contains high
level of heavy metals will have higher possibility of leaching rate. In term of energy recovery, not all
waste is adequate for incineration. Fuel supplement for combustion might need for waste with low
calorific value. With a high moisture and low organic content of combustible materials, waste
contributes to a lower calorific value, especially in developing countries. Thus, energy recovery is not
economical, since the incineration of wastes with lower calorific values is generally unable to self-
sustaining. Furthermore, for the countries which are facing technical constraints in controlling the
potential air pollution, the incineration technology is not appropriate to be implemented (Idrus et al.,
2008). For instant, the facilities of the “Waste to Energy” in the US had generated 81 mercury tons in
Built Environment Journal
55
1989. Besides, the emissions of incineration are significant, as it threatens human health, plants and the
surrounding environment. The emissions of GHG from incineration are CO2 and N2O which are major
contributors to climate change (Shamshiry et. al., 2014).
Composting Wilson (1981) expressed composting process happens when the organic portion of the waste undergoes
aerobic degradation and the product of this process can be only used as a soil conditioner. However,
Agamuthu (2001) holds the opposite view that compost is important for plant growth and development,
and can improve the soil texture as it is a nutrient rich substance. The advantages of using composting
as a treatment for solid waste can reduce the volume of solid waste significantly, particularly in those
countries where generation of organic waste and yard waste are in high volume. Yet, if high percentages
of non-compostable waste such as glass, metals, plastic, and rubber are consisted, separation needs to
be done before composting in order to produce an acceptable grade of compost and to avoid
contamination of compost with hidden toxic metals. In general, composting is hygienic, environmental
friendly and contains substances with only low toxicity. This technology has been available for many
years, however, around the world, there are only few composting plants which are successfully
economically (Idrus et al., 2008).
Recycling Recycling is reverting waste materials to productive system in terms of the usage in the manufacturing
of goods, through the perception of conservation which viable to scarce and non-renewable resources in
order to promote sustainable development as interpreted by Gilpin (2000). Some fundamental issues
faced by waste recycling such as recovery of the reusable and recyclable materials through separation
of waste materials. Besides, in the market, issues such as specification and identification of the recovered
materials are noted free from contamination and homogeneity (Idrus et al., 2008).
There are two principal benefits of recycling. First, the need for waste disposal capacity, emission
from landfills and incinerators and litter are cut down by recycling. Next, the energy use and emission
from industrial would decrease, simultaneously fewer raw materials are extracted or manufactured, and
raw materials are conserved through recycling. Moreover, recycling is providing the lower income group
as an additional income source (Nadi et al., 2011).
In recycling field, the type of waste that can be recovered depends on the demand and potential uses
of the recovered materials. These only cover materials that only have high commercial value, such as
paper and cardboard, plastics, glass, aluminium, ferrous metal, and for which recycling technologies
already exist. Facilities are costly to set up and operate for the recyclable materials. Therefore, it may
not be practicable to invest in a central material recovery and processing facility, if there are insufficient
of recyclable materials generated (Idrus et al., 2008).
METHODOLOGY
This study adopted the case study approach which focuses on sustainable SWM in Pangkor Island. Four
methods were chosen for this study specifically domestic waste segregation, field investigation, opinion
survey, and statistical data analysis.
Domestic Waste Segregation
In order to characterize solid waste generated in Pangkor Island, 18 households were surveyed from four
different villages around the Island. These areas were Sungai Pinang Kechil, Sungai Pinang Besar,
Pekan Pangkor, and Taman Desa Pangkor as shown in Figure 2. Each household was requested to collect
their daily solid waste and sort into two categories such as recyclable waste and non-recyclable waste,

Assessment of Solid Waste Management (SWM) Practices in Pangkor Island Malaysia
56
as shown in Table 3. The samples were collected once a week by determining the weight of the wastes
and the number of members in the household. The solid waste segregation was conducted for three
months (November 2015 – January 2016).
Table 3: Classification of Recyclable and Non-Recyclable Wastes
Recyclable Non-recyclable
Paper
Newspapers
Office papers
Phone books
Paper grocery bags
Paper egg cartons
Soiled paper
Wax or plastic-coated paper
Paper laminated with foil or plastic
Magazines and catalogs
Used paper towels, napkins, tissues and
paper plates
Cardboard
Packing boxes
Cereal boxes (single wall cartons)
Waxed cardboard
Waxed milk cartons
Soiled pizza or frozen food boxes
Glass
Jars
Bottles (clear, green or brown)
Light bulbs
Window panes
Glassware (cups, glasses, plates)
Mirrors
Metal
Aluminium cans
Tin cans
Scrap metal
Bottle and jar lids with plastic liners
Cans used for chemicals or paints
Aerosol spray cans
Plastics
Plastic soda and juice bottles
Milk jugs
Detergent, oil and antifreeze bottles
Grocery and plastic bags
Styrofoam (cups, plates, packing
materials)
Batteries
Dry cell household batteries
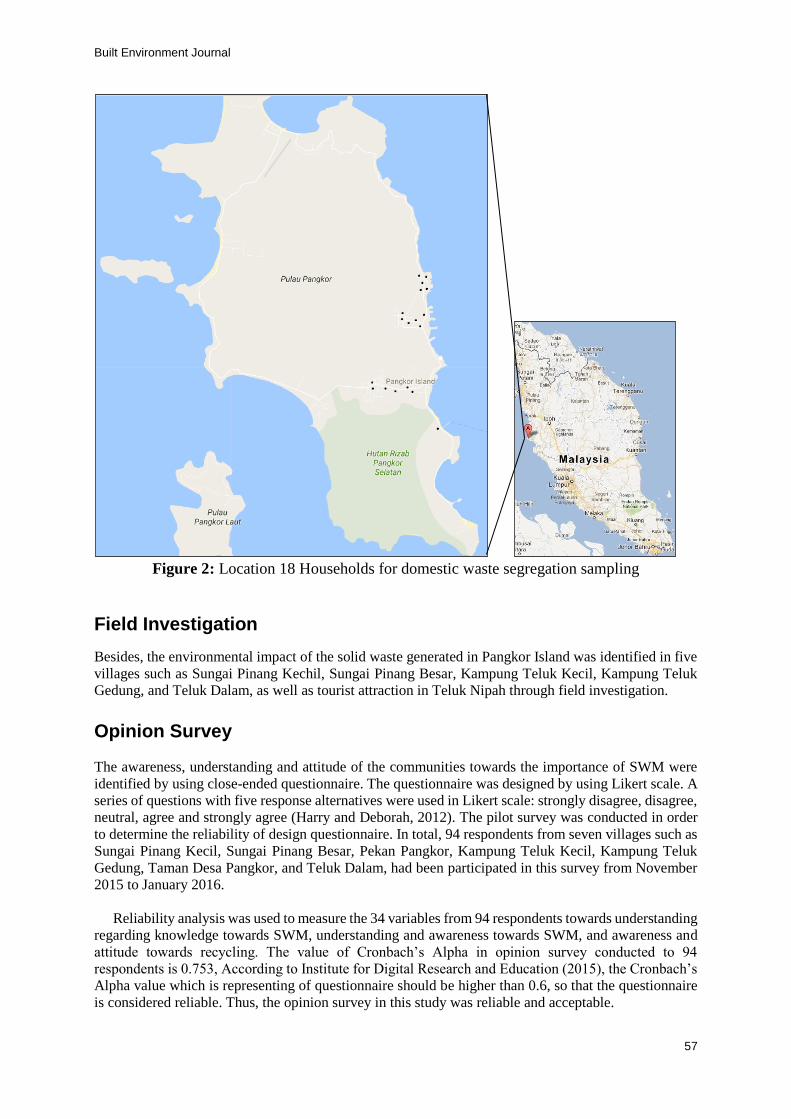
Built Environment Journal
57
Figure 2: Location 18 Households for domestic waste segregation sampling
Field Investigation
Besides, the environmental impact of the solid waste generated in Pangkor Island was identified in five
villages such as Sungai Pinang Kechil, Sungai Pinang Besar, Kampung Teluk Kecil, Kampung Teluk
Gedung, and Teluk Dalam, as well as tourist attraction in Teluk Nipah through field investigation.
Opinion Survey The awareness, understanding and attitude of the communities towards the importance of SWM were
identified by using close-ended questionnaire. The questionnaire was designed by using Likert scale. A
series of questions with five response alternatives were used in Likert scale: strongly disagree, disagree,
neutral, agree and strongly agree (Harry and Deborah, 2012). The pilot survey was conducted in order
to determine the reliability of design questionnaire. In total, 94 respondents from seven villages such as
Sungai Pinang Kecil, Sungai Pinang Besar, Pekan Pangkor, Kampung Teluk Kecil, Kampung Teluk
Gedung, Taman Desa Pangkor, and Teluk Dalam, had been participated in this survey from November
2015 to January 2016.
Reliability analysis was used to measure the 34 variables from 94 respondents towards understanding
regarding knowledge towards SWM, understanding and awareness towards SWM, and awareness and
attitude towards recycling. The value of Cronbach’s Alpha in opinion survey conducted to 94
respondents is 0.753, According to Institute for Digital Research and Education (2015), the Cronbach’s
Alpha value which is representing of questionnaire should be higher than 0.6, so that the questionnaire
is considered reliable. Thus, the opinion survey in this study was reliable and acceptable.

Assessment of Solid Waste Management (SWM) Practices in Pangkor Island Malaysia
58
Statistical Data Analysis
The data was analysed by using Statistical Package for the Social Sciences (SPSS Statistics) (IBM
Corporation, 2012). Descriptive statistics was used to analyse the descriptive data and inferential
statistics such as Pearson Correlation analysis, Analysis of Variance (ANOVA) Single Factor were
employed to further explore the differences between the groups of respondents.
RESULTS AND DISCUSSION Descriptive Analysis The survey outcome was interpreted with frequency table to describe the data statistically. Thus, all 34
variables were analysed to understand Pangkor’s residents’ knowledge, behaviour and attitude towards
solid waste issue in Pangkor Island as shown in Table 4, 5, 6 and 7.
Table 4: Descriptive analysis for Knowledge of Respondents towards SWM
Symbol Variables Value
(%)
B1 I understand the Solid Waste Management (SWM) practices 78.7
B2 I aware about Solid Waste Management (SWM) practices 87.2
B3 I attended talks/activities related to Solid Waste Management (SWM) 36.2
B4 I know how much of wastes that my house generated daily. 66.0
B5 I know the function of incinerator 75.5
B6 I recognize the gases generated by the operation of incinerator. 51.1
B7 I know the location of incinerator in Pangkor Island 75.5
B8 I know what illegal landfill is 71.3
B9 I know the location of illegal landfill in my residential area 53.2
B10 I know what are environmental pollutions and its impacts on human
health. 94.7
B11 I aware about environmental pollution in my residential area. 63.8
B12 I attended talks/activities related to environmental pollution. 43.6
B13 I know how to conduct recycling practice. 93.6
B14 I have conducted recycling and composting activity in my house. 43.6
B15 I attended talks/activities related to recycling. 52.1
Table 5: Behaviour of Respondents in Household Waste
Symbol Item
Dump it into
sea/river/land
(%)
Burn it
(%)
Legal solid
waste collector
(%)
B16 How do you dispose of
the household waste? 17.0 17.0 66.0

Built Environment Journal
59
Table 6: Awareness of Respondents towards SWM
Symbol Item
Disagree /
Strongly
Disagree
(%)
Neutral
(%)
Agree /
Strongly
Agree
(%)
SWM1 SWM is important. 0.0 18.1 81.9
SWM2 MMC is responsible for the waste
collection of my house. 13.8 17.0 69.1
SWM3 Privatized company is responsible for the
waste collection of my house. 58.5 18.1 23.4
I1 The gases generated by the operation of
incinerator are harmful to health. 1.1 45.7 43.2
I2 The incinerator operated in Pangkor
Island often breakdown. 11.7 67.0 21.3
IL1
Illegal landfill is carried out during the
breakdown of incinerator of Pangkor
Island.
24.5 54.2 21.3
IL2 Illegal landfill generates unpleasant
smell. 1.1 34.0 64.9
EP1
Environmental pollution is caused by
human activities e.g. illegal dumping of
solid wastes.
0.0 12.8 87.2
EP2 The aquatic living organisms consume
the wastes accidentally. 3.2 18.1 78.7
EP3 Environmental pollution had caused the
reduction of marine products. 2.1 29.8 68.1
Table 7: Attitude of Respondents towards Recycling
Symbol Item
Disagree /
Strongly
Disagree
(%)
Neutral
(%)
Agree /
Strongly
Agree
(%)
R1 Recycling is important. 2.1 20.2 77.7
R2 There are someone who influences me to
do recycling. 40.4 31.9 27.7
R3 Practicing waste separation is
complicated and troublesome. 33.0 29.8 37.2
R4 Practicing recycling used up a lot of
time. 38.3 26.6 35.1
R5 Practicing recycling needs a lot of effort. 39.4 24.4 36.2
R6 Practicing recycling needs a lot of space. 34.0 33.0 33.0
R7 Recycling could generate unpleasant
smell. 41.5 48.9 9.6
R8 Recycling bins are unsightly. 6.4 24.5 69.2
Total 78.7% of the respondents understand solid waste Management (SWM) best practices, 87.2%
and 36.2% of the respondents aware about SWM practices and attended relevant talks or activities,
respectively and a total 66.0% of the respondents know how much of wastes their house generated daily
(Table 4). Although 75.5% of the respondents know what are incinerator and its function, only 51.1%
of the respondents recognize the gases generated by the operation of incinerator. Another 75.5% of the

Assessment of Solid Waste Management (SWM) Practices in Pangkor Island Malaysia
60
respondents know the location of incineration in Pangkor Island. While 71.3% of the respondents know
what illegal landfill is, more than half of the total respondents which is 53.2% of the respondents know
the illegal landfill in their residential area or village. Based on Elizabeth (2006), people used to dispose
of their wastes in unpermitted areas to avoid time and effort needed to dispose properly at landfills or
recycling centres. Additionally, due to lack of understanding of laws or the inadequacy of existing laws,
it leads to the illegal disposal of wastes.
Total 94.7% of the respondents know what environmental pollution is and its impact on human
health, whereby only 43.6% of the respondents attended talks or activities related to environmental
pollution. Besides, another 63.8% of the respondents understand the environmental pollution occurred
in their residential area or village (refer Table 4).
Table 4 shows that 93.6 % of the respondents understand what recycling practice is, but less than
half of them practice recycling and composting activities in their own house. Nevertheless, 52.1 % of
the respondents attended talk or activities related to recycling. Department of Environment Quality
(2015) stated that people who do not conduct recycle practice is due to the reasons such as, time
consuming, inconvenient to conduct recycling and also do not know what materials can be recycled.
However, from the result, the percentages of respondents who attended to talk or activities which related
to SWM practices, environmental pollution, and recycling are different, which are 36.2%, 43.6 %, and
52.1 % respectively.
The understanding, awareness and practice of the local communities towards SWM were also studied
through opinion surveyed and interviewed. Based on the result shown in Table 4, 5 and 6, a total 94.7%
of respondents knew what environmental pollution is and its impacts to human health while 87.2% of
respondents agreed that environmental pollution is caused by human activities such as illegal dumping
of solid waste, 81.9% of respondents agreed SWM is important, and only 34.0% of respondents chose
their dumping methods to the sea or river or land and even burning it. At the same time, although 93.6%
of respondents knew what recycling practice is and 77.7% of respondents agreed that recycling is
important, only 43.6% of respondents practiced recycling and composting in their backyard. In layman
terms, although local communities aware about SWM, their practice of solid waste disposal is
diminutive in order to improve the environment of Pangkor Island. Thus, education of SWM best
practices to the local communities is significant for good practice of waste disposal.
Pearson Correlation Analysis Pearson Correlation Analysis was used to determine the strength of the correlation between the variables
of the attitude of respondents towards recycling (Table 7). The correlation was significant at the 0.01
level as shown in Table 8. The strongest linear relationship is between R3 and R4 which is r = 0.892,
and follow by R4 with R5 which is r = 0.865, both are positive very strong correlation. Next, the r value
is 0.777 for R3 with R5, it is known as positive strong correlation. Then, the correlation of R5 with R7
is positive strong as r = 0.681. For R1 and R2, the r value is 0.634 which is positive strong correlation.
In addition, R7 has the same r value with R3 and R4, which is 0.633, a positive strong correlation. As a
conclusion, the relationship between R3, R4 and R5 are strong, which means the respondents were
strongly agree/ agree that practicing waste separation is complicated and troublesome, a lot of time and
effort needed to practice waste separation.
Besides, for the correlation is significant at the 0.05 level, the highest correlation is when r = 0.232
for R6 with R7, yet it is known as positive weak correlation. Then, it is followed by R5 with R6 when r
= 0.210, also known as positive weak correlation. Moreover, r value for R6 with R3 is only 0.191, which
is positive very weak correlation. Generally, for the R6 and R7, many of the respondents do not agree
with recycling could generate unpleasant smell, but agree with recycling bins are unsightly.
Table 8: Pearson Correlation Analysis R1 R2 R3 R4 R5 R6 R7 R8

Built Environment Journal
61
R1 Pearson
Correlation 1 .634** -.390** -.477** -.425** .012 -.397** -.220*
R2 Pearson
Correlation .634** 1 -.298** -.441** -.465** -.061 -.319** -.090
R3 Pearson
Correlation -.390** -.298** 1 .892** .777** .191* .633** .040
R4 Pearson
Correlation -.477** -.441** .892** 1 .865** .169 .633** .051
R5 Pearson
Correlation -.425** -.465** .777** .865** 1 .210* .681** -.020
R6 Pearson
Correlation .012 -.061 .191* .169 .210* 1 .232* -.300**
R7 Pearson
Correlation -.397** -.319** .633** .633** .681** .232* 1 .042
R8 Pearson
Correlation -.220* -.090 .040 .051 -.020 -.300** .042 1
**. Correlation is significant at the 0.01 level (1-tailed).
*. Correlation is significant at the 0.05 level (1-tailed).
Domestic Waste Segregation practices in Pangkor Island A total of 18 households participated in this domestic waste segregation as shown in Table 9. The
averages recyclable and non-recyclable from the 18 households per week were 4.45 kg and 6.50 kg.
Thus, in average, the total waste from a household with four family members is 10.95 kg in a week and
2.39 kg of waste generated by per capita per week. Hence, generation of waste in Pangkor Island was
determined as 0.34 kg/capita/day, which was lower than the finding of Agamuthu (2010), 0.48
kg/capita/day. Besides, the result was also lower than the average Malaysian waste generation, 0.8
kg/capita/day (Zamali et al. 2009). The standard deviation of recyclable waste and non-recyclable waste
in a week are 1.46 kg and 3.62 kg respectively, whereas the standard deviation for total waste in a week
is 4.18 kg. Then, the standard deviation for waste generation per capita in a week is 0.53 kg.
In order to identify the difference between the variables of recyclable waste (RW) and non-recyclable
(NRW) and total waste (TW) and waste generated per capita (PC), analysis of variance (ANOVA) single
factor was conducted in this study. Based on the result (Table 10), the F values of RW and PC were
0.123 and 0.175(F<1.000). The p values as known as sig. of RW and PC were 0.972 and 0.599 (P>0.05).
Hence, the H1 was rejected and there was no significant difference between group for recyclable waste
and waste generation per capital in Pangkor Island. Besides, the p values for NRW and TW were lower
than 0.05, hence, the H0 was rejected and there was significant difference between group for non-
recyclable waste and total waste generation. The result indicated that improving recycling practice in
Pangkor Island could help to reduce the total waste generated per capita as the total recyclable waste
generated from each household was not significant difference in Pangkor Island.
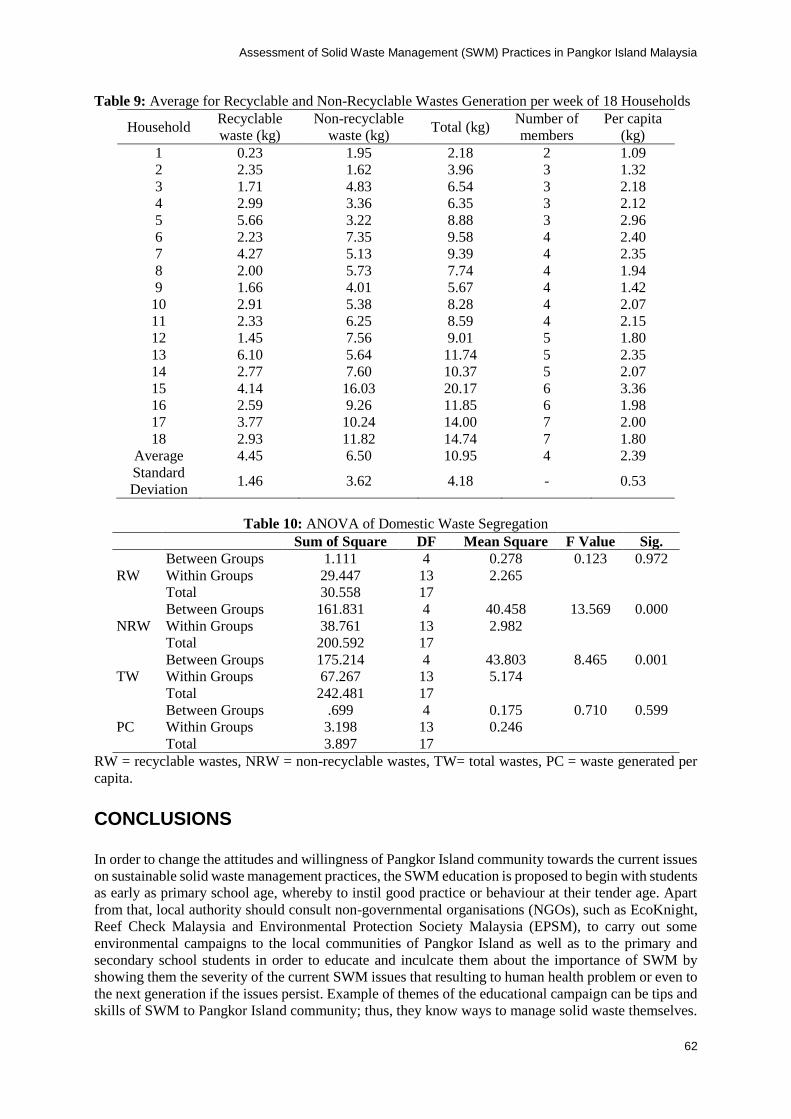
Assessment of Solid Waste Management (SWM) Practices in Pangkor Island Malaysia
62
Table 9: Average for Recyclable and Non-Recyclable Wastes Generation per week of 18 Households
Household Recyclable
waste (kg)
Non-recyclable
waste (kg) Total (kg)
Number of
members
Per capita
(kg)
1 0.23 1.95 2.18 2 1.09
2 2.35 1.62 3.96 3 1.32
3 1.71 4.83 6.54 3 2.18
4 2.99 3.36 6.35 3 2.12
5 5.66 3.22 8.88 3 2.96
6 2.23 7.35 9.58 4 2.40
7 4.27 5.13 9.39 4 2.35
8 2.00 5.73 7.74 4 1.94
9 1.66 4.01 5.67 4 1.42
10 2.91 5.38 8.28 4 2.07
11 2.33 6.25 8.59 4 2.15
12 1.45 7.56 9.01 5 1.80
13 6.10 5.64 11.74 5 2.35
14 2.77 7.60 10.37 5 2.07
15 4.14 16.03 20.17 6 3.36
16 2.59 9.26 11.85 6 1.98
17 3.77 10.24 14.00 7 2.00
18 2.93 11.82 14.74 7 1.80
Average 4.45 6.50 10.95 4 2.39
Standard
Deviation 1.46 3.62 4.18 - 0.53
Table 10: ANOVA of Domestic Waste Segregation
Sum of Square DF Mean Square F Value Sig.
RW
Between Groups 1.111 4 0.278 0.123 0.972
Within Groups 29.447 13 2.265
Total 30.558 17
NRW
Between Groups 161.831 4 40.458 13.569 0.000
Within Groups 38.761 13 2.982
Total 200.592 17
TW
Between Groups 175.214 4 43.803 8.465 0.001
Within Groups 67.267 13 5.174
Total 242.481 17
PC
Between Groups .699 4 0.175 0.710 0.599
Within Groups 3.198 13 0.246
Total 3.897 17
RW = recyclable wastes, NRW = non-recyclable wastes, TW= total wastes, PC = waste generated per
capita.
CONCLUSIONS In order to change the attitudes and willingness of Pangkor Island community towards the current issues
on sustainable solid waste management practices, the SWM education is proposed to begin with students
as early as primary school age, whereby to instil good practice or behaviour at their tender age. Apart
from that, local authority should consult non-governmental organisations (NGOs), such as EcoKnight,
Reef Check Malaysia and Environmental Protection Society Malaysia (EPSM), to carry out some
environmental campaigns to the local communities of Pangkor Island as well as to the primary and
secondary school students in order to educate and inculcate them about the importance of SWM by
showing them the severity of the current SWM issues that resulting to human health problem or even to
the next generation if the issues persist. Example of themes of the educational campaign can be tips and
skills of SWM to Pangkor Island community; thus, they know ways to manage solid waste themselves.

Built Environment Journal
63
This study was unable to obtain participation of the three major ethnic community’s i.e. Malay, Chinese
and Indian due to lack of manpower for solid waste segregation and language barrier. Inability to speak
fluently in Malay and Tamil languages, hinder the Malay and Indian communities to take part in the
solid waste segregation study.
REFERENCES
Agamuthu, P. and Nagendran, P., 2010, Waste Management Challenges in Sustainable Development of
Islands. Proc. ISWA World Congress 2010, Hamburg, Germany.
Agamuthu, P. and Nagendran, P., 2010, Waste Management on Malaysian Islands and Marine Pollution.
Okayama: Okayama Univeristy.
Department of Environment (DOE). 2015. Malaysia Environmental Quality Report 2014. DOE
Putrajaya.
Elizabeth, H., 2006. A Comprehensive Assessment of Illegal Waste Dumping. [online] Available at: <
http://www.waterhealtheducator.com/upload/Illegal%20Waste%20Dumping%20Article.pdf>
[Accessed 24 April 2016].
IBM, 2012. IBM SPSS Statistics 21 Brief Guide. Prentice Hall, US
Idrus, M. M., Ridzuan, M. B., Mustapha, S. and Adon, R., 2008, An Overview of Landfill Management
and Technologies: A Malaysian Case Study at Ampar Tenang. PSISenviro2008, 15, pp. 157-165.
Jayashree, S., Marthandan, G., Malarvizhi, C. and Indakaan,. K., 2012, Waste Management - An
Integrated Vision. Malaysia: Multimedia University.
Manjung Municipal Council, 2010. Portal Rasmi Majlis Perbandaran Manjung <http://mpm.gov.my>
accessed 01.07.2015
Minghua, Z., Xiumin, F., Rovetta, A., Qichang, H., Vicentini, F., Bingkai, L., Giusti, A.,Yi, L., 2009.
Municipal solid waste management in Pudong New Area, China. Journal of Waste Management
29, 1227–1233.
Nadi, B., Rodzi, A., Pirasteh, S., Shamshiry, E. and Mokhtar, M., 2011, Challenges of Solid Waste
Management in Malaysia, Research Journal of Chemistry and Environment, 15(2), pp. 1-4.
Pazim, O. and Rosli, M., 2011, The Impact of Tourism on Small Business Performance: Empirical
Evidence from Malaysian Islands. International Journal of Business and Social Science, 2(1), pp
11-21.
Shamshiry, E., Mokhtar, E. M. and Abdulai, 2014, Investigating the Standard Process of Incineration in
Langkawi Island, Malaysia, American Journal of Environmental Sciences, 10(3), pp. 260-276.
Shamshiry, E., Nadi, B., Mokhtar, M. B., Komoo, I., Hashim, H. S. and Nadzri, Y., 2011, Integrated
Models for Solid Waste Management in Tourism Regions: Langkawi Island,Malaysia. Journal of
Environmental and Public Health, 1155(10), pp. 1-5.
Sujauddin, M., Huda, M.S., Rafiqul Hoque, A.T.M., 2008. Household solid wastecharacteristics and
management in Chittagong, Bangladesh. Journal of Waste Management 28, 1688–1695.
Suna Erses Yay, A., 2015, Application of life cycle assessment (LCA) for municipal solid waste
management: a case study of Sakarya. Journal of Cleaner Production, 94 (2015), pp. 284-293.
The Scottish Government, 2011, Low Carbon Scotland: Meeting the Emissions Reduction Targets 2010-
2022: The Report on Proposals and Policies.
http://www.gov.scot/Publications/2011/03/21114235/11 accessed on 10.10.2015
Zamali Tarmudi, Mohd Lazim Abdullah &Abu Osman Md Tap. 2009. An Overview of Municipal
Solid Wastes Generation in Malaysia. Jurnal Teknologi (51) 1-18.
Zeeda, F. M. and Jaron, K., 2013, Opportunities and Challenges in Sustainable Waste Management
Transition in Malaysia: A multi-level socio-technical perspective. Globelics Seminar on Low
Carbon Development, pp. 4-5.

64
NOTES FOR CONTRIBUTORS
SUBMISSION
All materials submitted for publication must be
original, unpublished work and are NOT under
consideration for publication elsewhere.
Papers may be submitted by e-mail to
[email protected]. Alternatively, 2 copies of the
manuscript together with a full version on CD may
be submitted to the Editorial Board.
Address:
Assoc. Prof. Datin Dr. Hamimah Adnan
Managing Editor
Built Environment Journal (BEJ)
Faculty of Architecture, Planning and Surveying
Universiti Teknologi MARA
40450 Shah Alam
Selangor, Malaysia.
Editors reserve the right to edit/comment on the
content of the manuscript. If major or substantial
amendments are recommended by the editors the
authors will be given the option to accept or reject
the recommendations (and withdraw participation).
MANUSCRIPT PREPARATION
Language
The manuscript must be submitted in British
English.
Length
The manuscript should be within the range of 5000
– 7500 words in Times New Roman font, 12 point-
type. Authors are requested to state how many words
their paper contains. The manuscripts should be
typed and single spaced on one side of A4 paper
only, with 4 cm margins on the sides, the top and the
bottom. All text should be set aligned justified
throughout. The pages should be numbered in order.
Title Page
The first page of the manuscripts must contain the
full title, name of author(s), designation(s) of
affiliation(s), highest academic qualification and the
present address(es) with the telephone/fax/e-mail
contact information listed.
Abstract and Keywords
The abstract must not exceed 250 words and should
summarise the paper including the main conclusions.
There shall be not more than 5 keywords.
Text
The order when typing manuscripts: Title, author(s),
highest academic qualification, Affiliations,
Abstract, Keywords, Main Text (Aim, Problem
Statement/Issues, Methodology and Analysis),
Conclusion and Recommendations, References,
Acknowledgment and Appendix (if any). Simple
language, short sentences and a good use of headings
are encouraged. Headings should be numbered and
the use of more than three levels of heading should
be avoided. Headings and paragraphs should be
separated by two carriage returns. Text following a
heading should not be indented.
Illustration
Photographs, diagrams and charts should be referred
to as “Figure(s)” and numbered in the order in which
they are referred to in the text. Maps and diagrams
should be submitted in a form ready for
reproduction, all in legible digital format. Please
note that illustrations in the journal shall be printed
in black-and-white or grey-scale.
Units
All measurements and data should be given in metric
units or, if other units are used, then the metric
equivalent should be given in parentheses.
Reference
The APA 6th reference system is used. The
reference is referred to in the text by the following
manner:
Journal
Alesheikh, A. A., Ghorbanali, A., & Nouri, N.
(2007). Coastline change detection using remote
sensing. International Journal of Environmental
Science & Technology, 4(1), 61-66.
Baig, M. H. A., Zhang, L., Shuai, T., & Tong, Q.
(2014). Derivation of a tasselled cap
transformation based on Landsat 8 at-satellite
reflectance. Remote Sensing Letters, 5(5), 423-
431.
Book
Malcolm Taylor (2000) Avoiding Claims in Building
Design: Risk Management in Practice,
Blackwell Science Ltd, London
Conference Proceeding
Hamzeh, F.R. (2011). The Lean Journey:
Implementing the Last Planner System in
Construction, Proceedings of the 19th Annual
Conference of the International Group for Lean
Construction, IGLC 19, 13-15 July, Lima, Peru,
pp. 379- 390
COPYRIGHT
Once published in the Built Environment Journal,
the copyright including electronic copyrights of the
article is automatically invested with UiTM. The
copyright covers the exclusive use of rights to
reproduce and distribute the article, including
reprints, photography reproductions, microfilm,
electronic publication or any reproduction of a
similar nature and translations. Permission to publish
illustrations must be obtained by the author before
submission. Any acknowledgements should be
included in the figure captions.


