WWII Memorial Washington DC. America’s Transformation Wartime Economy To Peacetime Economy.

(Source: Port of Seattle, Don Wilson)
The benefits of infrastructure investment in Washington to support local, state, and national economic growth
Building the Economy: Infrastructure Needs in Washington
#BuildWA
March 2017
(Source: Port of Seattle, Don Wilson)


Infrastructure is the foundation of a strong, competitive economy and thriving communities. Washington State has a diverse economy—with significant technology, healthcare, manufacturing, agriculture, trade, and natural resource sectors benefiting rural, suburban, and urban communities. The state is home to ten Fortune 500 companies, moves over $70 billion worth of goods through its ports each year, and is home to over 7,000 small businesses. Washington contributes well over $300 billion to the United States economy, making the state a critical player in the nation’s economic success.
Building the Economy: Infrastructure Needs in Washington
• Infrastructure is the foundation of the state and national economy and quality of life—investments should directly support the economy.
• Cities, counties, ports, and businesses are part of the solution—local governments are on the front lines of infrastructure
planning and development, essential to business growth.
• Funding flexibility maximizes efficiency and results.
• Regulatory reform simplifies processes and targets funding where it counts—lengthy, costly processes aren’t always needed for low-risk projects.
• Long-term and continuous investment helps Washington and the nation grow—one-time investment packages help meet the most immediate need, but sustained investment is required to keep systems in working order.
Underpinning the state’s growth and success is a vast and interconnected infrastructure system. Ports depend on reliable highways, railroads, and regular dredging of shipping channels, while cities and counties need upgraded water and wastewater infrastructure to serve existing and future residents and businesses. Robust communication networks are essential not just to technology, but to professional services, national defense, healthcare, research and development, and manufacturing. Safe drinking water is a basic and essential amenity integral to the economy and society. Infrastructure connects across and among communities throughout and beyond the state, linking rural to urban, local to national, and state to state.
Example projects are presented throughout this report to illustrate the need in different infrastructure areas.
What are the benefits?• Grow businesses and jobs• Support trade• Enable innovation• Foster a resilient economy• Support homeland security
1
Washington's infrastructure needs are estimated to be more than $190 billion
Investing in Washington’s infrastructure could create 600,000 to 660,000 direct and indirect jobs*
*These figures are job-years, or one full time job for a full year. #BuildWA
What are the total infrastructure needs in Washington State?Infrastructure needs are great—and growing. Preservation and retrofits to prepare for natural disasters are needed to maintain the economy. To grow, investment is needed in enhancements and new projects to create new jobs. Risks like major earthquakes and landslides pose real dangers to all types of infrastructure. Although state and local governments work hard to get priority projects funded and built, a comprehensive program is needed to fully address the state’s substantial needs.
Total investment would result in an estimated 600,000 to 660,000 direct and indirect job-years.
BoeingEverettBoeing’s Everett plant assembles aircraft with parts imported from across the United States and the world by boat, train, truck, and airplane. 30,000 employees commute to the plant each day on local highways, bus, train, and ferry services. Hydroelectric power from nearby dams provides 80% of the plant’s energy. As Boeing illustrates, Washington’s economy—and the nation as a whole—is critically dependent on an interconnected infrastructure system to function and grow.
Boeing’s Everett Factory, the largest building in the world.
Infrastructure condition directly influences economic performance and job growth. The American Society of Civil Engineers’ 2013 report card on state infrastructure gave Washington a “C” overall, with certain areas like roads (D+) and drinking water (C-) infrastructure performing more poorly. The Washington Department of Health has already identified 75 near-term projects worth $150 million as part of the Safe Drinking Water Initiative that will begin to address these deficiencies.
The western half of the state is also at particular risk from a major seismic event—the Washington State Department of Transportation (WSDOT) has nearly 400 critical bridges in its Seismic Retrofit Program, with only one bridge retrofit currently under contract. Energy production and transmission are also at risk, with over 1,000 dams and 4,500 miles of high voltage transmission line vulnerable during a large earthquake.
(Source: Jetstar)
"We wouldn’t be able to build airplanes without this infrastructure."
Paul Roberts, Council Member, City of Everett
2
Highways and Local Roads$134 billion
Bridges$4.2 billion
Water$5.3 billionfor drinking water, storage, and agriculture
Wastewater$4.0 billionfor treatment and conveyance
Infrastructure Type and Estimated Total NeedGenerally over the next 20 years
Communications$450 millionfor rural broadband
Freight Rail$2.0 billion
Aviation$12.6 billion
Ports$5.3 billionfor marine ports
Stormwater and Natural Resources$18.7 billion for stormwater infrastructure$4.6 billion for fish and habitat
Energy$3.4 to 4.6 billion to upgrade the electric transmission network$20 million to improve electric vehicle charging facilities

What are risks of doing nothing? Underinvestment in infrastructure can lead to disruption. Failing infrastructure creates a chain reaction of inefficiencies and increased costs, leading to reduced personal income, reduced economic output, and firms looking for other places to do business.
For example, Washington’s trade industry is at risk from losses to competing ports, which have modernized their infrastructure to match the growing use of larger, more fuel-efficient ships. Since 2007, The Northwest Seaport Alliance (composed of the Ports of Seattle and Tacoma) has suffered a 14.6% market share loss, due in part to inadequate infrastructure. The Northwest Seaport Alliance’s Terminal 5 Modernization project aims to recapture the market that has been lost.
3
I n f ra st r u c t u re N e e d s i n
Wa s h i n g t o n
Poor roads and airports lead to increased travel
time Aging electric grid and inadequate
water distribution make utilities
unreliable
Unreliable infrastructure leads
to higher costs for businesses to manufacture and distribute goods
Higher costs, in turn, get passed along to
workers and families
Skagit River Bridge CollapseMount VernonThe 58-year-old Interstate 5 (I-5) Skagit River Bridge collapsed in 2013 when a truck hit a support span. Fortunately, no one was seriously injured. The sudden collapse served as a warning about the vulnerability of the state’s infrastructure —while the bridge was in good working order prior to the incident, its obsolete design made it vulnerable to such a collapse.
A 2014 study estimated that Washingtonians lose $6.5 billion each year in lost time and wasted fuel due to congestion, deteriorated roads, and safety problems. Congestion has increased 91% in the Seattle/Tacoma metro region since 2011.

Infrastructure is the Foundation of a Prosperous EconomyEconomic growth and prosperity in Washington, and in turn the nation, is critically dependent on a functional, interconnected infrastructure system. Washington makes up 2% of the U.S. population, but is the most trade-dependent state in the nation per capita, handling 7% of the nation’s export activity and 6% of its import activity. The state’s highways, railroads, rivers, and ports are fundamental to trade. Washington’s 136 airports (most of which are operated by cities) support 250,000 jobs and $51 billion in economic activity. Estimates are that every $1 spent on infrastructure results in an additional $1 of impact on the economy, with a further $1 of impact in the long run. Washingtonians recognize the importance of investment and are well-suited to convert funding to action.
Sea-Tac International Arrival FacilityProjects such as Sea-Tac’s new International Arrival Facility will strengthen Washington’s connections to the nation and world, supporting trade and the overall economy.
(Source: Port of Seattle)
4
In 2016, over 45 million passengers arrived at Sea-Tac Airport, representing 30% growth in passenger volumes just since 2013. Sea-Tac Airport is the fastest-growing airport in the nation and is the 9th busiest in the United States. The airport generates over 170,000 jobs representing $2.8 billion in direct earnings and more than $565 million in state and local taxes. Sea-Tac, the major hub for expanding Alaska Airlines, currently has 88 aircraft gates and 12 international wide-body aircraft gates. By 2034, Sea-Tac will serve 66 million annual passengers—an increase of 44%. Based on these growth forecasts, the airport will require 35 additional aircraft gates and at least 16 additional wide-body capable aircraft gates.
The Master Plan identifies sustainable projects that will meet increased demand over the next 20 years. Projects include airfield enhancements, terminal development and potential expansion, roadway improvements, and cargo facility modernization. Completion of the plan will make Sea-Tac the first large hub U.S. airport to fully incorporate sustainability as a key planning component.
Benefits:
• Create 2,000 jobs through construction alone
• Double passenger capacity to 2,600 passengers per hour at the new International Arrivals Facility and reduce the passenger connection time from 90 to 75 minutes
• Serve tens of millions of additional passengers each year, in addition to cargo
• Strengthen Washington’s connection to the rest of the United States and the world while bolstering trade
(Source: Port of Seattle, Image by Don Wilson)
Sea-Tac Sustainable Airport Master PlanSeatacCost: $2 billion (initial phase)

Key measures of investment successInfrastructure investment strategies should recognize and incorporate measures of economic success into decisions on project funding and finance. Projects in Washington have real potential to move the dial on key economic measures impacting communities large and small.
• Businesses and Jobs—Infrastructure investment bolsters business growth and is a proven job-creator. Infrastructure spending can create tens of thousands of jobs in a wide variety of trades.
• Private Capital—Public-private partnerships (PPPs) are increasingly essential to implementing infrastructure projects of all kinds. Implemented successfully, PPPs can reduce risk to the public sector, increase speed of project delivery, and result in a financial win-win. However, not just any project will attract private capital—well-vetted projects with a real return on investment lend themselves to private investment.
• Higher tax revenues—Increased development, higher wages, and more businesses all equate to greater tax revenues to improve and maintain Washington’s communities.
• Indirect multipliers and opportunities—Every dollar spent on infrastructure creates jobs, but the impact of those infrastructure dollars doesn’t stop there. A portion of those dollars will be spent in the community, generating further economic development.
5
I n f ra st r u c t u re N e e d s i n
Wa s h i n g t o n
The Yakima Valley supports a $3.2 billion agricultural industry and 5,700 jobs, which heavily depend on irrigation. The Yakima River has also historically supported large runs of salmon and steelhead. Currently, a significant regional water shortage has reduced available water for irrigation, habitat, and municipal water supply needs. Implementing the Integrated Water Plan will add 500,000 acre-feet to the basin’s water supply, allow for easier transfer of water rights, restore 100 miles of cold water habitat to recover salmon runs and enhance habitat, and protect 200,000 acres of watershed.
Benefits:
• Create hundreds of local jobs
• Increase water storage by 50%
• Impart $1 to $2 billion in benefits to salmon runs
• Result in agriculture and food processing industry benefits totaling $3.2 billion and $1.8 billion of exports through the Ports of Tacoma and Seattle
(Source: Yakima Forever, 2012)
Washington State Drinking Water ProgramStatewideDrinking water is fundamental to quality of life and the economy. Investment is needed to keep drinking water supplies safe. The Washington Department of Health has identified 75 upgrade projects in communities across the state requiring $150 million. These projects are critical in the near-term for safeguarding drinking water supplies.
Yakima Integrated Water PlanYakima River BasinCost: $4 billion

Wastewater Infrastructure: Essential And OverlookedWastewater needs total in the billions of dollars statewide, from rural counties to major cities. For example, the small town of Waterville is seeking $750,000 to repair a deteriorating sewer line and improve the overall function of its system. The project is presently unfunded, like many such projects across the state.
Washington Trade• In 2015, Washington’s ports handled
$73.5 billion in international two-way trade.
• The Northwest Seaport Alliance, composed of the Ports of Tacoma and Seattle, is the fourth-largest gateway for containerized cargo in the United States.
• Activities of The Northwest Seaport Alliance touch hundreds of thousands of jobs in Washington.
Cities, Counties, Ports, and Businesses are Part of the Solution Local governments are on the front lines of infrastructure planning and development. Businesses depend on local infrastructure to operate. Major projects usually get the most attention when it comes to funding, but local infrastructure is critical to the quality of life and success of Washington’s communities.
Cities, counties, ports, and public utility districts own, maintain, and improve vast road, transit, water, stormwater, and wastewater networks that turn the wheels of commerce. Adding capacity to a highway interchange won’t help if local connecting roads are congested or deteriorating. Washington’s ports rely on regular dredging of waterways to remain open. At an even more basic level, wastewater systems—from sewer mains to treatment facilities—must have capacity and be in good working order to meet the needs of existing and potential future residents and businesses.
Rural broadband internet represents another fundamental element of economic development. Several rural counties, including Lincoln, Adams, and Ferry Counties in eastern Washington, lack access to broadband internet. According to BroadbandNow, more than 400,000 people lack access to broadband across the state. Given the internet’s now essential nature to all commerce, as well as to quality of life and education, reaching all with broadband internet is critical to success in the 21st century.
Waterville/Douglas County Courthouse
Investing in Washington’s
infrastructure could create 600,000 to
660,000 direct and indirect jobs
6
(Source: Port of Seattle, Don Wilson)
The state is home to:
that own, maintain, and improve much of the day-to-day infrastructure that supports the economy
281 cities
39 counties
75 port districts

The Northwest Seaport Alliance Terminal 5 Improvements SeattleCost: $290 million
Port of Grays Harbor Westport Marina dredging WestportCost: $4 million
7
I n f ra st r u c t u re N e e d s i n
Wa s h i n g t o n
The global shift in container vessel sizes to handle more and more cargo (up to 18,000 twenty-foot equivalent units), especially with trans-Pacific trade, requires terminals with deep berths and large cranes. The existing Terminal 5 is closed—it is unable to serve vessels larger than 6,000 twenty-foot equivalent units. The current berth depth is 45 to 50 feet, but larger ships require deeper berths. The project includes upgrades to the dock and power system to handle larger cranes, an underwater toe wall as well as dock and pile strengthening, and deepening of berths to accommodate up to two of the largest ships in use today.
Benefits:
• Ensure that The Northwest Seaport Alliance is able to handle cargo from the large ships that increasingly dominate international trade
• Maintain and enhance regional competitiveness
• Upgrade rail capabilities and cargo wharf facilities
• Support economic development goals and create new jobs
The Westport Marina, a facility of the Port of Grays Harbor, is the number one seafood landing point in Washington. The Marina’s diverse users include commercial, tribal and recreational fishermen, as well as upland seafood buyers and processors that support thousands of jobs in rural Southwest Washington. The Marina is also an important refuge for vessels on the Washington coast. Last dredged in 1980, the Westport Marina now requires dredging to ensure it is able to remain open for the various types of vessels it serves.
(Source: NW Seaport Alliance)

The state, local agencies, and the private sector in Washington have a long history of working together to identify and prioritize infrastructure needs. Cities, counties, and ports work together to identify project needs because the state’s economy is so interconnected. However, too many restrictions on the use of funding can keep communities from implementing projects that meet local and regional needs. Many projects do not always fit neatly into existing grant programs, but are supported by multiple agencies and private businesses. Funding flexibility is key to ensuring that local and regional priorities, particularly those that span traditional infrastructure silos, can be implemented instead of the other way around—making long-planned projects fit precise funding requirements. Flexibility allows for creativity in meeting desired outcomes.
Northern Columbia Basin Rail ProjectMoses LakeCost: $30 million
The Port of Moses Lake, City of Moses Lake, Columbia Basin Railroad, the Chamber of Commerce, and WSDOT worked to identify cost-effective improvements to the local freight rail system to greatly improve access to state, national, and international markets for local products in the Moses Lake region. The project has been partially funded by Connecting Washington. When completed, the project will rehabilitate and create new connections to major rail lines, connecting local industry to the Pacific coast.
Benefits:
• Enhance access to over 1,500 acres of industrial land adjacent to the Grant County International Airport (GCIA)
• Contribute to the potential creation of 13,000 – 19,000 new family wage jobs in the GCIA Employment Center
• Enable local industrial and agricultural products to reach major domestic and international markets
• Eliminate major impediment to retaining and attracting new industries to rural Central Washington
• Reduce wear and tear on the state highway system
• Eliminate 152,000 trucks over a 20-year period, easing congestion on I-90
Infrastructure is a proven job creator• Manufacturing
• Technology
• Healthcare
• Agriculture
• Trade
Funding Flexibility Maximizes Efficiency and Results
8
(Sou
rce:
WSD
OT)
I-405 WideningKing County Located east of I-5, I-405 is one of the Seattle/Tacoma region’s most important north-south corridors. The I-405 Widening project will implement express toll lanes, as well as roadway widening, to relieve traffic congestion. An estimated $215 million could be generated from tolls to contribute to the capital cost of this project.
(Source: WSDOT)

The 2015 Connecting Washington program, a $16 billion investment in the state’s transportation infrastructure, exemplifies the cooperative spirit among Washington’s different levels of government and private partners. The Northern Columbia Basin Railroad project, in addition to many other pressing state needs like the North Spokane Corridor project, are partially or fully funded through the legislation. Connecting Washington was the result of bipartisan legislative cooperation to agree on solutions to pressing transportation needs across the state. A key tenet of the package is flexibility—it draws on the priorities and solutions already identified at the local and regional level, rather than prescribing specific conditions for funding. This allows for maximum flexibility in how projects are implemented, ensuring that measures of success are achieved efficiently and on local terms.
Washington has 392 bridges that are structurally deificient and 1,700 that are functionally obsolete, meaning they can no longer handle current traffic or do not meet current design standards. Over one third of the state's bridges are over 50 years old.
9
I n f ra st r u c t u re N e e d s i n
Wa s h i n g t o n
US 2 Everett TrestleEverett, WACost: $750 million
The US 2 Everett Trestle, which intersects with I-5 and State Route 204, carries tens of thousands of commuters each day into Everett and the greater Seattle region. This interchange is a well-known choke point in Snohomish County. During commuting hours, particularly the morning, westbound traffic becomes heavily congested on the trestle. This project will replace the existing trestle and reconfigure the US 2 and State Route 204 interchange into a three-lane westbound trestle to ease congestion and improve regional mobility.
Benefits:
• Congestion relief
• Improved traffic flow across the trestle
• Travel time savings
(Source: WSDOT)
West Sammamish River Bridge ReplacementKenmoreThe West Sammamish Bridge was constructed in the 1930s, and is used by more than 13,000 vehicles each weekday. This critical link across the Sammamish River is structurally deficient with a sufficiency rating of only 6.5 out of a possible 100. The bridge is currently weight-restricted, causing re-routing of freight. The replacement bridge will be 50 feet wide and include a multi-use pedestrian and bicycle path. The project cost is $20 million.

Regulatory Reform Simplifies Processes and Targets Funding Regulatory reform often simplifies processes for agencies looking to move projects from design to construction in time to respond to market demands. Existing processes can take years to complete and are expensive to navigate, especially for small agencies with limited resources. The red tape can make it impossible for agencies to deliver needed infrastructure in a timely way.
Expediting projects Regulatory reform could help expedite certain projects, especially those unlikely to cause environmental harm. Washington’s Fish Passage Program is a good example—the program is fixing barriers that impede migrating salmon from reaching habitat upstream. WSDOT is working to streamline the permitting process for these projects, given their environmental benefits. In this case, environmental review processes can actually delay implementing a project to improve environmental conditions. The cost of environmental compliance could also reduce the amount of actual work that can be completed with the budget.
10
Fish Passage ProgramWashington is home to important commercial fisheries, including salmon. Essential to functioning ecosystems, Pacific Northwest salmon runs are a fraction of their former size due to multiple issues, including culverts and other barriers to fish passage. The state is working with cities and counties to correct more than 800 fish barriers in western Washington on state-owned facilities, estimated to cost $2.4 billion in total to repair. There are a further 900 city and 2,000 county barriers to fish passage that need fixing, requiring additional funds.
(Source: WSDOT)
Benton County WineBenton County had the highest wine production in the state in 2014, producing nearly 9.5 million cases of wine. The county has about 25,000 acres planted in wine grapes and another 5,000 acres planted in juice grapes as of 2015. The growing wine industry, especially in eastern Washington, is critically dependent on irrigation and water infrastructure in the Columbia and Yakima basins to thrive.
(Source: Washington State Wine Commission)
Electric Vehicle InfrastructureElectric vehicles are increasingly popular across the state and nation. Currently, 20,000 plug-in vehicles (PEV) are registered in Washington, and to meet Washington’s goal of 50,000 PEVs by 2020, expanded infrastructure to fuel these vehicles is needed. Washington is part of the West Coast Green Highway network, a cooperative between west coast states to implement linked electric vehicle infrastructure. Strategic investments beyond the I-5 corridor have an estimated cost of $20 million.
(Source: West Coast Green Highway)
11
I n f ra st r u c t u re N e e d s i n
Wa s h i n g t o n
(Source: Greater Spokane) (Source: Puget Sound Regional Council)
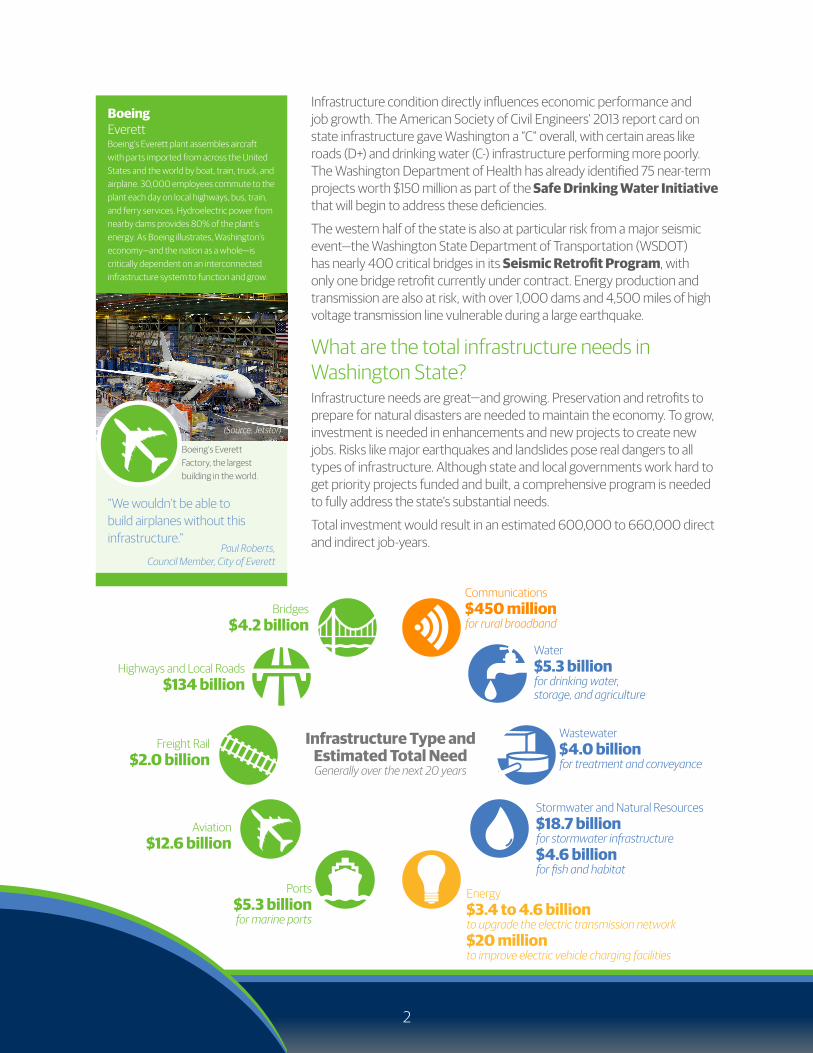
North Spokane CorridorSpokaneCost: $1.5 billion
State Route 3 Defense Industrial CorridorBremertonCost: $100 million
Spokane is the largest city and center of commerce between Seattle and Minneapolis. Spokane is a major freight hub, with more than $13.5 billion in freight moved annually along US 395 alone. The two current north-south freight routes run along arterial streets that intersect neighborhoods and residential areas, leading to congestion and impacting community livability. The new North Spokane Corridor will be a 60-mile per hour limited access highway connecting I-90 and US 395, providing a new route for freight, reducing congestion, and significantly decreasing travel times.
Benefits:• Fuel savings due to increased speeds and fewer stops;
improvements in regional air quality
• Reduced congestion by moving traffic from the existing route, which has 29 signalized intersections
• Travel time savings of $142.3 million per year
• $22 million in reduced costs associated with accidents
• Creation of 13,000 jobs when fully funded
Naval Base Kitsap, which includes the Puget Sound Naval Ship Yard—the largest maritime industrial site in Washington State—is located near the intersection of State Route 3 and 304 in Bremerton. Kitsap County has over one-third of the region’s defense workforce with 15,000 employees and 5,000 defense contract workers. Immediately to the south, the Puget Sound Industrial Center (PSIC) is one of only eight regionally-designated Manufacturing/Industrial Centers and is planned to add 10,000 jobs over the next 20 years. The region has already invested tens of millions of dollars in a new wastewater treatment plant to serve the area. However, traffic congestion in the corridor is affecting the ability of PSIC to reach its potential, and causing serious mobility problems for freight traffic and commuters to Naval Base Kitsap. The State Route 3 Defense Corridor encompasses three major projects to address these issues, including a new highway bypass, interchange improvements, and a new road connecting PSIC to the regional highway system.

Long-Term and Continuous Investment is NeededWashington is growing—and at a quicker pace than much of the nation. Growth is fueled by Washington’s strong economy, excellent quality of life, and access to opportunity. At the same time, the state’s economy and quality of life depends on a resilient, modern, and well-maintained infrastructure system.
Consider that:
• More than 300 years have passed since the last major Cascadia Subduction Zone earthquake, with geologists estimating a 40% chance of a 9.0 or greater earthquake in western Washington in the next 50 years.
• Congestion in the Seattle/Tacoma metro region has increased 91% since 2011.
• One billion gallons of sewage-contaminated water is released to Washington’s waterways each year because of uncontrolled combined sewer overflows.
• Jobs are forecast to grow at a rate nearly 50% higher through the mid-2020s.
With billions of dollars in need, long-term solutions are required to maintain and improve infrastructure. Short-term packages like Connecting Washington address the most pressing short-term needs. But, the long-term funding gap is significant. Billions of dollars are needed to repair culverts that harm salmon habitat. Tens of millions of dollars are needed to implement electric vehicle charging infrastructure on state highways. Smaller, cash-strapped agencies—essential to the prosperity of local economies across the state—need resources to keep fundamental elements of the infrastructure system running.
Washington is ready to deliver.Washington is poised for growth. With millions of new residents expected in coming years, in addition to major increases in trade, manufacturing, technology, and agriculture, resources for improving the state’s infrastructure will be essential. The needs are great, but the economic payoff at the local, state, and national level make Washington a wise investment.
12
By 2040,Washington is expected to grow by an additional
2 million people
I-5 Interstate BridgeVancouverI-5 crosses from Oregon into Washington over the Columbia River serves as a critical link in the west coast freight corridor, stretching from Mexico to Canada along I-5. In 2012, the total value of freight moved across the bridge was $40 billion, and this is expected to increase to $72 billion by 2030. The bridge experiences severe congestion, and one of the two bridge spans is now 100 years old and will not survive a major seismic event.
Benefits:
• Improve travel times for freight traffic worth billions of dollars
• Reduce seismic risk
• Create 4,200 regional and state jobs
(Source: DJC Oregon 2011)

13
I n f ra st r u c t u re N e e d s i n
Wa s h i n g t o n
(Source: Sound Transit)
Sound Transit Expansion (ST3)Seattle/Tacoma Metro Region
Washingtonians understand the importance of investment —voters in the Seattle/Tacoma metro region recently supported a measure to substantially improve regional transit service and address traffic congestion. The Sound Transit 3 Plan will add 62 new miles of light rail with stations serving 37 additional areas for a 100+ mile regional high capacity transit system. The plan also establishes bus rapid transit corridors, expands commuter rail, express bus service, and improves access to stations for bicyclists, pedestrians, drivers, and pick-up and drop-off services, and expands parking at stations. The voter-approved plan allows Sound Transit to quickly respond to opportunities with local matching funds.
Benefits:• Move more residents by transit, with 800,000 additional
people expected in the Seattle/Tacoma region by 2040
• Enable more people to access fast and reliable transit that can meet demand for decades into the future
• Create more than 78,000 direct jobs and more than 144,000 indirect jobs over the 25-year period of construction, for a total of over 223,000 jobs.
(Source: Washington Department of Ecology)
Odessa AquiferAdams County
The aquifer (groundwater) in the Odessa Subarea has deteriorated to a degree where farmers’ ability to irrigate their crops is impacted. As much as $840 million annually in economic activity and 3,600 jobs will be lost when the aquifers decline to a point that they are no longer usable. The East Columbia Basin Irrigation District is championing the Odessa groundwater program, but also relies on extensive infrastructure—dams, pumps, canals, drains—to supply reliable water to a multi-billion dollar farming industry. The proposed water replacement program would supply 164,000 acre-feet of surface water from Banks Lake to irrigate 70,000 acres, which is currently being irrigated with groundwater.
Potatoes are an important commodity in the region, worth hundreds of millions of dollars each year and supporting two processing facilities that are major local employers. Maintaining and expanding irrigation capacity in the region will maintain these local jobs while also supporting agriculture expansion in Adams County.
“Without this [water] infrastructure, eastern Washington would not look the way it does. We need to keep investing in infrastructure to be able to count on a domestic food supply.”
-Craig Simpson, Manager,East Columbia Basin Irrigation District

Infrastructure needs American Road & Transportation Builders Association (ARTBA). 2017. National Bridge Inventory: Washington. Retrieved from http://www.artba.org/deficient-bridge-state-page/?y=2016&state=WA.
American Society of Civil Engineers, Seattle Chapter (ASCE Seattle). 2013. 2013 Report Card for Washington’s Infrastructure. Available at http://www.seattleasce.org/reportcard/2013ReportCardWA.pdf.
Congressional Budget Office. 2010. Estimated Impact of the American Recovery and Reinvestment Act on Employment and Economic Output from April 2010 through June 2010. Retrieved from https://www.cbo.gov/publication/21671?index=11706. August.
Electric Power Research Institute. 2011. Estimating the Costs and Benefits of the Smart Grid. Retrieved from https://www.smartgrid.gov/files/Estimating_Costs_Benefits_Smart_Grid_Preliminary_Estimate_In_201103.pdf.
Environmental Protection Agency (EPA). 2012. Washington - Clean Watersheds Needs Survey 2012.
Northwest Seaport Alliance. 2015. Infrastructure Investment Highlights. Retrieved from https://www.nwseaportalliance. com/sites/default/files/NWSA_infrastructure_12-2015_1pg.pdf.
Orenstein, W. 2017. “Upgrades to Sea-Tac on priority list for Trump’s national infrastructure projects.” The Olympian. Retrieved from http://www.theolympian.com/news/politics-government/article128546004.html. January 24.
Pacific Northwest Waterways Association (PNWA). Undated. PNWA Supported Corps Projects - FY2016 & FY 2017 at a glance. Retrieved from http://www.pnwa.net/factsheets/PNWA-Supported-Corps-Projects.pdf.
State of Washington Office of Financial Management. 2017. Economic Analysis of Water Infrastructure and Fisheries Habitat Restoration Needs.
U.S. Department of Commerce. (2013). Northwest Open Access Network. Retrieved from https://www2.ntia.doc.gov/grantee/northwest-open-access-network-noanet
U.S. Department of Energy. 2015. State of Washington Energy Sector Risk Profile. Retrieved from https://www.energy.gov/sites/prod/files/2015/05/f22/WA-Energy%20Sector%20Risk%20Profile.pdf.
Washington State Department of Transportation (WSDOT). 2009. Washington State 2010-2030 Freight Rail Plan. Retrieved from http://www.wsdot. wa.gov/NR/rdonlyres/34925D95-4F59-44B6-90DD-6BE102B33C15/0/StateFreightRailPlan.pdf. Rail and Marine Office.
Washington State Department of Transportation (WSDOT). 2015. Update: WSDOT Priorities for New Revenue - Unfunded System Investments. Retrieved from https://www. wsdot.wa.gov/NR/rdonlyres/63A9AB9A-93AE-4629-B294-7182D1350949/0/2015UnfundedPriorities.pdf.
Other references American Society of Civil Engineers (ASCE). 2016. Update to Failure to Act - Closing the Infrastructure Investment Gap for America’s Economic Future. Retrieved from http://www.infrastructurereportcard.org/wp-content/uploads/2016/05/ASCE-Failure-to-Act-2016-FINAL.pdf.
American Society of Civil Engineers, Seattle Chapter (ASCE Seattle). 2013. 2013 Report Card for Washington’s Infrastructure. Retrieved from http://www.seattleasce.org/reportcard/2013ReportCardWA.pdf.
Applied Development Economics, Inc. (2015). Spokane Housing and Economic Report. Spokane, Washington.
Brun, L., J.G. Jolley, A. Hull, and S. Frederick. 2014. Infrastructure Investment Creates American Jobs. Duke University, Center on Globalization, Governance and Competitiveness. Washington DC: Alliance for American Manufacturing. Retrieved from https://s.bsd.net/aamweb/main/page/file/9d937012edb12326c4_7vm62z7l5.pdf.
CH2M HILL Engineers, Inc. (CH2M). 2016. Central City Line, Draft Strategic Overlay Plan. Prepared for Sound Transit, Seattle, Washington. August.
City of Bremerton. 2014. SR 3 Defense Industrial Corridor. Retrieved from http://www.ci.bremerton.wa.us/DocumentCenter/Home/View/838.
City of Kenmore. 2017. FAQ Sheet West Sammamish River Bridge (Southbound Traffic). Retrieved from http://kenmorewa. gov/sites/default/files/PublicWorks/Fact%20Sheet.pdf.
City of Kenmore. 2017. West Sammamish River Bridge Replacement Open House Presentation. Retrieved from http://kenmorewa.gov/sites/default/files/PublicWorks/Open%20House%20Presentation%20Slides.pdf.
City of Spokane Parks. Undated. Park Finder. Retrieved from https://my.spokanecity.org/parks/finder/.
The following resources informed production of this report
14

Columbia Institute for Water Policy. 2005. Odessa Economics. http://columbia-institute.org/oa/odessa/Odessa_Economics.html.
Columbia River Crossing Coalition. 2013. Washingtonian’s Letter. Retrieved from http://www.crossingcoalition.com/PDF/SW_Washingtonians_Letter.pdf.
Deaconess Hospital. 2014. Deaconess Hospital Fact Sheet.
NW Seaport Alliance. 2015. Terminal 5 Improvements. Retrieved from https://www.nwseaportalliance.com/sites/default/files/nwsa_t-5_public_document_10-2015.pdf.
Port of Seattle. 2016. Sea-Tac Airport Master Plan Brochure. Retrieved from https://www.portseattle.org/Business/Construction-Projects/Airport-Projects/Documents/160322_SAMP_Brochure.pdf.
Port of Seattle. 2016. Sea-Tac SAMP Presentation Boards. Retrieved from https://www.portseattle.org/Business/Construction-Projects/Airport-Projects/Documents/SAMP_boards_031416.pdf.
Port of Seattle. 2016. Terminal 5 Cargo Wharf Rehabilitation Berth Deepening and Improvements. Retrieved from https://www.portseattle.org/Environmental/Environmental-Documents/Documents/deis_t5_160523.pdf.
Port of Seattle. Undated. Sustainable Airport Master Plan. Retrieved from https://www.portseattle.org/Business/Construction- Projects/Airport-Projects/Pages/airport-master-plan.aspx
Providence Health and Services. Undated. Patient Volumes. Retrieved from http://washington.providence.org/clinics/providence-spokane-heart-institute/for-patients/volumes-matter/.
Public Schools Directory. Undated. 50 States.com: Spokane Public Schools. Retrieved http://www.50states.com/washington/spokane__ public_schools.htm?show=S.
Schmidt, B. 2014. “Columbia River Crossing: Building new Interstate 5 bridge would increase future traffic on Interstate 205 by more than 40,000 vehicles daily.” Oregonian/Oregon Live. Retrieved from http://www.oregonlive.com/portland/index. ssf/2014/01/columbia_river_crossing_buildi.html.
Shriners Hospital for Children – Spokane. 2012. SHC Community Health Needs Assessment Report.
Sound Transit. Undated. Sound Transit 3. Retrieved from http://soundtransit3.org/overview.
State of Oregon, Legislative Committee Services. 2012. Background Brief on Columbia River Crossing. Retrieved from https://www.oregonlegislature.gov/citizen_engagement/Reports/ColumbiaRiverCrossing.pdf.
U.S. Department of Transportation (USDOT). 2015. Freight Facts and Figures. Retrieved from https://www.rita.dot.gov/bts/sites/rita. dot.gov.bts/files/FFF_complete.pdf.
U.S. Small Business Administration, Office of Advocacy. 2016. Washington Small Business Profile. Retrieved from https://www.sba.gov/sites/default/files/advocacy/Washington.pdf.
University of Washington. 2016. “University of Washington, Gonzaga University announce UW medical school partnership, launch initiative to advance medical education and research in Spokane region.” UW Today. Retrieved from http://www. washington.edu/news/2016/02/24/university-of-washington-gonzaga-university-announce-uw-medical-school-partnership-launch-initiative-to-advance-medical-education-and-research-in-spokane-region/. February 24.
Urbanist, The. 2017. Sea-Tac Airport Sustainable Airport Master Plan Update. Retrieved from https://www.theurbanist. org/2017/01/30/sea-tac-airport-sustainable-airport-master-plan-update/.
Washington State Department of Ecology (Ecology). 2012. Yakima River Basin Integrated Water Resource Management Plan Final Programmatic Environmental Impact Statement. Retrieved from http://www.ecy.wa.gov/programs/wr/cwp/ybip.html.
Washington State Department of Ecology (Ecology). 2013. The Future of Water in the Yakima Basin. Retrieved from http://www.ecy.wa.gov/programs/wr/cwp/images/pdf/YBIP_Action-NoAction-v8.14.13.pdf.
Washington State Department of Ecology (Ecology). Undated. Odessa Groundwater Replacement Program. Retrieved from http://www.ecy.wa.gov/programs/wr/cwp/cr_odessa.html.
Washington State Department of Health (DOH). 2015. 2015 Public Water Supply Supervision (PWSS) Grant’s Work Plan. Retrieved from http://www.doh.wa.gov/Portals/1/Documents/4200/SEAStateEPAAgreement2015-17.pdf.
Washington State Department of Transportation (WSDOT). 2006. Northern Columbia Basin Railroad Project Feasibility Study. Retrieved from http://www.wsdot.wa.gov/NR/rdonlyres/1A960145-0016-4F1B-A453-8D9D079F2069/0/NorthernColumbiaBasinRRProjFeasStudy.pdf.
15
I n f ra st r u c t u re N e e d s i n
Wa s h i n g t o n

Washington State Department of Transportation (WSDOT). 2015. Annual Mega-Project Report - US 395 - North Spokane Corridor. Retrieved from http://www.wsdot.com/NR/rdonlyres/32E39C73-BB04-4F83-B3B0-54756EDCEEE8/0/NSCMegaProjectFolioSept2015.pdf.
Washington State Department of Transportation (WSDOT). 2015. Update: WSDOT Priorities for New Revenue - Unfunded System Investments. Retrieved from https://www.wsdot.wa.gov/NR/rdonlyres/63A9AB9A-93AE-4629-B294-7182D1350949/0/2015UnfundedPriorities.pdf.
Washington State Department of Transportation (WSDOT). 2016. Puget Sound Gateway Program: FASTLANE Application - Attachment 1: Project Narrative. Retrieved from http://www.wsdot.wa.gov/NR/rdonlyres/C901D4A7-9F83-4123-9633-03D149D0754E/115998/WSDOT_Gateway_ FASTLANE_Project_Narrative_20161215o.pdf.
Washington State Department of Transportation (WSDOT). 2016. Puget Sound Gateway Program: FASTLANE Application - Attachment 2: Cost Benefit Analysis. Retrieved from https://www.wsdot.wa.gov/NR/rdonlyres/C901D4A7-9F83-4123-9633-03D149D0754E/116005/WSDOT_Gateway_ Appendix_A_BCA_2016122117.pdf.
Washington State Department of Transportation (WSDOT). 2012. The Impact of Truck Congestion on Washington State’s Economy: Executive Summary. Retrieved from https://www.wsdot.wa.gov/NR/rdonlyres/4D53B6C5-D1DF-4A3C-9B67-FD90D4847A66/0/June2012_Impact_Freight_Congestion.pdf.
Washington State Department of Transportation (WSDOT). 2016. WSDOT Fish Barrier Correction: Moving Forward, Connecting Habitat. Retrieved from https://www.wsdot. wa.gov/NR/rdonlyres/2B683F95-8971-4FF3-A8FD-BE96C0B67A15/0/FishPassageFolioforWeb.pdf.
Washington State Department of Transportation (WSDOT). Undated. US 2 Trestle Photos. Retrieved from http://wsdot.wa.gov/Projects/US2/TrafficManagement/Photos.htm.
Washington State Employment Security Department. 2015. 2015 Labor Market and Economic Report. Retrieved from https://fortress.wa.gov/esd/employmentdata/docs/economic-reports/2015-labor-market-and-economic-report.pdf.
Washington State Governor’s Office. 2013. Yakima River Basin: Water, Jobs, and Fish. 2013 Policy Brief. Retrieved from http://www.governor.wa.gov/sites/default/files/policy_briefs/pb_Yakima_River_2013.pdf. January.
Washington State Office of Financial Management. 2016. State Population Forecast: 2010 - 2040. Retrieved from http://www.ofm.wa.gov/pop/stfc/stfc2016/stfc_2016.pdf. Forecasting and Research Division.
Washington State Wine Commission. 2015. Economic & Fiscal Impacts of Wine and Wine Grapes in Washington State. Retrieved from https://www.washingtonwine.org/trade/documents/details/washington-state-wine-industry-economic-and-fiscal/. August.
Washington Water Research Center. 2014. Benefit-Cost Analysis of the Yakima Basin Integrate Plan Projects. Retrieved from https://swwrc.wsu.edu/documents/2014/12/ybip_bca_swwrc_dec2014.pdf.
Worrell, C. 2015. “Washington State provides funding for Rail Infrastructure Projects.” Railway Age. Retrieved from http://www.railwayage.com/index.php/freight/short-lines/washington-state-provides-funding-for-rail-infrastructure-projects.html.
16

Infrastructure investment will:• Grow businesses and jobs
• Support trade
• Enable innovation
• Foster a resilient economy
• Support homeland security
#BuildWA