
BUILDING THE BIOECONOMY 5TH EDITION - Innovation · BUILDING THE BIOECONOMY 5TH EDITION National...
120
BUILDING THE BIOECONOMY 5TH EDITION National Biotechnology Industry Development Strategies Globally
Transcript of BUILDING THE BIOECONOMY 5TH EDITION - Innovation · BUILDING THE BIOECONOMY 5TH EDITION National...

BUILDING THE BIOECONOMY 5TH EDITION National Biotechnology Industry Development Strategies Globally

SECTION
2
This report was commissioned by the Biotechnology Industry Organization. The views represented here are those of the authors only.
Copyright © Pugatch Consilium 2018
The moral right of the authors has been asserted.
All rights reserved. Without limiting the rights under copyright reserved above, no part of this publication may be reproduced, stored or introduced into a retrieval system, or transmitted, in any form or by any means (electronic, mechanical, photocopying, recording or otherwise), without the prior written permission of both the copyright owner and the publisher.
BUILDING THE BIOECONOMY 5TH EDITION
3
LIST OF ABBREVIATIONS 4
EXECUTIVE SUMMARY 7
1 INTRODUCTION 11 1.1 Pioneering and planning 11
1.2 Objectives of the 2018 edition 11
1.3 Enabling factors for biotech success 12
1.4 A wider sample of national biotech policies 13
1.5 Report overview 15
2 INNOVATION VERSUS REGULATION? THE WORLD IN BIOTECH IN 2017-18 17
2.1 The Rise of China 17
2.2 Shaking the fundamentals of IP protection 20
2.3 Managing pricing constraints: new ways out and old dead ends 23
2.4 Speedier approval pathways gather steam globally 25
2.5 The shift towards second-generation biofuels 27
2.6 Gene editing: a looming second ag-biotech revolution 27
2.7 The unfolding healthcare ‘4.0 revolution’ 28
3 MEASURING POLICY IMPACT AND REAL-WORLD BIOTECHNOLOGY 31 RESULTS – THE BIOTECH POLICY PERFORMANCE MEASURE
3.1 Policy inputs 31
3.2 Biotech outputs 35
3.3 Green, yellow and red – Traffic light classification system 38
3.4 The Biotech Policy Performance Measure – Overall results 38
3.5 The Biotech Policy Performance Measure – Discussion 39
4 FINAL THOUGHTS 43
4.1 Policy as the bridge 43
ANNEX – INDIVIDUAL COUNTRY OVERVIEWS AND STATISTICS 47
NOTES 114
TABLES AND FIGURES Table 1 Seven enabling factors for biotechnology innovation 12
Table 2 Building the Bioeconomy 2018 33 economies by World Bank income group 13
Table 3 Biotech Policy Performance Measure, policy input indicators 32
Table 4 Biotech Policy Performance Measure, biotech outputs 35
Figure 1 The Biotech Policy Performance Measure – Overall Results 39
CONTENTS

4
BCI Biopharmaceutical Competitiveness and Innovation
BeNeLuxAI Belgium, Netherlands, Luxemburg, Austria, Ireland
BERD Business Expenditure on R&D
CEA Council of Economic Advisers
CFDA China Food and Drug Administration
CRISPR Clustered Regularly Interspaced Short Palindromic Repeats
DRA Drug Regulatory Authority
EC European Commission
ECJ European Court of Justice
EMA European Medicines Agency
EU European Union
FAS Federal Anti-monopolistic Service of the Russian Federation
FDA US Food and Drug Administration
FDI Foreign Direct Investment
GDP Gross Domestic Product
GE Genetically Engineered
GM Genetically Modified
GMO Genetically Modified Organism
GMP Good Manufacturing Practices
HTA Health Technology Assessment
ICT Information and Communications Technology
IP Intellectual Property
IPR Inter Partes Review
IPRs Intellectual Property Rights
IRP International Reference Pricing
KIPO Korean Intellectual Property Office
MHRA Medicines and Healthcare products Regulatory Agency (United Kingdom)
MoH Ministry of Health
NHS National Health System
NIS National Innovation System
OBC Outcome Based Contract
OECD Organization for Economic Co-operation and Development
PAHO Pan American Health Organization
LIST OF ABBREVIATIONS

BUILDING THE BIOECONOMY 5TH EDITION
5
PCT Patent Cooperation Treaty
PhRMA Pharmaceutical Research and Manufacturers of America
PHARMAC New Zealand’s Pharmaceutical Management Agency
PPP Purchase Power Parity
PRO Public Research Organization
PTAB (USPTO) Patent Trial and Appeal Board
RDP Regulatory Data Protection
R&D Research and Development
SME Small and Medium Enterprise
SPC Supplementary Patent Certificate
USPTO US Patents and Trademarks Office
VC Venture Capital
WHO World Health Organization
WIPO World Intellectual Property Organization
WTO World Trade Organization
LIST OF ABBREVIATIONS (cont.)

6

BUILDING THE BIOECONOMY 5TH EDITION
7
EXECUTIVE SUMMARY
Regulations need to strike a balance between protecting users and stimulating innovation, incorporating sufficient guarantees without dampening economic efficiency. More than in other industries, for biotechnologies the interplay between innovation and regulation has important social and ethical implications.
This edition of the Building the Biotechnology Report uses the interrelatedness of the regulatory and technological realms, and its socio-economic implications, as the key to reading and understanding recent biotechnology policy developments.
Building the Bioeconomy 2018
2018 marks the fifth edition of the Building the Bioeconomy series. Since 2013 it has taken the pulse of biotechnology policy frameworks by looking at their developments and overall performance in some of the major economies around the world. The overriding goal of this exercise has been to identify how successful biotechnology sectors can be built and sustained. In addition to mapping policy trends and
monitoring changes, the last few editions of the report have also assessed how different economies are achieving their stated biotech goals. This is done through the Biotech Policy Performance Measure (the “Measure”), a comparison of economies on 20+ policy inputs and biotech outputs showing how individual economies’ policy environments affect their success or failure in creating thriving biotech sectors.
This edition expands the analysis from 26 to 33 of the world’s major economies and aspiring biotech pioneers, providing a larger sample to examine the main global trends and developments.
Key findings and Biotech Policy Performance Measure results
The below figure shows the overall results for the Biotech Policy Performance Measure. Economies move from left to right in the figure from those that have the most challenging environments for both policy inputs and biotech outputs to those with the most attractive policy environments and accompanying high levels of biotechnology outputs. (A full set of tables with results for each indicator and inputs and outputs is provided in the accompanying Annex.)
What first emerges from this year’s Biotech Policy Performance Measure results is that the addition of seven new countries confirms and strengthens the overall message of previous editions of the Measure: inputs equal outputs. Economies that tend to have stronger environments with all enabling policy factors in place tend also to see higher levels of biotechnology outputs. Adopting a pragmatic, long-term approach focused on getting the policy environment right is key to reaping the economic and social benefit of biotechnologies.

8
EXECUTIVE SUMMARY
At different degrees and speeds, most countries are moving to support education and R&D infrastructure. High investment in human capital and scientific infrastructure underpins the capacity to innovate or even take advantage of technological advances abroad. Yet, while the role of innovation as central to economic growth is widely recognized, some countries continue to invest very little of their income in R&D. In Asian and Latin American countries such as Vietnam and Peru, the national innovation systems rely on R&D spending of less than 0.5% of GDP. While there is a link between level of GDP (and economic structure) and R&D spending, there are also important variations based on countries’ choice. For instance, three countries with very different income levels – Brazil, Malaysia and New Zealand (with a per capita income at PPP of USD 14,125, USD 27,683 and USD 38,565 respectively) – all
basically spend between 1.2-1.3% of GDP on R&D activities. Also in another newly added country, Costa Rica, spending on R&D is on the low end, at 0.6% of GDP. In the case of Costa Rica, though, the ill effects of such low spending levels is mitigated by much of the spending being directed into high-impact projects under a concerted National Plan for Science, Technology and Innovation. Yet, also for Costa Rica, high investment in human capital and scientific infrastructure is not sufficient, alone, to build a strong biotech industry. Without other enabling factors and policy inputs in place, the positive effects of investment in human capital and R&D infrastructure tend to fade away. For example, Russia has one of the best-educated populations in the world. Russians have traditionally had a high level of enrolment in tertiary education. As a percentage of the total population in the age group 25-64 that has attained some level of tertiary
The Biotech Policy Performance Measure – Overall results
Tha
iland
Ind
one
sia
Egyp
t
Sout
h A
fric
a
Bra
zil
Chi
le
Turk
ey
Saud
i Ara
bia
New
Zea
land
Mal
aysi
a
UA
E
Chi
na
Aus
tral
ia
Ko
rea
Taiw
an
Finl
and
Isra
el
Jap
an
Swed
en UK
Sing
apo
re
Swit
zerl
and
Irel
and
Den
mar
k
US
Vie
tnam
Peru
Ind
ia
Rus
sia
Co
sta
Ric
a
Mex
ico
Co
lom
bia
Arg
enti
na
Polic
y In
put
sB
iote
ch O
utp
uts

BUILDING THE BIOECONOMY 5TH EDITION
9
education, Russia had a 2011 rate of 53%, which is higher than any OECD country and well above the OECD average of 32%. Similarly, although the number has dropped somewhat, Russia has a high number of researchers in the population. The latest data (2015) from the World Bank shows that Russia had 3,131 researchers per million people. This is just behind New Zealand and the US, almost three times the number for China and far ahead of Brazil, Chile, South Africa, Mexico and India. Similarly, Russian R&D spending is relatively high at 1.1% of GDP, which is just behind New Zealand and Ireland but far ahead of the UAE, Saudi Arabia, Mexico, Chile and India. Yet, Russia – despite this significant advantage in human capital and R&D spending – largely fails to generate substantial and sustained biotech outputs. Deficiencies and uncertainty in other policy areas (including IP rights, market and commercial incentives and the regulatory environment) to some extent cancel out the advantages accrued in human capital and R&D spending.
Conclusions
As we have documented over the last five editions of Building the Bioeconomy, biotechnology has emerged as one of the main technological solutions to tackle today’s health, food and environmental needs. At the BIO International Convention – the world’s biggest trade show and industry meeting on biotechnology – the number of international delegates and representatives from governments across the world increases every year. And every year sees more and more countries publicly state their ambitions of building the biotech sector. Yet, despite this growing interest, relatively few countries are able to have sustained levels of success and achieve the desired biotech outputs. Even though techno parks are being built, sizeable investments are made in R&D infrastructure and advanced doctoral programs, many countries are not progressing as quickly as they would like.
What is going wrong?
What stands out from the country examples and Biotech Policy Performance Measure this year is just how regulatory changes are actively contributing to either enhancing or hindering
the innovation potential of the biotech industry. The leading and most forward-looking biotech regulators in the world are trying to keep pace with technological developments and to cement these benefits through novel, user-friendly processes and procedures. Yet, in many cases, regulatory decisions work against stated objectives and undermine innovation incentives, often as a result of inadequate governance structures and shortsighted priorities. So what can regulators, policymakers and countries actively do to change their trajectory and put themselves in the best position to achieve biotech success?
To begin with, regulatory policy should be coordinated within government, and stakeholder consultation and regular dialogue should be a formalized part of the process. This is especially true for cross-cutting and newly emerging issues, with coordinated actions that draw on the expertise of numerous government ministries, including those responsible for agriculture, education, environment, health, industry, natural resources, and research.
Second, the design and application of new or existing regulations should not lose sight of the impact on long-term national objectives and a given country’s biotech competitiveness. Regulators should constantly ask themselves how an existing or proposed piece of regulation would help (or hurt) the wider efforts of developing and building a competitive biotech sector. In this sense, unnecessary administrative burdens on research and industry should be continuously identified and removed; local innovation should be perceived broadly, and enabled through non-discriminatory, market-based incentives.
The ultimate objective of this series of reports is to provide government officials and policy-makers with evidence on the kind of reforms that will help them achieve their desired outcomes. Designing policies to foster innovation in biotechnology is not an easy task. But as this year’s edition of Building the Bioeconomy makes clear, the countries that will continue to enjoy the fruits of biotech innovation are the ones where forward-looking regulations (and the regulators behind them) act to encourage, and not hinder, innovation.

SECTION
10

BUILDING THE BIOECONOMY 5TH EDITION
11
INTRODUCTION1 “Pioneers and planners are, by nature, opposites. Pioneers must rebel and revolt against society to renew it. Planners try to relate the novel to the normal to provide continuity and growth”1
1.1 Pioneering and planning
Regulations need to strike a balance between protecting users and stimulating innovation, incorporating sufficient guarantees without dampening economic efficiency.
More than in other industries, for biotechnologies the interplay between innovation and regulation has important social and ethical implications. This is perhaps most notable with genetic engineering and food biotechnology. Research and developments in the former raise important ethical and social questions scientists, regulators and the general public grapple with; the interplay between science and broader social considerations is a delicate balance requiring thoughtful debate. Conversely, debate around ag-bio is more often than not absent of scientific considerations and instead devolves into political posturing based on prejudice rather than fact.
As this edition of Building the Bioeconomy finds, countries that are successful in finding the right balance between the regulatory arena and biotechnology innovation are more likely to achieve and sustain cutting edge biotech innovation, whether it be in the biopharmaceutical, industrial or agricultural space. For example, in the case of biofuels, concerns over their impact on the environment and agricultural land use are accelerating the shift to more innovative technologies and the phasing out of certain first-generation biofuels, such as palm oil in the EU. Data regulation is firmly making its way to the top of the list of policy priorities of life sciences businesses. In 2018 the EU and Israel have pivoted toward a comprehensive privacy regime aimed at achieving a balance between personal (data protection) and collective interests (new research opportunities, health system improvements and drives for commercial exploitation). Countries
with data infrastructure capacities and data governance frameworks that enable privacy-protective data use are better placed to benefit from the digital revolution. They will not only be able to promote health care quality and health system performance; they will also become a more attractive center for biomedical research, and gain opportunities to build public-private partnerships.
This edition of the Building the Biotechnology Report builds on the interrelatedness of the regulatory and technological realms, and its socio-economic implications, as the key to reading and understanding recent biotechnology policy developments.
1.2 Objectives of the 2018 edition
2018 marks the fifth edition of the Building the Bioeconomy series. Since 2013 it has taken the pulse of biotechnology policy frameworks by looking at their developments and overall performance in some of the major economies around the world. The overriding goal of this exercise has been to identify how successful biotechnology sectors can be built and sustained. In addition to mapping policy trends and monitoring changes, the last few editions of the report have also assessed how different economies are achieving their stated biotech goals. This is done through the Biotech Policy Performance Measure (the “Measure”), a comparison of economies on 20+ policy inputs and biotech outputs showing how individual economies’ policy environments affect their success or failure in creating thriving biotech sectors.
This year’s edition of the report adds another feature in the form of the creation of a “Policymaker’s Corner”. This is a separate stand-alone document complementing the top-down

12
1 INTRODUCTION
approach of Building the Bioeconomy with interviews with biotech policymakers from around the world. The Policymaker’s Corner adds the perspective of those officials and experts who are literally on the frontline in building the biotech sector in their respective economies. What do they feel is working for them? Where are they currently having success and how? And where are there still challenges to deal with?
1.3 Enabling factors for biotech success
Designing an environment that is conducive to the innovation, research, commercialization and marketing of biological products and technologies is not an exact science. Depending on the structure of a particular economy and its level of overall socio-economic development, different countries have greater or lesser needs in specific policy areas. Still, most countries that have been successful in creating an environment conducive to biotech innovation share some key enabling factors.2
The analysis and policy mapping of Building the Bioeconomy is built around seven enabling factors for biotechnology development that together create an environment conducive to biotech innovation. The factors range from the institutional and eco-system level (such as levels of tertiary education, technical skill and IP environment) to the more biotech specific (such as the type of biomedical and biotech R&D infrastructure in place and the availability of technology transfer laws and mechanisms). Together these factors create the conditions that give countries and policymakers the best chance of successfully developing their biotech capacity and promoting biotech innovation.
Below Table 1 provides an overview of these factors and a brief description of each.
Key enabling factors Explanation
Human capital A basic and fundamental building block for the biotech sector is the availability of high skilled and technically trained human capital. Without the right human capital it is virtually impossible to create the conditions in which biotech innovation can take place.
Infrastructure for R&D Combined with having adequate, educated and technically proficient levels of human capital, R&D infrastructure and capacity is critical to successfully fostering innovation and activity in high tech sectors including biotechnology. Without the necessary laboratories and clinical research facilities biotechnology R&D would be next to impossible.
Intellectual property protection
IPRs (including patents and regulatory data protection) are historically of real importance to the biotech and biopharmaceutical innovation process. For biopharmaceutical as well as non-pharmaceutical biological products and technologies the evidence suggests that IPRs incentivize and support the research and development of new biological technologies and products.
Regulatory environment
The regulatory and clinical environment in a given country or region plays an important role in shaping incentives for innovation and establishing adequate levels of quality and safety for biotech products, particularly biopharmaceuticals. A strong regulatory environment creates the conditions for the production and sale of high quality products and technologies.
Technology transfer Technology transfer is a critical mechanism for commercializing and transferring research from public and governmental bodies to private entities and private-to-private entities for the purpose of developing usable and commercially available technologies.
Market and commercial incentives
Market and commercial incentives range from general R&D incentives to specific policies aimed at biotech sectors such as pricing and reimbursement policies for biopharmaceuticals. For the biopharmaceutical sector incentives determined by pricing and reimbursement systems for medicines and health technologies can have a profound impact on commercial and market incentives for innovation in health and biotech R&D.
Legal certainty (including the rule of law)
The general legal environment including as it relates to the rule of law and the rule of law within a business context is crucial to commercialization and business activities.
TABLE 1 Seven enabling factors for biotechnology innovation

BUILDING THE BIOECONOMY 5TH EDITION
13
1.4 A wider sample of national biotech policies
This edition expands the analysis from 26 to 33 of the world’s major economies and aspiring biotech pioneers, providing a larger sample to examine the main global trends and developments. Below Table 2 lists the 33 countries included in this year’s report according to World Bank income level with the seven new countries highlighted in bold.
As in previous editions, newly added countries maintain the variety of sampled economies in term of geography, income and biotech developmental stage. Though at different stages of biotech development and with different starting points, all are undertaking efforts to develop their national biotechnology sector.
In Egypt, commercial biotech is barely nascent. Broadly speaking, the role of innovation in spurring economic growth is recognized in the 2030 Egypt Vision,3 and prompted by a number of initiatives and funds (also in partnership with the
EU). Yet, both overall and biotech specific R&D remains a limited activity in the Egyptian economy. For instance, pharmaceutical firm-level R&D intensity was found to be 1-2% of total spending, focused on the development of improved products or processes.4 The innovation ecosystem for biotech is unevenly developed. Regulations for drug approval have improved over the last years, with the launch of abridged and verification procedures; 5 guidelines on registration of biologic products6 and good clinical trial practices7 have also filled some important regulatory gaps. Yet in other key policy areas – including technical capacity and IP protection – Egypt has a long way to go.
Also in Vietnam, R&D still represents a peripheral activity, both in the business and public sector.8 However, the Government is stepping up efforts to increase the high-tech parts of the economy.9 Biotech research – focused mostly on agriculture and forestry – has been prioritized and intensified in the last decade.10 From an industrial perspective, Vietnam chiefly relies on
Lower-middle-income economies
Upper-middle-income economies
High-income economies
High-income OECD Members
Egypt Argentina Saudi Arabia Australia
India Brazil Singapore Chile
Indonesia China Taiwan Denmark
Vietnam Colombia UAE Finland
Costa Rica Ireland
Malaysia Israel
Mexico Japan
Peru New Zealand
Russia South Korea
South Africa Sweden
Thailand Switzerland
Turkey UK
US
TABLE 2 Building the Bioeconomy 2018 33 economies by World Bank income group
Source: World Bank (2017)

14
biotech for plant breeding, aquaculture and food processing, as well as vaccine developments. No overall biotech plan is in place, but the Vietnamese Government is working on a pharmaceutical strategy to turn the country into a regional manufacturing hub11 and increase local production to cover 80% of the domestic market.12
Costa Rica and Peru are upper-middle-income countries with similar challenges and a shared need to facilitate international tech transfer to mobilize innovation, boost productivity and avoid the middle-income trap. Yet, beyond these similarities, these two countries stand at the opposite ends of the innovation spectrum in Latin America. Together with Chile, Costa Rica tops Latin American countries in international innovation rankings13 and quality of research institutions.14 Costa Rica’s strengths lies in substantial investment in education and well-developed research capacities in the agro-bio field and medical devices.15 This is in large measure thanks to dedicated research centres such as the National Center for Biotech Innovation, the National Center for Sciences and Food Technology and the Biotech Research Center.16 Biopharmaceutical R&D activities are only emerging, but have some niche areas of interest.17 Yet, important loopholes exist on IP protection, with patent linkage de facto unavailable and only a limited term for patent restoration available.18 The Government is stepping up efforts to develop a national bioeconomy policy, under the guidance of the Ministry of Science, Technology and Telecommunications and following recommendations from the OECD.19 The 21st Century Strategy to turn the country into a developed economy by 2050 places Biotechnology as a pillar of Costa Rican development.20
In contrast Peru’s national innovation system and biotechnology focus is embryonic and its business innovation capacity underdeveloped. Like Costa Rica, Peru has recognized the value of its outstanding biodiversity. Peru issued the National Transversal Biotechnology Program 2016-2021 (PRONBIOTEC) to drive research and tech transfer on biotech applied to animal and plant improvement, microorganisms, molecules, and animal and human health.21 But overall, Peru’s
innovation and technological performance lags behind peer economies within and outside the region.22
Biology-based industries account for 60% of GDP in New Zealand,23 with agricultural biotechnology taking up the largest share.24 The country released its current Biotechnology Strategy back in 2002.25 More recently, the Government has been raising R&D spending26 and adopting sector strategies to direct and organize research. One of these, the 2017 Health Research Strategy,27 sets a vision that, by 2027, New Zealand will have a world-leading health research and innovation system.28 Strong research and clinical capacities constitute the country’s biotech strengths. Shortcomings are linked to limited private investment, notably from foreign investors; an IP environment that trails compared to countries with similar innovation ambitions and potential; and, for biopharmaceuticals, a strict pricing and reimbursement environment.29
In innovation-driven economies such as Sweden and Finland, well-developed governance structures and bottom-up strategic visions ensure close collaboration between industry, academia and public institutions. There is also sustained and significant investment in research infrastructure and human capital.30 In Sweden, the Innovation Council Life Science Cooperation Program and a national Coordinator for Life Science are specifically tasked to improve the life-sciences ecosystem. Finland proactively supports biotech innovation through a deep network of strategic documents that both take a large look at the bio-economy as a whole (e.g. the 2014 Bio-Economy strategy) and focus efforts towards areas of strengths, such as forestry biomass and med-tech.31 Both countries aim at using biofuels as a larger share of their national fuel mix than that mandated by EU regulations.32 Sweden’s well-established pharmaceutical industry has facilitated the development of strong biopharmaceutical capacities. Innovative products and blockbusters such as the asthma medicines Bricanyl and Pulmicort, the growth hormone Genotropin, and the stomach ulcer drug Losec are all Swedish innovations. In contrast, Finland in the biopharmaceutical space is somewhat of an outlier among developed OECD economies for having
1 INTRODUCTION

BUILDING THE BIOECONOMY 5TH EDITION
15
disregarded the rights of pharmaceutical product patents filed prior to 1995. These products were granted inferior protection through ‘analogy process patents’, the last of which will expire in 2019.33 As a consequence, originators have been subject to reference pricing and generic substitution, resulting in rapid price erosion both in Finland and other EU members that reference its prices.34 As concerns reimbursement, innovative solutions such as adaptive reimbursement are being implemented parallel to more punitive measures.35
1.5 Report overview
The report consists of three main sections.
Section 2 provides a thematic analysis and overview of the past year in biotechnology. It identifies some common threads across recent policy developments in the countries analyzed, and sheds light on how the interplay between innovation and regulation unfolds in each of them. How are regulatory biotech developments tackling the main constraints for innovators? Are they prompting or dissuading faster technological advances? What can countries learn from each other?
Section 3 describes the Biotech Policy Performance Measure, it explains the 28 indicators included and provides an overview of all the underlying data that feeds into the Measure. What do the results of the Measure tell us about best practices for enabling biotech innovation in the 33 economies sampled? What can these economies learn from it and what does it mean for other economies not included in Building the Bioeconomy but aspiring to develop their biotech capacity? (The full results including all the underlying data for each of the 28 indicators for each economy is included in an accompanying Annex.)
Section 4 ties together the analysis and data-based insights of the preceding sections and presents the main conclusions from five years of Building the Bioeconomy series, using examples from recent reform efforts in the 33 countries sampled. Amid a growing number and type of policy initiatives, what are the ingredients to successful biotech policy reforms? Have any of the core insights from the series changed as the number of economies examined has grown from single digits to over thirty?
The “Policymaker’s Corner” is provided in a separate stand-alone sister document.

SECTION
16

BUILDING THE BIOECONOMY 5TH EDITION
17
INNOVATION VERSUS REGULATION? THE WORLD IN BIOTECH IN 2017-182The interplay of innovation and regulation shapes industries, determining new winners, winning strategies and investment routes. The relationship is mutual and dynamic, and understanding it is crucial to successful reform efforts.36
This section provides an overview of the policy trends that have shaped the biotech industry in 2017-2018 read through the lens of the interplay between innovation and regulation. How are regulatory biotech developments tackling the main constraints for innovators? Are they prompting or dissuading faster technological advances?
Friends or foes? Regulation and innovation
Economic and business history teaches us that regulatory reforms more often than not play catch-up by reactively responding to technology developments that modify the cost structure and competition dynamics in a given industry. For instance, for over 20 years, digital trailblazers have revolutionized the ICT industry and constantly outpaced regulatory regimes. Technology has blurred the boundaries between different service providers and has led to new multimedia products at the juncture of telecommunications, computing and entertainment. Nowadays a similar pattern is seen in healthcare, where on the back of digital advances actors from adjacent industries such as software and data analytics are joining traditional health technology providers to offer integrated services and therapies beyond ‘the pill’.
At the same time, while they are often reactive rather than proactive, regulatory reforms do affect innovation. They can boost it, and prompt creation of new products and even of entire economic segments, as in the case of the “environment industry”. However, they can also put a damper on innovation, for instance by increasing the uncertainty and cost of the development process. Innovation-led growth is a strategic (and in many cases existential) goal of more and more economies around the world. Gulf countries such as Saudi Arabia and the UAE are betting
on becoming 21st century knowledge-intensive, high-tech economies so as to reduce their oil-dependency. Turkey has set a target of becoming one of the 30 most innovative nations by 2023.37 Malaysia has recognized the capacity to translate innovation into wealth as one of the game changers needed to achieve high-income status by 2020.38 Similarly, Colombia aims at becoming, by 2032, one of the three most competitive countries in Latin America through the export of high added value goods and innovation.39 Yet, heavy handed or poor regulations often put these objectives out of reach. In a context where economies compete to attract high-value, high-risk investment, unclear regulatory, fiscal and business frameworks divert investment, hinder entrepreneurship and prevent job creation.40
As the following country and thematic examples illustrate, the ability – and in most cases the inability – to translate socio-economic lofty ambitions to concrete real-world outputs in biotech is often the result of a lack of appreciation and understanding of the interaction between regulation and innovation.
2.1 The rise of China
Over the past two decades, China has made massive gains in terms of its science, technology and innovation capacity. There has been tremendous growth in the number of university graduates, particularly in science and engineering. China today is the world’s number-one producer of undergraduates with degrees in science and engineering. These fields account for 49% of all degrees obtained in the country.41 Between 2000 and 2012, the number of S&E bachelor’s degrees awarded in China rose more than 300%, from 300,000 to 1.3 million, significantly faster than in any other country.42 China also produces a very

18
2 INNOVATION VERSUS REGULATION? THE WORLD IN BIOTECH IN 2017-18
high number of doctoral degrees in science and engineering, surpassing the United States as the world’s largest producer of natural sciences and engineering doctoral degrees in 2007.43 In 2012 this was close to 32,000 degrees, up from 6,000 in 1998. China is estimated to have one of the highest numbers of life sciences graduates in the world, and a large number of Western educated life sciences PhDs (80,000 by 2010) have returned back to China to work in industry and academic research.44 Similarly, as a percentage of GDP R&D spending in China is quite high compared to other countries. 2014 figures show R&D spending as a percentage of GDP at 2.05%,45 which is greater than many higher income countries such as the UK (1.70%) as well as the estimated EU28 average (1.94%).46 Chinese R&D spending is largely made up of industry spending.
With respect to biotechnology, public authorities have invested circa USD100billion and created over 100 life science parks across the countries to achieve the goal of generating 4% of GDP from biotechnologies by 2020.47 And biotechnology remains a key strategic industry identified by the Chinese Government as part of the national development plan. Over the last year life sciences investment, partnership deals and venture capital funding have grown exponentially, as the Chinese Government has prioritized biotechnologies and taken significant steps to upgrade the country’s biotech policy environment.48 Investors have taken note of key reforms to promote innovation, fill some of the major regulatory gaps and bring China’s regulatory and legal environment closer to that of mature biotech markets. In 2017 Chinese biotech companies attracted investment worth USD10billion.49 China’s venture capitalists are also raising large amounts of money for life sciences, which they also increasingly inject abroad to underpin tech transfer efforts.50 With a strong stream of investment some Chinese biotech companies are breaking new grounds in areas such as cell therapies and gene editing.51 China and the US filed approximately the same number of CRISPR technology patents in 2016.52
In the first three months of 2018, a third of US life science venture capital, corresponding to USD1.45 billion, came from China.53 In sum, the short-term effect of regulatory reforms – most notably on
IP and approval pathways – are helping push the country’s trajectory from a low added value manufacturer to an innovation and R&D based developer of proprietary products.
Indeed, what the last two years show is how fundamental changes to China’s innovation biotech policy environment, and in particular the adoption of more pro-innovation and pro-R&D reforms in the IP and regulatory space, are helping to mobilize increasing levels of investment and accelerating biotech outputs.
IP protection
The opinion on the reform of drug and medical device approval system (“Innovation Opinion”) issued October 2017 brings greater certainty and clarity for both innovative and generic drug manufacturers by creating a patent linkage system and introducing a clearly defined RDP term.54 The scope of RDP protection under the current legal framework is unclear and often misinterpreted. Article 18 of the Opinion explicitly expands RDP to cover biologics, orphan drugs, and pediatric drugs (with no requirement that these be limited to those first launched in China, as in the existing mechanism). At the time of research the latest Draft on Implementing Measures for Pharmaceutical Study Data Protection adds potential new concerns as to the fair treatment of foreign innovators.55 The Draft provides for a 12-year term of protection for innovative biologics; on par with current levels in the US and higher than currently provided in the EU. However, only drugs first filed in China will qualify for the full term. For other innovative biologics, protection will be curtailed in a regressive fashion that penalizes reliance on foreign clinical data. Specifically, innovative biologics will benefit from a RDP term of 3 years if their application is based uniquely on foreign clinical data; 6 years if the application includes supplementary studies on Chinese patients, and 7 to 11 years if it is based on multi-center clinical trial data. No protection will be granted for applications received 6 years after the first filing abroad. While more details on the scope of RDP and methods to apply for it are welcome, the Draft de facto precludes the strong benefits that a fair, longer RDP term would bring in terms of increasing China’s attractiveness

BUILDING THE BIOECONOMY 5TH EDITION
19
for biopharmaceutical innovators. Furthermore, product safety data are excluded from the scope of RDP, and protection can be revoked if the rights owner fails to market within one year from marketing approval.
As a first step towards establishing a fully-fledged linkage system, in December 2017 China launched its own ‘Orange Book”, the ‘Marketed Drug Catalogue”,56 covering information on patents and data exclusivity for 131 drugs as of April 2018 (both originator drugs and their generic substitutes).57 Article 16 of the Innovative Opinion provides for the notification of patent holders of applications of relevant follow-on drugs (in comparison to the publishing of applications under the existing system) within a set period. It also specifically permits the initiation of patent disputes once the patent holder is made aware of the application (instead of forcing patent holders to wait until the follow-on drug is marketed). Moreover, the measure indicates that approval of the follow-on product will not take place if, “within a certain period of time,” a patent dispute is not yet
resolved. Following that period, the CFDA can approve the product for marketing. Importantly, however, and in contrast to earlier CFDA proposals in 2017, the period for notifying the patent holder as well as the period for staying the approval are not provided in the opinion (the CFDA in its Circular n. 55 specified it as being 24 months).58
Finally, the State Council has announced that a 5-year patent term of restoration will be granted only to drugs launched simultaneously in China and globally;59 yet, further implementing rules are expected to clarify implementation of this measure.
Streamlined approval and reimbursement procedures
In addition to substantive reforms to its IP rights environment, China has also introduced new and significant changes to its regulatory procedures and pricing and reimbursement policies. In both areas, reform efforts are likely to have a positive impact on biopharmaceutical innovation.

20
To begin with, the ‘Innovation Opinion’ adds a priority review for new oncology drugs and conditional approval for drugs and medical devices that fulfill unmet medical needs and have early and intermediate phase clinical trials that show positive results.60 This aims at reducing the administrative burden for drug approval and closing the innovation gap with developed drug markets. Indicatively, from 2001 to 2016 China approved four times fewer new drugs than Western countries.61
Secondly, with regards to reimbursement, China is moving towards a more efficient and predictable listing system. Indeed, the State Council has announced that imported innovative drugs will be listed for reimbursement in the Basic Medical Insurance on a rolling basis.62 This comes in parallel to other measures that level the playing field for imported innovative products, such as the removal of tariffs on imported drugs,63 and follows positive steps taken in 2017 to ensure reimbursement lists respond to patients’ need for new treatments.64
2.2 Shaking the fundamentals of IP protection
IP rights are historically of real importance to the biotech and biopharmaceutical innovation process.65 The market exclusivity period they provide gives firms upfront the protection and incentive needed to recoup R&D investment. Looking at the direct link between biotechnology and biopharmaceutical innovation and the strength of IP protection, the 2018 edition of the US Chamber of Commerce’s International IP Index finds that economies with robust IP protection are twice as likely to provide environments that are conducive for biotech innovation and experience on average 12 times more clinical research on biologic therapies.66
Yet, recent decisions and new policies in both established and aspiring global innovation leaders are weakening and reducing the scope of IP based incentives.67 This is not the first time the weakening of IP rights is a theme discussed in the Building the Bioeconomy series. Unfortunately, it seems that this is one of the enabling factors that many economies find difficult to recognize
as a critical piece in developing an environment that is conducive to innovation and R&D. What is slightly different this year versus previous editions of Building the Bioeconomy is how the weakening of the principle of IP rights is taking place in some of the countries that have benefited the most from clear and unambiguous IP based incentives.
Most striking of all is that the EU Commission has introduced a legislative proposal to provide European manufacturers of generic drugs and biosimilars with an SPC manufacturing exemption.68 The overriding purpose of the proposal is, by weakening IP protection for innovators, to provide European manufacturers of generic drugs and biosimilars a competitive advantage. Unfortunately, the Commission appears to have lost sight of the fact that IP incentives, including SPC protection, have been central to the success of Europe’s research-based biopharmaceutical industry. As an industry the research-based biopharmaceutical sector is one of Europe’s biggest success stories. European companies are some of the largest, most innovative and successful in the world. Not only does this industry have a long track record of producing life-saving medical innovations that have been or are currently being used by millions of patients across the world but they are also an economic engine. The latest figures from the European Federation of Pharmaceutical Industries and Associations show that in 2015 the European research-based industry provided nearly 740,000 direct jobs (with over 113,000 in high-skill R&D jobs), over EUR33.5 billion in R&D investments, and over EUR238 billion in production in 2015 alone. There are many troubling assumptions underlying the Commission’s proposal. First and foremost is that there is an actual market and demand for European generic manufacturers’ products. The markets that per definition will be targeted by European generic manufacturers under an SPC exemption are markets that do not provide IP protection and exclusivity for products under SPC protection in the EU for which the SPC exemption would apply. It would follow that in all likelihood generic follow-on products are already on the market in many of these countries and, critically, are being produced by local manufacturers who are often preferred partners in local drug procurement. One notable underlying
2 INNOVATION VERSUS REGULATION? THE WORLD IN BIOTECH IN 2017-18

BUILDING THE BIOECONOMY 5TH EDITION
21
assumption of the modeled estimates of economic gains resulting from an SPC exemption that the Commission is relying on is that it would grant the European generic and biosimilar manufacturers an exclusive status for early market entry of their products across the globe. But the economic gains described by the Commission and other studies do not fully take into account the possibility that other countries may seek to emulate this IP carve-out in order to boost economic growth by allowing their domestic generic industry to compete for a share in this new global market. In fact the obvious response to an EU SPC exemption is other countries asking themselves: “If the European Union is weakening IP standards to benefit their domestic industries why shouldn’t we?” And so instead of benefiting the European generics industry it is much more likely that other countries emulate Europe and there is a race towards the bottom in weakening global IP standards. The overall net effect of the SPC exemption may thus be a limited (if any) gain to the European generics industry and a weakening of the research-based industry through a direct loss of sales and a collective weakening of the global IP environment.
Similarly, Korea – a country that by and large has had a fairly robust and consistent IP rights framework in place for many years – has in 2017-18 introduced measures that weaken biotech IP protection. For instance, the recent decisions by
the Intellectual Property Trial and Appeal Board of Korean Intellectual Property Office and the Patent Court considerably curtail patent term restoration for biopharmaceuticals.69 These decisions are based on a strict interpretation of the relevant term restoration regulations that limit its application to only the approved drug product itself and not to the patented invention. This opens the way to marketing during the extension term of follow-on, patent-infringing products based on a different form of the same ingredient.
Finally, in March 2018 South Africa approved its long-awaited IP policy. It is a positive step that the Government of South Africa recognizes the need for reform to its national IP environment and the value of consulting all stakeholders in that process. Unfortunately, the IP Policy (just as preceding draft polices and related documents) focuses on ways in which South Africa could better access existing and developed forms of IP rather than on the manner in which intellectual property can be created, commercialized and become an industrial asset. For all economies – emerging and developed alike – what drives innovation, technological advances and ultimately economic development and growth is the creation of new forms of intangible assets and IP. Yet the Policy is relatively silent on this. Instead, it proposes to introduce new standards of patentability; change the existing framework for the issuing and use

22
of compulsory licenses; introduce the use of parallel importation for medicines; and ceate a pre- and post-grant opposition mechanism. There remains a great deal of uncertainty as to what specifically these policy changes will amount to. For example, on the issue of patentability criteria the Policy states that TRIPS article 27.1 (and related articles) “gives a country such as South Africa the flexibility to interpret and implement the patentability requirements in a manner consistent with its constitutional obligations, developmental goals, and public policy priorities. Amongst other things, this would include the adoption of patentability criteria that address the country’s public health and environmental concerns, as well as industrial policy objectives.”70 The Policy is silent on what these “constitutional obligations, developmental goals, and public policy priorities…[and] concerns” are. But defining patentability under such broad policy terms and
goals seems to be outside the scope of existing international practices as used for example in Europe or the US. Similarly, with respect to the issue of compulsory licensing it is unclear exactly what the purpose of the new Policy is. The Policy states that “In order to promote the sustainability of supply, it is important to ensure that a workable compulsory licensing system is in place to achieve affordability of essential goods, and restrain anti-competitive practices, as the need arises. One such instrument recognized by international law is compulsory licensing.”71 TRIPS Article 31, including the amendments introduced in the 2001 Doha Ministerial Declaration, and subsequent General Council decision allowing the export of medicines produced under a compulsory license (outlined in Paragraph 6), form the international legal grounds for compulsory licensing for medicines. The Chairman’s statement accompanying the General Council decision (concerning Paragraph
2 INNOVATION VERSUS REGULATION? THE WORLD IN BIOTECH IN 2017-18

BUILDING THE BIOECONOMY 5TH EDITION
23
6 of the Doha Declaration) underscores that these provisions are not in any way intended for industrial or commercial objectives, and if used, it is expected that they would solely be aimed at protecting public health. And Article 31 and the Doha Declaration suggest that compulsory licensing represents a “measure of last resort,” intended primarily for public health and humanitarian emergencies such as pandemics, and to be used only after all other options for negotiating pricing and supply have been exhausted. It is unclear how both “sustainability of supply” and “affordability” are related to such public health emergencies. Overall it is difficult to see how this new IP Policy provides incentives or will make it easier to invest, innovate and create new products and technologies in South Africa. In this sense, it is unlikely that any of these measures – independently or in aggregate – will help South Africa “transition towards a knowledge economy” as the Policy hopes.
2.3 Managing pricing and access constraints: new ways out and old dead ends
Biopharmaceutical pricing and reimbursement policies are perhaps the most common set of policies used by payers (government or private) to control the cost of medicines. Whether it be advanced healthcare systems such as in Europe, where the majority of countries have highly technical measures in place, or emerging markets such as Brazil where public payers set the price for pharmaceuticals, pricing and reimbursement policies are used in all types of health care markets. Apart from direct pricing of pharmaceuticals, the regulation of pharmacy remuneration and profits is common practice. Many payers have reimbursement lists or national formularies, either positive or negative – that is, describing either which medicines are to be reimbursed (a positive list) or those that are not to be reimbursed (a negative list). Payers also tend to have in place systems of internal reference pricing i.e. setting a maximum reimbursement amount for a group of pharmaceuticals that have been defined as being interchangeable. And in many countries payers make use of international price referencing or comparisons to set the maximum price for a pharmaceutical drug.
Many of these policies focus narrowly on cost containment: mandating prices, favoring generics, and restricting the ability to promote innovative medicines. For instance, patented drug prices are in many countries compared to and linked to prices of off-patent and generic products or subject to ad hoc price cuts.72 The use of such policies means there is less focus on understanding costs and benefits within a broader health system analysis or rewarding medical innovation. For example, given the high development costs new medical innovation and treatment may be more expensive, but the overall cost savings to a given health system resulting from the higher therapeutic benefit (through for example, reduced rates of hospitalization and medical visits) provided by a new treatment may very well outweigh the higher initial outlay for innovative treatments. As national populations around the world age and demands on health systems increase, all payers and health care providers grapple with rising costs. In some cases, new innovative financing mechanisms and solutions are emerging. For example, the availability of larger patient and health data sets (including on outcomes) and the closer interaction between health system stakeholders (primarily payers, patients, providers and biopharmaceutical manufacturers) are resulting in new innovative solutions that overcome budgetary constraints.
Alternative payment schemes aimed at realising savings by paying for value instead of quantity have gained steam in 2017, including for expensive innovative treatments such as gene-therapy,73 and are expected to exponentially increase their share out of total payment contracts.74 Such outcome-based contracts reward cross-organizational performance against a common set of outcomes based on indicators such as survival rates, time to recovery and sustainability of recovery.75 They are based on the capacity to track performance during the contract period, which fuels the need for more and more complex data.76 President Trump’s blueprint to lower drug prices included among other actions a larger role of paying for value schemes such as outcome-based payments in Medicare and Medicaid.77
Yet, instead of reforming and introducing new financing mechanisms and innovative solutions
24
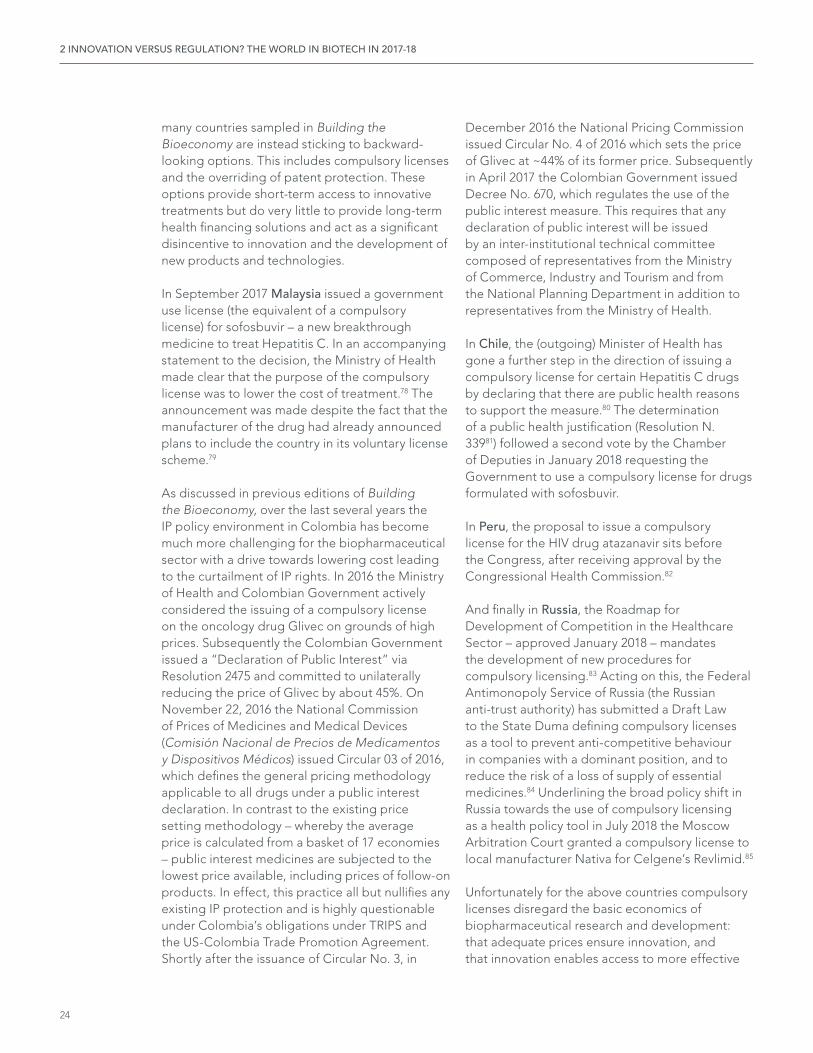
many countries sampled in Building the Bioeconomy are instead sticking to backward-looking options. This includes compulsory licenses and the overriding of patent protection. These options provide short-term access to innovative treatments but do very little to provide long-term health financing solutions and act as a significant disincentive to innovation and the development of new products and technologies.
In September 2017 Malaysia issued a government use license (the equivalent of a compulsory license) for sofosbuvir – a new breakthrough medicine to treat Hepatitis C. In an accompanying statement to the decision, the Ministry of Health made clear that the purpose of the compulsory license was to lower the cost of treatment.78 The announcement was made despite the fact that the manufacturer of the drug had already announced plans to include the country in its voluntary license scheme.79
As discussed in previous editions of Building the Bioeconomy, over the last several years the IP policy environment in Colombia has become much more challenging for the biopharmaceutical sector with a drive towards lowering cost leading to the curtailment of IP rights. In 2016 the Ministry of Health and Colombian Government actively considered the issuing of a compulsory license on the oncology drug Glivec on grounds of high prices. Subsequently the Colombian Government issued a “Declaration of Public Interest” via Resolution 2475 and committed to unilaterally reducing the price of Glivec by about 45%. On November 22, 2016 the National Commission of Prices of Medicines and Medical Devices (Comisión Nacional de Precios de Medicamentos y Dispositivos Médicos) issued Circular 03 of 2016, which defines the general pricing methodology applicable to all drugs under a public interest declaration. In contrast to the existing price setting methodology – whereby the average price is calculated from a basket of 17 economies – public interest medicines are subjected to the lowest price available, including prices of follow-on products. In effect, this practice all but nullifies any existing IP protection and is highly questionable under Colombia’s obligations under TRIPS and the US-Colombia Trade Promotion Agreement. Shortly after the issuance of Circular No. 3, in
December 2016 the National Pricing Commission issued Circular No. 4 of 2016 which sets the price of Glivec at ~44% of its former price. Subsequently in April 2017 the Colombian Government issued Decree No. 670, which regulates the use of the public interest measure. This requires that any declaration of public interest will be issued by an inter-institutional technical committee composed of representatives from the Ministry of Commerce, Industry and Tourism and from the National Planning Department in addition to representatives from the Ministry of Health.
In Chile, the (outgoing) Minister of Health has gone a further step in the direction of issuing a compulsory license for certain Hepatitis C drugs by declaring that there are public health reasons to support the measure.80 The determination of a public health justification (Resolution N. 33981) followed a second vote by the Chamber of Deputies in January 2018 requesting the Government to use a compulsory license for drugs formulated with sofosbuvir.
In Peru, the proposal to issue a compulsory license for the HIV drug atazanavir sits before the Congress, after receiving approval by the Congressional Health Commission.82
And finally in Russia, the Roadmap for Development of Competition in the Healthcare Sector – approved January 2018 – mandates the development of new procedures for compulsory licensing.83 Acting on this, the Federal Antimonopoly Service of Russia (the Russian anti-trust authority) has submitted a Draft Law to the State Duma defining compulsory licenses as a tool to prevent anti-competitive behaviour in companies with a dominant position, and to reduce the risk of a loss of supply of essential medicines.84 Underlining the broad policy shift in Russia towards the use of compulsory licensing as a health policy tool in July 2018 the Moscow Arbitration Court granted a compulsory license to local manufacturer Nativa for Celgene’s Revlimid.85
Unfortunately for the above countries compulsory licenses disregard the basic economics of biopharmaceutical research and development: that adequate prices ensure innovation, and that innovation enables access to more effective
2 INNOVATION VERSUS REGULATION? THE WORLD IN BIOTECH IN 2017-18

BUILDING THE BIOECONOMY 5TH EDITION
25
treatments in the long run. Adequate drug prices (and the market exclusivity underpinning them) are the engine of innovation and the key to the long-term viability of medical innovation. Consequently, as health and pharmaceutical policy, compulsory licenses do nothing to solve the broader and long-term issue of access to new innovative treatments within more comprehensive health system reforms.
In the US, a major report by the CEA recognizes this basic fact and the need to ensure prices are sustainable for payers and sustain innovation, which is the key to containing future health costs.86 According to the report, these two goals are not mutually exclusive and can be achieved through a combined strategy that reduces prices at home through competition and limits under-pricing through free-riding abroad.
2.4 Speedier approval pathways gather steam globally
The interaction between regulators and innovation is perhaps at its keenest in the biopharmaceutical sector. As one of the world’s most heavily regulated industries – all marketed biopharmaceutical products must undergo extensive tests for safety and efficacy before market approval – the drug regulatory approval
process is a direct lever on access to new products and technologies. As the biopharmaceutical research and development process has evolved technologically and become more globalized, so too are drug regulatory authorities’ practices and procedures. More and more, drug regulators are responding to the rapid pace of innovation and unmet medical need by introducing accelerated and/or abbreviated market approval pathways. The exact form of such accelerated or abbreviated pathways varies from jurisdiction to jurisdiction. For example, in mature health markets regulatory bodies such as the US FDA and EMA have focused primarily on introducing accelerated and fast-track approval pathways for innovative treatments. Such regulatory pathways seek to provide patients with more rapid access to cutting edge and breakthrough treatments. Many DRAs are also introducing new regulatory pathways for experimental treatments, which are based on preliminary clinical research where a proposed drug has not undergone full clinical testing. In other markets accelerated regulatory pathways often take the form of abbreviated dossier reviews. This means that products that have already been approved by one or more stringent DRAs can be reviewed in a matter of months rather than years. The most common such pathways are through ‘verification’ and ‘abridged’ reviews.
Critically, timely regulatory reviews contribute to more rapidly spreading the benefits of therapeutic innovation across patients and healthcare systems. For biopharmaceuticals, the keys to unlocking the gains of medical innovation lay almost exclusively with regulators.
Like China, other emerging countries have recognized the importance of accelerating product registration and the benefits to patients, health systems and national economies of speedier product approval. The UAE in 2015 introduced a new fast track procedure for innovative medicines already approved by a stringent DRA including the US FDA and EMA.87 This has already led to a number of innovative and groundbreaking products being registered in the UAE within months of US or EU approval and made available to patients in the Emirates. In 2018 Ministerial Decree No. 28 further improved the accelerated approval system and established that

26
innovative drugs registered by only one accredited international regulatory authority have to be approved in the UAE within a total of 30 days.88
Similarly, Saudi Arabia and the Saudi FDA in February 2017 introduced two new expedited routes for product registration: a verification procedure and an abridged procedure. These pathways are in place for NCEs and biologics (excluding blood and vaccines) that:
• have been approved by both the FDA and the EMA (Verification Registration = 30 days)
• have been approved by the FDA or the EMA (Abridged Registration = 60 days)
To benefit from these accelerated procedures, an application to the SFDA needs to be submitted within two years of the date of marketing by the reference drug regulatory agencies. If applied and fully implemented these pathways will greatly accelerate market entrance for new innovative products. In 2013 the median review time by the
SFDA for NCEs was 372 working days (though more than 500 according to industry data), against a target of 290.89
Following the announcement by Saudi Arabia, Egypt announced that it would also provide a 30-day approval pathway for drugs approved by the FDA and EMA.90
Many mature markets are not resting on their laurels either, and are pushing through approval reforms meant to increase their performance and attractiveness. In Australia a provisional approval pathway for NCEs and new uses on the basis of early clinical data on safety and efficacy was launched in March 2018.91 Focusing on the bottleneck of reimbursement timelines, in the UK, one of the Life Sciences Sector Deal’s flagship initiatives is the Accelerated Access Pathway for transformative innovation.92 An Accelerated Access Collaborative will coordinate the selection of five drugs or medical devices to be fast-tracked for reimbursement, meaning NHS uptake could happen years earlier.93
2 INNOVATION VERSUS REGULATION? THE WORLD IN BIOTECH IN 2017-18

BUILDING THE BIOECONOMY 5TH EDITION
27
2.5 The shift towards second-generation biofuels
As with biopharmaceuticals, in the field of industrial biotechnology regulatory reforms and new biofuel policies around the world are influencing industrial choices, technological standards and consumer uptake. In the EU, revised rules are accelerating the shift from first to second generation (or advanced) biofuels to minimize indirect land-use. In January 2018 the European Parliament endorsed proposals to phase out palm oil from 2021, freeze consumption of other food crop-based biofuels at current levels (7% of transport fuels) and add a 10% blending obligation for advanced biofuels by 2030.94 India is soon to issue a new comprehensive biofuel policy to move towards second-generation biofuels and help the country reduce its energy import dependence.95 With the same goal in mind India in 2017 launched a draft bio-ethanol policy to increase capacity of second-generation bio-ethanol production from ligno-cellulosic biomass.96 In the US, President Trump has pledged to reform the 2005 Renewable Fuel Standard, which establishes a growing biofuel mandate and a credit trading system.97 At the time of research reform plans had been frozen.98 Another major economy and the second largest producer of biofuels in the world, Brazil, in December 2017 adopted its first National Biofuels Policy (RenovaBIO)99 aimed at increasing the production and use of biofuels to ensure energy security and reduce greenhouse gas emissions.100 Biofuels – mostly sugarcane ethanol – already constitutes roughly 16% of the total energy mix, and are thus well on track to achieve the goal of 18% by 2030.101 A 27% biofuels’ blend applies to gasoline, and in 2018 the biodiesel mandate has been raised from 8% to 10%.102 RenovaBio sets up new mechanisms that reward the most efficient and clean ways to manufacture biofuels.103 The policy mandates that fuel distributors gradually increase the amount of biofuels they trade each year, according to individualized, compulsory greenhouse gas emission reduction targets to be defined by the National Energy Policy Council.104 It also puts forward a system of biofuel certification and a mechanism of carbon credits granted to biofuel producers according to the proportion of clean energy they produce.105 In addition to ethanol and biodiesel, the policy also covers biogas, biomethane and aviation biokerosene.
2.6 Gene editing: a second looming ag-biotech revolution
Perhaps even more than for biopharmaceuticals and biofuels, in the realm of agricultural biotechnology antiquated and non-science based regulations stand in the way of millions of consumers around the world accessing and consuming ag-bio products. Unfortunately, 2017-8 saw the intensification of many of these policies particularly in mature markets. For example, a non-scientific based aversion to biotech crops persists in Europe and in some ways intensified. Indeed, a number of European economies in Building the Bioeconomy, including Denmark, Switzerland and Russia, have introduced wholesale or close to wholesale bans on biotech crops. And an April 2018 decision by the ECJ defined regulations on GMOs as “an integral part” of environmental law, entitling civil society groups to challenge the way GMOs are approved for market.106 Unfortunately, other economies are emulating these policies. For example, after tightening GMO labelling rules earlier in 2017, Korea’s Rural Development Administration stated that it would “not promote the production of genetically modified crops” and shut down its Genetically Modified Crop Development Project by the end of 2017.107
Yet, a bit of good news for ag-bio in Europe seems to be coming with regard to New Breeding Techniques such as the CRISPR/Cas9 gene-editing technique. Gene editing modifies an organism’s native genome instead of introducing foreign DNA sequences. As such, gene-editing techniques are cheaper and faster compared to previous forms of genetic engineering. More broadly, the introduction of this technique into modern agricultural production is said to have the potential to bring about a second ag-bio revolution. Remarkably, on this new technology Europe seems not to be willing to miss out. In a recent opinion the ECJ excluded gene-edited crops from the tough rules that govern GMOs.108
A number of other major markets are following suit and similarly encouraging the use of this technology through no or relatively light-touch regulation.

28
In the US the USDA recently gave its green light to using gene-editing techniques with little oversight needed.109 In its first case of genome edited food crop, the USDA refused to regulate a CRISPR-based mushroom less prone to browning.110
Sweden and Argentina were among the first to adopt policies that will make it easier to use this new technique. Both countries have introduced a regulatory framework for genome editing based on a case-by-case evaluation that regards gene editing as non-GM varieties unless a new combination of genetic material and transgenes are present.111 Brazil has also adopted a similar case-by-case approach through Normative Resolution 16 published in January 2018; though the document also includes a non-exclusive list of procedures that may create a product not considered a GMO.112 Similarly, Australia’s gene technology regulator has proposed deregulating gene-editing techniques.113
On the back of strong government support and limited regulations, China is seeking to take a technological lead in gene editing in crops and human medicines114 and was first to carry out CRISPR clinical trials,115 which recently received the first go-ahead also in Europe.116
2.7 The unfolding healthcare ‘4.0 revolution’
The digital revolution, powered by technological innovation such as the Internet of Medical Things’ (wearables), genomic profiling, and artificial intelligence, is enabling some of the major industrial shifts in the biopharmaceutical field. This includes: the move from a ‘blockbuster’ to a targeted, personalized treatment model; a more prominent role of patients; and an increasing emphasis on health and medical outcomes that is moving the focus from the sale and purchase of medical products to broader health solutions. Digital advances are affecting everything from basic discovery to reimbursement; and from diagnosis to disease management, particularly with regards to complex chronic diseases that have large populations, such as diabetes and asthma. They are also generating novel fields of treatments such as the use of genomic data to treat cancer, and bioelectronics, which cures diseases by targeting electronic signals in the body.117 Governments are investing to digitalize and integrate health records to fulfill the promise of registry-based research. In parallel, technology advances are leading to pressure for regulatory change; regulators are trying to leverage this new innovative areas through more flexible, adaptive pathways, as well as genomic and personalized medicine strategies. Niche, data-enabled sector strategies are becoming a new frontier of regulatory excellence.
In the US, the 21st Century Cures Act requires the FDA to consider additional uses of evidence drawn from real-world data for drugs and devices. These include replacing clinical trials with “real-world evidence” to support new indications. Guidelines for RWE use for medical devices have been issued in 2017;118 for biopharmaceuticals they are expected by 2021.119 The FDA is also looking to regulate digital products such as wearable devices and software that can improve treatment adherence.120
2 INNOVATION VERSUS REGULATION? THE WORLD IN BIOTECH IN 2017-18

BUILDING THE BIOECONOMY 5TH EDITION
29
In the EU, the EMA has developed and piloted an adaptive pathway approach for the use of real world data in complementing randomized clinical trials and accelerating market entrance of innovative drugs for unmet medical needs.
Biotech leaders across the globe, and particularly those with strong digital tech industries, are promoting reforms that streamline data management and upgrade infrastructure to spur research and industrial development in the sector.
Within the framework of a new digital health policy launched in March 2018, Israel will create a single national healthcare database and complement it with a bank of blood samples and tissue samples (biopsies) and a plan for a genetic information database.121 The US launched a landmark initiative on personalized medicines expected to enrol 1 million citizens – the ‘All of US’ Genomics Study.122 In Denmark, the Government and Danish Regions have developed a National Strategy for Personalized Medicine 2017-2020,123 and mention
digitalization in the Growth Plan for Life Sciences as one of the opportunities to improve the growth conditions of the life science industry.124 In Sweden, an initiative for precision medicine – Genomic Medicine Sweden – was launched in 2017 to accelerate the implementation of precision medicine.125 In order to leverage its world-class public biobanks and extensive healthcare registries, Finland issued a genome strategy126 and is setting up a National Genome Centre.127 The European Commission has also stepped up efforts to boost healthcare data sharing, with the goal of improving data use for cross-border research projects and healthcare reforms.128 Also, in Australia the “Australia 2030 – Prosperity through Innovation” document includes genomics and precision medicines as a key component of an innovative future.129 Finally, as mentioned, the UK’s Life Science Sector Deal130 prospects the creation of the largest repository of genetic sequences aligned with clinical and lifelong data in the world.131

SECTION
30

BUILDING THE BIOECONOMY 5TH EDITION
31
MEASURING POLICY IMPACT AND REAL-WORLD BIOTECHNOLOGY RESULTS – THE BIOTECH POLICY PERFORMANCE MEASURE3First featured in 2015 the Biotech Policy Performance Measure (the “Measure”) is at essence a way of illustrating the interaction between public policy and actual, real-world biotechnology outputs.
Originally the Measure was solely intended to provide readers a quick overview of a given economy’s policy framework and performance in relation to the other economies included in the report.
It consisted of some of the most important elements for each of the seven enabling factors delineated in the Building the Bioeconomy series. In 2016 the Measure was fundamentally revamped and significantly expanded to also take into account biotech outcomes. Indicators on biotechnology outputs measured covered a broad spectrum ranging from levels of total clinical trial activity, biologics clinical trials, scientific output, GM crops under cultivation, venture capital
attractiveness, biotechnology patenting, rates of university patenting, biopharma product launches and so forth.
This year builds on the work of previous editions. As in last year’s edition, the Measure examines a total of 28 indicators. These indicators are divided between 16 measures of policy inputs (as before related to the seven enabling factors) and 12 indicators of biotechnology outputs. Together these indicators provide a full and detailed measure of the complete biotechnology environment for a given economy.
As with previous editions the purpose of the Biotech Policy Performance Measure is not to benchmark individual countries to a pre-determined set of criteria; this is not a computational index. Rather, the purpose is to give readers (and the economies mapped) an idea of how a sample of their policy inputs (for each enabling factor), firstly, compares with the same policy inputs for the other economies sampled and, secondly, what type of actual biotech outcomes these policy inputs translate into.
3.1 Policy inputs
The Biotech Policy Performance Measure consists of two distinct halves: policy inputs and biotech outputs. Policy input indicators are drawn from the seven enabling factors. These are indicators that provide a sense of a given economy’s policies and direction under each of the enabling factors.
This year there are 16 policy input indicators measured; one more compared to last year’s edition. Below Table 3 shows all 16 indicators for the 7 enabling factors.

32
3 MEASURING POLICY IMPACT AND REAL-WORLD BIOTECHNOLOGY RESULTS – THE BIOTECH POLICY PERFORMANCE MEASURE
Factor 1: Human capital
Number of researchers per million population This indicator estimates the level of technical capacity and human resources available within a given country by measuring the number of researchers in R&D activities standardized per million population. This indicator is not biotechnology specific but covers all major forms of scientific and technical fields.132 The data is collected by the World Bank and forms part of the Bank’s World Development Indicators.
This data set includes all of the economies sampled in Building the Bioeconomy 2018 except Peru and Saudi Arabia. Equivalent data for Taiwan was collected from the Ministry of Science and Technology’s 2017 International Comparison of S&T Activities available on the Ministry’s website.
Life sciences graduates (PhD & Masters), per million population This indicator compares the number of post-graduate graduates in the life sciences for each of the sampled economies. This data provides an
indication of a given economy’s overall technical capacity for advanced R&D activities in the life sciences. This information is collected by the OECD and forms part of the OECD.Stat databank.
The number of life sciences graduates has been standardized for population to provide a more accurate reflection of intensity in a given economy regardless of population size.
This OECD dataset includes all of the economies sampled in Building the Bioeconomy 2018 except Argentina, China, Costa Rica, Egypt, Japan, Malaysia, Peru, Saudi Arabia, Singapore, South Africa, Taiwan, Thailand, the UAE and Vietnam. Data for Singapore was collected from the Yearbook of Statistics Singapore 2017 published by the Department of Statistics Singapore. Data for Taiwan was collected from the Ministry of Science and Technology’s 2017 International Comparison of S&T Activities available on the Ministry’s website.
Key enabling factors Indicators
Human capital • Number of researchers per million population
• Life sciences graduates (PhD & Masters), per million population
Infrastructure for R&D • R&D spending % of GDP
• BERD spending as a % of total R&D spending
• Total biotechnology R&D expenditure, millions USD PPP, per million population
• Biotech R&D as a percentage of BERD
Intellectual property protection
• Availability of regulatory data protection for submitted clinical data during the regulatory approval process
• Availability of Patent Term Restoration for biopharmaceuticals
• US Chamber of Commerce International IP Index 2017 life sciences score, standardized to %
Regulatory environment
• Existence of regulatory framework and efficiency
Technology transfer • University/PRO-industry technology transfer frameworks in place
• Global Innovation Index University/Business Collaboration score
• Private to private licensing and commercialization activity
Market and commercial incentives
• Biopharmaceutical pricing and reimbursement policies
• R&D tax incentives
Rule of law • World Justice Project Rule of Law Index country ranking
TABLE 3 Biotech Policy Performance Measure, policy input indicators

BUILDING THE BIOECONOMY 5TH EDITION
33
Factor 2: Infrastructure for R&D
R&D spending % of GDP This indicator measures the investment into R&D taking place in each economy as a percentage of that economy’s GDP. This indicator is not biotechnology specific but covers all major forms of scientific and technical fields.133 The data is collected from the World Bank World Development Indicators and OECD.Stat.
This dataset includes all of the economies sampled in Building the Bioeconomy 2018.
BERD spending as a % of total R&D spending This indicator measures the investment into R&D taking place by business and private sector enterprise in each economy as a percentage of the total expenditure on R&D. High levels of BERD suggest a higher propensity for private sector investment and commitment to innovation and creating new processes, products and technologies for commercialization. This indicator is not biotechnology specific but covers all major forms of scientific and technical fields. The data is collected from the OECD.Stat databank.
This data set includes all of the economies sampled in Building the Bioeconomy 2018 except Brazil, Colombia, Costa Rica, Egypt, India, Indonesia, Malaysia, Peru, Saudi Arabia, Thailand, the UAE and Vietnam.
Total biotechnology R&D expenditure, millions USD PPP, per million population This indicator measures R&D expenditure that is specific to the biotechnology field. The amount of R&D investment has been standardized for population to provide a more accurate reflection of intensity in a given economy regardless of population size. The data is collected from the OECD.Stat databank and forms part of its “Key Biotech Indicators” measure.
This data set includes all of the economies sampled in Building the Bioeconomy 2018 except Argentina, Brazil, Chile, China, Colombia, Costa Rica, Egypt, India, Indonesia, Malaysia, New Zealand, Peru, Saudi Arabia, Singapore, Taiwan, Thailand, Turkey, UAE, UK and Vietnam. Data for Taiwan was collected from the Ministry of Science
and Technology’s 2017 International Comparison of S&T Activities available on the Ministry’s website. The data for Taiwan was not standardized for purchasing power parity but is in current USD at current exchange rates.
Biotech R&D as a percentage of BERD This indicator measures R&D expenditure specific to the biotechnology field as a percentage of overall business enterprise R&D spending. The data is collected from the OECD.Stat databank and forms part of its “Key Biotech Indicators” measure.
This data set includes all of the economies sampled in Building the Bioeconomy 2018 except Argentina, Brazil, Chile, China, Colombia, Costa Rica, Egypt, India, Indonesia, Malaysia, New Zealand, Peru, Saudi Arabia, Singapore, Taiwan, Thailand, Turkey, UAE, UK and Vietnam.
Factor 3: Intellectual property protection
Availability of regulatory data protection for submitted clinical data during the regulatory approval process This indicator measures the availability of regulatory data protection for submitted clinical data during the regulatory approval process.
Availability of patent term restoration for biopharmaceuticals This indicator measures the availability of a term of patent restoration for biopharmaceuticals due to delays caused during the sanitary regulatory review process.
US Chamber of Commerce International IP Index 2018 life sciences score, standardized to % This indicator measures the availability and enforcement of IPRs related to the life sciences sector. This is a composite measure based on an aggregation of 12 indicators included in the International IP Index 2018.
All three above indicators are drawn from the US Chamber of Commerce International IP Index 2018.
The International IP Index includes all of the economies sampled in Building the Bioeconomy

34
2018 except Denmark and Finland. Information for the first two indicators relating to RDP and PTE are drawn from public legal sources for both countries.
Factor 4: Regulatory environment
Existence of regulatory framework and efficiency This indicator seeks to measure all aspects of the regulatory framework in place for all biotech sectors from product approval and manufacturing standards to clinical standards for biopharmaceutical R&D. This incudes, for instance, the speed of market authorization for biotechnology products; patent office backlogs; the existence and efficiency of an ag-bio framework; and the existence of a biosimilars pathway in line with international standards. Each economy sampled in Building the Bioeconomy 2018 is evaluated individually on a qualitative basis.
Factor 5: Technology transfer
University/PRO-industry technology transfer frameworks in place This indicator examines the existence and extent of technology transfer frameworks and operational arrangements in a given economy that aim to facilitate the development and commercialization of technologies developed within public sector entities. Each economy sampled in Building the Bioeconomy 2018 is evaluated individually on a qualitative basis. This indicator is not biotechnology specific.
University/Industry research collaboration This indicator examines the level of collaboration between business and universities on R&D, as measured by the World Economic Forum’s Global Competitiveness Index 2017. This indicator is not biotechnology specific. This data set includes all of the economies sampled in Building the Bioeconomy 2018 except Taiwan.
Private to private licensing and commercialization activity This indicator measures the existence of barriers to private entity licensing and commercialization activities in a given economy. The data is collected from “Indicator 25: Regulatory and administrative barriers to the commercialization of IP assets” in
the US Chamber of Commerce International IP Index 2018. This indicator is not biotechnology specific.
Factor 6: Market and commercial incentives
Biopharmaceutical pricing and reimbursement policies This indicator examines the commercial incentives provided through existing biopharmaceutical pricing and reimbursement policies. For the biopharmaceutical sector market and commercial incentives are primarily determined by the existing pricing and reimbursement systems for medicines and health technologies. The manner and extent to which these policies are put in place can have a profound impact on the commercial and market incentives for innovation more broadly in the health sector as well as for biotechnology R&D. Each economy sampled in Building the Bioeconomy 2018 is evaluated individually on a qualitative basis.
R&D tax incentives This indicator examines the tax incentives available and provided in a given economy as a means of encouraging R&D. R&D incentives can be various tax incentives, credits, deductions, lower rates of taxation for specific forms of income (e.g. income derived from IP assets such as patent box schemes) and/or direct support mechanisms such as grants and subsidies for R&D activities. In some countries R&D tax incentives are in place that target biotechnologies and/or biopharmaceutical innovation. Each economy sampled in Building the Bioeconomy 2018 is evaluated individually on a qualitative basis.
Factor 7: Rule of law
World Justice Project Rule of Law Index country ranking This indicator examines the legal certainty in a given economy as measured by the World Justice Project’s Rule of Law Index. This indicator is not biotechnology specific.
3 MEASURING POLICY IMPACT AND REAL-WORLD BIOTECHNOLOGY RESULTS – THE BIOTECH POLICY PERFORMANCE MEASURE
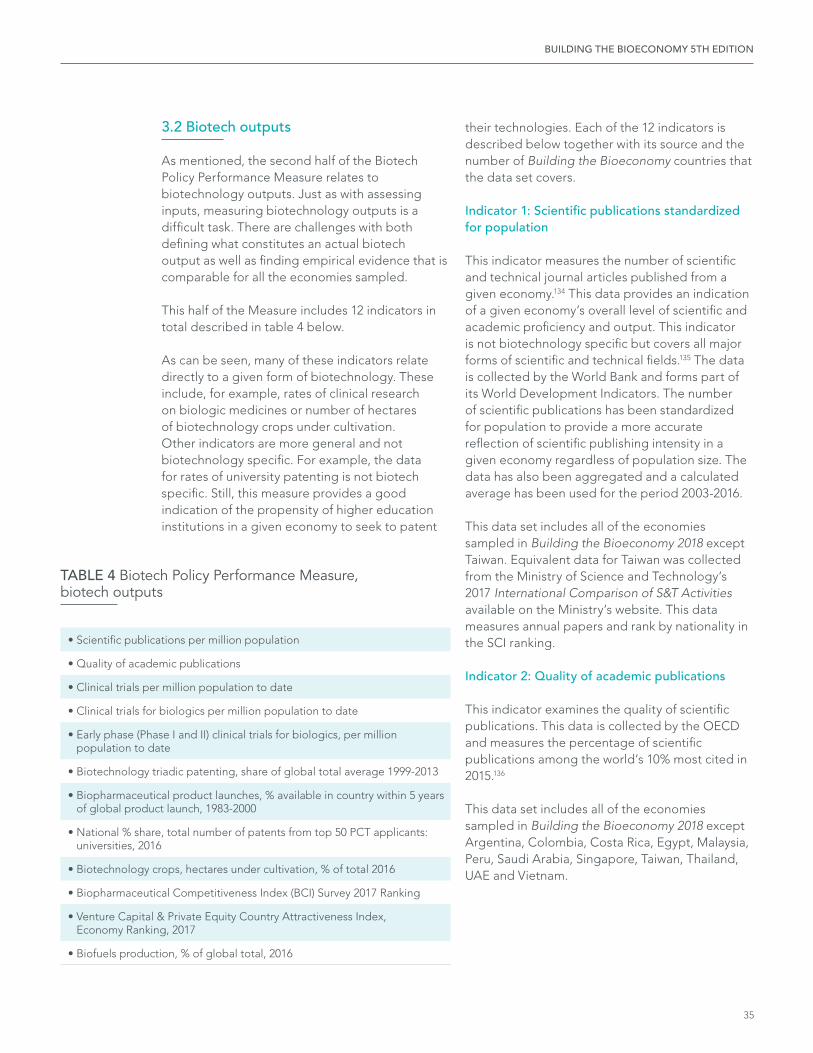
BUILDING THE BIOECONOMY 5TH EDITION
35
3.2 Biotech outputs
As mentioned, the second half of the Biotech Policy Performance Measure relates to biotechnology outputs. Just as with assessing inputs, measuring biotechnology outputs is a difficult task. There are challenges with both defining what constitutes an actual biotech output as well as finding empirical evidence that is comparable for all the economies sampled.
This half of the Measure includes 12 indicators in total described in table 4 below.
As can be seen, many of these indicators relate directly to a given form of biotechnology. These include, for example, rates of clinical research on biologic medicines or number of hectares of biotechnology crops under cultivation. Other indicators are more general and not biotechnology specific. For example, the data for rates of university patenting is not biotech specific. Still, this measure provides a good indication of the propensity of higher education institutions in a given economy to seek to patent
their technologies. Each of the 12 indicators is described below together with its source and the number of Building the Bioeconomy countries that the data set covers.
Indicator 1: Scientific publications standardized for population
This indicator measures the number of scientific and technical journal articles published from a given economy.134 This data provides an indication of a given economy’s overall level of scientific and academic proficiency and output. This indicator is not biotechnology specific but covers all major forms of scientific and technical fields.135 The data is collected by the World Bank and forms part of its World Development Indicators. The number of scientific publications has been standardized for population to provide a more accurate reflection of scientific publishing intensity in a given economy regardless of population size. The data has also been aggregated and a calculated average has been used for the period 2003-2016.
This data set includes all of the economies sampled in Building the Bioeconomy 2018 except Taiwan. Equivalent data for Taiwan was collected from the Ministry of Science and Technology’s 2017 International Comparison of S&T Activities available on the Ministry’s website. This data measures annual papers and rank by nationality in the SCI ranking.
Indicator 2: Quality of academic publications
This indicator examines the quality of scientific publications. This data is collected by the OECD and measures the percentage of scientific publications among the world’s 10% most cited in 2015.136
This data set includes all of the economies sampled in Building the Bioeconomy 2018 except Argentina, Colombia, Costa Rica, Egypt, Malaysia, Peru, Saudi Arabia, Singapore, Taiwan, Thailand, UAE and Vietnam.
TABLE 4 Biotech Policy Performance Measure, biotech outputs
• Scientific publications per million population
• Quality of academic publications
• Clinical trials per million population to date
• Clinical trials for biologics per million population to date
• Early phase (Phase I and II) clinical trials for biologics, per million population to date
• Biotechnology triadic patenting, share of global total average 1999-2013
• Biopharmaceutical product launches, % available in country within 5 years of global product launch, 1983-2000
• National % share, total number of patents from top 50 PCT applicants: universities, 2016
• Biotechnology crops, hectares under cultivation, % of total 2016
• Biopharmaceutical Competitiveness Index (BCI) Survey 2017 Ranking
• Venture Capital & Private Equity Country Attractiveness Index, Economy Ranking, 2017
• Biofuels production, % of global total, 2016

36
Indicator 3: Clinical trials per million population to date
This indicator provides an overview of the biopharmaceutical clinical research environment in a given economy. Specifically, it provides the absolute number of clinical trials taking place (or having taken place) in a given economy as collated and registered on the website ClinicalTrials.gov; a website maintained by the National Library of Medicine at the National Institutes of Health in the US. As with other indicators, the total number of trials has been standardised to population to provide a more accurate reflection of levels of clinical research intensity in a given economy regardless of population size.
This data set includes all of the economies sampled in Building the Bioeconomy 2018.
Indicator 4: Clinical trials for biologics per million population to date
This indicator examines the amount of recent clinical research focusing on biologic medicines. Specifically, it provides the number of clinical trials on biologic medicines taking place (or having taken place) in a given economy as collated
and registered on the website ClinicalTrials.gov to date. Examining rates of clinical research specific to biologics is a good indicator of a given economy’s technical capacity and proficiency in complex biotech innovation. Given the size, complexity and inherent instability of a biologic, the R&D process requires a considerable level of stability and technical capacity. The testing of a biologic drug candidate’s safety and efficacy within a clinical trial necessitate a highly-controlled environment where the transportation and storage of the drug are controlled, the trial protocols are strictly adhered to and patients are monitored carefully. As with other indicators, the total number of biologic trials has been standardised to population to provide a more accurate reflection of levels of biologics clinical research intensity in a given economy regardless of population size.
This dataset includes all of the economies sampled in Building the Bioeconomy 2018.
Indicator 5: Early phase (Phase I and II) clinical trials for biologics, per million population to date
This indicator focuses on early phase clinical research on biologic medicines to date. Early phase trials are the most scientifically advanced and represent the most innovative and riskiest phases of the clinical development process. As with other indicators, the total number of trials has been standardised to population to provide a more accurate reflection of levels of early phase biologics clinical research intensity in a given economy regardless of population size.
This dataset includes all of the economies sampled in Building the Bioeconomy 2018.
Indicator 6: Biotechnology triadic patenting, share of global total average 1999-2013
This indicator examines levels of triadic patenting and an economy’s share of the global number of biotechnology patents between 1999-2013. Triadic patenting is generally considered to be the best indicator of the perceived overall value and quality of a patent. The patent application is filed in three separate locations and filing costs are quite high. The three major patenting offices in which protection is sought are: the European Patent
3 MEASURING POLICY IMPACT AND REAL-WORLD BIOTECHNOLOGY RESULTS – THE BIOTECH POLICY PERFORMANCE MEASURE
BUILDING THE BIOECONOMY 5TH EDITION
37
Office, the US Patent Office and the Japanese Patent Office.
This data is collected from the OECD.137 This dataset includes all of the economies sampled in Building the Bioeconomy 2018 except Vietnam.
Indicator 7: Biopharmaceutical product launches, % available in country within 5 years of global product launch, 1983-2000
This indicator compares relative levels of biopharmaceutical product penetration in the sampled economies. Specifically, it looks at the percentage of products available in a given economy within five years of first global launch. The data is drawn from a 2014 National Bureau of Economic Research working paper and is in turn based on national product approval rates in 76 individual economies including all of the economies sampled in Building the Bioeconomy 2018 except China and Vietnam.138
Indicator 8: National % share total number of patents from top 50 PCT applicants: universities, 2016
This indicator examines rates of university PCT patenting as collected and published by WIPO.139 Specifically, it looks at in which countries the world’s 50 most prolific PCT patenting universities were based. To obtain a weighted share for each economy included in Building the Bioeconomy 2018 the total number of PCT patents applied for by universities from each economy included in the top-50 was divided by the total number of patents applied for in 2016 by all 50 universities.
The underlying data includes all of the economies sampled in Building the Bioeconomy 2018.
Indicator 9: Biotechnology crops, hectares under cultivation, % of total 2016
This indicator compares levels of biotechnology-derived crops in the sampled economies.140 Data on hectares of biotechnology crops under cultivation are collected by the International Service for the Acquisition of Agri-biotech Applications and published annually. The number of hectares of biotech crops under cultivation is
a good indicator of the level of biotechnology derived agricultural products in a given economy.
This data set includes all of the economies sampled in Building the Bioeconomy 2018.
Indicator 10: Biopharmaceutical Competitiveness Index (BCI) Survey, 2017 Ranking
This indicator compares the relative attractiveness to biopharmaceutical investment and innovation as viewed by executives on the ground in a given economy and captured in the BCI survey.141 The BCI Survey examines the entire ecosystem in which biomedical innovation takes place from scientific capabilities and infrastructure; to state of the clinical environment; quality and efficiency of biomedical manufacturing and logistics operations; the biomedical regulatory framework (including the protection of intellectual property); healthcare financing; and overall market and business conditions. Using statistical analysis respondents’ answers are translated into a quantitative score, which is used to benchmark economies’ performance and overall attractiveness for investment. The BCI Survey is conducted by Pugatch Consilium, an international research consultancy and commissioned by PhRMA.
This data set includes all of the economies sampled in Building the Bioeconomy 2018 except Costa Rica, Denmark, Finland, Peru and Sweden. Costa Rica and Peru have been included the BCI 2017 Latin America Special Report, which deep dives into 10 Latin American countries.
Indicator 11: Venture Capital & Private Equity Country Attractiveness Index, Economy Ranking
This indicator compares the relative attractiveness to venture capital and private equity.142 The Venture Capital & Private Equity Country Attractiveness Index is compiled by the IESE and EMLYON business schools and examines factors from general rates of economic activity to the taxation environment, investor protection mechanisms, size and liquidity of existing capital markets and other relevant factors. Availability of venture capital and private equity funding is of considerable importance to biotechnology

38
innovation and commercialization as many biotechnologies begin as nascent ideas within a start-up, smaller company or university.
This dataset includes all of the economies sampled in Building the Bioeconomy 2018 except for Costa Rica.
Indicator 12: Biofuels production, % of global total, 2016
This indicator measures each country’s percentage share of the total amount of biofuels produced globally in 2016. This data is collected from BP’s Statistical Review of World Energy published in June 2017.
This data set includes all of the economies sampled in Building the Bioeconomy 2018.
3.3 Green, yellow and red – Traffic light classification system
Each economy’s performance is classified according to three categories of classification for both indicators relating to policy inputs and biotech outputs:
1. Attractive (Policy inputs)/Highly Competitive (Biotech outputs)
2. Mixed
3. Challenging (Policy inputs)/Struggling to compete (Biotech outputs)
Quantitative indicators for both policy inputs and biotech outputs compare economies to one another based on relative performance. The top third of the economy sample is classified as “Attractive” or “Highly Competitive”. The middle third of the economy sample is classified as “Mixed”. And, finally, the lower third of the economy sample is classified as “Challenging” or “Struggling to Compete”.
Based on the discussions in previous sections on the desirability and necessity of each of the seven enabling factors to stimulate innovation in the biotechnology sector, economies with higher levels of the measured indicators (for instance, R&D spending) translates into a higher classification.
Qualitative indicators are based on a normative assessment of the desirability of the remaining enabling factors. For example, for Enabling Factor 3: Intellectual Property Protection, the availability of such IPRs as regulatory data protection and patent term restoration is viewed as attractive. Similarly, the indicator included in Enabling Factor 4: The Regulatory Environment examines the existence and efficiency of the regulatory structure in a given country. As mentioned above this incudes, for instance, the speed of market authorization for biotechnology products; patent office backlogs; the existence and efficiency of an ag-bio framework; and the existence of a biosimilars pathway in line with international standards.
3.4 The Biotech Policy Performance Measure – Overall results
The below figure shows the overall results for the Biotech Policy Performance Measure. Economies move from left to right in the figure from those economies that have the most challenging environments for both policy inputs and biotech outputs to those with the most attractive policy
3 MEASURING POLICY IMPACT AND REAL-WORLD BIOTECHNOLOGY RESULTS – THE BIOTECH POLICY PERFORMANCE MEASURE

BUILDING THE BIOECONOMY 5TH EDITION
39
environments and accompanying high levels of biotechnology outputs. (A full set of tables with results for each indicator and inputs and outputs is provided in the accompanying Annex.)
3.5 The Biotech Policy Performance Measure – Discussion
As in previous editions of the Metric, data is only partially available for the non-OECD countries added in 2018. Reliable, standardized data is a pre-condition for successful biotech policy-making. It allows researchers and policymakers to get as accurate and in-depth understanding of the strengths and weaknesses of the national biotech system, assessing the effectiveness of different policies in achieving stated objectives. In this sense, data shortages resonate both as an indicator and a consequence of a low-prioritized innovation system.
What first emerges from this year’s Biotech Policy Performance Measure results is that the addition of seven new countries confirms and strengthens the overall message of previous editions of the Measure: inputs equal outputs. Economies that tend to have stronger environments with all enabling policy factors in place tend also to see higher levels of biotechnology outputs. Adopting a pragmatic, long-term approach focused on getting the policy environment right is key to reaping the economic and social benefit of biotechnologies.
At different degrees and speeds, most countries are moving to support education and R&D infrastructure. High investment in human capital and scientific infrastructure underpins the capacity to innovate or even take advantage of technological advances abroad. Yet, while the
FIGURE 1 The Biotech Policy Performance Measure – Overall results
Tha
iland
Ind
one
sia
Egyp
t
Sout
h A
fric
a
Bra
zil
Chi
le
Turk
ey
Saud
i Ara
bia
New
Zea
land
Mal
aysi
a
UA
E
Chi
na
Aus
tral
ia
Ko
rea
Taiw
an
Finl
and
Isra
el
Jap
an
Swed
en UK
Sing
apo
re
Swit
zerl
and
Irel
and
Den
mar
k
US
Vie
tnam
Peru
Ind
ia
Rus
sia
Co
sta
Ric
a
Mex
ico
Co
lom
bia
Arg
enti
na
Polic
y In
put
sB
iote
ch O
utp
uts

40
role of innovation as central to economic growth is widely recognized, some countries continue to invest very little of their income in R&D. In Asian and Latin American countries such as Vietnam and Peru, the national innovation systems rely on R&D spending of less than 0.5% of GDP. While there is a link between level of GDP (and economic structure) and R&D spending, there are also important variations based on countries’ choice. For instance, three countries with very different income levels – Brazil, Malaysia and New Zealand (with a per capita income at PPP of USD 14,125, USD 27,683 and USD 38,565 respectively) – all basically spend between 1.2-1.3% of GDP on R&D activities. Also in another newly added country, Costa Rica, spending on R&D is on the low end, at 0.6% of GDP. In the case of Costa Rica, though, the ill effects of such low spending levels is mitigated by much of the spending being directed into high-impact projects under a concerted National Plan for Science, Technology and Innovation.143 Yet, also for Costa Rica, high investments in human capital and scientific infrastructure are not sufficient, alone, to build a strong biotech industry.
Without other enabling factors and policy inputs in place, the positive effects of investment in human capital and R&D infrastructure tend to fade away. For example, Russia has one of the best-educated populations in the world. Russians have traditionally had a high level of enrolment in tertiary education. As a percentage of the total population in the age group 25-64 that has attained some level of tertiary education, Russia had a 2011 rate of 53%, which is higher than any OECD country and well above the OECD average of 32%.144 Similarly, although the number has dropped somewhat, Russia has a high number of researchers in the population. The latest data (2015) from the World Bank shows that Russia had 3,131 researchers per million people.145 This is just behind New Zealand and the US and almost three times the number for China and far ahead of Brazil, Chile, South Africa, Mexico and India. Similarly, Russian R&D spending is relatively high at 1.1% of GDP, which is just behind New Zealand and Ireland but far ahead of the UAE, Saudi Arabia, Mexico, Chile and India. Yet, Russia – despite this significant advantage in human capital and R&D spending – largely fails to generate substantial and sustained biotech outputs. Deficiencies and
uncertainty in other policy areas (including IP rights, market and commercial incentives and the regulatory environment) to some extent cancel out the advantages accrued in human capital and R&D spending.
Of the new countries covered by the report, New Zealand stands out as a market whose policy conditions underperform vis-à-vis R&D capacities, limiting attractiveness for biotech investment. Some key policy challenges remain and help explain the divide between R&D capacities, with for instance a high number of scientific publications per million population, and attractiveness to investors. These include stringent pricing and reimbursement measures for biopharmaceuticals and – compared to leading markets – limited IP standards. As a consequence, New Zealand ranks last among 11 mature countries in the 2017 BCI Index. The example of New Zealand underscores the importance of a holistic approach to policymaking. It is worth asking how much greater biotech outputs in New Zealand could be if positive policy reforms cut across all enabling factors. Denmark, a country with a similar population, and with an across the board stronger enabling environment, registered almost 4 times the number of biotech triadic patents, and almost double the number of clinical trials per million population to date than New Zealand.
3 MEASURING POLICY IMPACT AND REAL-WORLD BIOTECHNOLOGY RESULTS – THE BIOTECH POLICY PERFORMANCE MEASURE
BUILDING THE BIOECONOMY 5TH EDITION
41

SECTION
42

BUILDING THE BIOECONOMY 5TH EDITION
43
FINAL THOUGHTS 4 As we have documented over the last five editions of Building the Bioeconomy, biotechnology has emerged as one of the main technological solutions to tackle today’s health, food and environmental needs. And biotech is also helping transform traditional industrial activity and manufacturing through more effective, productive, cheaper and safer processes and products.146
It is thus not surprising that the number of countries seeking to expand and build their biotech capacities is growing. At the BIO International Convention – the world’s biggest trade show and industry meeting on biotechnology – the number of international delegates and representatives from governments across the world increases every year. And every year sees more and more countries publicly state their ambitions of building the biotech sector.
Yet, as has been readily acknowledged throughout the Building the Bioeconomy series, despite this growing interest relatively few countries are able to achieve the desired biotech outputs. Even though techno parks are being built, sizeable investments are made in R&D infrastructure and advanced doctoral programs, many countries are not progressing as quickly as they would like.
What is going wrong?
4.1 Policy as the bridge
This edition of Building the Bioeconomy has identified some of the future trends in biotechnology and, specifically, the interaction between biotech regulations and innovation: the rise of China as a biotech hub; attempts to undermine IPRs and with it the biotech innovation life-cycle; the growing adoption of fast-track procedures to accelerate time to market of innovative products; the shift towards biofuels with lower environmental impact; the emerging approach of regulators to gene editing technologies; and attempts to leverage big data to devise new regulatory solutions. What stands out from the examples this year is just how regulatory changes are actively contributing to either enhancing or hindering
the innovation potential of the biotech industry. The leading and most forward-looking biotech regulators in the world are trying to keep pace with technological developments and to cement these benefits through novel, user-friendly processes and procedures. Yet, in many cases, regulatory decisions work against stated objectives and undermine innovation incentives, often as a result of inadequate governance structures and shortsighted priorities. Of the major biotech industries examined in the Building the Bioeconomy series, ag-biotech remains perhaps the most prominent example of how regulatory and political barriers trump scientific achievements. The economic and societal benefits of GMOs are well documented.147 By some estimates the global economic gain from biotech crops could exceed USD17billions per year.148 And, above all, GMOs play a crucial role in providing global food security. From 1996 to 2014, their use resulted in an additional 158 million tons of soybeans and 322 million tons of corn; vital staple food sources for millions around the world.149 Biotech crops also reduce the use of chemical pesticides, with important benefits for the environment and farmers’ health,150 in addition to savings for healthcare systems. Adoption of GE cotton in India is said to have saved the MoH between USD14-41 million from reduced pesticide poisoning.151 Yet, despite this evidence, biotech crops keep facing regulatory and trade restrictions in a large number of countries that result in approval delays, outright bans, and international commodity trade failures, due to rejection of shipments for low-level presence of a GM crop. As mentioned above, widespread aversion to biotech crops persists in the EU, where the lack of regulatory coordination and approval delays result in low-level investment in agriculture innovation. 19 out of 28 Member States

44
4 FINAL THOUGHTS
opted out of the EU-wide GM crop approvals. Finland, Ireland, and Sweden are among the 9 countries that supported common, streamlined regulations.152 Approvals take on average 995 days in the EU, against 686 in the US.153 Also when looking at imports, some varieties of GM crops submitted for regulatory approval in 2005 (mostly for animal feed use) are still awaiting a decision. Delays and politically motivated decisions have clear opportunity costs. The EU covers slightly over 10% of R&D agriculture investment globally, a share three times smaller than two decades ago.154 Yet, Europe is not alone in missing out the benefits of ag-biotech. Australia’s GM canola moratorium from 2004 to 2014 cost farmers nearly USD500 million in lost revenue.155 In Mexico, delays in the release of permits and injunctions have suspended the planting of biotech corn, making the country dependent on imported corn.156 Conversely, the Brazilian agriculture sector, which currently and historically has been powered by the wide-scale use of biotech, is cited as driving economic growth.157
So what can regulators, policymakers and countries actively do to change their trajectory and put themselves in the best position to achieve biotech success?
To begin with, regulatory policy should be coordinated within government, and stakeholder consultation and regular dialogue should be a formalized part of the process. This is especially true for cross-cutting and newly emerging issues, with coordinated actions that draw on the expertise of numerous government ministries, including those responsible for agriculture, education, environment, health, industry, natural resources, and research. A good example is provided by Sweden, where a dedicated National Coordinator for the life sciences has been created. Similarly, the recent Growth Strategy for Life Sciences in Denmark is based on proposals from a “Growth Team” headed by an industrial representative and composed of academia, industry and public actors.158 The UK’s vision to keep and deepen its competitive edge in life sciences is implemented through a transformative “Sector Deal”,159 a series of initiatives agreed between the Government and the life science sector.160 Among these initiatives, for instance, the
private sector committed to launch a new world-leading life sciences R&D hub in London.
Second, the design and application of new or existing regulations should not lose sight of the impact on long-term national objectives and a given country’s biotech competitiveness. Regulators should constantly ask themselves how an existing or proposed piece of regulation would help (or hurt) the wider efforts of developing and building a competitive biotech sector. In this sense, unnecessary administrative burdens on research and industry should be continuously identified and removed; local innovation should be perceived broadly, and enabled through non-discriminatory, market-based incentives.
The ultimate objective of this series of reports is to provide government officials and policy-makers with evidence on the kind of reforms that will help them achieve their desired outcomes. Designing policies to foster innovation in biotechnology is not an easy task. But as this year’s edition of Building the Bioeconomy makes clear, the countries that will continue to enjoy the fruits of biotech innovation are the ones where forward-looking regulations (and the regulators behind them) act to encourage, and not hinder, innovation.

BUILDING THE BIOECONOMY 5TH EDITION
45

46

47
BUILDING THE BIOECONOMY 5TH EDITION
ANNEX – INDIVIDUAL COUNTRY OVERVIEWS AND STATISTICS
The data used as a basis for classifying and categorizing each country has been collected from international and national sources and databases. Below is a full individual country overview for
each of the 33 countries included in Building the Bioeconomy 2018 including all relevant statistics and information on which each country has been assessed.
As detailed in the accompanying main report, each country included in the Biotechnology Policy Performance Measure has been compared on each of the 28 indicators and categorized for each one according to the traffic-light classification system discussed above.

48
ANNEX – INDIVIDUAL COUNTRY OVERVIEWS AND STATISTICS
ARGENTINA
INPUTS
Factor 1: Human capital
Number of researchers per million population 1,202 (World Bank 2014)
Life sciences graduates (PhD & Masters), per million population
NA
Factor 2: Infrastructure for R&D
R&D spending % of GDP 0.63% (OECD 2015)
BERD spending as a % of total 17.2% (OECD 2015)
Total biotechnology R&D expenditure, Millions USD PPP, per million population
NA
Biotech R&D as a percentage of BERD NA
Factor 3: Intellectual property protection Neither RDP nor PTE available. Achieved a score of 27.98% on the IP Index life sciences indicators.
Factor 4: The regulatory environment Strong regulatory authority and science based regulations for ag-bio: global leader with US, Brazil. 2015 saw introduction of “New Breeding Techniques” regulation for innovative biotech use in plants. Argentina a global leader in introducing this. 3 new GM crops approved early 2018. For biopharma sanitary regulations are lacking: i) no bioequivalence requirement for generics; ii) poor pharmacovigilance. ANMAT regulation 6677/10 shortens delays for CT approval from 160 to 70 days; approvals are granted automatically if the delay is not respected.
Factor 5: Technology transfer and commercialization frameworks
No direct barriers in place for licensing between private and private entities (including foreign entities). Registration with INPI is not required but can result in tax benefits. No framework in place for universities; CONICET (National Scientific and Technical Research Council) automatically owns 50% of any invention developed by public universities. Some high profile examples of success stories in public-private tech transfer e.g. “National University of Litoral (UNL) and CONICET announced the successful completion of a nine-year research project supported by FONTAR, Argentina’s Technology Fund. The project completed the discovery and isolation of a gene that makes plants resistant to drought and saline soil.” CONICET has relatively well developed tech transfer platforms and frameworks in place.
Factor 6: Market and commercial incentives
Biopharmaceutical pricing and reimbursement policies
Generally challenging P&R environment. Caps on price growth introduced in recent years together with increased focus on cuts to reimbursement and preferential treatment for lower cost, locally manufactured medicines. Non-bioequivalence tested generic drugs (similares) a pervasive part of the market. In March 2018 the Minister of Health and provincial representatives agreed on a National Drug Strategy including mechanisms to reduce drug prices such as joint purchase and negotiations and capped prices for ambulatory drugs. In 2018 the Government submitted to the Senate a new proposal for the creation of the National Health Technology Assessment Agency (AGNET), which will assess products to be listed under the Compulsory Medical Program.
R&D tax incentives General R&D tax incentive scheme in place is limited; for 2014/15 was capped at US$15million total budget. Additional incentives target software and biotechnology. Incentives for biotech range from VAT accelerated payments and a 50% tax credit on social security contributions.
Factor 7: Rule of law Ranked 46 out of 113 countries

49
OUTPUTS
Scientific publications per million population, 2003-2016 158.4
Quality of academic publications, 2015 NA
Clinical trials per million population to date 54.35
Clinical trials for biologics per million population to date 4.77
Early phase (Phase I and II) clinical trials for biologics, per million population to date 1.19
Biotechnology triadic patenting, share of global total average 1999-2013 0.05%
Biopharmaceutical product launches, % available in country within 5 years of global product launch, 1983-2000
45.30%
National % share total number of patents from top 50 PCT applicants: universities, 2016 None
Biotechnology crops, hectares under cultivation, % of total 2016 12.86%
BCI Survey Ranking 2017 Challenging
Venture Capital & Private Equity Country Attractiveness Index, Economy Ranking, 2018 56.2
Biofuels production, % of global total, 2017 3.4%
BUILDING THE BIOECONOMY 5TH EDITION

50
AUSTRALIA
ANNEX – INDIVIDUAL COUNTRY OVERVIEWS AND STATISTICS
INPUTS
Factor 1: Human capital
Number of researchers per million population 4,530 (2010 World Bank)
Life sciences graduates (PhD & Masters), per million population
64.05 (OECD 2015)
Factor 2: Infrastructure for R&D
R&D spending % of GDP 1.9 % (OECD 2015)
BERD spending as a % of total 61.9% (OECD 2008)
Total biotechnology R&D expenditure, Millions USD PPP, per million population
5.24 (OECD 2015)
Biotech R&D as a percentage of BERD 1% (OECD 2015)
Factor 3: Intellectual property protection Both RDP and PTE are available. Since 2012, Australia’s Department of Health has pursued market-sized damages (on top of those sought by the generic company) aimed at compensating the PBS for any higher price paid for a patented medicine during the period of a provisional preliminary injunction. Australia’s market-size damages policy unfairly tips the scales in commercial patent disputes and creates an inappropriate conflict of interest by permitting the same government that examined and granted a patent to seek damages if that patent is later ruled invalid or not infringed. Achieved a score of 78.19% on the IP Index life sciences indicators.
Factor 4: The regulatory environment Generally high standard of regulatory approval for biopharmaceuticals. A provisional approval pathway for NCE and new uses on the basis of early clinical data on safety and efficacy has been launched March 2018. Regulatory hurdles in place for ag-bio cultivation: AUS federal government is generally supportive however significant restrictions have historically been in place at a state level e.g. the 2003 GM Free Areas Bill in Western Australia which was not repealed until Oct 2016. Australia’s gene technology regulator proposed reducing regulations around gene editing techniques such as CRISPR, following a 12-month technical review into the current regulations.
Factor 5: Technology transfer and commercialization frameworks
University/PRO cooperation has traditionally not been as strong as in leading high-income economies. In 2016 OECD STI Outlook Australia’s tech transfer was ranked around the OECD average. On a positive note Australia does not have any significant barriers in place for private-private licensing and commercialization arrangements.
Factor 6: Market and commercial incentives
Biopharmaceutical pricing and reimbursement policies
Generally challenging P&R environment. Number of product registrations relatively low and number of products included for reimbursement on PBS is low compared the high-income developed world averages. A 5-year agreement between the Department of Health and Medicines Australia was signed into law in 2018. It establishes price cuts that will deliver savings of USD1.8 billion at the condition that no further price reforms be undertaken up to 2023, and that savings be reinvested in drug purchase. Price cuts include a 5% statutory price reduction for drugs listed in the single-brand formulary for 5 years; a further 10% after 10 and 5% after 15 years.
R&D tax incentives Relatively low effective rate ranging from 8.5-15% depending on size of the enterprise. No biotech specific R&D incentives. The “Australia 2030 – Prosperity through Innovation” published by the independent board Innovation Science Australia proposes to recalibrate the R&D Tax Incentive Program toward SMEs and strategic industries (advanced manufacturing; cyber security; food and agribusiness; medical technologies and pharmaceuticals; mining equipment technology and oil, gas and energy resources). It also proposes to introduce a collaboration premium of up to 20% for expenditure on public research institutions, to increase research/industry collaboration.
Factor 7: Rule of law Ranked 10 out of 113 countries

51
BUILDING THE BIOECONOMY 5TH EDITION
OUTPUTS
Scientific publications per million population, 2003-2016 1,669
Quality of academic publications, 2015 12.6%
Clinical trials per million population to date 254.47
Clinical trials for biologics per million population to date 29.57
Early phase (Phase I and II) clinical trials for biologics, per million population to date 13.22
Biotechnology triadic patenting, share of global total average 1999-2013 1.67%
Biopharmaceutical product launches, % available in country within 5 years of global product launch, 1983-2000
27.30%
National % share total number of patents from top 50 PCT applicants: universities, 2016 None
Biotechnology crops, hectares under cultivation, % of total 2016 0.49%
BCI Survey Ranking 2017 Challenging
Venture Capital & Private Equity Country Attractiveness Index, Economy Ranking, 2018 90.2
Biofuels production, % of global total, 2017 0.2%

52
BRAZIL
ANNEX – INDIVIDUAL COUNTRY OVERVIEWS AND STATISTICS
INPUTS
Factor 1: Human capital
Number of researchers per million population 698 (2010 World Bank)
Life sciences graduates (PhD & Masters), per million population
24.24 (OECD 2014)
Factor 2: Infrastructure for R&D
R&D spending % of GDP 1.16 % (World Bank 2014)
BERD spending as a % of total NA
Total biotechnology R&D expenditure, Millions USD PPP, per million population
NA
Biotech R&D as a percentage of BERD NA
Factor 3: Intellectual property protection RDP and PTE for biopharmaceuticals unavailable; Long delays (10+ years) for patent applications reduce effective exclusivity period. A limited extension exists at part of the IP Law. An emergency measure presented in 2017 could considerably alleviate the patent backlog through a simplified 90-day issuance procedure, without substantive examination, but has so far been blocked. However, pharmaceutical patents are explicitly excluded in light of ANVISA’s involvement in their granting (see below). RDP available for agricultural and veterinary products. Achieved a score of 42.46% on the IP Index life sciences indicators.
Factor 4: The regulatory environment Regulatory system in place for biotechnology through ANVISA and CTNBio. Ag-bio framework generally regarded as science-based and world-leading. Biosimilars pathway in place. Dual examination requirement for biopharmaceutical patent applications outside international standards. ANVISA’s Resolution No. 168/2017 clarifies the scope of ANVISA’s ‘prior consent’ and limits it to public health considerations. Yet, ANVISA will still be able to issue a non-binding opinion on patentability requirements for products of interest to national drug prices. On a positive note unlike Argentina and other LatAm countries Brazil introduced bioequivalence testing requirements for all similares in 2003.
Factor 5: Technology transfer and commercialization frameworks
2017 saw the removal of INPI as regulator of licensing agreements. Registration requirements remain but INPI has no oversight or inclination to amend commercial terms. Resolution No. 199/2017 of July 2017 adopted new rules of procedure for the registration of contracts that bring more flexibility to the registration process. In particular, the Resolution foresees that INPI shall no longer have a say on a license’s duration, payments and contractual amounts.
Factor 6: Market and commercial incentives
Biopharmaceutical pricing and reimbursement policies
Generally challenging P&R environment. Prices regulated by the Câmara de Regulação do Mercado de Medicamentos (CMED) founded in 2003. Drugs are priced based on relative innovativeness compared to comparators – HTA process included in decision. IRP used extensively and calculated on lowest average ex‐manufacturing price of the product in a basket of countries. Separate IRP calculation for “exceptional medicines” to which a “Coefficient Adequacy Price” (Coeficiente de Adequação de Preço) or CAP is applied. Reimbursement decisions by CONITEC, SUS and MoH; largely based on cost analysis.
R&D tax incentives R&D tax credits and super deductions in place for qualifying expenditure. However, super deductions for patents are contingent on registration; long patent delays mean tax credit in effect is unavailable.
Factor 7: Rule of law Ranked 52 out of 113 countries

53
BUILDING THE BIOECONOMY 5TH EDITION
OUTPUTS
Scientific publications per million population, 2003-2016 185.3
Quality of academic publications, 2015 4.3%
Clinical trials per million population to date 30.54
Clinical trials for biologics per million population to date 1.61
Early phase (Phase I and II) clinical trials for biologics, per million population to date 0.52
Biotechnology triadic patenting, share of global total average 1999-2013 0.11%
Biopharmaceutical product launches, % available in country within 5 years of global product launch, 1983-2000
31.60%
National % share total number of patents from top 50 PCT applicants: universities, 2016 None
Biotechnology crops, hectares under cultivation, % of total 2016 26.52%
BCI Survey Ranking 2017 Mixed
Venture Capital & Private Equity Country Attractiveness Index, Economy Ranking, 2018 57.4
Biofuels production, % of global total, 2017 22.5%

54
CHILE
ANNEX – INDIVIDUAL COUNTRY OVERVIEWS AND STATISTICS
INPUTS
Factor 1: Human capital
Number of researchers per million population 455 (World Bank 2015)
Life sciences graduates (PhD & Masters), per million population
27.74 (OECD 2015)
Factor 2: Infrastructure for R&D
R&D spending % of GDP 0.4 % (OECD 2016)
BERD spending as a % of total 35.8% (OECD 2016)
Total biotechnology R&D expenditure, Millions USD PPP, per million population
NA
Biotech R&D as a percentage of BERD NA
Factor 3: Intellectual property protection 5-yr RDP term available. PTE calculations limit actual 5-year availability and heightened uncertainty through new recommendations by FNE committee in 2016. Government threatens use of CL for Hepatitis C treatment. Achieved a score of 43.23% on the IP Index life sciences indicators.
Factor 4: The regulatory environment Generally high regulatory standards relating to biopharmaceuticals, in particular Chile is seeking to become a Level 4 PAHO/WHO accredited regional authority. However, similares still on the market in Chile. “Ricarte Soto” Law introduced greater ambiguity and potential costs for companies around clinical trials. Specifically, clinical trial sponsors face greater liability for adverse effects, including those that were not predictable with available scientific knowledge at the start of the trial and for a period of ten years following the trial (as opposed to the 5 years previously required). Has led to a drop in trials. A draft drug bill (Ley de Farmacos II) would introduce INN prescribing. Chile does not allow for the cultivation of ag-bio products. Only production of seeds is allowed for export purposes. No biotechnology framework in place.
Factor 5: Technology transfer and commercialization frameworks
CORFO has in place a number of tech transfer initiatives including Technology Transfer Hubs and Start-Up Chile. Some examples of success stories e.g. Fundación Chile, a well-established not-for-profit NGO, has had several successful biotech collaborations in the past including R&D collaborations in fruit and forestry biotechnology with US and Canadian biotech firms. Overall Chile ranks low on OECD 2015 STI Scoreboard for technology transfer activities.
Factor 6: Market and commercial incentives
Biopharmaceutical pricing and reimbursement policies
No central price control with public sector prices negotiated via public tenders through Central Nacional de Abastecimiento (CENABAST) or directly with public institutions. Minimum 30% discount for CENABAST-negotiated medicines. Reimbursement policies vary but long-standing insecurity of reimbursement for high-cost treatments resulted in “Ricarte Soto” Law (Ley 20,850) which aims to increase the level and scope of funding for high-cost treatments with an initial budget of around USD35 million in 2015 that increased to nearly USD200 million in 2018, providing full reimbursement to expensive drugs treating 18 health conditions (4 more than in 2017).
R&D tax incentives Tax credits (35%) and tax deductions are available. However the credit is capped at $US1.2million and there are no specific biotech incentives.
Factor 7: Rule of law Ranked 27 out of 113 countries

55
BUILDING THE BIOECONOMY 5TH EDITION
OUTPUTS
Scientific publications per million population, 2003-2016 241.5
Quality of academic publications, 2015 5.8%
Clinical trials per million population to date 75.77
Clinical trials for biologics per million population to date 7.31
Early phase (Phase I and II) clinical trials for biologics, per million population to date 2.40
Biotechnology triadic patenting, share of global total average 1999-2013 0.03%
Biopharmaceutical product launches, % available in country within 5 years of global product launch, 1983-2000
28.80%
National % share total number of patents from top 50 PCT applicants: universities, 2016 None
Biotechnology crops, hectares under cultivation, % of total 2016 0.01%
BCI Survey Ranking 2017 Competitive
Venture Capital & Private Equity Country Attractiveness Index, Economy Ranking, 2018 68.1
Biofuels production, % of global total, 2017 NA
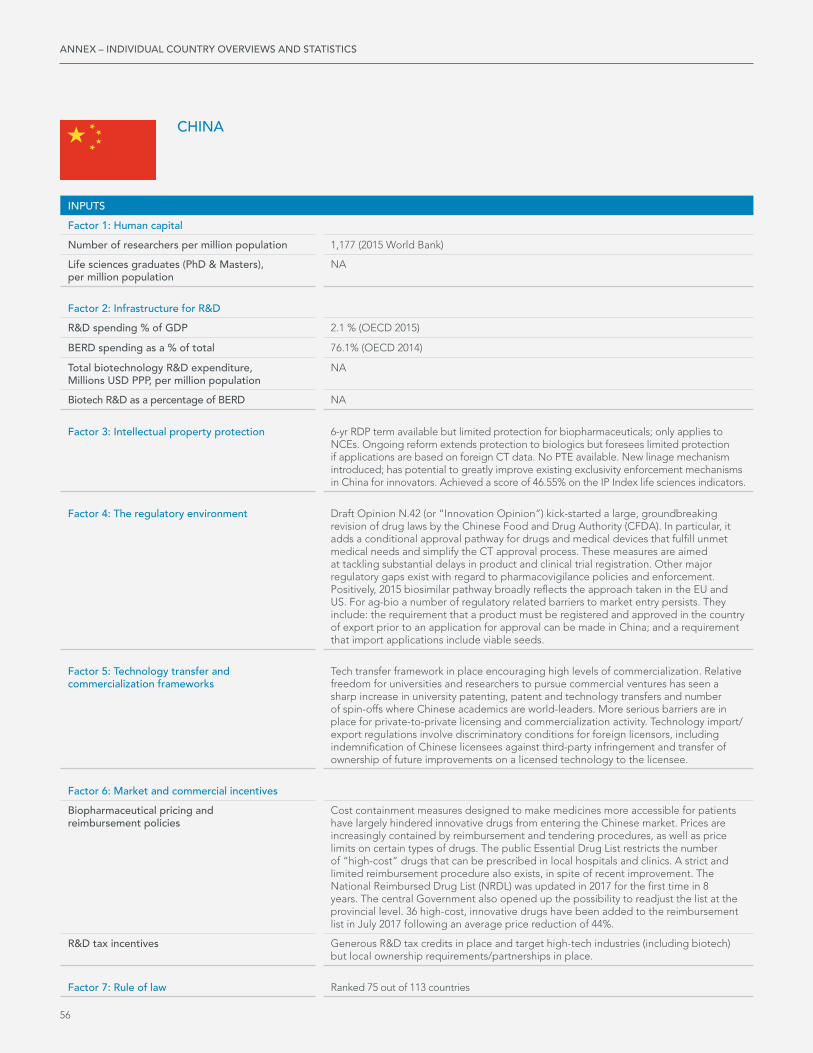
56
CHINA
ANNEX – INDIVIDUAL COUNTRY OVERVIEWS AND STATISTICS
INPUTS
Factor 1: Human capital
Number of researchers per million population 1,177 (2015 World Bank)
Life sciences graduates (PhD & Masters), per million population
NA
Factor 2: Infrastructure for R&D
R&D spending % of GDP 2.1 % (OECD 2015)
BERD spending as a % of total 76.1% (OECD 2014)
Total biotechnology R&D expenditure, Millions USD PPP, per million population
NA
Biotech R&D as a percentage of BERD NA
Factor 3: Intellectual property protection 6-yr RDP term available but limited protection for biopharmaceuticals; only applies to NCEs. Ongoing reform extends protection to biologics but foresees limited protection if applications are based on foreign CT data. No PTE available. New linage mechanism introduced; has potential to greatly improve existing exclusivity enforcement mechanisms in China for innovators. Achieved a score of 46.55% on the IP Index life sciences indicators.
Factor 4: The regulatory environment Draft Opinion N.42 (or “Innovation Opinion”) kick-started a large, groundbreaking revision of drug laws by the Chinese Food and Drug Authority (CFDA). In particular, it adds a conditional approval pathway for drugs and medical devices that fulfill unmet medical needs and simplify the CT approval process. These measures are aimed at tackling substantial delays in product and clinical trial registration. Other major regulatory gaps exist with regard to pharmacovigilance policies and enforcement. Positively, 2015 biosimilar pathway broadly reflects the approach taken in the EU and US. For ag-bio a number of regulatory related barriers to market entry persists. They include: the requirement that a product must be registered and approved in the country of export prior to an application for approval can be made in China; and a requirement that import applications include viable seeds.
Factor 5: Technology transfer and commercialization frameworks
Tech transfer framework in place encouraging high levels of commercialization. Relative freedom for universities and researchers to pursue commercial ventures has seen a sharp increase in university patenting, patent and technology transfers and number of spin-offs where Chinese academics are world-leaders. More serious barriers are in place for private-to-private licensing and commercialization activity. Technology import/export regulations involve discriminatory conditions for foreign licensors, including indemnification of Chinese licensees against third-party infringement and transfer of ownership of future improvements on a licensed technology to the licensee.
Factor 6: Market and commercial incentives
Biopharmaceutical pricing and reimbursement policies
Cost containment measures designed to make medicines more accessible for patients have largely hindered innovative drugs from entering the Chinese market. Prices are increasingly contained by reimbursement and tendering procedures, as well as price limits on certain types of drugs. The public Essential Drug List restricts the number of “high-cost” drugs that can be prescribed in local hospitals and clinics. A strict and limited reimbursement procedure also exists, in spite of recent improvement. The National Reimbursed Drug List (NRDL) was updated in 2017 for the first time in 8 years. The central Government also opened up the possibility to readjust the list at the provincial level. 36 high-cost, innovative drugs have been added to the reimbursement list in July 2017 following an average price reduction of 44%.
R&D tax incentives Generous R&D tax credits in place and target high-tech industries (including biotech) but local ownership requirements/partnerships in place.
Factor 7: Rule of law Ranked 75 out of 113 countries

57
BUILDING THE BIOECONOMY 5TH EDITION
OUTPUTS
Scientific publications per million population, 2003-2016 201.8
Quality of academic publications, 2015 7.6%
Clinical trials per million population to date 8.56
Clinical trials for biologics per million population to date 0.70
Early phase (Phase I and II) clinical trials for biologics, per million population to date 0.45
Biotechnology triadic patenting, share of global total average 1999-2013 0.99%
Biopharmaceutical product launches, % available in country within 5 years of global product launch, 1983-2000
NA
National % share total number of patents from top 50 PCT applicants: universities, 2016 8.73%
Biotechnology crops, hectares under cultivation, % of total 2016 1.51%
BCI Survey Ranking 2017 Mixed
Venture Capital & Private Equity Country Attractiveness Index, Economy Ranking, 2018 80.7
Biofuels production, % of global total, 2017 2.5%
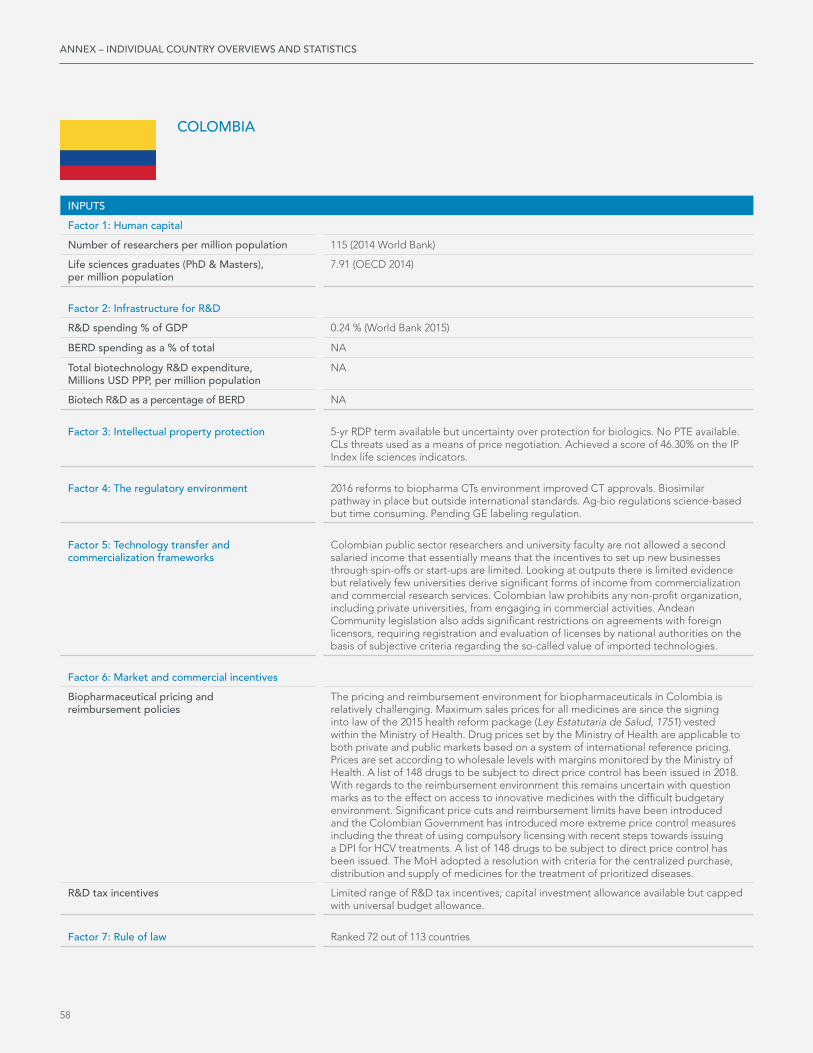
58
COLOMBIA
ANNEX – INDIVIDUAL COUNTRY OVERVIEWS AND STATISTICS
INPUTS
Factor 1: Human capital
Number of researchers per million population 115 (2014 World Bank)
Life sciences graduates (PhD & Masters), per million population
7.91 (OECD 2014)
Factor 2: Infrastructure for R&D
R&D spending % of GDP 0.24 % (World Bank 2015)
BERD spending as a % of total NA
Total biotechnology R&D expenditure, Millions USD PPP, per million population
NA
Biotech R&D as a percentage of BERD NA
Factor 3: Intellectual property protection 5-yr RDP term available but uncertainty over protection for biologics. No PTE available. CLs threats used as a means of price negotiation. Achieved a score of 46.30% on the IP Index life sciences indicators.
Factor 4: The regulatory environment 2016 reforms to biopharma CTs environment improved CT approvals. Biosimilar pathway in place but outside international standards. Ag-bio regulations science-based but time consuming. Pending GE labeling regulation.
Factor 5: Technology transfer and commercialization frameworks
Colombian public sector researchers and university faculty are not allowed a second salaried income that essentially means that the incentives to set up new businesses through spin-offs or start-ups are limited. Looking at outputs there is limited evidence but relatively few universities derive significant forms of income from commercialization and commercial research services. Colombian law prohibits any non-profit organization, including private universities, from engaging in commercial activities. Andean Community legislation also adds significant restrictions on agreements with foreign licensors, requiring registration and evaluation of licenses by national authorities on the basis of subjective criteria regarding the so-called value of imported technologies.
Factor 6: Market and commercial incentives
Biopharmaceutical pricing and reimbursement policies
The pricing and reimbursement environment for biopharmaceuticals in Colombia is relatively challenging. Maximum sales prices for all medicines are since the signing into law of the 2015 health reform package (Ley Estatutaria de Salud, 1751) vested within the Ministry of Health. Drug prices set by the Ministry of Health are applicable to both private and public markets based on a system of international reference pricing. Prices are set according to wholesale levels with margins monitored by the Ministry of Health. A list of 148 drugs to be subject to direct price control has been issued in 2018. With regards to the reimbursement environment this remains uncertain with question marks as to the effect on access to innovative medicines with the difficult budgetary environment. Significant price cuts and reimbursement limits have been introduced and the Colombian Government has introduced more extreme price control measures including the threat of using compulsory licensing with recent steps towards issuing a DPI for HCV treatments. A list of 148 drugs to be subject to direct price control has been issued. The MoH adopted a resolution with criteria for the centralized purchase, distribution and supply of medicines for the treatment of prioritized diseases.
R&D tax incentives Limited range of R&D tax incentives; capital investment allowance available but capped with universal budget allowance.
Factor 7: Rule of law Ranked 72 out of 113 countries

59
BUILDING THE BIOECONOMY 5TH EDITION
OUTPUTS
Scientific publications per million population, 2003-2016 62.8
Quality of academic publications, 2015 NA
Clinical trials per million population to date 23.06
Clinical trials for biologics per million population to date 2.63
Early phase (Phase I and II) clinical trials for biologics, per million population to date 0.82
Biotechnology triadic patenting, share of global total average 1999-2013 0.01%
Biopharmaceutical product launches, % available in country within 5 years of global product launch, 1983-2000
31.50%
National % share total number of patents from top 50 PCT applicants: universities, 2016 None
Biotechnology crops, hectares under cultivation, % of total 2016 0.05%
BCI Survey Ranking 2017 Mixed
Venture Capital & Private Equity Country Attractiveness Index, Economy Ranking, 2018 63.3
Biofuels production, % of global total, 2017 0.8%
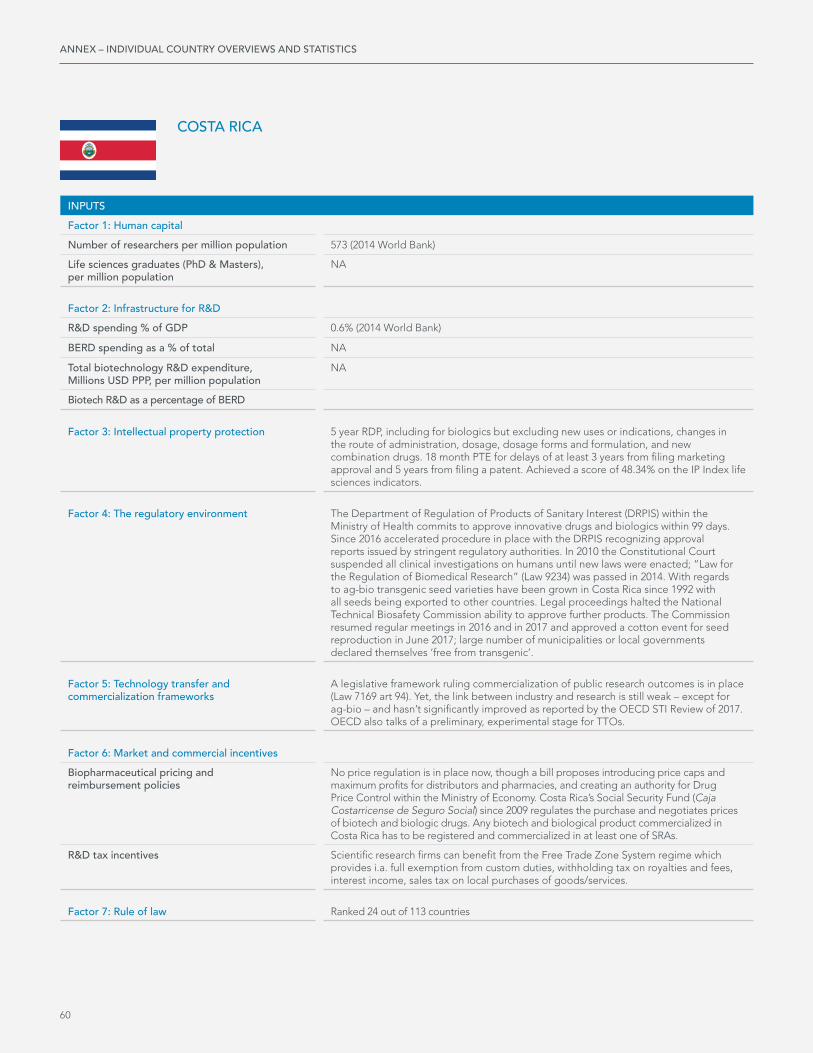
SECTION
60 60
COSTA RICA
ANNEX – INDIVIDUAL COUNTRY OVERVIEWS AND STATISTICS
INPUTS
Factor 1: Human capital
Number of researchers per million population 573 (2014 World Bank)
Life sciences graduates (PhD & Masters), per million population
NA
Factor 2: Infrastructure for R&D
R&D spending % of GDP 0.6% (2014 World Bank)
BERD spending as a % of total NA
Total biotechnology R&D expenditure, Millions USD PPP, per million population
NA
Biotech R&D as a percentage of BERD
Factor 3: Intellectual property protection 5 year RDP, including for biologics but excluding new uses or indications, changes in the route of administration, dosage, dosage forms and formulation, and new combination drugs. 18 month PTE for delays of at least 3 years from filing marketing approval and 5 years from filing a patent. Achieved a score of 48.34% on the IP Index life sciences indicators.
Factor 4: The regulatory environment The Department of Regulation of Products of Sanitary Interest (DRPIS) within the Ministry of Health commits to approve innovative drugs and biologics within 99 days. Since 2016 accelerated procedure in place with the DRPIS recognizing approval reports issued by stringent regulatory authorities. In 2010 the Constitutional Court suspended all clinical investigations on humans until new laws were enacted; “Law for the Regulation of Biomedical Research” (Law 9234) was passed in 2014. With regards to ag-bio transgenic seed varieties have been grown in Costa Rica since 1992 with all seeds being exported to other countries. Legal proceedings halted the National Technical Biosafety Commission ability to approve further products. The Commission resumed regular meetings in 2016 and in 2017 and approved a cotton event for seed reproduction in June 2017; large number of municipalities or local governments declared themselves ‘free from transgenic’.
Factor 5: Technology transfer and commercialization frameworks
A legislative framework ruling commercialization of public research outcomes is in place (Law 7169 art 94). Yet, the link between industry and research is still weak – except for ag-bio – and hasn’t significantly improved as reported by the OECD STI Review of 2017. OECD also talks of a preliminary, experimental stage for TTOs.
Factor 6: Market and commercial incentives
Biopharmaceutical pricing and reimbursement policies
No price regulation is in place now, though a bill proposes introducing price caps and maximum profits for distributors and pharmacies, and creating an authority for Drug Price Control within the Ministry of Economy. Costa Rica’s Social Security Fund (Caja Costarricense de Seguro Social) since 2009 regulates the purchase and negotiates prices of biotech and biologic drugs. Any biotech and biological product commercialized in Costa Rica has to be registered and commercialized in at least one of SRAs.
R&D tax incentives Scientific research firms can benefit from the Free Trade Zone System regime which provides i.a. full exemption from custom duties, withholding tax on royalties and fees, interest income, sales tax on local purchases of goods/services.
Factor 7: Rule of law Ranked 24 out of 113 countries

BUILDING THE BIOECONOMY 5TH EDITION
61 61
BUILDING THE BIOECONOMY 5TH EDITION
OUTPUTS
Scientific publications per million population, 2003-2016 55.6
Quality of academic publications, 2015 NA
Clinical trials per million population to date 32.73
Clinical trials for biologics per million population to date 3.50
Early phase (Phase I and II) clinical trials for biologics, per million population to date 0.21
Biotechnology triadic patenting, share of global total average 1999-2013 0.00%
Biopharmaceutical product launches, % available in country within 5 years of global product launch, 1983-2000
28.50%
National % share total number of patents from top 50 PCT applicants: universities, 2016 NA
Biotechnology crops, hectares under cultivation, % of total 2016 0.01%
BCI Survey Ranking 2017 Competitive
Venture Capital & Private Equity Country Attractiveness Index, Economy Ranking, 2018 NA
Biofuels production, % of global total, 2017 NA

62
DENMARK
ANNEX – INDIVIDUAL COUNTRY OVERVIEWS AND STATISTICS
INPUTS
Factor 1: Human capital
Number of researchers per million population 7,484 (2015 World Bank)
Life sciences graduates (PhD & Masters), per million population
119.82 (OECD 2015)
Factor 2: Infrastructure for R&D
R&D spending % of GDP 2.9 % (OECD 2016)
BERD spending as a % of total 59.4% (OECD 2015)
Total biotechnology R&D expenditure, Millions USD PPP, per million population
188.9
Biotech R&D as a percentage of BERD 21.9%
Factor 3: Intellectual property protection Both 10-yr RDP term available and 5-yr SPC available under EU law. Not included in IP Index.
Factor 4: The regulatory environment High regulatory standards for biopharmaceuticals (both EMA and national agency, Laegemiddelstyrelsen). But Denmark has banned GMO cultivation and is one of 19 EU Member States to have opted out from Commission approved cultivation of a GM crop.
Factor 5: Technology transfer and commercialization frameworks
Denmark was one of the first EU countries to put in place technology transfer legislation supporting university commercialization of publicly funded research. Denmark also provides a number of funding measures to help young and innovative biotechnology companies thrive. Reportedly four out of five companies in the life science sector collaborated with a Danish university between 2014 and 2016; more than half of all Danish life science companies are located less than five kilometres from a university. Cooperation also benefits from the Medicon Valley Biotech Cluster, a Danish-Swedish cross-border initiative.
Factor 6: Market and commercial incentives
Biopharmaceutical pricing and reimbursement policies
By European standards the pricing and reimbursement environment for biopharmaceuticals is less stringent than other countries. Price controls are only indirectly in place with agreements between the Danish pharmaceutical industry and MoH. Reference pricing system in place and heavy use of generic substitution and promotion policies.
R&D tax incentives Tax credits and deductions are available as R&D incentives. The R&D tax credit is up to 25% with a maximum cap of 25 million Danish Crowns.
Factor 7: Rule of law Ranked 1 out of 113 countries

63
BUILDING THE BIOECONOMY 5TH EDITION
OUTPUTS
Scientific publications per million population, 2003-2016 1,861.6
Quality of academic publications, 2015 14.2%
Clinical trials per million population to date 1,175.80
Clinical trials for biologics per million population to date 60.06
Early phase (Phase I and II) clinical trials for biologics, per million population to date 23.57
Biotechnology triadic patenting, share of global total average 1999-2013 1.71%
Biopharmaceutical product launches, % available in country within 5 years of global product launch, 1983-2000
44.90%
National % share total number of patents from top 50 PCT applicants: universities, 2016 1.51%
Biotechnology crops, hectares under cultivation, % of total 2016 None
BCI Survey Ranking 2017 None
Venture Capital & Private Equity Country Attractiveness Index, Economy Ranking, 2018 84.3
Biofuels production, % of global total, 2017 NA

SECTION
64 64
EGYPT
ANNEX – INDIVIDUAL COUNTRY OVERVIEWS AND STATISTICS
INPUTS
Factor 1: Human capital
Number of researchers per million population 680 (World Bank 2015)
Life sciences graduates (PhD & Masters), per million population
NA
Factor 2: Infrastructure for R&D
R&D spending % of GDP 0.7 (World Bank 2015)
BERD spending as a % of total
Total biotechnology R&D expenditure, Millions USD PPP, per million population
NA
Biotech R&D as a percentage of BERD NA
Factor 3: Intellectual property protection Both RDP and PTE unavailable. Achieved a score of 26.14% on the IP Index life sciences indicators.
Factor 4: The regulatory environment The Egyptian Drug Authority is the pharmaceutical regulatory body of the MoH, but Egypt is in the process of establishing a new medicines authority independent from the MoH. In 2017 Egypt introduced a 30-day verification procedures for approval of new chemical entities and biologics already approved by EMA and FDA, and a 60-day abridged procedure if the new product is approved by only one of them. Guidelines on registration of biological products in place (decree 150/2015) and in line with WHO standards. Egypt regulated clinical activities in 2016 through the National Guidelines and Regulations for Good Clinical Practice (Decree no. 734/2016) Before that, facilities for clinical research could not be accredited by foreign regulators. Large availability of counterfeit drugs as an effect of insufficient control and unclear supply chain, though a track and trace system is in place since 2016. Egypt lacks a biosafety framework that defines a transparent and clear policy for biotechnology, although biotech products have already been commercialized. A Biosafety Bill has been proposed, which should facilitate field trials and commercial use of GMOs. Creation of a National Food Safety Authority (NFSA) was approved by Parliament in December 2017 and is expected to bring more clarity to GMO rules and adopt science-based rules facilitating GE trade.
Factor 5: Technology transfer and commercialization frameworks
Egyptian law grants ownership of IP to the employer (and as such also universities) but lacks clarity and further details. A few Egyptian universities, such as Alexandria University and American University in Cairo, have technology transfer offices in place. The Academy of Scientific Research and Technology (ASRT), and in particular the Invention & Innovation Development Agency (IIDA), fosters technology transfer in the country and coordinates the National Network of Technology and Innovation Commercialization Offices (TICOs) in the country’s main PROs. ASRT also provides grants for the creation of Regional Technological Incubators (INTILAC) and innovation clusters known as the Knowledge and Technological Alliances (KTAs). Yet, a lack of nonfinancial and business support remains a major barrier for innovators willing to commercialize their inventions.
Factor 6: Market and commercial incentives
Biopharmaceutical pricing and reimbursement policies
External reference pricing was introduced in 2009 and mark-up regulation was added in 2012. Strict price controls in place and ad hoc price cuts taking place since 2011. Wide-spread shortages reported including for basic medicines such as insulin, vaccines and contraceptives.
R&D tax incentives No R&D tax incentives in place. The new Investment Law 2017 foresees a 30% deduction of investment costs from taxable net profit for certain industries, including manufacturing of antibiotics and oncology products, and agricultural crops and recycling of agricultural waste.
Factor 7: Rule of law Ranked 10 out of 113 countries

BUILDING THE BIOECONOMY 5TH EDITION
65 65
BUILDING THE BIOECONOMY 5TH EDITION
OUTPUTS
Scientific publications per million population, 2003-2016 68.3
Quality of academic publications, 2015 NA
Clinical trials per million population to date 23.56
Clinical trials for biologics per million population to date 0.66
Early phase (Phase I and II) clinical trials for biologics, per million population to date 0.29
Biotechnology triadic patenting, share of global total average 1999-2013 0.00%
Biopharmaceutical product launches, % available in country within 5 years of global product launch, 1983-2000
10.30%
National % share total number of patents from top 50 PCT applicants: universities, 2016 None
Biotechnology crops, hectares under cultivation, % of total 2016 None
BCI Survey Ranking 2017 Challenging
Venture Capital & Private Equity Country Attractiveness Index, Economy Ranking, 2018 52.7
Biofuels production, % of global total, 2017 NA

SECTION
66 66
FINLAND
ANNEX – INDIVIDUAL COUNTRY OVERVIEWS AND STATISTICS
INPUTS
Factor 1: Human capital
Number of researchers per million population 6,817 (OECD 2015)
Life sciences graduates (PhD & Masters), per million population
82.73 (OECD 2015)
Factor 2: Infrastructure for R&D
R&D spending % of GDP 2.7% (OECD 2016)
BERD spending as a % of total 54.8 (OECD 2015)
Total biotechnology R&D expenditure, Millions USD PPP, per million population
15.2 (OECD 2015)
Biotech R&D as a percentage of BERD 1.6 (OECD 2015)
Factor 3: Intellectual property protection 10-yr RDP term of protection and 5-yr SPC term in place. Substandard IP protection for pharmaceutical patents filed before 1995 (through ‘process patents’) will be fully phased out in 2019.
Factor 4: The regulatory environment High regulatory standards for biopharmaceuticals by the Finnish Medicines Agency (Fimea). Finland is one of few EU countries with a pragmatic, open approach to ag-bio technology; the country allows field trials and cultivation of GMOs.
Factor 5: Technology transfer and commercialization frameworks
Since 2007, the Act on the Right in Inventions made at Higher Education Institutions grants property of publicly funded inventions to universities. Intensifying cooperation between higher education and business to commercialise innovations is a key priority of the Health Growth Strategy. To support this goal, competence hubs and innovation campus operating models around university hospitals have been supported. The Health Capital Helsinki, a leading life sciences hub, is one such example. Business Finland runs thematic networks, including one on the bioeconomy and one on health and wellbeing, to connect domestic and international research organizations, companies, and other interest groups. Other initiatives include the SPARK Finland development program, which aids researchers and clinical health care professionals to create new products and business solution for the unmet needs of health care.
Factor 6: Market and commercial incentives
Biopharmaceutical pricing and reimbursement policies
Traditionally a challenging P&R environment for biopharmaceuticals. Because of the lower protection granted by analogy process patents, Originators have in some cases been subject to reference pricing (in place since 2009) and generic substitution, resulting in rapid price erosion both in Finland and other EU members that reference its prices. In 2017 the Government agreed with local stakeholders, including industry, on cost-containment measures that increased competition for biologics and biosimilars. As concerns reimbursement, innovative solutions such as adaptive reimbursement are being implemented in parallel to more punitive measures, notably the inclusion of imported generic medicines in the reference price system. On a positive note, Finland has set the target of 5% of all public procurement being innovative in nature.
R&D tax incentives Finland offers accelerated depreciation for R&D expenses, including expenditure incurred abroad.
Factor 7: Rule of law Ranked 3 out of 113 countries

BUILDING THE BIOECONOMY 5TH EDITION
67 67
BUILDING THE BIOECONOMY 5TH EDITION
OUTPUTS
Scientific publications per million population, 2003-2016 1,788.6
Quality of academic publications, 2015 11.4%
Clinical trials per million population to date 491.51
Clinical trials for biologics per million population to date 41.49
Early phase (Phase I and II) clinical trials for biologics, per million population to date 13.28
Biotechnology triadic patenting, share of global total average 1999-2013 0.46%
Biopharmaceutical product launches, % available in country within 5 years of global product launch, 1983-2000
43.50%
National % share total number of patents from top 50 PCT applicants: universities, 2016 None
Biotechnology crops, hectares under cultivation, % of total 2016 None
BCI Survey Ranking 2017 NA
Venture Capital & Private Equity Country Attractiveness Index, Economy Ranking, 2018 82.2
Biofuels production, % of global total, 2017 0.5%
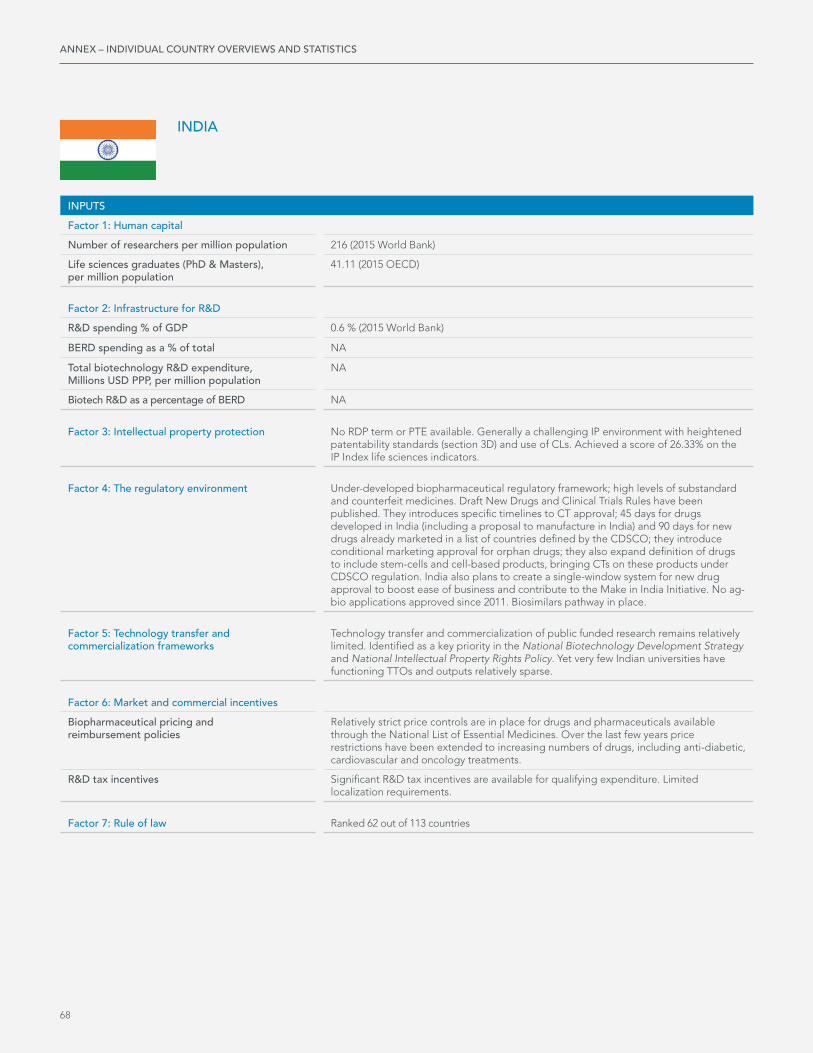
68
INDIA
ANNEX – INDIVIDUAL COUNTRY OVERVIEWS AND STATISTICS
INPUTS
Factor 1: Human capital
Number of researchers per million population 216 (2015 World Bank)
Life sciences graduates (PhD & Masters), per million population
41.11 (2015 OECD)
Factor 2: Infrastructure for R&D
R&D spending % of GDP 0.6 % (2015 World Bank)
BERD spending as a % of total NA
Total biotechnology R&D expenditure, Millions USD PPP, per million population
NA
Biotech R&D as a percentage of BERD NA
Factor 3: Intellectual property protection No RDP term or PTE available. Generally a challenging IP environment with heightened patentability standards (section 3D) and use of CLs. Achieved a score of 26.33% on the IP Index life sciences indicators.
Factor 4: The regulatory environment Under-developed biopharmaceutical regulatory framework; high levels of substandard and counterfeit medicines. Draft New Drugs and Clinical Trials Rules have been published. They introduces specific timelines to CT approval; 45 days for drugs developed in India (including a proposal to manufacture in India) and 90 days for new drugs already marketed in a list of countries defined by the CDSCO; they introduce conditional marketing approval for orphan drugs; they also expand definition of drugs to include stem-cells and cell-based products, bringing CTs on these products under CDSCO regulation. India also plans to create a single-window system for new drug approval to boost ease of business and contribute to the Make in India Initiative. No ag-bio applications approved since 2011. Biosimilars pathway in place.
Factor 5: Technology transfer and commercialization frameworks
Technology transfer and commercialization of public funded research remains relatively limited. Identified as a key priority in the National Biotechnology Development Strategy and National Intellectual Property Rights Policy. Yet very few Indian universities have functioning TTOs and outputs relatively sparse.
Factor 6: Market and commercial incentives
Biopharmaceutical pricing and reimbursement policies
Relatively strict price controls are in place for drugs and pharmaceuticals available through the National List of Essential Medicines. Over the last few years price restrictions have been extended to increasing numbers of drugs, including anti-diabetic, cardiovascular and oncology treatments.
R&D tax incentives Significant R&D tax incentives are available for qualifying expenditure. Limited localization requirements.
Factor 7: Rule of law Ranked 62 out of 113 countries

69
BUILDING THE BIOECONOMY 5TH EDITION
OUTPUTS
Scientific publications per million population, 2003-2016 48.6
Quality of academic publications, 2015 5.1%
Clinical trials per million population to date 2.55
Clinical trials for biologics per million population to date 0.20
Early phase (Phase I and II) clinical trials for biologics, per million population to date 0.09
Biotechnology triadic patenting, share of global total average 1999-2013 0.57%
Biopharmaceutical product launches, % available in country within 5 years of global product launch, 1983-2000
8.20%
National % share total number of patents from top 50 PCT applicants: universities, 2016 None
Biotechnology crops, hectares under cultivation, % of total 2016 5.83%
BCI Survey Ranking 2017 Mixed
Venture Capital & Private Equity Country Attractiveness Index, Economy Ranking, 2018 72.2
Biofuels production, % of global total, 2017 0.6%

70
INDONESIA
ANNEX – INDIVIDUAL COUNTRY OVERVIEWS AND STATISTICS
INPUTS
Factor 1: Human capital
Number of researchers per million population 90 (2009 World Bank)
Life sciences graduates (PhD & Masters), per million population
0.1 (OECD 2014)
Factor 2: Infrastructure for R&D
R&D spending % of GDP 0.085 % (2013 World Bank)
BERD spending as a % of total NA
Total biotechnology R&D expenditure, Millions USD PPP, per million population
NA
Biotech R&D as a percentage of BERD NA
Factor 3: Intellectual property protection No RDP term or PTE available. Generally a very challenging IP environment with heightened patentability standards introduced in 2016 and active use of CLs. Achieved a score of 26.59% on the IP Index life sciences indicators.
Factor 4: The regulatory environment Widespread presence of counterfeit and substandard medicines and weak pharmacovigilance system undermines the integrity of Indonesia’s drug supply chain. There are also strong mandatory localization efforts in place. Indonesia also does not allow the commercial cultivation of biotechnology agricultural products. The Government supports research efforts but not commercial cultivation.
Factor 5: Technology transfer and commercialization frameworks
Technology transfer and commercialization of publicly funded research remains relatively limited. Draft Bill on a National System of Science and Technology (Sinas IPTEK) should bring greater clarity to STI regulations including technology transfer.
Factor 6: Market and commercial incentives
Biopharmaceutical pricing and reimbursement policies
Limited public reimbursement for innovative products. Procurement and tendering favors generics and locally produced products. Multiple challenges exist for innovative products that are included in the national formulary and marketed in Indonesia. No clear methodology exists for their addition to the list or how long they will remain listed. Once listed, they cannot be sold for more than a 50% margin. Under the 2009 Health Law, generic prescription is compulsory within the public health system and packaging must include the generic name.
R&D tax incentives Limited R&D tax incentives; main incentive is accelerated depreciation and carry-forward of qualifying expenditure.
Factor 7: Rule of law Ranked 63 out of 113 countries

71
BUILDING THE BIOECONOMY 5TH EDITION
OUTPUTS
Scientific publications per million population, 2003-2016 7.8
Quality of academic publications, 2015 3.6%
Clinical trials per million population to date 1.43
Clinical trials for biologics per million population to date 0.11
Early phase (Phase I and II) clinical trials for biologics, per million population to date 0.05
Biotechnology triadic patenting, share of global total average 1999-2013 0.00%
Biopharmaceutical product launches, % available in country within 5 years of global product launch, 1983-2000
19.50%
National % share total number of patents from top 50 PCT applicants: universities, 2016 None
Biotechnology crops, hectares under cultivation, % of total 2016 None
BCI Survey Ranking 2017 Challenging
Venture Capital & Private Equity Country Attractiveness Index, Economy Ranking, 2018 64.3
Biofuels production, % of global total, 2017 3%

72
IRELAND
ANNEX – INDIVIDUAL COUNTRY OVERVIEWS AND STATISTICS
INPUTS
Factor 1: Human capital
Number of researchers per million population 4,575 (2015 World Bank)
Life sciences graduates (PhD & Masters), per million population
111.11 (OECD 2015)
Factor 2: Infrastructure for R&D
R&D spending % of GDP 1.17% (OECD 2016)
BERD spending as a % of total 48.4% (OECD 2015)
Total biotechnology R&D expenditure, Millions USD PPP, per million population
69.2 (OECD 2011)
Biotech R&D as a percentage of BERD 17% (OECD 2011)
Factor 3: Intellectual property protection Both 10-yr RDP term available and 5-yr SPC available under EU law. Achieved a score of 92.83% on the IP Index life sciences indicators.
Factor 4: The regulatory environment Like Denmark high drug regulatory standards through EMA and local Health Products Regulatory Authority. Ireland is not one of the countries that opted out of the EU Commission approved cultivation in 2015. However, there is currently no biotechnology cultivation in Ireland with only research taking place.
Factor 5: Technology transfer and commercialization frameworks
The National IP Protocol (first drafted in 2012) was updated in 2016 and provides a framework for companies and Research Performing Organizations on norms for research-related IP agreements. Overall, the Irish tech transfer system is well developed with public-private initiatives taking place at different levels, such as technological centers, larger collaborations such as the Health Innovation Ireland, and support programs such as the Innovation Vouchers, the Technology Gateway Program and the Technology Transfer Strengthening Initiative.
Factor 6: Market and commercial incentives
Biopharmaceutical pricing and reimbursement policies
Traditionally a generally sustainable pricing and reimbursement environment for biopharmaceutical companies. Yet, Ireland has recently been falling behind in access to new medicines compared to other advanced economies mostly because of delayed reimbursement. Ireland has joined the BeNeLuxA initiative for joint price negotiations, info sharing and policy exchange. 2013 Health (Pricing and Supply of Medical Goods) Act introduced a system of therapeutic reference pricing that applies to around 1,500 products (although prices are still competitive relative to other European markets). The 2013 Health Act also initiated automatic generic substitution where interchangeability between the generic and reference product has been formally established by the HPRA. Various accompanying initiatives have also been piloted, such as the Medicines Management Program, which identifies a single “preferred drug” within a therapeutic drug class, and accompanies it with prescribing tips for patients and guidelines for doctors.
R&D tax incentives Tax credits and deductions available for qualifying R&D expenditure; up to 25% of expenditure. Patent box incentives reduce corporate tax by 50% IP derived income.
Factor 7: Rule of law Not included

73
BUILDING THE BIOECONOMY 5TH EDITION
OUTPUTS
Scientific publications per million population, 2003-2016 1,266.4
Quality of academic publications, 2015 11.1%
Clinical trials per million population to date 296.45
Clinical trials for biologics per million population to date 24.93
Early phase (Phase I and II) clinical trials for biologics, per million population to date 5.45
Biotechnology triadic patenting, share of global total average 1999-2013 0.20%
Biopharmaceutical product launches, % available in country within 5 years of global product launch, 1983-2000
38.50%
National % share total number of patents from top 50 PCT applicants: universities, 2016 None
Biotechnology crops, hectares under cultivation, % of total 2016 None
BCI Survey Ranking 2017 Mixed
Venture Capital & Private Equity Country Attractiveness Index, Economy Ranking, 2018 79.7
Biofuels production, % of global total, 2017 Negligible

74
ISRAEL
ANNEX – INDIVIDUAL COUNTRY OVERVIEWS AND STATISTICS
INPUTS
Factor 1: Human capital
Number of researchers per million population 8,255 (2012 World Bank)
Life sciences graduates (PhD & Masters), per million population
140.38 (OECD 2015)
Factor 2: Infrastructure for R&D
R&D spending % of GDP 4.3% (OECD 2016)
BERD spending as a % of total 34.3% (OECD 2015)
Total biotechnology R&D expenditure, Millions USD PPP, per million population
50.07
Biotech R&D as a percentage of BERD 5.7%
Factor 3: Intellectual property protection 6-yr RDP term available but only for NCEs not biologics; 5-yr PTE available. Achieved a score of 68.39% on the IP Index life sciences indicators.
Factor 4: The regulatory environment High standard biopharma regulatory environment. Israeli MoH relies on the prior approval by a select number of drug regulatory authorities for innovative products, primarily the FDA and EMA. The stated maximum time for approval of innovative products is 270 days (although in practice, challenges remain surrounding registration delays). In 2006 a fast-track registration process was introduced for innovative drugs, setting a 45-day registration deadline for new drugs that are included in the Essential Drug List. Ag-bio not allowed for commercial production.
Factor 5: Technology transfer and commercialization frameworks
Technology transfer is well established in Israel, with over 10 tech transfer offices and companies present at the major universities and research institutions for over 50 years. Tech transfer model is similar to the US’ Bayh-Dole framework but based on largely independent and corporate-style offices heavily focused on generating royalties and creation of new companies, and has been widely successful. Indeed, two technology transfer offices in Israel, Yissum from Hebrew University and Yeda from the Weizmann Institute, are ranked among the top tech transfer offices worldwide. TTOs are active, with by some estimates an average of 150 new licensing deals, 15 start-ups and NIS1.5 billion (USD400 million) in royalties per year. The Israel Innovation Authority is setting up a second biotech incubator, located in the Northern District.
Factor 6: Market and commercial incentives
Biopharmaceutical pricing and reimbursement policies
The pricing and reimbursement environment remains mixed, in some ways rewarding biopharmaceutical innovation and in other ways putting significant price pressure and eroding reimbursement for cutting edge treatments. For example within Israel’s “basic basket” of health services that are reimbursed within the national health system is a fixed annual budget dedicated specifically to innovative products with a special committee determining regular additions to the basket. Yet at the same time, for other drugs the MoH uses an external reference pricing system to set pharmaceutical prices and price cuts are frequently imposed. A recent reform of the external reference pricing methods for innovative prescription drugs is expected to lead to further price reduction.
R&D tax incentives Significant R&D incentives in place for biotech, start-ups and targeted R&D. Under the 2017-2018 national budget Israel launched its “Innovation Box” aiming to attract MNCs’ operations. incentives include: a lowered corporate income tax of 6% to companies with global turnover of 2.5 billion USD, and 7.5%-12% for companies with lower turnover; a 4% tax on dividends; a capital gains / exit tax for sale of IP of 6% / 12% for companies with over/under 2.5 billion USD.
Factor 7: Rule of law Not included

75
BUILDING THE BIOECONOMY 5TH EDITION
OUTPUTS
Scientific publications per million population, 2003-2016 1,318.1
Quality of academic publications, 2015 10.1%
Clinical trials per million population to date 776.05
Clinical trials for biologics per million population to date 46.80
Early phase (Phase I and II) clinical trials for biologics, per million population to date 19.77
Biotechnology triadic patenting, share of global total average 1999-2013 1.13%
Biopharmaceutical product launches, % available in country within 5 years of global product launch, 1983-2000
24%
National % share total number of patents from top 50 PCT applicants: universities, 2016 0.95%
Biotechnology crops, hectares under cultivation, % of total 2016 None
BCI Survey Ranking 2017 Attractive
Venture Capital & Private Equity Country Attractiveness Index, Economy Ranking, 2018 81.8
Biofuels production, % of global total, 2017 Negligible

76
JAPAN
ANNEX – INDIVIDUAL COUNTRY OVERVIEWS AND STATISTICS
INPUTS
Factor 1: Human capital
Number of researchers per million population 5,231 (2015 World Bank)
Life sciences graduates (PhD & Masters), per million population
NA
Factor 2: Infrastructure for R&D
R&D spending % of GDP 3.1% (OECD 2016)
BERD spending as a % of total 78.1% (OECD 2016)
Total biotechnology R&D expenditure, Millions USD PPP, per million population
9.69
Biotech R&D as a percentage of BERD 1.2%
Factor 3: Intellectual property protection 8-yr RDP equivalent term available and 5-yr PTE available. Achieved a score of 88.73% on the IP Index life sciences indicators.
Factor 4: The regulatory environment High standard biopharma regulatory environment. Recent reform efforts have focused on reducing approval times for innovative products and incentivizing new R&D and clinical trials. The Sakigaki Strategy launched in 2014 provides support for pre-clinical and clinical research targeting cancer and orphan drug treatments through public-private coalitions and networks, improvements to infrastructure and fast-track review.
Factor 5: Technology transfer and commercialization frameworks
Japan introduced a Bayh-Dole framework in 1999 under the Industrial Revitalization Special Law. It covers a range of IP rights, including patents, utility models and seed and seedling registration rights, and similar to the US Bayh-Dole framework allows universities and public research institutions to own IP rights associated with publicly funded R&D. The Prime Minister’s 2017 “Strategy for Growth” sets a higher budget for science and technology, with a focus on strengthening public-private partnerships through the Public/Private R&D Investment Strategic Expansion Program.
Factor 6: Market and commercial incentives
Biopharmaceutical pricing and reimbursement policies
Japan has a highly regulated pricing environment with the Government setting prices and determining whether a drug will be reimbursed in the national health system based on the recommendation of the Central Social Insurance Medical Council. Ongoing price reforms are undermining the Government’s commitment to innovation. They add early price review for all prescription drugs, and quarterly for the newest, most expansive and widely used ones; they restrict the use of price-maintenance premiums that apply to some on-patent drugs and exempt them from price review; they increase the focus on cost effectiveness assessment, through the ongoing development of a fully-fledged HTA system. These actions risk undoing the innovation-based Sakigake Strategy, which included rewarding brand new drugs as well as biosimilars, vis-à-vis existing equivalent treatments.
R&D tax incentives Japan offers R&D tax incentives to both small and large companies. SMEs can qualify for a credit of 12% of total R&D spending and large companies for an 8-10% credit (which for both should be equal or lower than 25% of the company’s corporate tax rate). For SMEs the credit rises to 30% for R&D taking place in partnership with a university or PRO.
Factor 7: Rule of law Ranked 14 out of 113 countries

77
BUILDING THE BIOECONOMY 5TH EDITION
OUTPUTS
Scientific publications per million population, 2003-2016 833.4
Quality of academic publications, 2015 6.9%
Clinical trials per million population to date 39.50
Clinical trials for biologics per million population to date 3.42
Early phase (Phase I and II) clinical trials for biologics, per million population to date 1.75
Biotechnology triadic patenting, share of global total average 1999-2013 14.69%
Biopharmaceutical product launches, % available in country within 5 years of global product launch, 1983-2000
31.90%
National % share total number of patents from top 50 PCT applicants: universities, 2016 10.36%
Biotechnology crops, hectares under cultivation, % of total 2016 None
BCI Survey Ranking 2017 Mixed
Venture Capital & Private Equity Country Attractiveness Index, Economy Ranking, 2018 91.2
Biofuels production, % of global total, 2017 Negligible

78
KOREA
ANNEX – INDIVIDUAL COUNTRY OVERVIEWS AND STATISTICS
INPUTS
Factor 1: Human capital
Number of researchers per million population 7,087 (2015 World Bank)
Life sciences graduates (PhD & Masters), per million population
63.08 (OECD 2015)
Factor 2: Infrastructure for R&D
R&D spending % of GDP 4.24% (OECD 2016)
BERD spending as a % of total 75.4% (OECD 2016)
Total biotechnology R&D expenditure, Millions USD PPP, per million population
28.81 (OECD 2015)
Biotech R&D as a percentage of BERD 2.6% (OECD 2015)
Factor 3: Intellectual property protection 5-yr RDP term available and 5-yr PTE available. Yet, the Intellectual Property Trial and Appeal Board (IPTAB) of KIPO and the Patent Court of Korea provided a strict interpretation of PTE, reducing its scope to the approved drug product itself and not to the patented invention itself. This opens the way to marketing of follow-on patent-infringing products based on a different form of the same ingredient during the extension term. Achieved a score of 81.07% on the IP Index life sciences indicators.
Factor 4: The regulatory environment Korea has a relatively strong clinical and regulatory environment. For biopharmaceuticals the Ministry of Food and Drug Safety (formerly the Korean Food and Drug Administration) is responsible for the authorization and safety supervision of pharmaceuticals. The agency is highly regarded internationally and has been praised by the FDA. Korea introduced a biosimilar pathway in 2009. Plans announced to enhance regulatory management of biopharmaceuticals in 2017 (e.g. guidelines for clinical trials of gene therapy products, guidelines for cell therapy products etc.). After tightening GMO labelling rules earlier in 2017, the country’s Rural Development Administration (RDA) has committed “not to promote the production of genetically modified crops” and to shut down its Genetically Modified Crop Development Project; It also pledged to set up a joint committee with civic groups to hold regular deliberations about GMO research plans.
Factor 5: Technology transfer and commercialization frameworks
Korea early on recognized the importance of closer working relations between universities and businesses and encouraging the commercialization of publicly funded research. Since the early 2000s and the initial interest in developing technology transfer Korea has seen a steady growth in university licensing income and patent rates. Korean biotechnology industry has benefited directly from government-backed tech transfer initiatives through the Law for the Creation and Promotion of the Government Research Institutes enacted in 1999. This program sought to promote technology transfer and the commercialization of biotechnology through start-ups, venture capital partnerships and spin-offs.
Factor 6: Market and commercial incentives
Biopharmaceutical pricing and reimbursement policies
Korea has in place a strict P&R system applicable primarily to innovative products. Mandatory price cuts have been instituted through a therapeutic reference price system that places innovative and generic drugs in the same baskets, with prices set based on the average price in the basket. The innovative or therapeutic value of a given product is not factored into the price. This system is complemented by other measures including rebates associated with price-volume agreements. Moreover, inclusion for reimbursement is dually determined by a ruling of cost-effectiveness by the Health Insurance Review and Assessment Service and price negotiations with the National Health Insurance Corporation. Most recently Korea has introduced a number of changes to its P&R policies that favor local manufacturers and penalize foreign companies.
R&D tax incentives Korea offers R&D tax incentives for both large and SMEs. The incentives are based around incremental and volume-based deductions ranging from 40-50% for qualifying expenditure.
Factor 7: Rule of law Ranked 20 out of 113 countries

79
BUILDING THE BIOECONOMY 5TH EDITION
OUTPUTS
Scientific publications per million population, 2003-2016 924.6
Quality of academic publications, 2015 7.4%
Clinical trials per million population to date 177.03
Clinical trials for biologics per million population to date 11.12
Early phase (Phase I and II) clinical trials for biologics, per million population to date 4.68
Biotechnology triadic patenting, share of global total average 1999-2013 2.34%
Biopharmaceutical product launches, % available in country within 5 years of global product launch, 1983-2000
42.60%
National % share total number of patents from top 50 PCT applicants: universities, 2016 12.13%
Biotechnology crops, hectares under cultivation, % of total 2016 None
BCI Survey Ranking 2017 Attractive
Venture Capital & Private Equity Country Attractiveness Index, Economy Ranking, 2018 76.2
Biofuels production, % of global total, 2017 0.5%

80
MALAYSIA
ANNEX – INDIVIDUAL COUNTRY OVERVIEWS AND STATISTICS
INPUTS
Factor 1: Human capital
Number of researchers per million population 2,261 (2015 World Bank)
Life sciences graduates (PhD & Masters), per million population
NA
Factor 2: Infrastructure for R&D
R&D spending % of GDP 1.3% (World Bank 2015)
BERD spending as a % of total NA
Total biotechnology R&D expenditure, Millions USD PPP, per million population
NA
Biotech R&D as a percentage of BERD NA
Factor 3: Intellectual property protection 5-yr RDP term available de jure but de facto exclusivity term much less and limited to global launch; no PTE available. Use of compulsory license (‘Government Use License’) openly directed at reducing the price of HVC treatment sofosbuvir. Achieved a score of 44.71% on the IP Index life sciences indicators.
Factor 4: The regulatory environment DRA marked by long processing times for market authorization applications for biopharmaceuticals. While the agency and Ministry of Health have a target of 210 days for market approval industry reports suggest that lengthy delays are not uncommon. Malaysia introduced biosimilar guidelines in 2008 broadly in line with international standards.
Factor 5: Technology transfer and commercialization frameworks
Technology transfer at universities and public research institutions are guided by internal guidelines (often developed together with the main funder of the program, the Malaysian Government) and two Government regulations: the 1999 Government Circular and the 2009 Intellectual Property Policy. Data on transfer activities is relatively limited; WIPO patent statistics shows Malaysian activity is relatively low.
Factor 6: Market and commercial incentives
Biopharmaceutical pricing and reimbursement policies
Biopharmaceutical P&R environment is challenging. Reimbursement decisions are often delayed with industry reports suggesting delays of up to five years after regulatory approval. Moreover, there is, for example, no automatic inclusion of products onto the national formulary even if they were developed in Malaysia including through local clinical trials involving local patients. Only drugs included in the National Essential Medicine List are exempted from the 6% Good and Services Tax in force since April 2015.
R&D tax incentives Generous and relatively non-discriminatory tax incentives available, both biotech specific and general. The Investment Tax Allowance can take several forms including a 50% tax allowance on capital expenditures for ten years for companies performing in-house R&D and 100% tax allowance on capital expenditures for ten years for R&D service providers. A 200% super deduction on non-capital expenditures is available for companies conducting in-house R&D, donations to research institutes and on the registration of patents, trademarks and licenses overseas if it promotes an exported product. Domestic companies can achieve “Pioneer Status”. Companies receiving this designation pay no income tax on statutory income for five years and this benefit can be extended for an additional five years. BioNexus status is available to biotech companies and companies that derive a substantial amount of their final product from biotechnology. Qualifying entities receive a tax exemption on 100% of relevant income for a period of five-ten years (depending on the age of the entity) and a 20% tax exemption after the initial period has expired.
Factor 7: Rule of law Ranked 53 out of 113 countries

81
BUILDING THE BIOECONOMY 5TH EDITION
OUTPUTS
Scientific publications per million population, 2003-2016 321.4
Quality of academic publications, 2015 NA
Clinical trials per million population to date 33.31
Clinical trials for biologics per million population to date 2.21
Early phase (Phase I and II) clinical trials for biologics, per million population to date 0.55
Biotechnology triadic patenting, share of global total average 1999-2013 0.04%
Biopharmaceutical product launches, % available in country within 5 years of global product launch, 1983-2000
20.20%
National % share total number of patents from top 50 PCT applicants: universities, 2016 None
Biotechnology crops, hectares under cultivation, % of total 2016 None
BCI Survey Ranking 2017 Mixed
Venture Capital & Private Equity Country Attractiveness Index, Economy Ranking, 2018 83.1
Biofuels production, % of global total, 2017 Negligible

82
MEXICO
ANNEX – INDIVIDUAL COUNTRY OVERVIEWS AND STATISTICS
INPUTS
Factor 1: Human capital
Number of researchers per million population 242 (2013 World Bank)
Life sciences graduates (PhD & Masters), per million population
13.11 (OECD 2014)
Factor 2: Infrastructure for R&D
R&D spending % of GDP 0.5% (OECD 2016)
BERD spending as a % of total 20.7% (OECD 2016)
Total biotechnology R&D expenditure, Millions USD PPP, per million population
0.28 (OECD 2016)
Biotech R&D as a percentage of BERD 1.1% (OECD 2013)
Factor 3: Intellectual property protection 5-yr RDP term available but uncertainty over applicability to biologics; no PTE available. Achieved a score of 51.35% on the IP Index life sciences indicators.
Factor 4: The regulatory environment COFEPRIS has introduced a number of reforms and committed to cutting market authorization times. The agency has been commended for quickly approving medicines that meet urgent local needs, reducing the approval time for drugs already approved in the US, Canada, and EU from 360 days to 60 days. COFERIS approved medications are also approved with less scrutiny in many other South American countries. In 2014 the agency also cut the pre-approval time for clinical trials from 3 months to 1 month reflecting a desire to attract more biopharmaceutical investment and trial activity. For ag-bio Mexico has had a framework in place for over a decade. In 2005, the government passed the Biosafety Law that clarified regulatory issues relating to the research, production and marketing of biotech foods. The Inter-Ministerial Commission on Biosecurity and Genetically Modified Organisms and its subsidiary bodies oversees food related biotech activities. The biotechnology regulations enforced by the Commission are not considered burdensome.
Factor 5: Technology transfer and commercialization frameworks
Existing Mexican technology framework is ad hoc and is based largely on the policies in place at the institution receiving the public funding. Some initiatives in place to boost tech transfer activities (e.g. National Council of Science and Technology programs) but overall the environment is weak. OECD STI Outlook 2016 assessment of tech transfer Mexico was at the bottom of OECD economies.
Factor 6: Market and commercial incentives
Biopharmaceutical pricing and reimbursement policies
Mexico has strict price controls in place with maximum retail prices for patented medicines capped by Secretaría de Economía (mainly for private sector). Mexico uses an international reference pricing system calculated on the basis of the average ex-factory price of the previous quarter in the six largest markets for a given product globally. Public reimbursement of medicines in Mexico is primarily focused on cost and there are long delays with inclusion. Drug formularies under the major public schemes – Cuadro Básico y Catálogo de Medicamentos, Seguro Popular and the IMSS drug list – all contain relatively low levels of new, innovative drugs. The majority of products included are generic.
R&D tax incentives Mexico eliminated R&D tax credits and incentives in its 2010 tax reform replacing them with grants. New 30% federal R&D tax credit introduced in 2017.
Factor 7: Rule of law Ranked 88 out of 113 countries

83
BUILDING THE BIOECONOMY 5TH EDITION
OUTPUTS
Scientific publications per million population, 2003-2016 87
Quality of academic publications, 2015 3.8
Clinical trials per million population to date 23.81
Clinical trials for biologics per million population to date 1.93
Early phase (Phase I and II) clinical trials for biologics, per million population to date 0.53
Biotechnology triadic patenting, share of global total average 1999-2013 0.04%
Biopharmaceutical product launches, % available in country within 5 years of global product launch, 1983-2000
37.40%
National % share total number of patents from top 50 PCT applicants: universities, 2016 None
Biotechnology crops, hectares under cultivation, % of total 2016 0.05%
BCI Survey Ranking 2017 Attractive
Venture Capital & Private Equity Country Attractiveness Index, Economy Ranking, 2018 62.8
Biofuels production, % of global total, 2017 0.1%
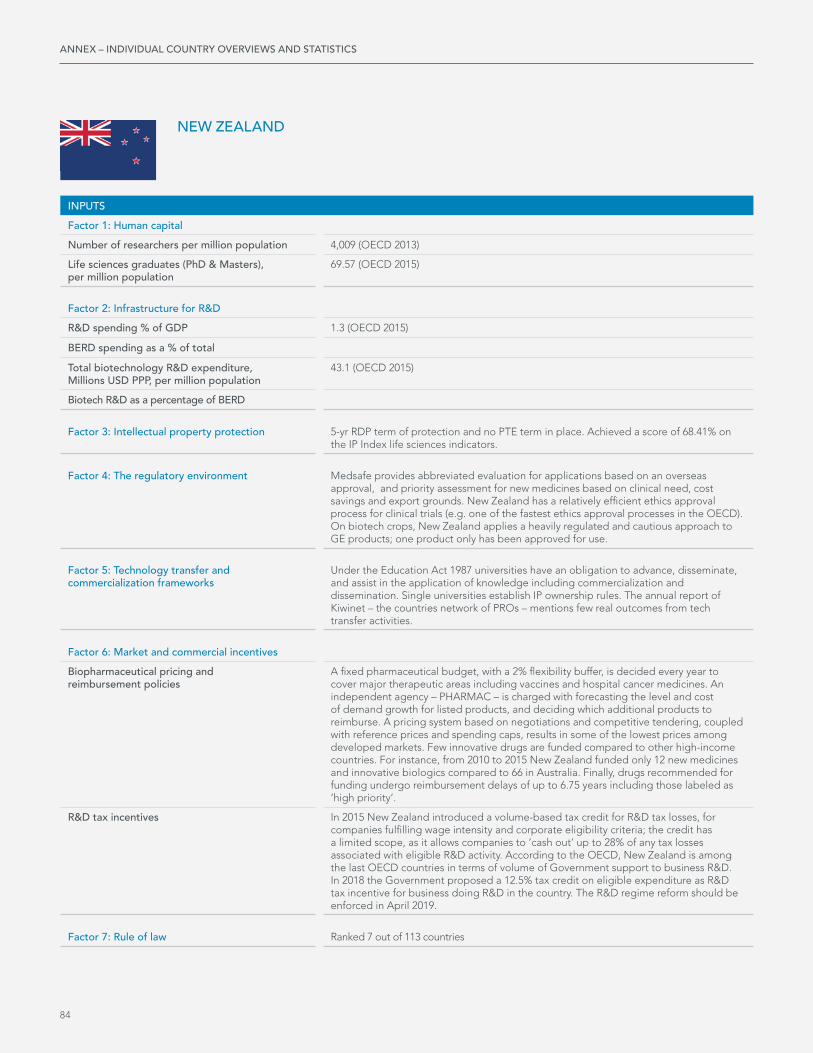
SECTION
84 84
NEW ZEALAND
ANNEX – INDIVIDUAL COUNTRY OVERVIEWS AND STATISTICS
INPUTS
Factor 1: Human capital
Number of researchers per million population 4,009 (OECD 2013)
Life sciences graduates (PhD & Masters), per million population
69.57 (OECD 2015)
Factor 2: Infrastructure for R&D
R&D spending % of GDP 1.3 (OECD 2015)
BERD spending as a % of total
Total biotechnology R&D expenditure, Millions USD PPP, per million population
43.1 (OECD 2015)
Biotech R&D as a percentage of BERD
Factor 3: Intellectual property protection 5-yr RDP term of protection and no PTE term in place. Achieved a score of 68.41% on the IP Index life sciences indicators.
Factor 4: The regulatory environment Medsafe provides abbreviated evaluation for applications based on an overseas approval, and priority assessment for new medicines based on clinical need, cost savings and export grounds. New Zealand has a relatively efficient ethics approval process for clinical trials (e.g. one of the fastest ethics approval processes in the OECD). On biotech crops, New Zealand applies a heavily regulated and cautious approach to GE products; one product only has been approved for use.
Factor 5: Technology transfer and commercialization frameworks
Under the Education Act 1987 universities have an obligation to advance, disseminate, and assist in the application of knowledge including commercialization and dissemination. Single universities establish IP ownership rules. The annual report of Kiwinet – the countries network of PROs – mentions few real outcomes from tech transfer activities.
Factor 6: Market and commercial incentives
Biopharmaceutical pricing and reimbursement policies
A fixed pharmaceutical budget, with a 2% flexibility buffer, is decided every year to cover major therapeutic areas including vaccines and hospital cancer medicines. An independent agency – PHARMAC – is charged with forecasting the level and cost of demand growth for listed products, and deciding which additional products to reimburse. A pricing system based on negotiations and competitive tendering, coupled with reference prices and spending caps, results in some of the lowest prices among developed markets. Few innovative drugs are funded compared to other high-income countries. For instance, from 2010 to 2015 New Zealand funded only 12 new medicines and innovative biologics compared to 66 in Australia. Finally, drugs recommended for funding undergo reimbursement delays of up to 6.75 years including those labeled as ‘high priority’.
R&D tax incentives In 2015 New Zealand introduced a volume-based tax credit for R&D tax losses, for companies fulfilling wage intensity and corporate eligibility criteria; the credit has a limited scope, as it allows companies to ‘cash out’ up to 28% of any tax losses associated with eligible R&D activity. According to the OECD, New Zealand is among the last OECD countries in terms of volume of Government support to business R&D. In 2018 the Government proposed a 12.5% tax credit on eligible expenditure as R&D tax incentive for business doing R&D in the country. The R&D regime reform should be enforced in April 2019.
Factor 7: Rule of law Ranked 7 out of 113 countries

BUILDING THE BIOECONOMY 5TH EDITION
85 85
BUILDING THE BIOECONOMY 5TH EDITION
OUTPUTS
Scientific publications per million population, 2003-2016 1,388.6
Quality of academic publications, 2015 9.8%
Clinical trials per million population to date 335.63
Clinical trials for biologics per million population to date 37.29
Early phase (Phase I and II) clinical trials for biologics, per million population to date 13.64
Biotechnology triadic patenting, share of global total average 1999-2013 0.34%
Biopharmaceutical product launches, % available in country within 5 years of global product launch, 1983-2000
28.80%
National % share total number of patents from top 50 PCT applicants: universities, 2016 None
Biotechnology crops, hectares under cultivation, % of total 2016 None
BCI Survey Ranking 2017 Challenging
Venture Capital & Private Equity Country Attractiveness Index, Economy Ranking, 2018 87.2
Biofuels production, % of global total, 2017 Negligible

SECTION
86 86
PERU
ANNEX – INDIVIDUAL COUNTRY OVERVIEWS AND STATISTICS
INPUTS
Factor 1: Human capital
Number of researchers per million population NA
Life sciences graduates (PhD & Masters), per million population
NA
Factor 2: Infrastructure for R&D
R&D spending % of GDP 0.1% (World Bank, 2015)
BERD spending as a % of total
Total biotechnology R&D expenditure, Millions USD PPP, per million population
NA
Biotech R&D as a percentage of BERD NA
Factor 3: Intellectual property protection 5-yr RDP term of protection, not covering new uses and indications. Although legislation does allow for protection of biologics, the government has taken the position that biologics are not included under this regime. No PTE. Achieved a score of 42.38% on the IP Index life sciences indicators.
Factor 4: The regulatory environment Regulatory barriers, processing delays and duplicative testing requirements create hurdles to product registration. Capabilities of the MoH General Direction of Medicines, Supplies and Drugs (DIGEMID) need to be increased to reduce current uncertainty and unpredictability. Since 2011 Peru has implemented a 10-year moratorium on biotech crops.
Factor 5: Technology transfer and commercialization frameworks
According to art 53 of the University Law (N. 30220) ownership remains with the university, which is entitled to at least 20% royalties. Nascent tech transfer framework, with limited TT capacity/patenting activity. CT activities are financed under the Peru Innovate program and SCIENCACTIVA (the agency in charge of the National Fund for STI) but are mostly based at increasing number of researchers. According to INDECOPI, in 2015 universities registered 63 patents (and business 52). A special Plan for Tech Transfer 2016-2021 was issued with the goal of enhancing industry’s competitiveness and productivity through tech transfer and enhanced IP protection.
Factor 6: Market and commercial incentives
Biopharmaceutical pricing and reimbursement policies
No direct price controls of pharmaceuticals. Public insurers cover the majority of products on the National formulary and essential medicines list (Petitorio Nacional Unico de Medicamentos Esenciales – PNME), but not necessarily other products. PNME is largely made up of generics. DIGEMID is considering parallel import of cancer drugs to bring down prices. Sharing of price info with Pacific Alliance countries.
R&D tax incentives The law on Fiscal Incentives to Innovation (Law 30309) creates special deduction regime for projects related to scientific research, technological development, and technological innovation as of 2016. According to this incentive, taxpayers investing in these projects will be able to deduct 150% or 175% of the expenses incurred.
Factor 7: Rule of law Ranked 60 out of 113 countries

BUILDING THE BIOECONOMY 5TH EDITION
87 87
BUILDING THE BIOECONOMY 5TH EDITION
OUTPUTS
Scientific publications per million population, 2003-2016 15.9
Quality of academic publications, 2015 NA
Clinical trials per million population to date 28.77
Clinical trials for biologics per million population to date 3.21
Early phase (Phase I and II) clinical trials for biologics, per million population to date 1.16
Biotechnology triadic patenting, share of global total average 1999-2013 0.00%
Biopharmaceutical product launches, % available in country within 5 years of global product launch, 1983-2000
20.60%
National % share total number of patents from top 50 PCT applicants: universities, 2016 None
Biotechnology crops, hectares under cultivation, % of total 2016 None
BCI Survey Ranking 2017 Mixed
Venture Capital & Private Equity Country Attractiveness Index, Economy Ranking, 2018 53.2
Biofuels production, % of global total, 2017 Negligible

88
RUSSIA
ANNEX – INDIVIDUAL COUNTRY OVERVIEWS AND STATISTICS
INPUTS
Factor 1: Human capital
Number of researchers per million population 3,131 (2015 World Bank)
Life sciences graduates (PhD & Masters), per million population
32.08 (OECD 2015)
Factor 2: Infrastructure for R&D
R&D spending % of GDP 1.10% (OECD 2016)
BERD spending as a % of total 28.1% (OECD 2016)
Total biotechnology R&D expenditure, Millions USD PPP, per million population
1.55 (OECD 2013)
Biotech R&D as a percentage of BERD 0.93% (OECD 2015)
Factor 3: Intellectual property protection 6-yr RDP term available but uncertainty over actual availability e.g. 2016 IP Court ruling; 5-yr PTE available. Achieved a score of 44.54% on the IP Index life sciences indicators. The Roadmap for Development of Competition in the Healthcare Sector – approved January 2018 – includes provisions that could hinder IP protection. Acting on it, the Federal Anti-Monopoly Service has submitted a new CL proposal.
Factor 4: The regulatory environment For biopharmaceuticals key challenges include lack of GMP enforcement, quality control (e.g. presence of counterfeit and substandard medicines) and localization requirements. Pharma 2020 includes clear targets for local production, including 50-70% of domestic drugs on the total pharmaceutical market (in 2012 the share was about 20%), 60% of patented medicine market in terms of value by local companies and 85-90% of the medicines on Russia’s Essential Drug List (EDL). For ag-bio commercial cultivation is outlawed. Amendments to the Law ‘On Circulation of Pharmaceuticals’” approved May 2018 removes the requirement of local GMP inspections. Increasing subsidies and tender preferences for national producers.
Factor 5: Technology transfer and commercialization frameworks
Central legislative framework for technology transfer focuses on enterprise partnerships as opposed to patenting and licensing agreements. Federal Law 217-FZ on the Commercialization of University Research (2009) provides universities with the exclusive right to market their research through launching their own SMEs or obtaining stock in companies that rely on their research. Specifically, Law N. 217 requires that universities have at least a 25-33% share in spin-offs, depending on the type of company, in exchange for the right to use the university invention. Looking at outputs patenting by Russian institutions is relatively low as is tech transfer activities at universities.
Factor 6: Market and commercial incentives
Biopharmaceutical pricing and reimbursement policies
P&R environment is challenging. Prices of medicines included in the EDL are subject to control on three levels (manufacturer, wholesaler and pharmacy prices) and by a process of registration of maximum manufacturer price and by wholesaler and pharmacy markup limitations (varying by region). The EDL, which is the basis for reimbursement in the hospital segment and the reference for regional formularies, is updated infrequently limiting reimbursement for medicines recently approved for market. Resolution 979 “On amendments to Resolution N.865” adopted in September 2015 introduced a step-down pricing system establishing that maximum selling prices for generics and biosimilars cannot exceed, respectively, 80% and 90% of the reference drug.
R&D tax incentives Russia offers a generous 150% R&D tax deduction on qualifying expenses. This is available generally as well as for targeted industries. In addition, entities operating in Special Economic Zones (such as the Skolkovo Innovation Centre) may qualify for additional tax credits and benefits.
Factor 7: Rule of law Ranked 89 out of 113 countries

89
BUILDING THE BIOECONOMY 5TH EDITION
OUTPUTS
Scientific publications per million population, 2003-2016 259.8
Quality of academic publications, 2015 4.8%
Clinical trials per million population to date 27.95
Clinical trials for biologics per million population to date 2.81
Early phase (Phase I and II) clinical trials for biologics, per million population to date 0.96
Biotechnology triadic patenting, share of global total average 1999-2013 0.26%
Biopharmaceutical product launches, % available in country within 5 years of global product launch, 1983-2000
14.30%
National % share total number of patents from top 50 PCT applicants: universities, 2016 None
Biotechnology crops, hectares under cultivation, % of total 2016 None
BCI Survey Ranking 2017 Challenging
Venture Capital & Private Equity Country Attractiveness Index, Economy Ranking, 2018 63.5
Biofuels production, % of global total, 2017 Negligible

90
SAUDI ARABIA
ANNEX – INDIVIDUAL COUNTRY OVERVIEWS AND STATISTICS
INPUTS
Factor 1: Human capital
Number of researchers per million population NA
Life sciences graduates (PhD & Masters), per million population
NA
Factor 2: Infrastructure for R&D
R&D spending % of GDP 0.082% (World Bank 2013)
BERD spending as a % of total NA
Total biotechnology R&D expenditure, Millions USD PPP, per million population
NA
Biotech R&D as a percentage of BERD NA
Factor 3: Intellectual property protection Clear 5-yr RDP term in place. Some reports indicate follow-on products have been approved through indirect reliance. No PTE offered. In 2017, the SFDA effectively overrode Saudi Arabia’s linkage regime by approving for market a follow-on product to Daclatasvir. Achieved a score of 41.22% on the IP Index life sciences indicators.
Factor 4: The regulatory environment Saudi FDA viewed as being a high standard DRA comparable to Singapore, Canada etc. New fast-track verification route for product approval implemented in 2017. Ag-bio regulatory framework in place, with strict labeling requirements. There is currently no commercial cultivation of ag-bio products.
Factor 5: Technology transfer and commercialization frameworks
Technology transfer has been a key part of Saudi Arabia’s science and technology framework since the early 2000s and the 2002 National Policy for Science and Technology. There are several key initiatives most notably the government-owned Technology Development and Investment Company that is tasked with developing and launching industrial opportunities aligned with the national research center priorities as Joint Ventures with international technology companies. There is also the 2014 Saudi Arabia Advanced Research Alliance a public-private collaboration among the main entities working on innovation (KACST, TAQNIA, KAUST KFUPM and RTI International) aimed at supporting commercialization of new technologies. Saudi Arabia is one of the few emerging markets whose universities are among the top-50 globally in terms of PCT patent applications.
Factor 6: Market and commercial incentives
Biopharmaceutical pricing and reimbursement policies
Pricing environment based on IRP. Basket of countries frequently includes low-income economies with substantially lower per capita income than Saudi Arabia. Maximum prices based on lowest price in basket of comparable countries. BCI Survey results 2016 suggest that pricing policy lacks transparency and predictability.
R&D tax incentives No statutory R&D tax incentives in place. Some R&D grants made directly by KAUST.
Factor 7: Rule of law Not included

91
BUILDING THE BIOECONOMY 5TH EDITION
OUTPUTS
Scientific publications per million population, 2003-2016 138.6
Quality of academic publications, 2015 NA
Clinical trials per million population to date 16.76
Clinical trials for biologics per million population to date 0.65
Early phase (Phase I and II) clinical trials for biologics, per million population to date 0.15
Biotechnology triadic patenting, share of global total average 1999-2013 0.01%
Biopharmaceutical product launches, % available in country within 5 years of global product launch, 1983-2000
13.70%
National % share total number of patents from top 50 PCT applicants: universities, 2016 2.72%
Biotechnology crops, hectares under cultivation, % of total 2016 None
BCI Survey Ranking 2017 Mixed
Venture Capital & Private Equity Country Attractiveness Index, Economy Ranking, 2018 64.3
Biofuels production, % of global total, 2017 Negligible

92
SINGAPORE
ANNEX – INDIVIDUAL COUNTRY OVERVIEWS AND STATISTICS
INPUTS
Factor 1: Human capital
Number of researchers per million population 6,658 (World Bank 2014)
Life sciences graduates (PhD & Masters), per million population
154.8 (Singapore Statistics 2016)
Factor 2: Infrastructure for R&D
R&D spending % of GDP 2.2% (OECD 2014)
BERD spending as a % of total 53.1% (OECD 2014)
Total biotechnology R&D expenditure, Millions USD PPP, per million population
NA
Biotech R&D as a percentage of BERD NA
Factor 3: Intellectual property protection Clear 5-yr RDP and PTE term in place. Achieved a score of 81.08% on the IP Index life sciences indicators.
Factor 4: The regulatory environment Health Sciences Authority is highly regarded and is involved in the regulation of Western medicinal products as well as Chinese proprietary medicines and cosmetic products. Circa 80% of marketing applications approved through an abridged route relying on evaluations from leading drug regulatory agencies in other countries. Under this route the approval time is on average just 60-180 days (depending on the number of external evaluations available). An additional priority review path is also available for certain life-threatening conditions with limited treatment options, which further reduces approval time to 60 days. GM foods are regulated by the Genetic Modification Advisory Committee. Singapore’s regulations are science-based and the registration process is generally viewed as efficient.
Factor 5: Technology transfer and commercialization frameworks
Singapore has a strong tradition of technology transfer with governmental bodies as well as academic institutions being closely involved in transfer activities. Biotech/pharm specific transfer activities include the Biomedical Sciences Industry Partnership Office that liaises between universities, public research institutes and industry. Singapore’s main bio clusters host domestic and international firms, biomedical research institutions and are also integrating governmental R&D bodies. Technology transfer is also being promoted and is made accessible by the close proximity of these bio clusters to the Singapore Science Park and the National University.
Factor 6: Market and commercial incentives
Biopharmaceutical pricing and reimbursement policies
The biopharmaceutical market is relatively free with government subsidies in place only for pharmaceuticals included on the Standard Drug List (though this covers the majority of drugs prescribed). Products may be added to the list on an annual basis. Under the scheme, “essential” or first-line drugs are the most heavily subsidized, with patients covering just SGD1.40 per item per week. For relatively more expensive essential drugs patients pay 50% of the sales price. Drugs not included on the list are priced based on the market. Additional concerns over access are addressed through financial assistance schemes, such as the special chronic disease insurance program.
R&D tax incentives The 2018 budget replaced the expiring Productivity and Innovation Credit Scheme with a Productivity Solution Grant. The new Scheme foresees a 250% tax deduction for R&D activities conducted in the country, with no monetary cap on expenditure, and a 200% deduction for IP registration and licensing, capped at $100,000 annually. As before, the majority of this relief is available on R&D performed in Singapore. Singapore also has an “angel investors tax deduction” program that provides a tax deduction for 50% of the investment amount, up to a cap of SGD500,000.
Factor 7: Rule of law Ranked 13 out of 113 countries

93
BUILDING THE BIOECONOMY 5TH EDITION
OUTPUTS
Scientific publications per million population, 2003-2016 1,666.5
Quality of academic publications, 2015 NA
Clinical trials per million population to date 358.46
Clinical trials for biologics per million population to date 22.83
Early phase (Phase I and II) clinical trials for biologics, per million population to date 9.99
Biotechnology triadic patenting, share of global total average 1999-2013 0.41%
Biopharmaceutical product launches, % available in country within 5 years of global product launch, 1983-2000
25.50%
National % share total number of patents from top 50 PCT applicants: universities, 2016 2.65%
Biotechnology crops, hectares under cultivation, % of total 2016 None
BCI Survey Ranking 2017 Attractive
Venture Capital & Private Equity Country Attractiveness Index, Economy Ranking, 2018 90.7
Biofuels production, % of global total, 2017 Negligible

94
SOUTH AFRICA
ANNEX – INDIVIDUAL COUNTRY OVERVIEWS AND STATISTICS
INPUTS
Factor 1: Human capital
Number of researchers per million population 437 (World Bank 2013)
Life sciences graduates (PhD & Masters), per million population
NA
Factor 2: Infrastructure for R&D
R&D spending % of GDP 0.8% (World Bank 2015)
BERD spending as a % of total 38.9% (OECD 2015)
Total biotechnology R&D expenditure, Millions USD PPP, per million population
1.31
Biotech R&D as a percentage of BERD 3%
Factor 3: Intellectual property protection Neither RDP term of protection nor PTE term in place. Achieved a score of 31.92% on the IP Index life sciences indicators. New IP Policy approved in 2018 expands the use of TRIPS flexibilities, raises the bar to receive patent protection and introduces substantive search and examination.
Factor 4: The regulatory environment Primary challenge has been long approval delays for biopharmaceuticals. The South African Health Products Regulatory Authority (SAHPRA) finally started to work in February 2018 with a broader mandate than the Medicines Control Council (MCC), which includes registration and control of medical devices, in vitro diagnostics, and complementary medicines. The new watchdog has announced the use of external experts and definition of reliance pathways as ways to tackle the large approval backlog. South Africa is a global leader and major producer of ag-bio crops with a clear regulatory framework in place. The 1997 GMO Act and the 2011 Consumer Protection Bill regulate the production and consumption of GE food.
Factor 5: Technology transfer and commercialization frameworks
South Africa introduced a modern technology transfer framework in 2008. The “Intellectual Property Rights from Publicly Financed Research and Development Act” established the parameters by which publicly funded research can be commercialized and, crucially, where ownership over the generated IP resides. The stated purpose of the Act has been to stimulate research and the commercialization of publicly funded research. Broadly speaking the Act and its accompanying regulations establish the principle that the recipient will retain IP generated through publicly funded research.
Factor 6: Market and commercial incentives
Biopharmaceutical pricing and reimbursement policies
P&R system both directly and indirectly prioritizes generic drugs, primarily through a new external referencing pricing system that favors low cost drugs and generic substitution policies. Since 2005 biopharmaceutical prices have been capped at a rate in line with inflation, which for imported medicines is typically considered to be under value in relation to the exchange rate. On top of this, in 2015 a de facto external referencing price mechanism was introduced for innovative drugs. Under the new regulation innovative manufacturers will have to provide the price of their drugs in Australia, New Zealand, Spain and Canada (or, if not present in these markets, in all the countries they are sold) and the DoH will reportedly request companies to forego the yearly price increases if the price applied in South Africa is higher than these reference prices.
R&D tax incentives South Africa offers relatively generous R&D tax benefits including a 150% super deduction for R&D expenditures and accelerated depreciation for capital expenditures incurred to develop or construct assets used in R&D activities (40% for the first year and 20% in the three years after for infrastructure built after 2012). The Government is reviewing the incentives system to address their main shortcomings, such as administrative delays and limited access for SMEs.
Factor 7: Rule of law Ranked 44 out of 113 countries
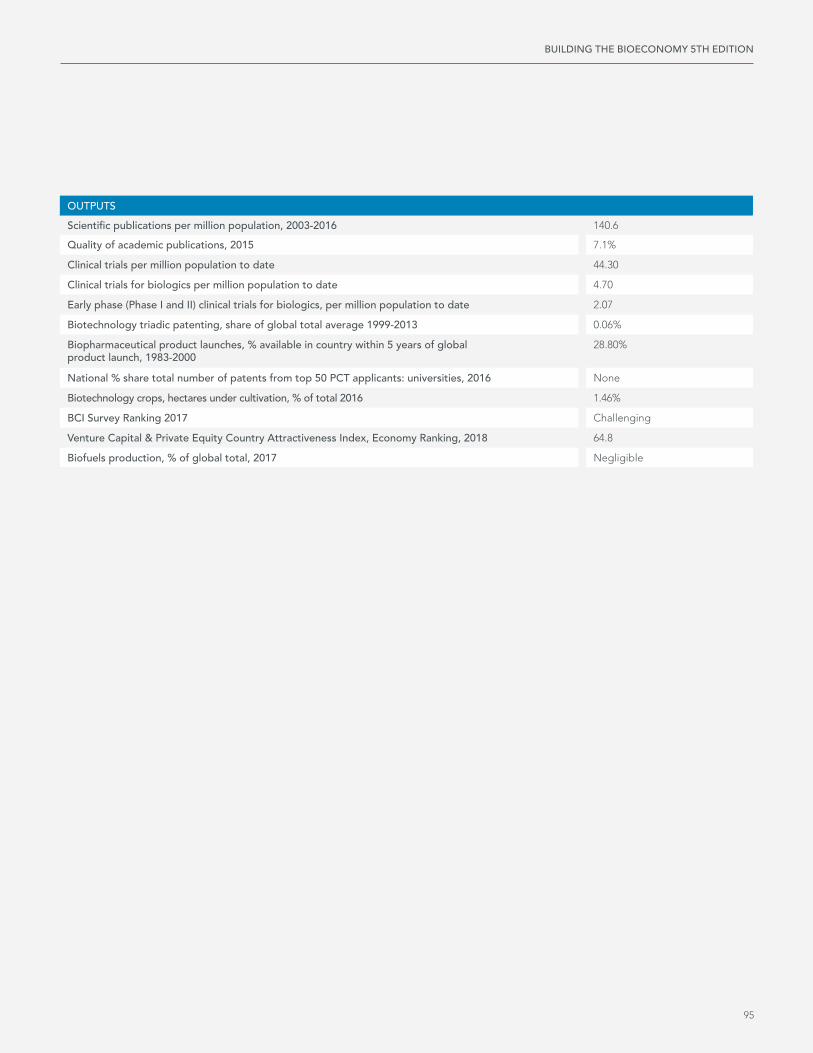
95
BUILDING THE BIOECONOMY 5TH EDITION
OUTPUTS
Scientific publications per million population, 2003-2016 140.6
Quality of academic publications, 2015 7.1%
Clinical trials per million population to date 44.30
Clinical trials for biologics per million population to date 4.70
Early phase (Phase I and II) clinical trials for biologics, per million population to date 2.07
Biotechnology triadic patenting, share of global total average 1999-2013 0.06%
Biopharmaceutical product launches, % available in country within 5 years of global product launch, 1983-2000
28.80%
National % share total number of patents from top 50 PCT applicants: universities, 2016 None
Biotechnology crops, hectares under cultivation, % of total 2016 1.46%
BCI Survey Ranking 2017 Challenging
Venture Capital & Private Equity Country Attractiveness Index, Economy Ranking, 2018 64.8
Biofuels production, % of global total, 2017 Negligible

SECTION
96 96
SWEDEN
ANNEX – INDIVIDUAL COUNTRY OVERVIEWS AND STATISTICS
INPUTS
Factor 1: Human capital
Number of researchers per million population 7,022 (World Bank 2015)
Life sciences graduates (PhD & Masters), per million population
67.68 (OECD 2015)
Factor 2: Infrastructure for R&D
R&D spending % of GDP 3.3% (OECD 2016)
BERD spending as a % of total 57.3% (OECD 2015)
Total biotechnology R&D expenditure, Millions USD PPP, per million population
49.7 (OECD 2015)
Biotech R&D as a percentage of BERD 4.6% (OECD 2015)
Factor 3: Intellectual property protection 10-yr RDP term of protection and 5-yr SPC term in place. Achieved a score of 93.58% on the IP Index life sciences indicators.
Factor 4: The regulatory environment The 2015 Medicinal Products Act regulates the production, registration and distribution of drugs. The Swedish Medical Product Agency (Läkemedelverket) commits to take marketing approval decisions within 210 days from the filing of the application; The Medical Products Agency issued a National Pharmaceutical Strategy 2016-2018, a collaborative efforts to ensure equal access, safe and effective use and environmental sustainability of drugs. With respect to biotech crops, the government has implemented a system whereby every use should be judged on its own risks and merits. Chapter 13 of the Swedish Environmental Code regulates all use of GMOs. One of the 6 EU countries to conduct open field tests in 2017; cultivation is allowed but no GE corn is grown; Sweden has adopted legislation that explicitly prohibits ‘GE-free’ labeling; however, the government increasingly pressured by public negative opinion on GMOs.
Factor 5: Technology transfer and commercialization frameworks
The Act regarding the right to employee inventions and its university employee exemption became law in 1949, and is still in force. The law establishes the professor privilege. Swedish university employees retain the exclusive right to all patentable inventions. Swedish TTOs are located in the eight largest universities and are partly funded by a government support program. Government funding requires that the eight TTOs also take a regional responsibility serving also smaller universities and colleges in the region. Each university also has a holding company that can invest into university spin-off. These university holding companies have limited investment funds that often make them work with investors, private and other state investment companies. The life science cooperation program brings together industry, academia and public institutions through regular meetings since 2015. The priority areas of the cooperation program include a common technical standard and semantics for faster dissemination of knowledge and development of products and services. Sweden’s innovation agency VINNOVA supports a national pilot project to develop Swedish science parks as regional nodes in the national innovation system. State new venture capital company – Saminvest – launched July 2017 with the task of investing in privately-managed venture capital funds, where there is a need for market-compliant investments.

BUILDING THE BIOECONOMY 5TH EDITION
97 97
BUILDING THE BIOECONOMY 5TH EDITION
OUTPUTS
Scientific publications per million population, 2003-2016 1,806.6
Quality of academic publications, 2015 12.5
Clinical trials per million population to date 531.85
Clinical trials for biologics per million population to date 35.44
Early phase (Phase I and II) clinical trials for biologics, per million population to date 13.13
Biotechnology triadic patenting, share of global total average 1999-2013 1.61%
Biopharmaceutical product launches, % available in country within 5 years of global product launch, 1983-2000
38.90%
National % share total number of patents from top 50 PCT applicants: universities, 2016 None
Biotechnology crops, hectares under cultivation, % of total 2016 None
BCI Survey Ranking 2017 NA
Venture Capital & Private Equity Country Attractiveness Index, Economy Ranking, 2018 83.3
Biofuels production, % of global total, 2017 0.3%
INPUTS
Factor 6: Market and commercial incentives
Biopharmaceutical pricing and reimbursement policies
The Board of Pharmaceutical Benefits within the Dental and pharmaceutical benefits agency (TLV) decides simultaneously on pricing and reimbursement for new drugs to be included in the benefits scheme. The decision is based on clinical evidence and health economic documentation provided by pharmaceutical companies. TLV collaborates with the Swedish Agency for Health Technology Assessment and Assessment of Social Services for health economic assessment. TLV and the 21 county/region councils (responsible for drug procurement and for issuing a list of drugs to be used as first choice treatments) negotiate prices with drug companies. The reimbursement decision depends on several factors, where one may be the existence of a managed entry agreement between the county councils and the pharmaceutical company. Also, managed entry agreements between pharmaceutical companies and county councils include growing payback amounts. The pricing system is reportedly complex, and a pricing reform is ongoing to tackle these complexities; the reform is considering introducing a state fund dedicated to new innovative drugs.
R&D tax incentives R&D tax incentives are offered in the form of reduced social security contributions for R&D employees engaged in commercially performed R&D.
Factor 7: Rule of law Ranked 4 out of 113 countries
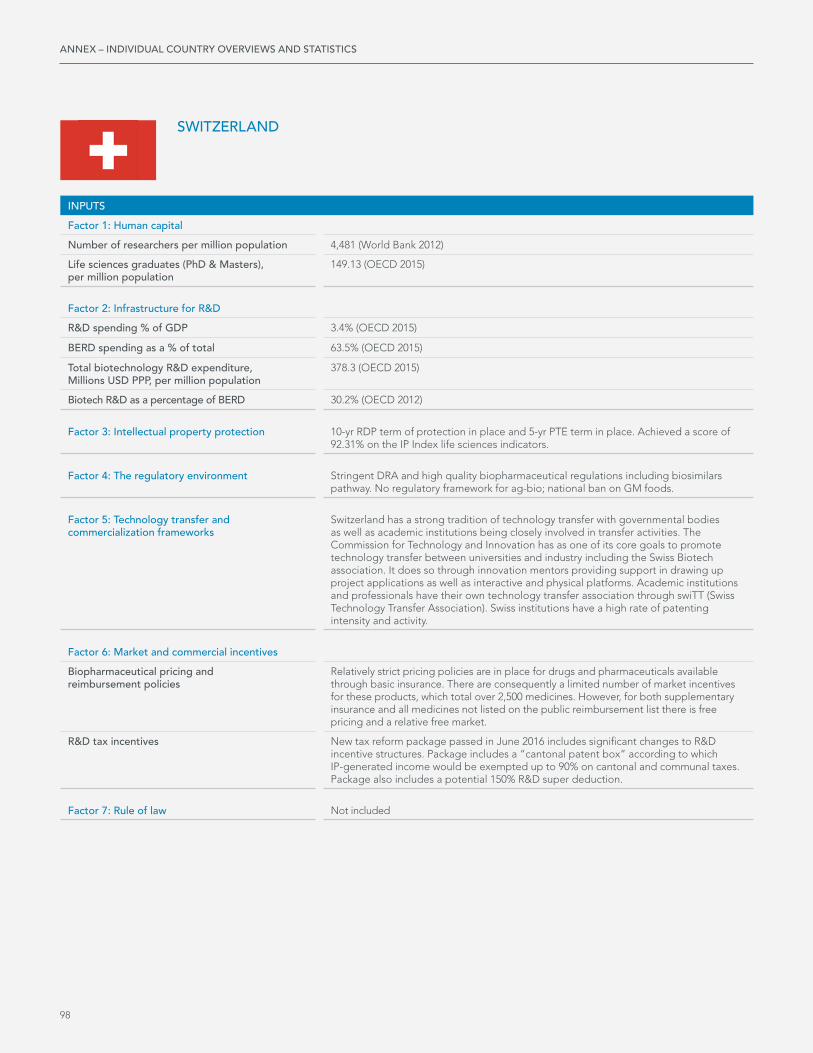
98
SWITZERLAND
ANNEX – INDIVIDUAL COUNTRY OVERVIEWS AND STATISTICS
INPUTS
Factor 1: Human capital
Number of researchers per million population 4,481 (World Bank 2012)
Life sciences graduates (PhD & Masters), per million population
149.13 (OECD 2015)
Factor 2: Infrastructure for R&D
R&D spending % of GDP 3.4% (OECD 2015)
BERD spending as a % of total 63.5% (OECD 2015)
Total biotechnology R&D expenditure, Millions USD PPP, per million population
378.3 (OECD 2015)
Biotech R&D as a percentage of BERD 30.2% (OECD 2012)
Factor 3: Intellectual property protection 10-yr RDP term of protection in place and 5-yr PTE term in place. Achieved a score of 92.31% on the IP Index life sciences indicators.
Factor 4: The regulatory environment Stringent DRA and high quality biopharmaceutical regulations including biosimilars pathway. No regulatory framework for ag-bio; national ban on GM foods.
Factor 5: Technology transfer and commercialization frameworks
Switzerland has a strong tradition of technology transfer with governmental bodies as well as academic institutions being closely involved in transfer activities. The Commission for Technology and Innovation has as one of its core goals to promote technology transfer between universities and industry including the Swiss Biotech association. It does so through innovation mentors providing support in drawing up project applications as well as interactive and physical platforms. Academic institutions and professionals have their own technology transfer association through swiTT (Swiss Technology Transfer Association). Swiss institutions have a high rate of patenting intensity and activity.
Factor 6: Market and commercial incentives
Biopharmaceutical pricing and reimbursement policies
Relatively strict pricing policies are in place for drugs and pharmaceuticals available through basic insurance. There are consequently a limited number of market incentives for these products, which total over 2,500 medicines. However, for both supplementary insurance and all medicines not listed on the public reimbursement list there is free pricing and a relative free market.
R&D tax incentives New tax reform package passed in June 2016 includes significant changes to R&D incentive structures. Package includes a “cantonal patent box” according to which IP-generated income would be exempted up to 90% on cantonal and communal taxes. Package also includes a potential 150% R&D super deduction.
Factor 7: Rule of law Not included

99
BUILDING THE BIOECONOMY 5TH EDITION
OUTPUTS
Scientific publications per million population, 2003-2016 2,205.7
Quality of academic publications, 2015 15.3%
Clinical trials per million population to date 663.16
Clinical trials for biologics per million population to date 48.37
Early phase (Phase I and II) clinical trials for biologics, per million population to date 20.54
Biotechnology triadic patenting, share of global total average 1999-2013 2.04%
Biopharmaceutical product launches, % available in country within 5 years of global product launch, 1983-2000
44.40%
National % share total number of patents from top 50 PCT applicants: universities, 2016 1.46%
Biotechnology crops, hectares under cultivation, % of total 2016 None
BCI Survey Ranking 2017 Attractive
Venture Capital & Private Equity Country Attractiveness Index, Economy Ranking, 2018 82.2
Biofuels production, % of global total, 2017 Negligible

100
TAIWAN
ANNEX – INDIVIDUAL COUNTRY OVERVIEWS AND STATISTICS
INPUTS
Factor 1: Human capital
Number of researchers per million population 7,892 (Taiwan Ministry of Science and Technology 2016)
Life sciences graduates (PhD & Masters), per million population
115.36 (Taiwan Ministry of Science and Technology 2016)
Factor 2: Infrastructure for R&D
R&D spending % of GDP 3.2% (OECD 2016)
BERD spending as a % of total 77.7% (OECD 2016)
Total biotechnology R&D expenditure, Millions USD PPP, per million population
36.2 (Taiwan Ministry of Science and Technology 2016)
Biotech R&D as a percentage of BERD NA
Factor 3: Intellectual property protection 5-yr RDP term of protection in place and 5-yr PTE term in place. Achieved a score of 61.82% on the IP Index life sciences indicators.
Factor 4: The regulatory environment Taiwan’s DRA is viewed as quite strong adhering to international regulatory standards; however, there have been long delays in product approvals. Japan and Taiwan have launched a pilot Project expected to accelerate new drug reviews in Taiwan by using Japan’s Pharmaceutical and Medial Devices Agency’s review reports. With regards to ag-bio there is no commercial cultivation of biotechnology products. Taiwan is a significant importer of GM corn, cotton and soybeans from the US and Brazil. Labeling is required on some products but generally the regulatory framework is science based.
Factor 5: Technology transfer and commercialization frameworks
The Basic Law on Science and Technology introduced in 1999 establishes a Bayh-Dole style framework for tech transfer such that publicly funded IP rights and technologies are fully owned by public institutions. At the same time, the government promoted patenting and licensing as a means of university and PRI income by reducing other types of funding for universities or by matching any revenue gained from the private sector. Significant resources are dedicated to training IP management and commercialization for universities and SMEs. Taiwanese universities and research institutes are known for strong patenting rates as well as generating substantial income from royalties and license fees. Rates of patents registered by the Industrial Technology Research Institute (IRTI, the largest public research institute) with the USPTO and co-owned by either a university or firm rising more than eight times between 2002 and 2012.
Factor 6: Market and commercial incentives
Biopharmaceutical pricing and reimbursement policies
National Health Insurance pricing is considered a significant challenge, involving annual drug price and spending targets and delays in approval of reimbursement, especially for innovative products.
R&D tax incentives Business tax rate is 17% (fell from 25% under 2010 amendments to the Income Tax Act); plus a 15% tax credit for R&D-directed business expenditures as well as R&D investment off-sets for SMEs under the SME Development Regulations.
Factor 7: Rule of law Not included

101
BUILDING THE BIOECONOMY 5TH EDITION
OUTPUTS
Scientific publications per million population, 2003-2016 1,076.6
Quality of academic publications, 2015
Clinical trials per million population to date 228.04
Clinical trials for biologics per million population to date 12.91
Early phase (Phase I and II) clinical trials for biologics, per million population to date 4.38
Biotechnology triadic patenting, share of global total average 1999-2013 0.38%
Biopharmaceutical product launches, % available in country within 5 years of global product launch, 1983-2000
28.30%
National % share total number of patents from top 50 PCT applicants: universities, 2016 None
Biotechnology crops, hectares under cultivation, % of total 2016 None
BCI Survey Ranking 2017 Attractive
Venture Capital & Private Equity Country Attractiveness Index, Economy Ranking, 2018 76.9
Biofuels production, % of global total, 2017 Negligible

102
THAILAND
ANNEX – INDIVIDUAL COUNTRY OVERVIEWS AND STATISTICS
INPUTS
Factor 1: Human capital
Number of researchers per million population 974 (World Bank 2014)
Life sciences graduates (PhD & Masters), per million population
NA
Factor 2: Infrastructure for R&D
R&D spending % of GDP 0.63% (World Bank 2015)
BERD spending as a % of total NA
Total biotechnology R&D expenditure, Millions USD PPP, per million population
NA
Biotech R&D as a percentage of BERD NA
Factor 3: Intellectual property protection No RDP term of protection or PTE term in place. Achieved a score of 27.65% on the IP Index life sciences indicators.
Factor 4: The regulatory environment Real quality concerns and lack of regulatory resources. To address this lack of resources, the Prime Minister issued Order No. 77/2559 in 2016 which allows the FDA to re-invest its revenues to improve the approval process (new official fee structure unveiled Nov 2017) and outsource some of its work Lack of enforcement of cGMP requirements and self-regulation of GPO entity. De facto ban in place on GM crop cultivation with no field trials allowed and no commercial sale of GE products. Ag-bio regulatory framework in limbo.
Factor 5: Technology transfer and commercialization frameworks
Thailand’s innovation infrastructure fundamentally being reformed in 2017. IP Commercialization Law allows transfer of IP ownership from funding agencies to grantees. Existing technology and commercialization efforts are primarily based in the National Science and Technology Development Agency, the main national PRO. The Agency has a relatively extensive patent portfolio and partners with industry, universities and other research institutes in Thailand. Mahidol University – the main university for medical studies – has an established tech transfer system in place; yet, overall, the operation of TTOs in universities is judged bureaucratic and inefficient A recent proposal allows foreign universities to establish local branches in Thailand’s special economic zones, a move expected to increase quality of available human resources.
Factor 6: Market and commercial incentives
Biopharmaceutical pricing and reimbursement policies
Traditionally for the biopharmaceutical sector the key challenge has been the favored status of local state supplier GPO. GPO is the dominant local pharmaceutical producer and supplier, and has long been given preferential treatment in the public procurement system, both on the basis of procurement rules which require public hospitals to make 60% of purchases from the GPO as well as the government’s “Median Price” scheme in which prices are arbitrarily determined in favor of the GPO price or lowest local generic price. Under the new Public Procurement Act enacted August 2017 the GPO gained additional responsibilities for the procurement of pharmaceutical product. Regarding reimbursement in order to obtain reimbursement within the public health system it is necessary to be listed on the NLED. However, the NLED is structured such that it is impossible to achieve listing if a generic or therapeutic equivalent is available. The list includes around 1,400 products, of which only 16 belong to the E2 subcategory for innovative (“high-cost”) drugs. Even for products included on the NLED price negotiation is the norm.
R&D tax incentives 200% deduction available on R&D expenses carried out by qualifying Thai R&D service providers. Accelerated depreciation for qualifying expenditure also available.
Factor 7: Rule of law Ranked 71 out of 113 countries

103
BUILDING THE BIOECONOMY 5TH EDITION
OUTPUTS
Scientific publications per million population, 2003-2016 88.7
Quality of academic publications, 2015 NA
Clinical trials per million population to date 33.59
Clinical trials for biologics per million population to date 2.88
Early phase (Phase I and II) clinical trials for biologics, per million population to date 0.86
Biotechnology triadic patenting, share of global total average 1999-2013 0.02%
Biopharmaceutical product launches, % available in country within 5 years of global product launch, 1983-2000
30.40%
National % share total number of patents from top 50 PCT applicants: universities, 2016 None
Biotechnology crops, hectares under cultivation, % of total 2016 None
BCI Survey Ranking 2017 Challenging
Venture Capital & Private Equity Country Attractiveness Index, Economy Ranking, 2018 72.2
Biofuels production, % of global total, 2017 2%

104
TURKEY
ANNEX – INDIVIDUAL COUNTRY OVERVIEWS AND STATISTICS
INPUTS
Factor 1: Human capital
Number of researchers per million population 1,157 (World Bank 2014)
Life sciences graduates (PhD & Masters), per million population
20.52 (OECD 2015)
Factor 2: Infrastructure for R&D
R&D spending % of GDP 0.88% (OECD 2015)
BERD spending as a % of total 50.1% (OECD 2015)
Total biotechnology R&D expenditure, Millions USD PPP, per million population
NA
Biotech R&D as a percentage of BERD NA
Factor 3: Intellectual property protection 6-yr RDP term of protection in place but based on EU product entry not domestic market entry. No PTE term in place. Achieved a score of 47.24% on the IP Index life sciences indicators.
Factor 4: The regulatory environment Localization drive continues and was strengthened over the last few years. The Turkish Medicines and Medical Devices Agency has drawn up plans to require drugs that face at least one local generic or therapeutic equivalent to localize production by 2018 or be excluded from reimbursement list. As a result, 45 drugs with at least a 50% market share and three local equivalents have been identified and delisted from reimbursement in February 2018. Similarly the Turkish Government’s 2016 Action Plan promised to introduce purchase guarantees for local “upper middle and high tech products” (as done in the IT sector). The model was tested for pharmaceuticals in January 2016 with the announcement of a 7-year purchase commitment for a firm that launches a Hepatitis A vaccine manufacturing facility in Turkey. Since 2009 not only domestic companies but also foreign ones must include a GMP certificate from the MoH and produced by its inspectors with the registration dossier for all pharmaceutical products including those manufactured abroad. However, the MoH does not possess sufficient technical expertise and capacity (including adequate number of staff) and resources to carry out on-site checks in a timely manner, particularly for foreign manufacturing sites. The result is significant delays in market approval.
Factor 5: Technology transfer and commercialization frameworks
Turkey has been working to improve technology transfer with local and regional partners. In conjunction with the European Union, the Turkish Government created the “Technology Transfer Accelerator Turkey”. The primary objectives of the program are to set up a fund to assist in the commercialization of technologies developed at Turkish universities and research centers, and to promote local transfers especially in less developed regions. Impact so far in terms of outputs has been limited but Government action through TUBITAK and others is nevertheless positive.

105
BUILDING THE BIOECONOMY 5TH EDITION
OUTPUTS
Scientific publications per million population, 2003-2016 309.9
Quality of academic publications, 2015 4.4%
Clinical trials per million population to date 37.44
Clinical trials for biologics per million population to date 1.91
Early phase (Phase I and II) clinical trials for biologics, per million population to date 0.30
Biotechnology triadic patenting, share of global total average 1999-2013 0.02%
Biopharmaceutical product launches, % available in country within 5 years of global product launch, 1983-2000
25.10%
National % share total number of patents from top 50 PCT applicants: universities, 2016 None
Biotechnology crops, hectares under cultivation, % of total 2016 None
BCI Survey Ranking 2017 Mixed
Venture Capital & Private Equity Country Attractiveness Index, Economy Ranking, 2018 65.2
Biofuels production, % of global total, 2017 Negligible
INPUTS
Factor 6: Market and commercial incentives
Biopharmaceutical pricing and reimbursement policies
In recent years drug pricing has been one of the most problematic issues for innovators and generics alike. Within the public reference price system in place, prices are set for both innovative drugs and generics at 60% of the lowest price for the same product in a basket of five European countries. Moreover, until recently the reference price was calculated on the basis of a fixed and outdated euro-lira exchange rate (in terms of 2009 levels), despite the fact that the Turkish lira has devalued by more than 50% as compared to the Euro since 2009. A new system in place since July 2015, which mandates a conversation rate of 70% of the previous year’s average exchange, is expected to raise products slightly (by around 4%), though overall limits on spending on pharmaceuticals continue to be quite blunt. Turkey has further tightened its pricing policy by changing the way reference prices are calculated through the Communiqué on the Pricing of Medicinal Products for Human Use enacted September 2017. Also, in December 2017 the Turkish Social Security Institution has decided to limit adjustments to drug price increases in reference countries.
R&D tax incentives A number of generous R&D incentive programs and tax benefits are in place for both biotech and generally. There is a general 100-150% deduction for qualifying expenditure depending on the size of the company; smaller companies qualify for the larger deduction. There is also an 80-90% reduced rate of tax withholding for personnel involved in R&D activity. Special incentives are in place for domestic manufacturing of biopharmaceuticals.
Factor 7: Rule of law Ranked 101 out of 113 countries

106
UAE
ANNEX – INDIVIDUAL COUNTRY OVERVIEWS AND STATISTICS
INPUTS
Factor 1: Human capital
Number of researchers per million population 2,003 (World Bank 2015)
Life sciences graduates (PhD & Masters), per million population
NA
Factor 2: Infrastructure for R&D
R&D spending % of GDP 0.87% (World Bank 2015)
BERD spending as a % of total NA
Total biotechnology R&D expenditure, Millions USD PPP, per million population
NA
Biotech R&D as a percentage of BERD NA
Factor 3: Intellectual property protection No RDP term of protection or PTE term in place. Achieved a score of 37.35% on the IP Index life sciences indicators.
Factor 4: The regulatory environment DRA generally viewed as highly capable with new fast-track approval initiative introduced in 2015, further improved in 2018 (reliance pathways with 30 day approval timeline). No biotechnology regulatory framework in place (limited agricultural production/cultivation in general). Some unenforced regulations requiring labeling in place.
Factor 5: Technology transfer and commercialization frameworks
Growing emphasis on technology transfer and public-private partnerships in R&D. Key part of both Vision 2021 and National Innovation Strategy. Main universities (including Abu Dhabi University and UAE University) have in place tech transfer frameworks. The first biotechnology innovation incubator in the region was launched in Abu Dhabi University in 2012. Dubai Science Park is a free zone that provides a platform to Life Sciences, New Energy and Environment communities. Over 230 business partners out of 280 operate in the life sciences, including global industry players Pfizer, Amgen, Bristol-Myers Squibb, Maquet, Firmenich and IFF. Other examples include the Khalifa Center for Genetic Engineering & Biotechnology (created in 2014 from the United Arab Emirates University and the Ministry of Presidential Affairs) where scientists apply biotechnology and genetics to desert plants to make them better able to endure and prosper in dry, hot and salty conditions. And the Reproductive Biotechnology Centre in Dubai, an R&D center focusing on animal biotechnology. There is also the Masdar company, a strategic government initiative tasked with investing, incubating and advancing the establishment of a clean energy industry that includes the Masdar Institute of Science and Technology.
Factor 6: Market and commercial incentives
Biopharmaceutical pricing and reimbursement policies
Price and profit controls in place. System of reference based pricing in place. References include other GCC countries, wholesale and retail prices in country of origin etc. Tendency for UAE price to be determined based solely on cost.
R&D tax incentives Not applicable. Corporation tax applied at the emirate level but only to oil and gas companies, tough a corporate tax scheme is being studied.
Factor 7: Rule of law Ranked 32 out of 113 countries

107
BUILDING THE BIOECONOMY 5TH EDITION
OUTPUTS
Scientific publications per million population, 2003-2016 135.7
Quality of academic publications, 2015 NA
Clinical trials per million population to date 17.91
Clinical trials for biologics per million population to date 0.86
Early phase (Phase I and II) clinical trials for biologics, per million population to date 0.22
Biotechnology triadic patenting, share of global total average 1999-2013 0.01%
Biopharmaceutical product launches, % available in country within 5 years of global product launch, 1983-2000
21.10%
National % share total number of patents from top 50 PCT applicants: universities, 2016 None
Biotechnology crops, hectares under cultivation, % of total 2016 None
BCI Survey Ranking 2017 Attractive
Venture Capital & Private Equity Country Attractiveness Index, Economy Ranking, 2018 69.1
Biofuels production, % of global total, 2017 Negligible

108
UK
ANNEX – INDIVIDUAL COUNTRY OVERVIEWS AND STATISTICS
INPUTS
Factor 1: Human capital
Number of researchers per million population 4,471 (World Bank 2015)
Life sciences graduates (PhD & Masters), per million population
234.2 (OECD 2015)
Factor 2: Infrastructure for R&D
R&D spending % of GDP 1.69% (OECD 2016)
BERD spending as a % of total 49% (OECD 2015)
Total biotechnology R&D expenditure, Millions USD PPP, per million population
NA
Biotech R&D as a percentage of BERD NA
Factor 3: Intellectual property protection 10-yr RDP term of protection and 5-yr SPC term in place. Achieved a score of 95.9% on the IP Index life sciences indicators.
Factor 4: The regulatory environment The UK has a strong clinical and regulatory environment. For biopharmaceuticals the MHRA is responsible for the authorization and safety supervision of pharmaceuticals. The Agency works hand-in-hand with the EMA to ensure the proper dissemination of drugs approved at the EU-wide level. With regards to the UK leaving the EU and the EMA, there is a clear risk that this could lead to delays in approval and product launches with products needing to be re-registered. While the UK embraces GM food products the current list of genetically modified seeds approved for planting by the EU are not suitable to the UK’s growing environment, so there is limited commercial biotech crop cultivation. This is likely to change after Brexit. Growing Government policy emphasis on ag-bio through 2013 Agri-tech initiative.
Factor 5: Technology transfer and commercialization frameworks
The UK maintains a sophisticated and active technology transfer environment. Universities such as Oxford, Cambridge and Imperial College are active participants in transferring and commercializing research and technology. In terms of direct central government support for technology transfer Innovate UK maintains a web portal that allows members of industry, academia, potential funders and entrepreneurs to collaborate on ideas. In 2016 the Government issued a new Industrial Strategy. The strategy is aimed at better leveraging key assets of the UK and addressing remaining structural barriers to the UK’s global competitiveness through promoting supportive conditions, including an additional GBP 2 billion invested per year. One challenge identified is to not only develop but also commercialize new technologies in UK (rather than selling them off to non-British firms). As part of this the government established a new Industrial Strategy Challenge Fund (ISCF) specifically targeting priority technologies – with biotech one of the top priorities. In the first announcement of funds, over GBP 1 billion is committed over 4 years focusing on 6 areas, which include healthcare and medicines. Tax relief aimed at encouraging pension and investment funds to make long term capital investments in university spin-offs and biotech firms are also under consideration.

109
BUILDING THE BIOECONOMY 5TH EDITION
OUTPUTS
Scientific publications per million population, 2003-2016 1,420.4
Quality of academic publications, 2015 13.6%
Clinical trials per million population to date 227.87
Clinical trials for biologics per million population to date 19.12
Early phase (Phase I and II) clinical trials for biologics, per million population to date 9.26
Biotechnology triadic patenting, share of global total average 1999-2013 5.24%
Biopharmaceutical product launches, % available in country within 5 years of global product launch, 1983-2000
50.60%
National % share total number of patents from top 50 PCT applicants: universities, 2016 2.16%
Biotechnology crops, hectares under cultivation, % of total 2016 None
BCI Survey Ranking 2017 Mixed
Venture Capital & Private Equity Country Attractiveness Index, Economy Ranking, 2018 94.4
Biofuels production, % of global total, 2017 0.4%
INPUTS
Factor 6: Market and commercial incentives
Biopharmaceutical pricing and reimbursement policies
The UK has a highly regulated pricing environment with the NHS negotiating prices with the pharmaceutical industry through the PPRS. Companies that do not participate in the voluntary PPRS are subject to the statutory scheme that imposes a list price cut of 15% on products. Discussions on reforming the PPRS have been ongoing with the Government tabling a Bill in Parliament in late 2016 increasing price regulations to also cover generic medicines. This was followed by the Competition and Markets Authority leveling a fine of a major manufacturer of over USD100million for alleged excessive pricing. New Cancer Drugs Fund (launched in July 2016) has been fundamentally revamped with a fixed budget introduced and all decisions for reimbursement to be made by NICE.
R&D tax incentives The UK offers R&D tax incentives to both small and large companies. SMEs can qualify for a super-deduction on qualifying R&D activities of 230% and SMEs that post a yearly loss can additionally qualify for up to 33.3% cash back on R&D related spending. A patent box regime offering a 10% rate of corporation tax to profits generated from patents is in place.
Factor 7: Rule of law Ranked 11 out of 113 countries

110
US
ANNEX – INDIVIDUAL COUNTRY OVERVIEWS AND STATISTICS
INPUTS
Factor 1: Human capital
Number of researchers per million population 4,232 (World Bank 2014)
Life sciences graduates (PhD & Masters), per million population
71.34 (OECD 2015)
Factor 2: Infrastructure for R&D
R&D spending % of GDP 2.74% (OECD 2016)
BERD spending as a % of total 62.3% (OECD 2015)
Total biotechnology R&D expenditure, Millions USD PPP, per million population
119.4 (OECD 2014)
Biotech R&D as a percentage of BERD 11.3% (OECD 2014)
Factor 3: Intellectual property protection 12-yr RDP term of protection for biologics in place, 5-yr term for NCEs and 5-yr PTE term in place. Achieved a score of 94.48% on the IP Index life sciences indicators. Remaining uncertainty as to USPTO and courts’ standard for patenting of biotech inventions. Continued uncertainty over patent opposition proceedings with Supreme Court ruling in 2018 upholding the constitutionality of the country’s most commonly used post-grant opposition mechanism, the IPR, which occurs before the specialized PTAB within the USPTO.
Factor 4: The regulatory environment With regards to the regulation of products and technologies developed using modern biotechnology, the Coordinated Framework for Regulation of Biotechnology is generally viewed as being one of the key building blocks and drivers of American biotech innovation. Since its announcement in 1986 the policy and subsequent sector-specific regulations are seen as having been instrumental in promoting the development of the American biotechnology industry and bringing a wide array of biotechnology products and technologies to consumers. With regards to biopharmaceuticals the FDA sets and enforces rigorous standards. The FDA plays a leading role in efforts to harmonize regulatory standards through the International Conference on Harmonization. Moreover, the regulatory standards of the FDA are frequently emulated and recognized as a gold standard amongst clinicians, health economists and the academic community. In response to criticism of long approval times new expedited pathways have been introduced. Major new legislation in 2016 21st Century Cures Act which allows for:
• Draft guidance on interchangeability of biosimilars released in Jan 2017 (final guidance yet to be released)
• FDA final guidance on naming biologics and biosimilars issued in Jan 2017 allows for all biologic products to be distinguished from one another instead of generic naming: in addition to the INN it requires an FDA-designated suffix to distinguish product by product.
• As a result of the (re)authorization of user fees for biosimilars (specifically under the Biosimilars User Fee Act) FDA also commits to faster timelines for originator biologics review (within 10 months); communication and guidance for biologics sponsors in advance of the review as well as during the review in order to anticipate needed changes and avoid delays in approval; and devoting greater resources for biologics review.
• The Act also widens scope of permissible clinical trial data for approval of new biopharma products including observational studies, anecdotal data, and other informal types of data in additional to formal clinical trial results.

111
BUILDING THE BIOECONOMY 5TH EDITION
OUTPUTS
Scientific publications per million population, 2003-2016 1,236.4
Quality of academic publications, 2015 13.9%
Clinical trials per million population to date 343.94
Clinical trials for biologics per million population to date 27.87
Early phase (Phase I and II) clinical trials for biologics, per million population to date 20.36
Biotechnology triadic patenting, share of global total average 1999-2013 41.92%
Biopharmaceutical product launches, % available in country within 5 years of global product launch, 1983-2000
53.10%
National % share total number of patents from top 50 PCT applicants: universities, 2016 57.42%
Biotechnology crops, hectares under cultivation, % of total 2016 39.38%
BCI Survey Ranking 2017 Attractive
Venture Capital & Private Equity Country Attractiveness Index, Economy Ranking, 2018 100
Biofuels production, % of global total, 2017 43.5%
INPUTS
Factor 5: Technology transfer and commercialization frameworks
One of the key drivers of American biotech innovation and commercialization has been the success of technology transfer in the US. The Patent and Trademark Law Amendments Act of 1984 and 1986 (commonly referred to as the Bayh-Dole Act) and the Stevenson-Wydler Technology Innovation Act, which was later amended by the Federal Technology Transfer Act of 1986 and the Technology Transfer Commercialization Act in 2003 have all been instrumental in incentivizing technology transfer. These laws gave institutions that received federal support (such as American universities, small businesses and non-profits) control and the rights to any resulting intellectual property of their inventions or research.
Factor 6: Market and commercial incentives
Biopharmaceutical pricing and reimbursement policies
The US has a relatively free market in the purchase and sale of biopharmaceutical products. There are no national price regulations or national reimbursement agencies. Instead, private health insurers and public payers (such as Medicare, the VHA and Medicaid) negotiate prices with manufacturers and only indirectly set reimbursement limits and influence prescribing and patient usage through the use of formularies. Drug formularies (which often include therapeutic interchange or so-called switching mechanisms) and differential cost sharing (such as tiered co-payments) are two of the more commonly used techniques to influence prescribing practices.
The Trump administration has introduced a number of reform initiatives aimed at lowering the cost of prescription medicines. In February 2018 the Council of Economic Advisers (CEA) released Reforming Biopharmaceutical Pricing at Home and Abroad an analysis of the global biopharmaceutical market. A few months later President Trump and the Department of Health and Human Services also announced a set of reforms to tackle the high cost of prescription medicines in the blueprint document American Patients First. And most recently in October 2018 the administration announced a plan to build an “International Pricing Index”. This Index would seek to align Medicare payments for physician administered drugs under the program with the prevailing prices in other countries. The proposed policy is currently under discussion and public consultation. It is worth noting that one of the strongest drivers of biopharmaceutical innovation in the US has been the existence of a relatively free market in the pricing of pharmaceuticals. Other countries, particularly in Europe, that have embraced strict biopharmaceutical cost containment policies have historically seen fewer product launches and fewer innovative medicines introduced.
R&D tax incentives The US provides only limited R&D tax credits, both at the federal and state level. The federal Research and Experimentation Tax Credit allows companies to claim a tax credit of between 14-20% of qualifying amounts. In addition, 39 US states offer R&D tax credits at varying rates. Tax legislation passed December 2017 scaled back incentives to promote rare disease research (reducing the tax credit companies can claim on R&D costs from 50% to 25%).
Factor 7: Rule of law Ranked 19 out of 113 countries

SECTION
112 112
VIETNAM
ANNEX – INDIVIDUAL COUNTRY OVERVIEWS AND STATISTICS
INPUTS
Factor 1: Human capital
Number of researchers per million population 675 (World Bank 2013)
Life sciences graduates (PhD & Masters), per million population
NA
Factor 2: Infrastructure for R&D
R&D spending % of GDP 0.4% (World Bank 2013)
BERD spending as a % of total NA
Total biotechnology R&D expenditure, Millions USD PPP, per million population
NA
Biotech R&D as a percentage of BERD NA
Factor 3: Intellectual property protection 5 year RDP term de facto unavailable: request for data protection must be submitted within 12 months from the date a MA was first granted in any country in the world. No PTE; yet, in the EU-Vietnam FTA, expected to be signed in 2018, Vietnam committed to a 2-year patent term restoration system Achieved a score of 37.72% on the IP Index life sciences indicators.
Factor 4: The regulatory environment Though improving, the regulatory environment remains weak (for instance, bioequivalence obligation applies to a limited part of generics, with a target to achieve 40% of them by 2020) and regulatory procedures are burdensome (e.g. long registration renewal procedure every 5 years; requirement for local clinical trials for product variations and phase III trials for vaccines); Positively, the new Pharma Law (Law 105/2016/QH13) introduces a new timeline for Marketing Authorization issuance, and removes some requirements for domestic clinical trials. However, language of the provision is vague and details are lacking. Furthermore, the current draft Circular on Clinical Trials still requires local clinical trials for product variations and phase III trials for vaccines. In 2017 the Prime Minister entrusted the MoH to work out a strategy on the development of a high-quality pharmaceutical industry with a vision toward 2030. Target to increase the share of locally procured pharmaceuticals to 80% of market volume and value by 2030. As concerns ag-biotech, Vietnam has approved 18 biotech corn varieties and 3 GE soybean events; pending applications cover additional crops such as cotton, canola and sugar beet. According to the latest data available, about 3% of the total cultivated corn area comes from biotech crop.
Factor 5: Technology transfer and commercialization frameworks
A new Law on Technology Transfer from June 2017 aims to boost science and technology efforts, encourage the adoption of the latest advances from abroad, and prevent the import of outdated technologies. The law seeks to address barriers faced in the commercialisation of scientific research and technological development. It encourages research institutions and organisations to collect market information, understand societal needs and engage in joint research activities with enterprises. It also promises to define ownership rights and the rights to use assets developed through scientific research. Finally, it makes registration of technology transfer contracts compulsory and restricts transfer of technology for treating products using biotechnologies, and technology for propagation and/or cultivation of new plants/animals which has not been tested; Under the law, policies covering the definition of ownership rights and the rights to use assets developed through scientific research, will be issued to support start-ups. The law also prospects adding (through secondary regulations) restrictions on the transfer into Vietnam of technologies which Vietnam has studied and used with the same level and efficiency as world technologies. Registration of a TT contract is mandatory for technology coming into Vietnam from a foreign country, or domestic tech transfer with the use of state funds. Since the beginning of the 2000s, the government has also begun building National Key Laboratories within Vietnam Academy of Science and Technology (the country’s main research institute with 2500 researchers employed) and other institutes, which seek to promote international research and bridge the gap from applied research to the commercialization of innovative products. They include the NKL on gene technology, NKL on plant cell technology and NKL on protein technology. A partnership between RMIT University and the Biotechnology Center of Ho Chi Minh City was concluded to contribute to the development of the ag-biotech industry in Vietnam.

BUILDING THE BIOECONOMY 5TH EDITION
113 113
BUILDING THE BIOECONOMY 5TH EDITION
OUTPUTS
Scientific publications per million population, 2003-2016 12.6
Quality of academic publications, 2015 NA
Clinical trials per million population to date 4.01
Clinical trials for biologics per million population to date 0.60
Early phase (Phase I and II) clinical trials for biologics, per million population to date 0.28
Biotechnology triadic patenting, share of global total average 1999-2013 NA
Biopharmaceutical product launches, % available in country within 5 years of global product launch, 1983-2000
NA
National % share total number of patents from top 50 PCT applicants: universities, 2016 None
Biotechnology crops, hectares under cultivation, % of total 2016 0.01%
BCI Survey Ranking 2017 Challenging
Venture Capital & Private Equity Country Attractiveness Index, Economy Ranking, 2018 60.7
Biofuels production, % of global total, 2017 Negligible
INPUTS
Factor 6: Market and commercial incentives
Biopharmaceutical pricing and reimbursement policies
Costly import regime inflates cost, insurance and freight prices, used for comparison with neighboring countries when fixing prices of imported products. Furthermore, final prices are calculated on the basis of prices declared by local distributors. Long reimbursement delays, around 5-6 years for newly approved drugs. The National Reimbursement List is only reviewed every 2 years. Government plans to establish by 2020 a central drug procurement unit for national procurement and price negotiation; and promote centralized procurement of drugs.
R&D tax incentives Biotech and R&D investment as well as other high-tech activities benefit from Corporate Income Tax (CIT) reduction, including a 4-year CIT exemption. The new Law on Technological Transfer grants special tax incentives for the import of R&D machinery, equipment, which have yet to be produced in the country.
Factor 7: Rule of law Ranked 74 out of 113 countries

114
NOTES1 Al Gore (1991), “Planning a New Biotechnology Policy”, Harvard
Journal of Law and Technology, https://jolt.law.harvard.edu/assets/articlePDFs/v05/05HarvJLTech019.pdf
2 Pugatch Consilium (2014-17), Building the Economy – Examining National Biotechnology Industry Development Strategies report. Commissioned by the Biotechnology Industry Organization and authored by Pugatch Consilium, this series of reports provides an overview of those national innovation strategies, policies and best practices that have been successful in creating an environment in which biotechnologies and biotechnological innovation can flourish.
3 Egypt 2030 strategy, “Third Pillar”, http://sdsegypt2030.com/wp-content/uploads/2016/10/4.-Knowledge-Innovation-Scientific-Research-Pillar2.pdf
4 Iman AlAyouti (2017), “R&D Performance in the Pharmaceutical Industry: A Case Study of Egypt”, European Journal of Sustainable Development, 10.14207/ejsd.2017.v6n2p121
5 EFPIA, https://www.efpia.eu/media/288592/white-paper-on-reliance-and-expedited-registration-pathways-in-emerging-markets.docx
6 Egyptian EDA (2016), “Guidelines For Registration of Biosimilar Products In Egypt. http://www.eda.mohp.gov.eg/Files/656_Guidelines%20For%20Registration%20of%20Biosimilar%20Products%20in%20Egypt.pdf
7 Text available at https://drive.google.com/file/d/0B-5Xd010CH_kUllrU2toYk9xRzg/view
8 World Bank/OECD, “Vietnam STI Review – Executive Summary”, http://www.banquemondiale.org/content/dam/Worldbank/document/EAP/Vietnam/Vietnam-STI-review-executive-summary.pdf
9 Instruction No.16/CT-TTG of May 2017, http://m.english.vietnamnet.vn/fms/government/177926/vn-prime-minister-directs-4th-industrial-revolution-preparations.html
10 Banji Oyelaran-OyeyinkaPadmashree Gehl (2009), “Vietnam Biotechnology: Building Local Capacity”, The Gene Revolution and Global Food Security, 99 88-116, https://link.springer.com/chapter/10.1057/9780230277991_4; Bioekonomie.de website, “Vietnam” (accessed April 2018), https://biooekonomie.de/en/node/5957
11 Prime Minister Directive 26/CT-TTg, 6/6/2017, http://vietnamlawmagazine.vn/directive-no-26-ct-ttg-of-june-6-2017-6007.html
12 Prime Minister Decision No. 68/QD-TTg, 1/10/2014, https://vanbanphapluat.co/decision-no-68-qd-ttg-the-national-strategy-on-development-of-the-vietnam-pharmaceutical-industry-up-to-2020
13 Costa Rica is the first country from Latin and Central America in term of innovation outputs according to the GII 2017, and second after Chile in the overall ranking. The Global Competitiveness Index indicates Costa Rica as the top scorer in Central and Latin America for innovation, as well as health and primary education.
14 A 2015 World Economic Forum report gives Costa Rica the highest score in Latin America in terms of the quality of scientific research institutions. However, this falls below the average score of high-income OECD countries. The same report also shows that Costa Rican businesses and universities collaborate more on research and development (R&D) investment than any other Latin American country. See WEF (2015), “Bridging the Skills and Innovation Gap to Boost Productivity in Latin America The Competitiveness Lab: A World Economic Forum Initiative”, January 2015. See also https://www.caminotravel.com/costa-rica-leading-in-life-sciences-and-research/
15 Medical Devices was the first industrial export good of Costa Rica in 2015, accounting for 4% of the total GDP, and covered 68 out of 250 high-tech manufacturing companies; http://www.keepeek.com/Digital-Asset-Management/oecd/science-and-technology/oecd-reviews-of-innovation-policy-costa-rica-2017_9789264271654-en#.Wn1y8pM-fsk#page23; https://www.cinde.org/en/sectors/life-sciences; https://www.prnewswire.com/news-releases/cinde-announces-costa-rica-positions-itself-as-a-leader-in-innovation-for-the-life-sciences-industry-in-latin-america-300343341.html: OECD (2017), “Review of Innovation Policy in Costa Rica”
16 OECD(2017), pp.106-108.
17 Such as an antivenom serum bank and a human tissue culture laboratory for the development of burn therapies and heal of wounds. See https://www.cinde.org/en/sectors/life-sciences/opportunities
18 World Bank (2014), “Costa Rica: Five years after CAFTA-DR assessing early results for the Costa Rican economy”, June 2014, http://documents.worldbank.org/curated/en/883631468239975825/pdf/84607-REVISED-WP-PUBLIC-Box391467B-Costa-Rica-CAFTA-english-final.pdf
19 Global Bioeconomy Summit (2018), “Latin America’s Developing Bio-Economies: Concept Note For A Regional Panel Discussion”, http://gbs2018.com/fileadmin/gbs2018/Downloads/GBS18_CN_LACpanel__v13Abr_.pdf
20 Costa Rican Government website, “21st Century Strategy website” (accessed June 2018), http://www.estrategia.cr/
21 CONCYTEC website, “Transversal Biotech Program”, http://portal.concytec.gob.pe/index.php/programas-nacionales-transversales-de-cti/programa-nacional-transversal-de-biotecnologia
22 For instance, according to the GII Index 2017, Peru spent 0.13% of its GDP on R&D in 2015, the last among South American countries except Paraguay; See also Pluvia Zuniga/UNU-MERIT (2016), “Innovation system in development: The case of Peru”, Working Paper Series UNU-MERIT, https://www.researchgate.net/publication/316045762_Innovation_system_in_development_The_case_of_Peru_Working_Paper_Series_UNU-MERIT_Working_Papers_Innovation_System_in_Development_The_Case_of_Peru
23 Invest in New Zealand website, “Biotechnology Investment Opportunities in New Zealand”, http://www.investinnz.co.nz/industry/biotechnology/biotechnology-investment-opportunities-new-zealand
24 ERA-NET, “Marine Biotechnology in New Zealand”, http://www.marinebiotech.eu/wiki/Marine_Biotechnology_in_New_Zealand#cite_note-biostep-7
25 Text available at http://www.conversations.canterbury.ac.nz/PHASEONE/resources/genetics/nz-govt-biotech-strategy.pdf
26 In 2016, the Government announced the largest-ever increase in New Zealand health research funding of $97 million over four years, bringing HRC funding to $123 million in 2019/20.
27 Text available at https://www.health.govt.nz/system/files/documents/publications/nz-health-research-strategy-jun17.pdf
28 Text available at https://www.health.govt.nz/publication/new-zealand-health-research-strategy-2017-2027
29 PHARMAC website, “Medicines and Medical Devices Contract Negotiations” (accessed May 2018), https://www.pharmac.govt.nz/about/your-guide-to-pharmac/factsheet-05-contract-negotiation/; PHARMAC website, “Setting and managing the combined pharmaceutical budget (CPB)” (accessed May 2018), https://www.pharmac.govt.nz/about/your-guide-to-pharmac/factsheet-08-managing-combined-pharmaceutical-budget/; PHARMAC website, “Introduction to PHARMAC” (Accessed May 2018), https://www.pharmac.govt.nz/about/your-guide-to-pharmac/factsheet-01-introduction-to-pharmac/; PHARMAC website, “International Medicines Prices” (accessed May 2018), https://www.pharmac.govt.nz/medicines/new-medicines/medicine-pricing/; S.G. Morgan et al/Canadian Medical Association Journal (2017), “Drivers of expenditure on primary care prescription drugs in 10 high-income countries with universal health coverage”, 6/12/2017, https://doi.org/10.1503/cmaj.161481; Medicines New Zealand (2016), “New Zealand’s Medicines Landscape”, http://www.medicinesnz.co.nz/assets/Documents/Medicines-New-Zealand-annual-review-2016.pdf
30 See for instance OECD Finland STI Review, p.83; In Sweden, SciLifeLab (Science for Life Laboratory), a national center for biomolecular sciences, and the Wallenberg Centers for Molecular Medicine (WCMM) in Gothenburg, Linköping, Lund and Umeå have formed a collaborative network to bring together the future leaders of life science and molecular medicine in Sweden; Science for Life Laboratory (2017), “National network for future leaders in life science launched by SciLifeLab and Wallenberg Centers for Molecular Medicine”, 6/28/2017, https://www.scilifelab.se/news/national-network-for-future-leaders-in-life-science-launched-by-scilifelab-and-wallenberg-centers-for-molecular-medicine/

BUILDING THE BIOECONOMY 5TH EDITION
115
31 Ministry of Social Affairs and Health (2015), “Finland can become a model country for utilizing genome information”, Press Release 110/2015, http://stm.fi/en/article/-/asset_publisher/suomesta-voi-tulla-genomitiedon-hyodyntamisen-mallimaa
32 Dan Naumov (2017), “Finland’s dreams of a biodiesel future are getting crushed”, 7/27/2017, http://nordic.businessinsider.com/finlands-biodiesel-dreams-are-getting-crushed-2017-7/
33 PhRMA (2013), “Special 301 Submission 2013”, p.139, http://phrma-docs.phrma.org/sites/default/files/pdf/PhRMA%20Special%20301%20Submission%202013.pdf; Thomson Reuters (2017), “Pharmaceutical IP and competition law in Finland: overview”, 5/1/2017, https://uk.practicallaw.thomsonreuters.com/7-563-6605?transitionType=Default&contextData=(sc.Default)&firstPage=true&bhcp=
34 PhRMA (2013), “Special 301 Submission 2013”, p.139, http://phrma-docs.phrma.org/sites/default/files/pdf/PhRMA%20Special%20301%20Submission%202013.pdf; Thomson Reuters (2017), “Pharmaceutical IP and competition law in Finland: overview”, 5/1/2017, https://uk.practicallaw.thomsonreuters.com/7-563-6605?transitionType=Default&contextData=(sc.Default)&firstPage=true&bhcp=
35 Pharma Industry Finland (2018), “Annual Report 2017”, http://www.pif.fi/sites/default/files/attachments/toimintakertomus_2017_0.pdf; Pharma Industry Finland (2016), “Favoring Parallel Imports Jeopardizes Availability Of Medicines”, 12/29/2016, http://www.pif.fi/en/announcements/pharma-industry-finland-favouring-parallel-imports-jeopardises-availability-medicines
36 See OECD “Regulatory Reform and Innovation”, https://www.oecd.org/sti/inno/2102514.pdf
37 TUBITAK, p.32, http://tubitak.gov.tr/sites/default/files/gelismelere_iliskin_degerlendirmeler_1.pdf
38 ASEANup, “Malaysia’s economic plan 2016-2020”, https://aseanup.com/malaysia-economic-plan-2016-2020/; Malaysian Government Vision 2020, http://www.isis.org.my/attachments/Vision%202020%20complete.pdf
39 Colombian Government, “Where we Want to Get: Vision 2032 and Main Strategies”, http://www.colombiacompetitiva.gov.co/prensa/informes/VISION-2032-CPC.pdf
40 Christiane Arndt/OECD (2016), “Building Regulatory Policy Systems in OECD Countries”, 12/15/2016, https://www.oecd-ilibrary.org/docserver/dbb1a18f-en.pdf?expires=1528233434&id=id&accname=guest&checksum=B8FF98D720B5B843B76E2BFED0A7A9FF
41 Phys.org (2016), “US science and technology leadership increasingly challenged by advances in Asia”, 1/19/2016, http://phys.org/news/2016-01-science-technology-leadership-increasingly-advances.html#jCp
42 National Science Foundation (2016), chapter 2, p. 85.43 Ibid. p.87.44 CNN (2016), “China Gets Into the Genetic Breakthrough Business”,
4/28/2016, http://edition.cnn.com/2016/04/28/health/china-genetic-breakthrough-business/
45 OECD (2015), “Science and Technology Indicators 2015”, p.21. 46 Ibid47 Nature (2018), “Biotech Booms in China”, 1/17/2018, https://www.
nature.com/articles/d41586-018-00542-348 Rebecca Keller/Stratford (2016), “How Technology Might Reshape
China’s Future”, 2/2/2016, https://worldview.stratfor.com/article/how-technology-might-reshape-chinas-future
49 Financial Times (2018), “Healthcare: Cancer breakthrough leads China’s biotech boom “, 4/11/2018, https://www.ft.com/content/30b5a944-3b57-11e8-b9f9-de94fa33a81e
50 Bloomberg (2018), “Chinese Money Floods US Biotech as Beijing Chases New Cures”, 4/18/2018, https://www.bloomberg.com/news/articles/2018-04-18/chinese-money-floods-u-s-biotech-as-beijing-chases-new-cures
51 Financial Times (2018).52 Stratford (2018), “Assessments Battlefield Biotech: The Rising
Competition Between China and the US”,3/26/2018, https://worldview.stratfor.com/article/biotechnology-biotech-china-united-states-crispr-genome-agriculture-trade-war
53 Ibid.54 CFDA (2018), “Drug Registration Regulations”, 10/23/2017, http://
www.sda.gov.cn/WS01/CL0050/178900.html
55 Ropes and Grey (2018), “The China Drug Administration Proposes a Working Procedure for Pharmaceutical Study Data Protection”, 5/8/2018, https://www.ropesgray.com/en/newsroom/alerts/2018/05/The-China-Drug-Administration-Proposes-a-Working-Procedure-for-Pharmaceutical-Study-Data-Protection#fn1
56 CFDA (20188), “Drug Catalogue Notice”, 12/28/2017, http://www.sda.gov.cn/WS01/CL0050/220786.html
57 Kluwer IP Law (2018), “China Establishes Patent Linkage”, 4/3/2018, http://patentblog.kluweriplaw.com/2018/04/03/china-establish-patent-linkage/
58 Ibid.59 Ropes & Grey (2018), “China Announces New Initiatives to Level
the Playing Field for Innovative and Generic Drugs”, 4/17/2018, https://www.ropesgray.com/en/newsroom/alerts/2018/04/China-Announces-New-Initiatives-to-Level-the-Playing-Field-for-Innovative-and-Generic-Drugs; T. Jackson/Rouse (2018), “China to Allow Patent Term Extension?”, 5/16/2018, https://www.rouse.com/magazine/news/china-to-allow-patent-extension-of-term/; CCPIT Patent and Trademark Law Office, “Breaking News on New Policies of Innovative Drugs in China”, 4/16/2018, http://www.ccpit-patent.com.cn/node/4963
60 Covington (2017), “Chinese Government Initiates Significant Drug and Device Regulatory Reforms”, 11/6/2017, https://www.cov.com/-/media/files/corporate/publications/2017/11/chinese_government_initiates_significant_drug_and_device_regulatory_reforms.pdf; Ropes & Grey (2017), “China FDA Solicits Comments on Conditional Approvals for New Drugs and Compassionate Use of Investigational Drugs”, 12/27/2017, https://www.ropesgray.com/en/newsroom/alerts/2017/12/China-FDA-Solicits-Comments-on-Conditional-Approvals-for-New-Drugs
61 Nature (2017), “China Announces Plans To Fast-Track Drug Approval”, 10/20/2017, https://www.nature.com/news/china-announces-plans-to-fast-track-drug-approval-1.22888
62 Ropes & Grey (2018), “China Announces New Initiatives to Level the Playing Field for Innovative and Generic Drugs”, 4/17/2018, https://www.ropesgray.com/en/newsroom/alerts/2018/04/China-Announces-New-Initiatives-to-Level-the-Playing-Field-for-Innovative-and-Generic-Drugs
63 State Council of the People’s Republic of China, “Drugs Made Oversea to Be Tax-Gree”, 4/16/2018, http://english.gov.cn/state_council/ministries/2018/04/16/content_281476113928337.htm
64 Such as the revision of the National Reimbursed Drug List (NRDL), the decision to grant some flexibility to provincial authorities in deciding listed products, and reimbursement of 36 high-cost, innovative drugs within the framework of the National Health and Family Planning Commission’s price negotiation pilot program for patented drugs. China Business Review (2018), “Healthcare Series Part 1: Reimbursement Drug Lists”, 11/1/2017, https://www.chinabusinessreview.com/healthcare-series-part-1-reimbursement-drug-lists/; Ma XiaoHua (2017), “China Adds 36 Medicines to National Health Insurance Scheme, Cuts Drug Prices by Over 40%”, 7/20/2017, https://www.yicaiglobal.com/news/china-adds-36-medicines-national-health-insurance-scheme-cuts-drug-prices-over-40
65 M. Pugatch et al. (2012), Taking Stock: How Global Biotechnology Benefits from Intellectual Property Rights, The contribution of IPRs to the biotechnology ecosystem and economic growth in developed and emerging economies: examining the literature and evidence, BIO 2012.
66 US Chamber GIPC (2018), “Create – US Chamber Global IP Index, Sixth Edition”, February 2018, http://www.theglobalipcenter.com/wp-content/uploads/2018/02/GIPC_IP_Index_2018.pdf
67 Ars Technica (2018), “Supreme Court upholds patent review process, dealing trolls a blow”, 4/24/2018, https://arstechnica.com/tech-policy/2018/04/supreme-court-upholds-important-weapon-in-the-fight-against-bad-patents/
68 European Commission, “Supplementary protection certificate for medicinal products: Frequently Asked Questions (FAQs)”, 5/31/2018, http://europa.eu/rapid/press-release_MEMO-18-3908_en.htm
69 Kasan IP and Law Firm/Korean IP Law Blog (2017), “Patent Term Extension (PTE) Disputes on Period and the Scope of Protection in Korea”, 9/17/2017, Kim and Chang (2018), “ILO Intellectual Property Newsletter – Legal Developments Regarding Patent Term Extensions”, 5/31/2018, http://koreaniplaw.blogspot.com/2017/09/patent-term-extension-pte-disputes-on.html; http://www.kimchang.com/ip/frame2.jsp?lang=2&b_id=113&m_id=161&mode=view&idx=18188

116
NOTES
70 Department Trade and Industry (2018), Intellectual Property Policy of South Africa: Phase I, p. 21.
71 Ibid. p. 29.72 The first is the case in countries such as Korea, Australia and
Thailand; the second in countries such as Japan and Korea. See PhRMA (2018), “2018 Special 301 Submission”, pp. 53, 113, 164
73 Syneos Health Communications (2018), “New Outcomes-Based Payment Models Pave Way for Expensive Therapies”, 1/22/2018, http://syneoshealthcommunications.com/blog/new-outcomes-based-payment-models-pave-way-for-expensive-therapies
74 First World Pharma (2018), “Key Pharma And Biotech Trends For 2018”, 1/4/2018, https://www.firstwordpharma.com/node/1534587
75 NHS Confederation (2014), “Beginning with the End in Mind”, September 2014, Briefing Issue 274, https://www.pwc.co.uk/assets/pdf/beginning-with-the-end-in-mind.pdf
76 CAQH (2016), “Defining the Provider Data Dilemma”, 9/29/2016, https://www.caqh.org/sites/default/files/explorations/defining-provider-data-white-paper.pdf
77 WhiteHouse.gov (2018), “President Donald J. Trump’s Blueprint To Lower Drug Prices”, 5/11/2018, https://www.whitehouse.gov/briefings-statements/president-donald-j-trumps-blueprint-lower-drug-prices/
78 Health Malaysia (2017), “Press Statement Minister of Health 20th September 2017 – Implementation of the Rights of Government for Sofosbuvir Tablet to Increase Access for Hepatitis C Treatment in Malaysia”, 9/20/2017, https://kpkesihatan.com/2017/09/20/press-statement-minister-of-health-20th-september-2017-implementation-of-the-rights-of-government-for-sofosbuvir-tablet-to-increase-access-for-hepatitis-c-treatment-in-malaysia/
79 The Star (2017), “US Firm Expands Hepatitis C Generic Licensing Agreement To Malaysia”, 9/5/2017, https://www.thestar.com.my/news/nation/2017/09/05/affordable-cure-in-the-works-us-firm-expands-hepatitis-c-generic-licensing-agreement-to-malaysia/
80 Alessandri Legal (2018), “Chile Discusses The Use Of Compulsory Licenses For The Exploitation Of A Patent”, 3/15/2018, http://www.alessandri.legal/en/attorneys-at-law/chile-discusses-the-use-of-non-voluntary-licenses-for-the-exploitation-of-a-patent/
81 Text available at https://www.keionline.org/wp-content/uploads/2018/03/9March2018-MoH-Chile_10032018_164316.pdf
82 E. Silverman/StatNews (2017), “Peruvian lawmakers seek a compulsory license for a Bristol HIV drug”, 5/26/2017, https://www.statnews.com/pharmalot/2017/05/26/peru-compulsory-license-bristol-drug/; AIS Peru (2017), “Peru’s Congressional Health Commission Declares Atazanavir Of Public Interest “, 5/25/2017, http://aisperu.org.pe/documentos/17-nota-de-prensa-declaran-atazanavir-de-interes-publico-ingles/file
83 Smith, Gambrell ad Russell LLP (2018), “Russian Roadmap for Competition in Healthcare Targets Innovative Drug Developers”, January 2018, http://www.sgrlaw.com/russian-roadmap-for-competition-in-healthcare-targets-innovative-drug-developers/
84 Vegas Lex (2018), “Update On The Russian Pharmaceutical Market Developments– Legal Overview”, 3/29/2018, https://www.vegaslex.ru/en/analytics/analytical_reviews/update_on_the_russian_pharmaceutical_market_developments_legal_overview/
85 M Sobolev (2018) “Analysis: First compulsory licence ordered in Russia”, Rouse, July 19 2018
86 White House (2018), “CEA Report: Reforming Biopharmaceutical Pricing at Home and Abroad”, 2/9/2018, https://www.whitehouse.gov/briefings-statements/cea-report-reforming-biopharmaceutical-pricing-home-abroad/
87 A Rizvi (2015) “UAE fasttracking new drugs in bid to tackle growing health issues”, The National, October 14 2015.
88 Albawaba Business (2018), “UAE Minister of Health Issues Ministerial Decree for the Registration of Innovative Medicines”, 1/24/2018, https://www.albawaba.com/business/pr/minister-health-issues-ministerial-decree-registration-innovative-medicines-orphan-drugs
89 S.Alsager et al. (2015), “The Saudi Food and Drug Authority: Shaping the Regulatory Environment in the Gulf Region”, April 2015, https://www.researchgate.net/publication/277582366_The_Saudi_Food_and_Drug_Authority_Shaping_the_Regulatory_Environment_in_the_Gulf_Region
90 PhRMA (2017), “301 Submission Report”, p.167.91 Australian Department of Health (2018), “Provisional Approval
Pathway: Prescription Medicines”, 3/20/2018, https://www.tga.gov.au/provisional-approval-pathway-prescription-medicines
92 PharmaExec (2018), “NICE Takes Key Role in Accelerated Access Collaborative”, 2/3/2018, http://www.pharmexec.com/nice-takes-key-role-accelerated-access-collaborative
93 Adrian Tombling/PharmaPhorum (2018), “A New Fast Track For NHS Access – Good News For Niche Innovators”, 2/21/2018, https://pharmaphorum.com/views-and-analysis/accelerated-access-collaborativea-fast-track-for-nhs-access-good-news-for-niche-innovators/
94 Euractiv (2018), “EU Parliament Ends Palm Oil And Caps Crop-Based Biofuels At 2017 Levels”, 1/17/2018, https://www.euractiv.com/section/agriculture-food/news/eu-parliament-ends-palm-oil-and-caps-crop-based-biofuels-at-2017-levels/; Biomass Magazine (2018), “MEPs Approve Renewable Energy, Biofuel Targets Under RED II”, 1/17/2018, http://biomassmagazine.com/articles/14984/meps-approve-renewable-energy-biofuel-targets-under-red-ii
95 The Economic Times (2018), “India’s Plan To Reduce Medicine Prices Faces Industry Pushback”1/12/2018, //economictimes.indiatimes.com/articleshow/62472881.cms?utm_source=contentofinterest&utm_medium=text&utm_campaign=cppst
96 Energy World (2017), “India Proposes New Bio-Ethanol Policy To Spur Rs 5,000 Crore Investments”, 11/23/2017, https://energy.economictimes.indiatimes.com/news/oil-and-gas/india-proposes-new-bio-ethanol-policy-to-spur-rs-5000-crore-investments/61755856
97 Reuters (2018), “Trump To Mull US Biofuels Policy Options In Cabinet Meeting Monday”, 4/6/2018, https://www.reuters.com/article/us-usa-biofuels-trump/trump-to-mull-u-s-biofuels-policy-options-in-cabinet-meeting-monday-idUSKCN1HD2QV
98 Biofuels Digest (2018), “President Trump to Take Three Months Hiatus from RFS Negotiation”, 4/11/2018, http://www.biofuelsdigest.com/bdigest/2018/04/11/president-trump-to-take-three-month-hiatus-from-rfs-negotiations/
99 ABBI (2017), “Temer Approves the Law that Creates Incentives for Biofuels”, 12/27/2017, http://www.abbi.org.br/pt/noticia/temer-sanciona-lei-que-cria-politica-de-incentivos-para-biocombustiveis/
100 Biomass Magazine (2017), “Senate Passes Bill Creating a National Biofuel Policy”, 12/17/2017, http://biomassmagazine.com/articles/14915/brazilundefineds-senate-passes-bill-creating-a-national-biofuels-policy
101 Leticia Philipps/Sugar Cane.org (2017), “Brazil to Launch Ambitious Biofuels Program”, 12/4/2017, http://sugarcane.org/blog/brazil-to-launch-ambitious-biofuels-program
102 Victor Ikeda/RaboResearch (2017), “New Brazilian Biodiesel Mandate Means Soy Oil’s in Luck, but also Raises Questions”, December 2017, https://research.rabobank.com/far/en/sectors/grains-oilseeds/New-Brazilian-Biodiesel-Mandate-Good-for-Soy-Oil.html
103 Ibid.104 Renewables Now (2018), “Brazil Regulates Its National Biofuel
Policy Law”, 3/15/2018, https://renewablesnow.com/news/brazil-regulates-its-national-biofuel-policy-law-605288/
105 Fuels and Lubes (2018), “Brazil’s National Biofuels Policy To Expand Use Of Ethanol And Biodiesel”, 3/19/2018, https://fuelsandlubes.com/brazils-national-biofuels-policy-to-expand-use-of-ethanol-and-biodiesel/
106 Reuters (2018), “Activists Can Challenge The Way EU Approves Gmos For Market: Court”, 3/14/2018, https://www.reuters.com/article/us-eu-court-gmo/activists-can-challenge-the-way-eu-approves-gmos-for-market-court-idUSKCN1GQ1HI
107 Ankyoreh (2017), “South Korean Government To Shut Down GMO-Related Development Project”, 9/3/2017, http://english.hani.co.kr/arti/english_edition/e_national/809383.html
108 Nature (2018), “European Court Suggests Relaxed Gene-editing Rules”, 1/19/2018, https://www.nature.com/articles/d41586-018-01013-5
109 USDA (2018), “Secretary Perdue Issues USDA Statement on Plant Breeding Innovation”, 3/28/2018, https://www.usda.gov/media/press-releases/2018/03/28/secretary-perdue-issues-usda-statement-plant-breeding-innovation; The Guardian (2018), “US Gene-Editing Ruling Delights Plant Scientists”, 8/4/2018, https://www.theguardian.com/science/2018/apr/07/gene-editing-ruling-crops-plants

BUILDING THE BIOECONOMY 5TH EDITION
117
110 Nigel Halford/Genetic Literacy project (2018), “Europe Missed Out On GMO Biotech Revolution. What’s Going To Happen With Gene Editing?”, 3/14/2018, https://geneticliteracyproject.org/2018/03/14/europe-missed-out-on-gmo-biotech-revolution-whats-going-to-happen-with-gene-editing/; S.Suppan/IATP (2017), “ NAFTA 2.0 Negotiations and the US Non- Regulation Of The New GMOs”, 10/24/2017, https://www.iatp.org/sites/default/files/2018-02/NAFTA%202.0%20Negotiations%20and%20US%20Non-regulation%20of%20New%20GMOs.pdf; Mateusz Perkovski/Digital Press (2018), “Legal Opinion: Gene Editing Exempt From Europe’s GMO Rules”, 1/30/2018, http://www.capitalpress.com/Nation_World/Nation/20180130/legal-opinion-gene-editing-exempt-from-europes-gmo-rules; InfoCuria/ECJ (2018), “Case C-528/16”, 1/18/2018, http://curia.europa.eu/juris/document/document.jsf?text=&docid=198532&pageIndex=0&doclang=EN&mode=req&dir=&occ=first&part=1&cid=779174
111 Umea Plant Science Center (2016), ““Green light in the tunnel”! Swedish Board of Agriculture: a CRISPR-Cas9-mutant but not a GMO”, 12/19/2016, https://www.upsc.se/about-upsc/news/4815-green-light-in-the-tunnel-swedish-board-of-agriculture-a-crispr-cas9-mutant-but-not-a-gmo.html; Pablo Orozco/Alliance for Science (2018), 1/29/2018, “Argentina and Brazil merge law and science to regulate new breeding techniques”, https://allianceforscience.cornell.edu/blog/2018/01/argentina-and-brazil-merge-law-and-science-to-regulate-new-breeding-techniques/
112 Pablo Orozco/Alliance for Science (2018).113 Marthy McCartney/ABC (2018), “Genetic Modification Laws Set
For Shake-Up, With Health And Agriculture Research Industries To Benefit”, 1/19/2018, http://www.abc.net.au/news/rural/2018-01-19/gene-tech-regulator-proposes-shakeup-for-genetic-modification/9341354
114 The Wall Street Journal (2018), “Scientists in China Race to Edit Crop Genes, Sowing Unease in US”, 5/6/2018, https://www.wsj.com/articles/scientists-in-china-race-to-edit-crop-genes-sowing-unease-in-u-s-1525611601; https://ecofriend.com/what-is-the-future-of-genetically-modified-food.html
115 BioNews (2018), “China Has Treated 86 People with CRISPR Gene Editing”, 1/29/2018, https://www.bionews.org.uk/page_96339; The Wall Street Journal (2018), “China, Unhampered by Rules, Races Ahead in Gene-Editing Trials”, 1/21/2018, https://www.wsj.com/articles/china-unhampered-by-rules-races-ahead-in-gene-editing-trials-1516562360?mod=article_inline
116 BioNews (2018), “First Genome Editing Trials in Europe Gets Go-ahead”, 4/21/2018, https://www.bionews.org.uk/page_135374
117 GSK (2016), “GSK And Verily To Establish Galvani Bioelectronics – A New Company Dedicated To The Development Of Bioelectronic Medicines”, 8/1/2016, https://us.gsk.com/en-us/media/press-releases/2016/gsk-and-verily-to-establish-galvani-bioelectronics-a-new-company-dedicated-to-the-development-of-bioelectronic-medicines/
118 US FDA “Use of Real-World Evidence to Support Regulatory Decision-Making for Medical Devices: Guidance for Industry and Food and Drug Administration Staff,” 8/31/2017, https://www.fda.gov/downloads/MedicalDevices/DeviceRegulationandGuidance/GuidanceDocuments/UCM513027.pdf
119 PwC (2018), “Real-World Evidence A Growing Challenge For Pharma”, https://www.pwc.com/us/en/health-industries/top-health-industry-issues/real-world-evidence.html
120 Virgil Dickson/FDA (2018), “FDA looks to regulate digital drug products”, 4/26/2018, http://www.modernhealthcare.com/article/20180426/NEWS/180429924
121 Globes (2018), “Cabinet Approves NIS 922m for Digital Health Project”, 3/22/2018, http://www.globes.co.il/en/article-cabinet-approves-nis-922m-for-digital-health-program-1001229256
122 NIH website, “All of US’, https://allofus.nih.gov123 Danish Ministry of Health website (accessed March 2018), “National
Strategy For Personalized Medicines 2017-2020”, http://www.sum.dk/English/Healthcare-in-Denmark-An-Overview/Personalised-Medicine.aspx
124 Ministry of Industry, Business and Financial Affairs (2018), “Growth Plan Factsheet”, 3/2/2018, https://em.dk/english/news/2018/03-06-life-science
125 Karolinska Institute website, “New National Initiative for Precision Medicine – Genomic Medicine Sweden”, 9/14/2017, https://ki.se/en/mmk/new-national-initiative-for-precision-medicine-genomic-medicine-sweden
126 Finnish Ministry of Social Affairs and Health (2015), “Finland can become a model country for utilising genome information”6/11/2015, http://stm.fi/en/article/-/asset_publisher/suomesta-voi-tulla-genomitiedon-hyodyntamisen-mallimaa
127 Nordic Life Sciences News (2016), “Finland Invests in National Genomic and Cancer Center”, 5/6/1016, http://nordiclifescience.org/finland-invests-national-genomic-cancer-center/
128 European Commission (2018), “Data in the EU: Commission steps up efforts to increase availability and boost healthcare data sharing”, 4/25/2018, http://europa.eu/rapid/press-release_IP-18-3364_en.htm
129 Innovation and Sciences Australia (2018), “Australia 2030: Prosperity Trough Innovation”, https://industry.gov.au/Innovation-and-Science-Australia/Pages/default.aspx
130 Gov.Uk (2017), “Industrial Strategy – Life Sciences Sector Deal”, December 2017, https://assets.publishing.service.gov.uk/government/uploads/system/uploads/attachment_data/file/665452/life-sciences-sector-deal-web-ready-version.pdf
131 UK Life Sciences Deal, p.26.132 The World Bank describes this indicator as: “Researchers in R&D
are professionals engaged in the conception or creation of new knowledge, products, processes, methods, or systems and in the management of the projects concerned. Postgraduate PhD students (ISCED97 level 6) engaged in R&D are included.”
133 The World Bank describes this indicator as: “Expenditures for research and development are current and capital expenditures (both public and private) on creative work undertaken systematically to increase knowledge, including knowledge of humanity, culture, and society, and the use of knowledge for new applications. R&D covers basic research, applied research, and experimental development.”
134 World Bank, World Development Indicators, Scientific and technical journal articles, Accessed May 2018.
135 World Bank defines the fields covered as: “Scientific and technical journal articles refer to the number of scientific and engineering articles published in the following fields: physics, biology, chemistry, mathematics, clinical medicine, biomedical research, engineering and technology, and earth and space sciences.”
136 OECD (2017), “OECD Science, Technology and Industry Scoreboard 2017”, Chapter 3, Graph 3.1.1. Quantity and quality of scientific production, 2005 and 2015.
137 OECDStat, Patents by technology, Triadic Patent families, Biotechnology, Inventor’s country of residence, Priority date, 1999-2013.
138 Iain M. Cockburn, Jean O. Lanjouw, Mark Schankerman (2014) “Patents and the Global Diffusion of New Drugs”, NBER Working Paper No. 20492, Table A2, p. 43.
139 WIPO (2017), “Patent Cooperation Treaty Yearly Review”, Table A.3.3.2: Top 50 PCT applicants: universities, 2016.
140 James, Clive (2017), “Global Status of Commercialized Biotech/GM Crops: 2016”, ISAAA, Brief No. 52. ISAAA, Ithaca, NY.
141 Pugatch Consilium (2017) “Ascending to the Peak of Biopharmaceutical Innovation – The Biopharmaceutical Investment & Competitiveness (BCI) Survey – 2017”, October 2017, http://www.pugatch-consilium.com/reports/BCI_2017_Report.pdf
142 A Groh et al. (2018), “Venture Capital & Private Equity Country Attractiveness Index 2018”, IESE and EMLYON, https://blog.iese.edu/vcpeindex/
143 Pugatch Consilium (2017), “BCI LatAm”144 OECD (2013), p.37145 World Bank data bank, Researchers in R&D (per million people),
SP.POP.SCIE.RD.P6146 For a few specific industrial example, see the production of
indefinitely renewable polymers through fermentation of engineered microorganisms results in a reduction of petroleum use and GHC emission of over 65% compared to standard polymers. Industrial biotechnology has reduced the energy used in the cosmetic industry by 60% and by 40% in pulp and paper bleaching process. See: Scientific American (2016), “Systems Metabolic Engineering Turns Microbes into Factories”, 6/23/2016,; Joanna Dupont Inglis/EuropaBIO (2014), “The role and impact of biotechnology in the next Industrial Revolution”, 3/5/2014,
147 Stuart J. Smith/Food and Energy Security (2017), “Genetically modified crops, regulatory delays, and international trade”, Volume 6, Issue 2, May 2017, pp. 78-86, https://onlinelibrary.wiley.com/doi/full/10.1002/fes3.100
148 G. Brookes & P. Barfoot (2016),“GM crops: global socio-economic and environmental impacts 1996- 2014”, https://www.pgeconomics.co.uk/pdf/2016globalimpactstudymay2016.pdf
149 Ibid.

118
NOTES
150 W. Klümper & M. Qaim (2014), “A Meta Analysis Of The Impacts Of Genetically Modified Crops”, PLoS ONE 9:1–7; A. Subramanian & M. Qaim (2010), “The Impact Of Bt Cotton On Poor Households In Rural India”. J. Dev. Stud. 46:295–311.
151 S. Kouser and M. Qaim (2011), “Impact Of Bt Cotton On Pesticide Poisoning In Smallholder Agriculture: A Panel Data Analysis”, Ecologic Economics, Elsevier, vol. 70(11), pages 2105-2113, September 2011, https://ideas.repec.org/a/eee/ecolec/v70y2011i11p2105-2113.html
152 EcoWatch (2015), “It’s Official: 19 European Countries Say ‘No’ to GMOs”, 10/5/2015, https://www.ecowatch.com/its-official-19-european-countries-say-no-to-gmos-1882106434.html
153 Stuart Smith/GMO Answers (2017), “Genetically Modified Crops, Regulatory Delays, And International Trade”, 3/13/2017, https://gmoanswers.com/studies/study-genetically-modified-crops-regulatory-delays-and-international-trade
154 Stuart J. Smith/Food and Energy Security (2017).155 S. Biden et al./GM Crops Food (2018), “The Economic And
Environmental Cost Of Delayed GM Crop Adoption: The Case Of Australia’s GM Canola Moratorium”, 1/2/2018, https://www.ncbi.nlm.nih.gov/pubmed/29359993
156 USDA (2017), “Mexico: Agricultural Biotechnology Annual”, 11/24/2017, https://gain.fas.usda.gov/Recent%20GAIN%20Publications/Agricultural%20Biotechnology%20Annual_Mexico%20City_Mexico_12-22-2017.pdf
157 BrazilGovNews (2017), “Agriculture Drives Brazilian Economic Growth”, 4/10/2017, http://www.brazilgovnews.gov.br/news/2017/10/agriculture-drives-brazilian-economic-growth?TSPD_101_R0=bce23ce78202bb03567945a3922e2f73i7l00000000000000003418fb53ffff00000000000000000000000000005b199396002e1b894d
158 Ministry of Foreign Affairs of Denmark (2018), “Danish Government Boosts Danish Life Sciences Industry with Growth Team”, https://investindk.com/en/insights/danish-government-boosts-danish-life-sciences-industry-with-growth-team
159 Gov.Uk (2017), “Industrial Strategy – Life Sciences Sector Deal”, December 2017, https://assets.publishing.service.gov.uk/government/uploads/system/uploads/attachment_data/file/665452/life-sciences-sector-deal-web-ready-version.pdf
160 Gov.Uk (2017), “Government and life sciences sector agree transformative sector deal”, Press Release, 12/6/2017, https://www.gov.uk/government/news/government-and-life-sciences-sector-agree-transformative-sector-deal

BUILDING THE BIOECONOMY 5TH EDITION
119

CONTACT USUK Office 88 Sheep Street, Bicester, Oxon OX26 6LP Tel: +44 1869 244414 Fax: +44 1869 320173 E: [email protected]
FOLLOW USFor more information on our services, to read our research reports or media coverage and for all the latest Pugatch Consilium news, please take a look at our online news room and blog or follow us on social media.
www.pugatch-consilium.com
Twitter@PConsilium


