Building Submarines in Australia - Aspects of Economic ... · submarines are sourced from overseas...
116
UNCLASSIFIED BUILDING SUBMARINES IN AUSTRALIA - ASPECTS OF ECONOMIC IMPACT MAY 2015 UNCLASSIFIED
Transcript of Building Submarines in Australia - Aspects of Economic ... · submarines are sourced from overseas...
UNCLASSIFIED
BUILDING SUBMARINES IN AUSTRALIA- ASPECTS OF ECONOMIC IMPACT
MAY 2015
UNCLASSIFIED
joanne.kopec
Text Box
FOI 145/15/16 External Review Item 2

UNCLASSIFIED
UNCLASSIFIED
BUILDING SUBMARINES IN AUSTRALIA
‐ ASPECTS OF ECONOMIC IMPACT
MAY 2015
UNCLASSIFIED
TABLE OF CONTENTS _____________________________________________________________________________
PREFACE
KEY MESSAGES ……………………………………………………………………………….……………………………… 1
KEY METRICS …………………………………………………………………………………..……………………………… 2
EXECUTIVE SUMMARY …………………………………………………………………………………………………… 3
THE POLICY CONTEXT ……………………………………………………………………..……………………………… 14
MEASURING ECONOMIC IMPACT …………………………………………………………………..……………… 20
THE MODELLING STRATEGY ……………………………………………………………..……….…………………… 26
NATIONAL ECONOMIC IMPACT ……………………………………………………………………………………… 33
STATE IMPACT ‐ SOUTH AUSTRALIA …………..……………………………………………………………….. 42
REGIONAL IMPACT ‐ SOUTH AUSTRALIA ……………………………………………………………………… 50
SPILLOVERS ………………………………………………..………………………………………………………………….. 52
AN ALTERNATIVE APPROACH ‐ NIEIR …………………………….………………………………………..…… 70
CONCLUSIONS ……………………………………………………………………………………………………..…….. 75
ATTACHMENTS
A. The Elements of Economic Contribution ………………………..………………………………………… 79
B. I‐O Modelling, CGE Modelling and Crowding Out Effects ………………..……………………….. 80
C. Choice of Model ‐ I‐O .v. CGE ……………………………………..………………..………………………… 83
D. Tax Effects ………………………………………………………………….…..…………………..…………………… 88
E. Aspects of Real Consumption ……………………………………………..……………..………………….… 90
F. Setting Price Premium and Australian Content Scenarios ………..…………..………………….. 91
G. The Cost of Collins ……………………………………………………………………..………..………………….. 94
H. Submarine Skills Profile ………………………………………………………..……………..………………….. 103
I. Estimating Differences in Impact between an Australian and Overseas Build ……....…. 105
Bibliography …………………………………………………………………………………………………………………… 107
_____________________________________________________________________________
UNCLASSIFIED
GLOSSARY ___________________________________________________________________________________________
ABS ‐ Australian Bureau of Statistics
ADF – Australian Defence Force
ASC ‐ Australian Submarine Corporation
CGE ‐ Computable general equilibrium
DMO ‐ Defence Materiel Organisation
Defence ‐ Department of Defence
FTE ‐ Full Time Equivalent
GDP ‐ Gross Domestic Product
GRP – Gross Regional Product
GSP ‐ Gross State Product
IAC ‐ Industries Assistance Commission
I‐O ‐ Input‐Output
ISCMMS ‐ Integrated Ships Control Management and Monitoring System
MMRF ‐ Monash Multi‐Regional Forecasting model
NIEIR ‐ National Institute for Economic and Industry Research
PC ‐ Productivity Commission
VUMRF ‐ Victoria University Multi‐Regional Forecasting model
UNCLASSIFIED
Preface
From time to time the Defence Materiel Organisation (DMO) examines, on its own initiative, the economic
impacts of Department of Defence (‘Defence’) capital equipment projects.
The primary objective of studies prepared on this basis is to better inform Defence decision‐makers in relation
to projects raising public policy issues of particular interest. The studies are normally either commissioned by
DMO or undertaken in conjunction with consultants.
This report presents the results of one such study. It deals with aspects of the economic impact of building
submarines in Australia.
The economic modelling to support the study was conducted by Victoria University with assistance in relation
to data processing from consultants, Macroeconomics. It was based on Collins cost data supplied by DMO
which also prepared this report. The economic impact figures presented in the report are those provided
directly by Victoria University to DMO, without alteration.
Victoria University was further engaged to contribute to, and review, the presentation of the economic
modelling aspects of the report including the interpretation of modelling results. Consultants Deloitte Access
Economics were engaged to contribute to, and review, the report with a particular focus on economic spillover
effects. DMO wishes to thank Professor Philip Adams of Victoria University and Professor Henry Ergas of
Deloitte Access Economics for their invaluable input and advice.
The Commonwealth Departments of Treasury and Industry and Science were consulted in relation to both
model and consultant selection. However, the responsibility for the report rests with DMO.
The report is being released to help inform debate. Its contents do not represent the official or final position of
the Department of Defence. A number of important caveats, discussed in the main body of the report, apply in
relation to contents of the document and the uses to which its results might be put.
Building Submarines in Australia – Aspects of Economic Impact ‐ May 2015 1 ______________________________________________________________________________________________
UNCLASSIFIED
1
Key Messages
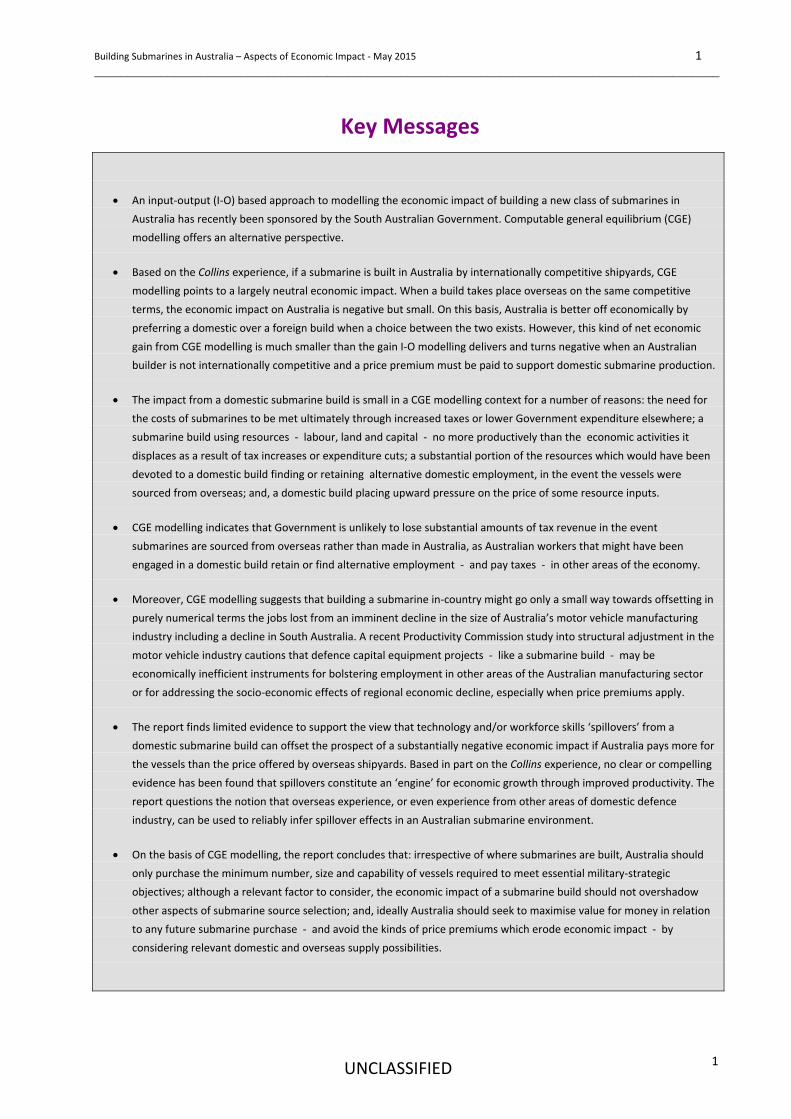
An input‐output (I‐O) based approach to modelling the economic impact of building a new class of submarines in
Australia has recently been sponsored by the South Australian Government. Computable general equilibrium (CGE)
modelling offers an alternative perspective.
Based on the Collins experience, if a submarine is built in Australia by internationally competitive shipyards, CGE
modelling points to a largely neutral economic impact. When a build takes place overseas on the same competitive
terms, the economic impact on Australia is negative but small. On this basis, Australia is better off economically by
preferring a domestic over a foreign build when a choice between the two exists. However, this kind of net economic
gain from CGE modelling is much smaller than the gain I‐O modelling delivers and turns negative when an Australian
builder is not internationally competitive and a price premium must be paid to support domestic submarine production.
The impact from a domestic submarine build is small in a CGE modelling context for a number of reasons: the need for
the costs of submarines to be met ultimately through increased taxes or lower Government expenditure elsewhere; a
submarine build using resources ‐ labour, land and capital ‐ no more productively than the economic activities it
displaces as a result of tax increases or expenditure cuts; a substantial portion of the resources which would have been
devoted to a domestic build finding or retaining alternative domestic employment, in the event the vessels were
sourced from overseas; and, a domestic build placing upward pressure on the price of some resource inputs.
CGE modelling indicates that Government is unlikely to lose substantial amounts of tax revenue in the event
submarines are sourced from overseas rather than made in Australia, as Australian workers that might have been
engaged in a domestic build retain or find alternative employment ‐ and pay taxes ‐ in other areas of the economy.
Moreover, CGE modelling suggests that building a submarine in‐country might go only a small way towards offsetting in
purely numerical terms the jobs lost from an imminent decline in the size of Australia’s motor vehicle manufacturing
industry including a decline in South Australia. A recent Productivity Commission study into structural adjustment in the
motor vehicle industry cautions that defence capital equipment projects ‐ like a submarine build ‐ may be
economically inefficient instruments for bolstering employment in other areas of the Australian manufacturing sector
or for addressing the socio‐economic effects of regional economic decline, especially when price premiums apply.
The report finds limited evidence to support the view that technology and/or workforce skills ‘spillovers’ from a
domestic submarine build can offset the prospect of a substantially negative economic impact if Australia pays more for
the vessels than the price offered by overseas shipyards. Based in part on the Collins experience, no clear or compelling
evidence has been found that spillovers constitute an ‘engine’ for economic growth through improved productivity. The
report questions the notion that overseas experience, or even experience from other areas of domestic defence
industry, can be used to reliably infer spillover effects in an Australian submarine environment.
On the basis of CGE modelling, the report concludes that: irrespective of where submarines are built, Australia should
only purchase the minimum number, size and capability of vessels required to meet essential military‐strategic
objectives; although a relevant factor to consider, the economic impact of a submarine build should not overshadow
other aspects of submarine source selection; and, ideally Australia should seek to maximise value for money in relation
to any future submarine purchase ‐ and avoid the kinds of price premiums which erode economic impact ‐ by
considering relevant domestic and overseas supply possibilities.
Building Submarines in Australia – Aspects of Economic Impact ‐ May 2015 2 ______________________________________________________________________________________________
UNCLASSIFIED
2
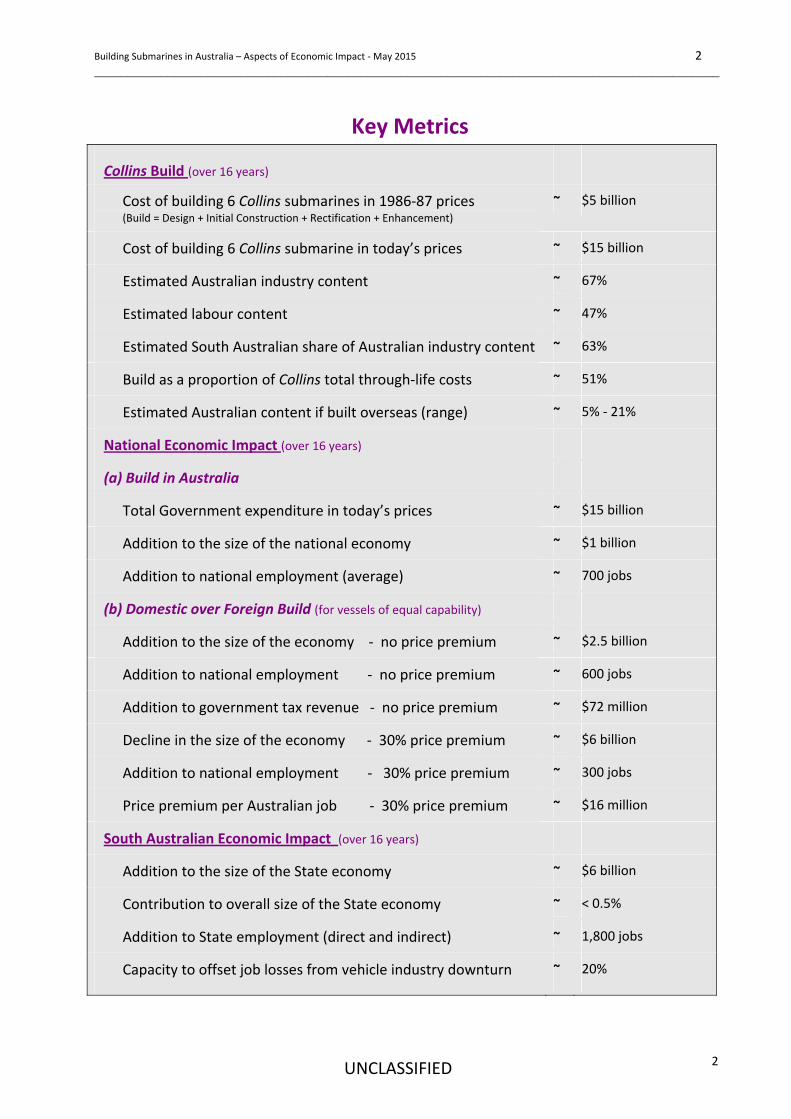
Key Metrics
Collins Build (over 16 years)
Cost of building 6 Collins submarines in 1986‐87 prices (Build = Design + Initial Construction + Rectification + Enhancement)
~ $5 billion
Cost of building 6 Collins submarine in today’s prices ~ $15 billion
Estimated Australian industry content ~ 67%
Estimated labour content ~ 47%
Estimated South Australian share of Australian industry content ~ 63%
Build as a proportion of Collins total through‐life costs ~ 51%
Estimated Australian content if built overseas (range) ~ 5% ‐ 21%
National Economic Impact (over 16 years)
(a) Build in Australia
Total Government expenditure in today’s prices ~ $15 billion
Addition to the size of the national economy ~ $1 billion
Addition to national employment (average) ~ 700 jobs
(b) Domestic over Foreign Build (for vessels of equal capability)
Addition to the size of the economy ‐ no price premium ~ $2.5 billion
Addition to national employment ‐ no price premium ~ 600 jobs
Addition to government tax revenue ‐ no price premium ~ $72 million
Decline in the size of the economy ‐ 30% price premium ~ $6 billion
Addition to national employment ‐ 30% price premium ~ 300 jobs
Price premium per Australian job ‐ 30% price premium ~ $16 million
South Australian Economic Impact (over 16 years)
Addition to the size of the State economy ~ $6 billion
Contribution to overall size of the State economy ~ < 0.5%
Addition to State employment (direct and indirect) ~ 1,800 jobs
Capacity to offset job losses from vehicle industry downturn ~ 20%
Building Submarines in Australia – Aspects of Economic Impact ‐ May 2015 3 ______________________________________________________________________________________________
UNCLASSIFIED
3
EXECUTIVE SUMMARY
The Issue
The overriding objective of purchasing a new class of submarines for Australia is, and will remain, the defence of
Australia. It is the ability to satisfy the country’s military‐strategic needs which assumes a position of primacy in any
decisions on how many vessels might be purchased, their capabilities and their country of origin.
However, the economic aspects of whether a new class of submarines should be built in Australia or overseas has
recently attracted considerable public attention. Much of this discussion has been premised on an understanding
that Australia has essential military‐strategic objectives which only the purchase of a new fleet of submarines can
fulfil.
The Aim
The only recent modelling conducted in Australia in relation to the economic impact of a submarine build has been
that commissioned by the South Australian Government. This is based predominantly on an I‐O modelling
methodology. It can be argued that I‐O modelling tends to provide an estimate at the higher end of the economic
impact spectrum. An alternative to I‐O modelling is CGE modelling which, it can be argued, tends to provide
estimates of economic impact towards the lower end of the spectrum.
Given that recently modelled I‐O based results are already available but recent CGE results are not, this report
provides some relevant CGE modelling data. In doing so, the primary aim of the report is to inform decision‐makers
on the sensitivity of economic impact estimates to choice of modelling technique.
Policy Links
With I‐O modelling providing what might be regarded as a ‘right of arc’ in relation to estimates of economic impact
and CGE modelling providing what might be regarded as ‘left of arc’ impact estimates, the question naturally arises
of which set of estimates are likely to provide the most reliable indication of a how a submarine build might affect
the economy.
The report identifies a number of advantages associated with a CGE approach to modelling. However, where exactly
a submarine build should lie on the economic impact spectrum depends ultimately on what approach to industry
development one prefers. This approach depends in turn on matters of industry policy, some of which might
become clearer with the impending release of a new Defence White Paper and Defence Industry Policy Statement.
With these points in mind, the focus of this report is on establishing a realistic range of potential economic impact
estimates from which policy decision‐makers might choose.
The Scenario
At this stage, both the cost and build method of a Future Submarine have still to be determined. If the media is to be
believed, these factors might differ substantially according to the type of submarines Australia ultimately requires
and the sources from which these vessels might be available.
Building Submarines in Australia – Aspects of Economic Impact ‐ May 2015 4 ______________________________________________________________________________________________
UNCLASSIFIED
4
In the absence of detailed data on a new class of submarine, the report therefore explores economic impact under a
purely hypothetical build scenario. The primary objective is to illustrate the different kinds of analytic issues which
arise when the economic impact of a large public sector infrastructure project like a submarine build is being
assessed.
However, to help ensure that the modelling captures the general economic characteristics of a submarine build
project, the report draws on cost data from the build phase of Australia’s current Collins submarine fleet. The
objective in this case is not to provide an economic history of the Collins build project as it actually occurred. Nor is
the intention to use Collins cost data to generate estimates of economic impact from which the economic effects of
a Future Submarine build project can be precisely inferred. Instead, Collins cost data are adopted to set parameters
around a submarine build which capture its generic or general economic characteristics.
With these points in mind, the modelling scenario used in the report is as follows: what would be the economic
impact of building six Collins class submarines at their current level of capability, commencing now and following a
build strategy similar to that applying when the vessels were first produced. The report is not advocating that such a
build could or should take place. It simply examines what the economic impact might be if a build of this kind was to
occur.
The Overall Outcome
The preliminary results from CGE modelling suggest that, despite its absolute size, a Collins equivalent submarine
build in Australia might have a smaller impact on the economy than many expect.
A relatively small impact emerges as a result of ‘crowding out’ which incorporates the effects of the following
factors:
the submarines must eventually be paid for by an increase in taxation or a decline in other forms of
Government expenditure. This has the effect of reducing economic activity in non‐submarine areas of the
economy;
a submarine build appears to be no more productive in its use of resources ‐ land, labour and capital ‐
than the economic activity it displaces as a result of associated Government tax increases or expenditure
cuts;
if the submarines were not sourced in‐country but purchased from overseas, there is a reasonable prospect
that a substantial proportion of the resources that would have gone into a domestic build could be put to
productive use somewhere else in the Australian economy;
building a submarine may draw on resources in short supply. This can drive up production costs not just for
submarine construction but in other areas of domestic industry and erode Australia’s international
competitiveness; and
building a submarine appears to be only a small contributor to new technologies and skills from which
others within the economy might benefit through ‘spillover’ effects.
Building Submarines in Australia – Aspects of Economic Impact ‐ May 2015 5 ______________________________________________________________________________________________
UNCLASSIFIED
5
Adding to these factors is the possibility that if a submarine must be paid for by increased taxes, these taxes may
distort the way in which decisions are made across the economy and impede the efficient use of labour, savings and
investment.
The Individual Patterns
From the modelling, the following overall patterns emerge:
the national economic impacts are more positive for an Australian than an overseas build, assuming the
costs of both builds are the same. Under this assumption, an overseas build with limited Australian content
offers the least positive outcome. However, the differences between the two build scenarios ‐ domestic
and overseas, when their costs are the same ‐ are not particularly large;
the worst outcome applies when an Australian build proceeds when equivalent vessels are available for
purchase from overseas at a significantly lower cost: that is, when a significant price premium applies to
support production within Australia; and
at a State and Territory level, an Australia‐build produces mixed outcomes. Assuming the fleet is built
largely in South Australia, that State in particular benefits. However, most other States and Territories lose.
An overseas build, with limited Australian content, leads to smaller State and Territory gains. However, the
economic impact for all States and Territories is either negative or minimal if Australia purchases a
submarine at a substantial price premium.
The National Figures
(a) An Australian Build ‐ No Price Premium
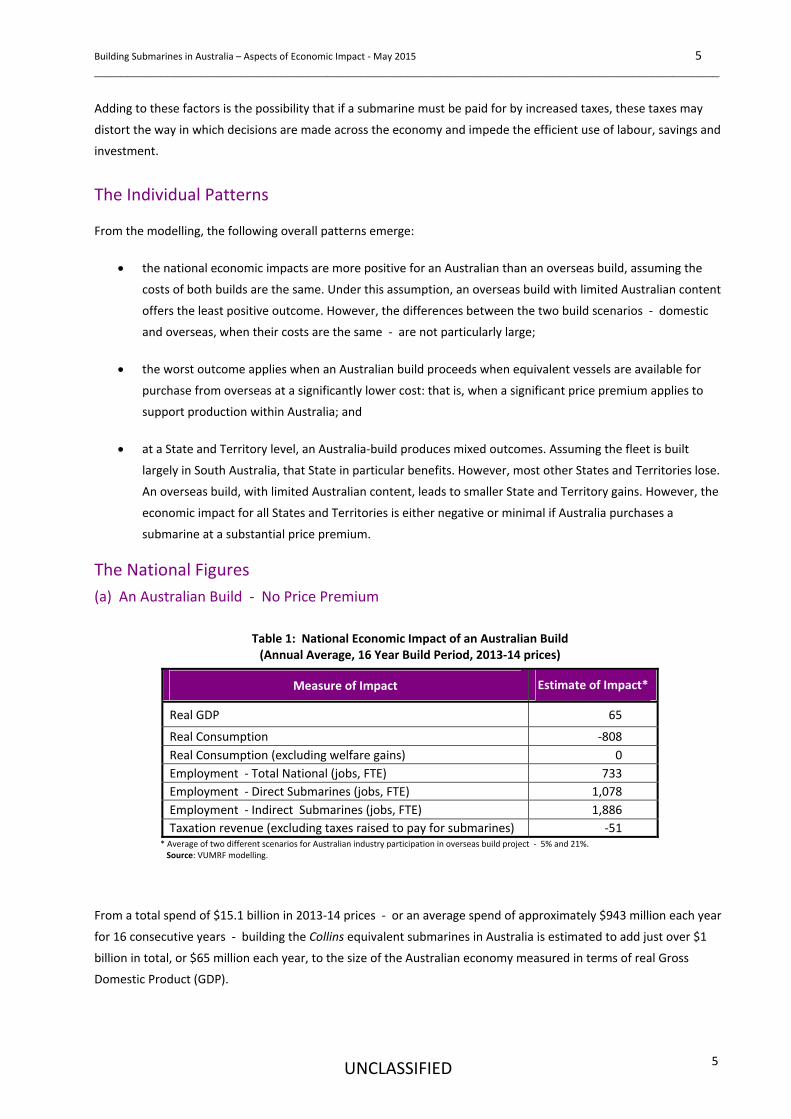
Table 1: National Economic Impact of an Australian Build (Annual Average, 16 Year Build Period, 2013‐14 prices)
Measure of Impact Estimate of Impact*
Real GDP 65
Real Consumption ‐808
Real Consumption (excluding welfare gains) 0
Employment ‐ Total National (jobs, FTE) 733
Employment ‐ Direct Submarines (jobs, FTE) 1,078
Employment ‐ Indirect Submarines (jobs, FTE) 1,886
Taxation revenue (excluding taxes raised to pay for submarines) ‐51 * Average of two different scenarios for Australian industry participation in overseas build project ‐ 5% and 21%. Source: VUMRF modelling.
From a total spend of $15.1 billion in 2013‐14 prices ‐ or an average spend of approximately $943 million each year
for 16 consecutive years ‐ building the Collins equivalent submarines in Australia is estimated to add just over $1
billion in total, or $65 million each year, to the size of the Australian economy measured in terms of real Gross
Domestic Product (GDP).
Building Submarines in Australia – Aspects of Economic Impact ‐ May 2015 6 ______________________________________________________________________________________________
UNCLASSIFIED
6
National real consumption, which indicates the value of goods and services both the public and private sectors
within Australia have at their disposal, declines. This is due, in the main, to the higher taxes necessary to fund the
submarine project. However, the decline in real consumption of $808 million per annum is the amount society is
willing to pay each year to obtain the national security benefits submarines provide. It therefore does not represent
a reduction in national welfare.
Employment rises by only 733 Full Time Equivalent (FTE) jobs nation‐wide after crowding out reduces job numbers in
other industries. The tax effects are minimal after excluding the increased taxes raised directly to fund a submarine
build.
These overall results accord with earlier modelling by the Industries Assistance Commission (IAC) ‐ and point to a
largely neutral or negligible impact.
(b) An Overseas Build ‐ No Price Premium
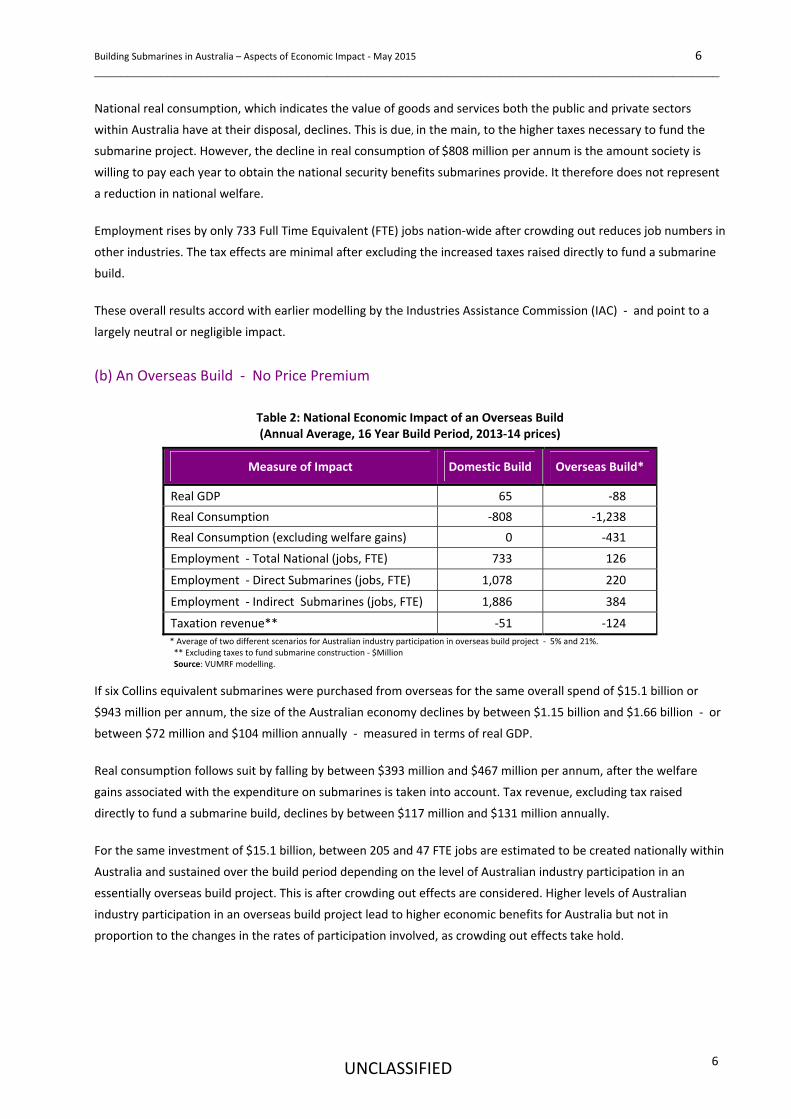
Table 2: National Economic Impact of an Overseas Build (Annual Average, 16 Year Build Period, 2013‐14 prices)
Measure of Impact Domestic Build Overseas Build*
Real GDP 65 ‐88
Real Consumption ‐808 ‐1,238
Real Consumption (excluding welfare gains) 0 ‐431
Employment ‐ Total National (jobs, FTE) 733 126
Employment ‐ Direct Submarines (jobs, FTE) 1,078 220
Employment ‐ Indirect Submarines (jobs, FTE) 1,886 384
Taxation revenue** ‐51 ‐124
* Average of two different scenarios for Australian industry participation in overseas build project ‐ 5% and 21%. ** Excluding taxes to fund submarine construction ‐ $Million Source: VUMRF modelling.
If six Collins equivalent submarines were purchased from overseas for the same overall spend of $15.1 billion or
$943 million per annum, the size of the Australian economy declines by between $1.15 billion and $1.66 billion ‐ or
between $72 million and $104 million annually ‐ measured in terms of real GDP.
Real consumption follows suit by falling by between $393 million and $467 million per annum, after the welfare
gains associated with the expenditure on submarines is taken into account. Tax revenue, excluding tax raised
directly to fund a submarine build, declines by between $117 million and $131 million annually.
For the same investment of $15.1 billion, between 205 and 47 FTE jobs are estimated to be created nationally within
Australia and sustained over the build period depending on the level of Australian industry participation in an
essentially overseas build project. This is after crowding out effects are considered. Higher levels of Australian
industry participation in an overseas build project lead to higher economic benefits for Australia but not in
proportion to the changes in the rates of participation involved, as crowding out effects take hold.
Building Submarines in Australia – Aspects of Economic Impact ‐ May 2015 7 ______________________________________________________________________________________________
UNCLASSIFIED
7
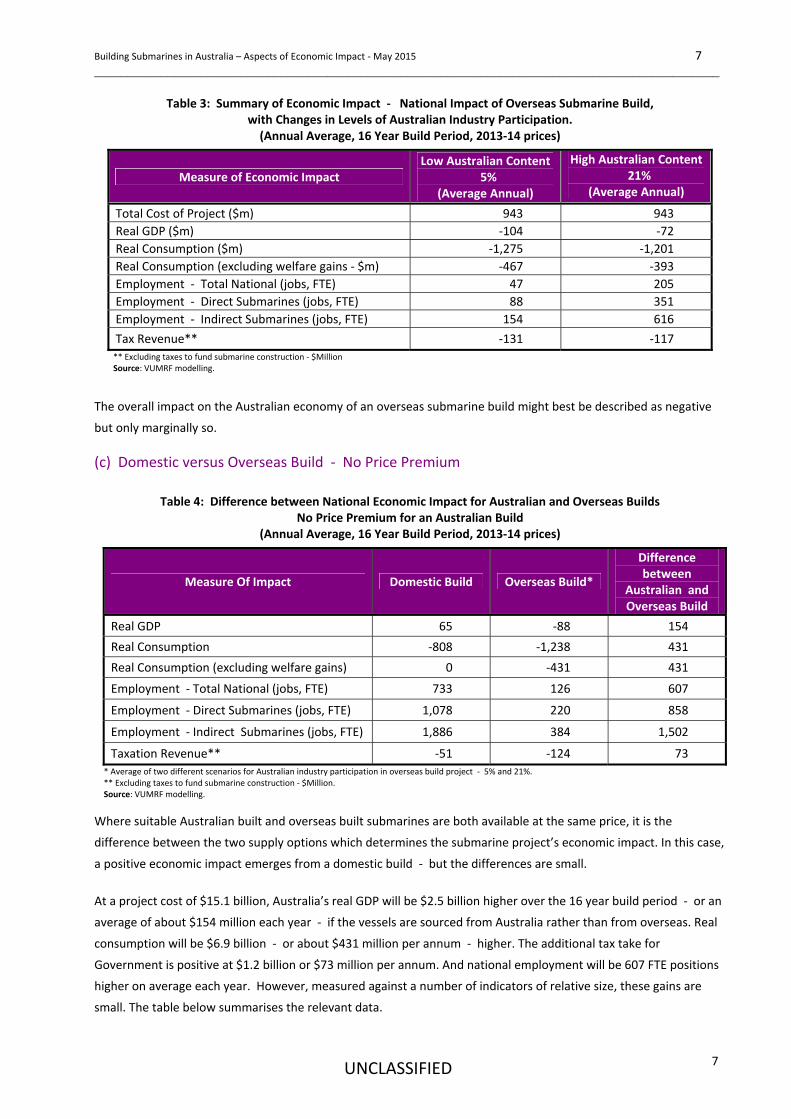
Table 3: Summary of Economic Impact ‐ National Impact of Overseas Submarine Build, with Changes in Levels of Australian Industry Participation. (Annual Average, 16 Year Build Period, 2013‐14 prices)
Measure of Economic Impact Low Australian Content
5% (Average Annual)
High Australian Content 21%
(Average Annual)
Total Cost of Project ($m) 943 943
Real GDP ($m) ‐104 ‐72
Real Consumption ($m) ‐1,275 ‐1,201
Real Consumption (excluding welfare gains ‐ $m) ‐467 ‐393
Employment ‐ Total National (jobs, FTE) 47 205
Employment ‐ Direct Submarines (jobs, FTE) 88 351
Employment ‐ Indirect Submarines (jobs, FTE) 154 616
Tax Revenue** ‐131 ‐117
** Excluding taxes to fund submarine construction ‐ $Million Source: VUMRF modelling.
The overall impact on the Australian economy of an overseas submarine build might best be described as negative
but only marginally so.
(c) Domestic versus Overseas Build ‐ No Price Premium
Table 4: Difference between National Economic Impact for Australian and Overseas Builds
No Price Premium for an Australian Build (Annual Average, 16 Year Build Period, 2013‐14 prices)
Measure Of Impact Domestic Build Overseas Build*
Difference between
Australian and Overseas Build
Real GDP 65 ‐88 154
Real Consumption ‐808 ‐1,238 431
Real Consumption (excluding welfare gains) 0 ‐431 431
Employment ‐ Total National (jobs, FTE) 733 126 607
Employment ‐ Direct Submarines (jobs, FTE) 1,078 220 858
Employment ‐ Indirect Submarines (jobs, FTE) 1,886 384 1,502
Taxation Revenue** ‐51 ‐124 73
* Average of two different scenarios for Australian industry participation in overseas build project ‐ 5% and 21%. ** Excluding taxes to fund submarine construction ‐ $Million. Source: VUMRF modelling.
Where suitable Australian built and overseas built submarines are both available at the same price, it is the
difference between the two supply options which determines the submarine project’s economic impact. In this case,
a positive economic impact emerges from a domestic build ‐ but the differences are small.
At a project cost of $15.1 billion, Australia’s real GDP will be $2.5 billion higher over the 16 year build period ‐ or an
average of about $154 million each year ‐ if the vessels are sourced from Australia rather than from overseas. Real
consumption will be $6.9 billion ‐ or about $431 million per annum ‐ higher. The additional tax take for
Government is positive at $1.2 billion or $73 million per annum. And national employment will be 607 FTE positions
higher on average each year. However, measured against a number of indicators of relative size, these gains are
small. The table below summarises the relevant data.
Building Submarines in Australia – Aspects of Economic Impact ‐ May 2015 8 ______________________________________________________________________________________________
UNCLASSIFIED
8
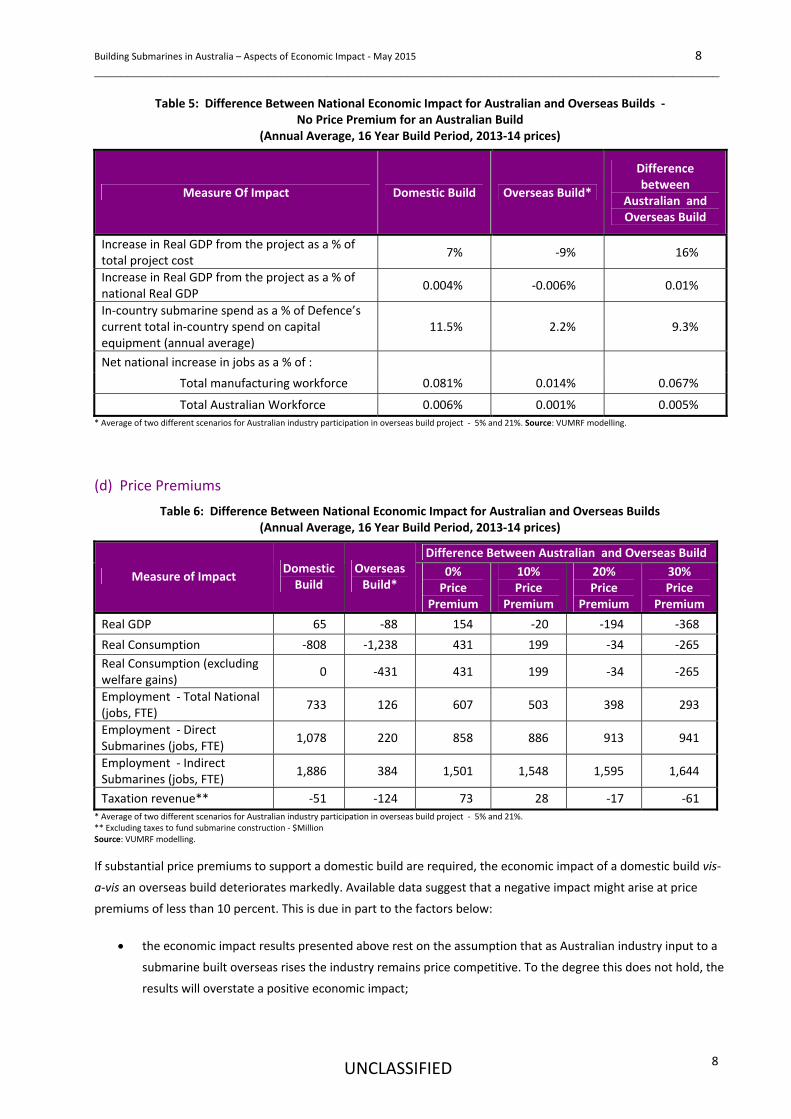
Table 5: Difference Between National Economic Impact for Australian and Overseas Builds ‐ No Price Premium for an Australian Build
(Annual Average, 16 Year Build Period, 2013‐14 prices)
Measure Of Impact Domestic Build Overseas Build*
Difference between
Australian and Overseas Build
Increase in Real GDP from the project as a % of total project cost
7% ‐9% 16%
Increase in Real GDP from the project as a % of national Real GDP
0.004% ‐0.006% 0.01%
In‐country submarine spend as a % of Defence’s current total in‐country spend on capital equipment (annual average)
11.5% 2.2% 9.3%
Net national increase in jobs as a % of :
Total manufacturing workforce 0.081% 0.014% 0.067%
Total Australian Workforce 0.006% 0.001% 0.005%
* Average of two different scenarios for Australian industry participation in overseas build project ‐ 5% and 21%. Source: VUMRF modelling.
(d) Price Premiums
Table 6: Difference Between National Economic Impact for Australian and Overseas Builds (Annual Average, 16 Year Build Period, 2013‐14 prices)
Difference Between Australian and Overseas Build
Measure of Impact Domestic Build
Overseas Build*
0% Price
Premium
10% Price
Premium
20% Price
Premium
30% Price
Premium
Real GDP 65 ‐88 154 ‐20 ‐194 ‐368
Real Consumption ‐808 ‐1,238 431 199 ‐34 ‐265
Real Consumption (excluding welfare gains)
0 ‐431 431 199 ‐34 ‐265
Employment ‐ Total National (jobs, FTE)
733 126 607 503 398 293
Employment ‐ Direct Submarines (jobs, FTE)
1,078 220 858 886 913 941
Employment ‐ Indirect Submarines (jobs, FTE)
1,886 384 1,501 1,548 1,595 1,644
Taxation revenue** ‐51 ‐124 73 28 ‐17 ‐61
* Average of two different scenarios for Australian industry participation in overseas build project ‐ 5% and 21%. ** Excluding taxes to fund submarine construction ‐ $Million Source: VUMRF modelling.
If substantial price premiums to support a domestic build are required, the economic impact of a domestic build vis‐
a‐vis an overseas build deteriorates markedly. Available data suggest that a negative impact might arise at price
premiums of less than 10 percent. This is due in part to the factors below:
the economic impact results presented above rest on the assumption that as Australian industry input to a
submarine built overseas rises the industry remains price competitive. To the degree this does not hold, the
results will overstate a positive economic impact;
Building Submarines in Australia – Aspects of Economic Impact ‐ May 2015 9 ______________________________________________________________________________________________
UNCLASSIFIED
9
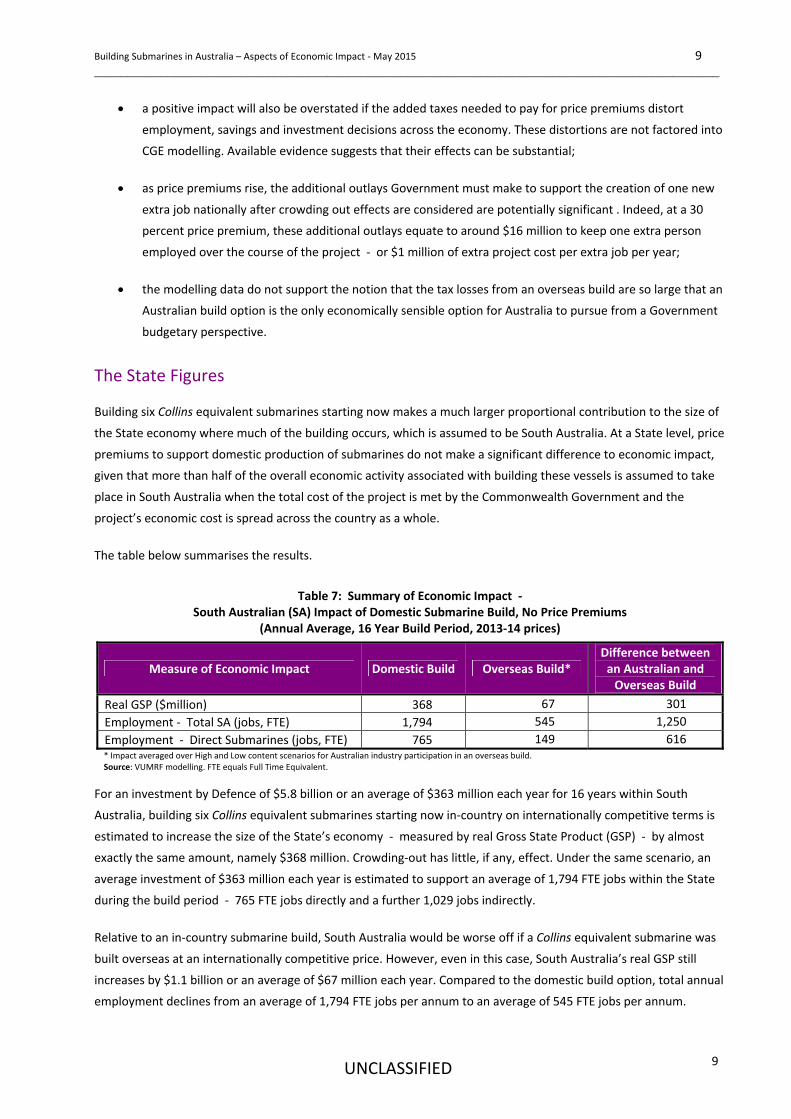
a positive impact will also be overstated if the added taxes needed to pay for price premiums distort
employment, savings and investment decisions across the economy. These distortions are not factored into
CGE modelling. Available evidence suggests that their effects can be substantial;
as price premiums rise, the additional outlays Government must make to support the creation of one new
extra job nationally after crowding out effects are considered are potentially significant . Indeed, at a 30
percent price premium, these additional outlays equate to around $16 million to keep one extra person
employed over the course of the project ‐ or $1 million of extra project cost per extra job per year;
the modelling data do not support the notion that the tax losses from an overseas build are so large that an
Australian build option is the only economically sensible option for Australia to pursue from a Government
budgetary perspective.
The State Figures
Building six Collins equivalent submarines starting now makes a much larger proportional contribution to the size of
the State economy where much of the building occurs, which is assumed to be South Australia. At a State level, price
premiums to support domestic production of submarines do not make a significant difference to economic impact,
given that more than half of the overall economic activity associated with building these vessels is assumed to take
place in South Australia when the total cost of the project is met by the Commonwealth Government and the
project’s economic cost is spread across the country as a whole.
The table below summarises the results.
Table 7: Summary of Economic Impact ‐
South Australian (SA) Impact of Domestic Submarine Build, No Price Premiums (Annual Average, 16 Year Build Period, 2013‐14 prices)
Measure of Economic Impact Domestic Build Overseas Build* Difference between an Australian and Overseas Build
Real GSP ($million) 368 67 301
Employment ‐ Total SA (jobs, FTE) 1,794 545 1,250
Employment ‐ Direct Submarines (jobs, FTE) 765 149 616 * Impact averaged over High and Low content scenarios for Australian industry participation in an overseas build. Source: VUMRF modelling. FTE equals Full Time Equivalent.
For an investment by Defence of $5.8 billion or an average of $363 million each year for 16 years within South
Australia, building six Collins equivalent submarines starting now in‐country on internationally competitive terms is
estimated to increase the size of the State’s economy ‐ measured by real Gross State Product (GSP) ‐ by almost
exactly the same amount, namely $368 million. Crowding‐out has little, if any, effect. Under the same scenario, an
average investment of $363 million each year is estimated to support an average of 1,794 FTE jobs within the State
during the build period ‐ 765 FTE jobs directly and a further 1,029 jobs indirectly.
Relative to an in‐country submarine build, South Australia would be worse off if a Collins equivalent submarine was
built overseas at an internationally competitive price. However, even in this case, South Australia’s real GSP still
increases by $1.1 billion or an average of $67 million each year. Compared to the domestic build option, total annual
employment declines from an average of 1,794 FTE jobs per annum to an average of 545 FTE jobs per annum.
Building Submarines in Australia – Aspects of Economic Impact ‐ May 2015 10 ______________________________________________________________________________________________
UNCLASSIFIED
10
Not surprisingly, provided no premium is paid, all indicators of impact are positive for South Australia if the nation
has the choice of a domestically built submarine or an overseas built submarine of equal cost and quality and selects
the former. In this situation, an Australian build would deliver a net boost to South Australia of $4.8 billion or an
average of $301 million per annum more in real State GSP compared to the alternative offshore build. The additional
average total employment generated from a domestic submarine build for South Australia compared to an overseas
build is estimated to be 1,250 FTE jobs.
However, when interpreting the results for South Australia, the following points should be kept in mind:
although South Australia will benefit from a domestic submarine build, national economic impact data
suggests that this only comes at the expense of economic activity in other parts of Australia ‐ especially
New South Wales and Victoria. Indeed, across the different build scenarios, the gains enjoyed by South
Australia are largely offset by losses in other jurisdictions as part of a national ‘zero sum game’;
a domestic submarine build is estimated to contribute less than 0.4 percent ‐ or four tenths of one percent
‐ to the size of South Australia’s economy even after the effects of an impending decline in the State’s
motor vehicle manufacturing industry are taken into account. The gains might in that sense be considered
marginal to the structural adjustment challenges faced by the State;
even if it follows the Collins example in terms of economic impact, building a new class of submarine in
Australia will commence well after a decline in South Australia’s motor vehicle manufacturing industry is
expected to begin in earnest. This suggests that the build is unlikely to offer employment opportunities for
much of the motor vehicle industry’s existing workforce;
depending on how a diminution in motor vehicle manufacturing unfolds in South Australia, a submarine
build might in the longer term help to offset ‐ in terms of job numbers ‐ no more than 20 percent of the
decline in motor vehicle industry employment within the State; and
a recent Productivity Commission report into the future of motor vehicle production describes defence
spending on projects ‐ like submarines ‐ as a potentially “costly and ineffective” way to facilitate
automotive industry workforce adjustment. According to the Commission, alternative policy instruments
for facilitating labour market adjustments are more economically efficient and equitable than diverting
large Defence capital equipment projects from a military‐strategic focus to an economic development role.
Regional Results
Considerable care should be taken when inferring from CGE modelling the impact of a submarine build on specific
regions and parts of Adelaide in particular, given the exposure of these areas to fluctuations in the size of defence,
motor vehicle and other industries.
Together, these fluctuations may have significant socio‐economic implications at a local or community level.
Estimating their effects is especially challenging from a technical perspective. This report attempts to make no more
than a partial contribution to the issue.
Nonetheless, available employment data suggest that even for those regions within Adelaide most affected by a
submarine build, including Port Adelaide Enfield, the project might at best make a contribution of 5 percent or less
Building Submarines in Australia – Aspects of Economic Impact ‐ May 2015 11 ______________________________________________________________________________________________
UNCLASSIFIED
11
to the local employment base. For the vast majority of regions within South Australia, the project seems capable of
doing little to ameliorate the effects on the long term size of regions of structural change in relation to State‐wide
motor vehicle and component production.
This is not to say that the regional effect of a submarine build is insignificant or without potentially important socio‐
economic benefits, especially where relatively high rates of regional unemployment prevail. DMO is acutely aware of
the hardships that can arise from industrial restructuring at a regional level and acknowledges that macroeconomic
modelling of the kind used in this report cannot fully capture these factors. However, the report does put some
perspective around the regional impact issue: a perspective which has thus far attracted limited public attention.
Spillovers
It is not clear on the historical and other evidence currently available that technology or workforce skills spillovers
associated specifically with submarines built in Australia are likely to be so large that they should, or could,
materially alter the outcome of economic impact modelling or decide the outcome of submarine sourcing decisions.
This report identifies and discusses eight issues which question the findings of a number of existing studies that the
spillover effects from a build of this kind might be especially large or significant:
the underlying mechanics behind the transfer and subsequent adoption of new knowledge generated by a
domestic submarine build have yet to be articulated clearly;
estimates of spillovers for a submarine build in Australia have relied heavily on a line of inference from
overseas fighter aircraft to domestic submarines rather than from overseas submarines to domestic
submarines:
overseas case study evidence of spillover effects for military aircraft manufacture in Sweden ‐ which are
sometimes used to infer the spillovers from an Australian submarine build ‐ rely on a industrial structure in
Sweden which appears more conducive to the diffusion of new knowledge than the industrial structure
likely to apply to a submarine build in Australia;
the submarine research and development expenditure base used in existing studies ‐ to which so‐called
spillover multipliers are applied to estimate a final spillover effect for a domestic submarine build ‐ appear
to be unusually large and so overstate any likely spillover effects;
these multipliers ultimately appear to be drawn from selected econometric studies on the relationship
between general research and development expenditure and economic growth in countries other than
Australia, and are not clearly supported by a broader range of econometric data dealing more specifically
with the defence expenditure‐economic growth relationship; and
current case study evidence, collected over recent years and dealing specifically with both the technology
and workforce spillover aspects of the Collins build project, does not provide clear or compelling evidence
of a significant overall spillover effect.
More generally, little evidence has emerged to suggest that the technology spillovers associated with building the
Collins submarines were larger than the spillovers generated by alternative forms of economic activity, including
Building Submarines in Australia – Aspects of Economic Impact ‐ May 2015 12 ______________________________________________________________________________________________
UNCLASSIFIED
12
activities crowded out as a result of the project. Nor does available evidence suggest that technology or skills
spillovers could only be introduced into Australia through a submarine build rather than another type of defence or
non‐defence project.
On balance, recent historical experience is consistent with the view that the new knowledge an Australian
submarine build would create may be significantly less than many expect by being: specific to submarines or the
defence sector; withheld from other parts of the economy for reasons of national security; held tightly by the
submarine builder or its suppliers to maximise their own commercial advantage; and, logistically difficult and costly
to transfer from the submarine builder and its suppliers to other companies, even where the Commonwealth owns
the intellectual property.
Available data suggest that, if the discount rate to reflect social opportunity cost is significant, the spillovers
extending from building submarines to sustaining submarines would need to be unusually large if even a small price
premium was paid to support a domestic build project.
It may, of course, be reasonable to assert that spillovers should form part of any cost‐benefit analysis of a defence
capital equipment project as large and technically complex as submarines before a decision on project sourcing is
made. And some spillovers will certainly emerge from such a large and complex project. However, based on the
Collins experience at least, the onus of proof in relation to any claim of substantial spillover effects should rest with
its proponents.
Implications
The overall findings of the report suggest that, if CGE modelling is used, building a Collins‐scale submarine fleet in‐
country would have limited economic benefits. By and large, various types of crowding out effects offset any direct
stimulus the project would bring to economic activity.
As a result, even when domestic supply is no more costly than overseas sourcing, the gains are small relative to the
size of the project, domestic defence industry, an impending motor vehicle manufacturing down turn, the Australian
manufacturing sector and both national and State economies.
If a domestic build involves greater cost or risk, then the economy as a whole could be made worse off by the
domestic sourcing option. This result holds even without considering the distorting effect of the additional taxes
required to pay for any price premium and applies even for relatively small price premiums.
Leaving aside regional impact issues and keeping in mind CGE modelling is likely to yield conservative estimates of
economic impact., the findings of the report do not support the view that a domestic submarine build will yield
economic benefits so large that they justify Defence purchasing more submarines at a higher cost or capability than
Australia’s minimum military‐strategic needs dictate.
To that extent, the results do not suggest that issues of economic impact should override or overshadow military‐
strategic considerations when submarine sourcing decisions are made. Such considerations do not discount the
possibility that, within reasonable limits, a price premium to secure the domestic production of submarines might be
justified to secure an appropriate submarine design, ensure satisfactory submarine sustainment or safeguard
sensitive submarine technologies.
Building Submarines in Australia – Aspects of Economic Impact ‐ May 2015 13 ______________________________________________________________________________________________
UNCLASSIFIED
13
Subject to the qualification that more work may need to be done on potentially important aspects of the submarine
economic impact ‘equation’ including their regional socio‐economic effects and the relationship between build
location and sustainment costs, the results from the report imply that rather than focus on what a new class of
submarine might do to address the economic challenges faced by Australia more broadly and by South Australia in
particular, the question of whether to build submarines in Australia should concentrate primarily on:
which shipyards around the world have the capacity to design and build the types of submarines Australia
considers essential for military operations and to do so in a way consistent with value for money
considerations;
whether a foreign build can access and safeguard the submarine technologies Australia requires; and
whether a foreign build allows for appropriate measures to be put in place to assist with domestic
submarine sustainment, by ensuring that sustainment requirements are factored into any overseas design
of a new submarine and the relevant intellectual property associated with that design and any subsequent
overseas submarine production can be made available to Australia.
Building Submarines in Australia – Aspects of Economic Impact ‐ May 2015 14 ______________________________________________________________________________________________
UNCLASSIFIED
14
THE POLICY CONTEXT
From an economic impact perspective, six questions in relation to building submarines have recently dominated
public discussion. These questions provide the focal points for this report. The background to each issue is provided
below:
1. Does the measurement of economic impact of a domestic submarine build differ markedly depending on the type of economic model used? In particular, do estimates of impact vary substantially according to whether an input‐output (I‐O) approach to modelling or a computable general equilibrium (CGE) approach to modelling is adopted?
The most recent estimates of economic impact for a new class of submarine, sponsored by the South
Australian Government and undertaken by the National Institute of Economic and Industry Research
(NIEIR), rely heavily on an I‐O approach to analysis.1
The NIEIR study found that building a submarine in Australia had a negative economic impact. Nonetheless,
a domestic build was considered beneficial on the basis that overseas construction of the vessels was
estimated to deliver for Australia an even worse economic outcome.
In essence, I‐O analysis examines how much economic activity is generated directly within the company
building submarines and indirectly across the company’s extended supply chain, in a situation where the
resources ‐ land, labour and capital ‐ required for a build are freely available. It assumes that there are no
costs associated with ‘ramping up’ production to tackle a project as complex as submarine construction.
And it assumes that, if the project did not proceed, the resources it would have used will lie idle.
CGE analysis removes the assumptions of unlimited resource availability and resources not finding
alternative uses. It begins by recognising that the economic stimulus associated with building submarines
might be offset by lower levels of economic activity elsewhere, as the vessels must ultimately be paid for by
reduced Government spending in other areas ‐ possibly on other types of defence projects ‐ or higher
taxes.
CGE modelling is based on the premises that: the Australian resources dedicated to a submarine build might
be put to productive use elsewhere in the long run, if the project was to be scaled back or undertaken in an
overseas shipyard; and, the skilled labour and other resources needed to build an item as complex as a
submarine might be in short supply, even in a situation where a degree of general unemployment exists.
Together, these effects are covered under the economic rubric of ‘crowding out’.
The primary purpose of this report is to provide a CGE perspective on the economic effects of a submarine
built albeit one which relies a slightly different project scope, costing database and time period than NIEIR.
1 Economic Development Board South Australia, Economic Analysis of Australia’s Future Submarine Program, Adelaide, October 2014,
http:www.economicdevelopmentboardsa.com.au.
Building Submarines in Australia – Aspects of Economic Impact ‐ May 2015 15 ______________________________________________________________________________________________
UNCLASSIFIED
15
2. To what degree would the jobs created by building a submarine in‐country offset an anticipated decline in employment in motor vehicle manufacturing especially in South Australia, keeping in mind that Australia does not currently build submarines and consequently the jobs a build would create represent new employment rather than a solution to current or prospective submarine job losses?
The severity of the impending vehicle manufacturing down turn in South Australia and other parts of the
country is not in question. But surprisingly little quantitative evidence has been provided to help establish
the degree to which a domestic submarine build might offset, in purely numerical terms, a much earlier
reduction in the size of the South Australian economy resulting from structural adjustment in its vehicle
manufacturing industry.
In the absence of at least some data, claims reported in the media in relation to a potential offsetting effect
are difficult to assess. By quantifying the economic dimensions of a submarine build and then comparing
these against the expected size of a vehicle industry downturn, this report attempts to place some
parameters around the issue.
3. What would be the economic impact if a submarine was built in Australia but at a price materially higher than the price of vessels of the same size, capability, quality and scheduled availability produced abroad?
A number of claims have been made in the public arena that, in future, Australia will be able to produce
submarines as competitively as any shipyard around the world. The line of argument used is that a new
submarine must be built to a new design with which no shipyard around the world will be familiar and that
the foreign shipyards most likely to be contenders for the project ‐ in Japan, France and Germany ‐ are all
‘high cost’ countries.
However, the fact that Australia has not built a submarine for many years when a number of other
countries have been actively engaged in production for themselves as well as export customers suggests
that the presumption of Australia’s international competitiveness remains for now at least an open
question.
It raises the possibility that an overseas builder might enjoy higher productivity ‐ and be able to offer lower
prices ‐ than an Australian‐based company, in a situation where Australia has not built a submarine for
many years and may be limited in future to a relatively small volume of production.
Conceptually, a productivity and price advantage might apply where: the overseas builder is able to exploit
economies of scale and scope in meeting an Australian order for submarines, by drawing on current or
expected orders from its own country and perhaps third parties; and, the overseas builder, by virtue of the
more continuous demand generated from a more diverse customer base, is better placed to avoid
significant project ramp‐up and ramp‐down costs and retain the advantages of ‘learning by doing’.
The recent exclusion of Sweden from bidding for Australia’s next generation of submarines, on the grounds
that Swedish shipyards have not fully designed, constructed and successfully set to work submarines for
some time, illustrates the point.
Building Submarines in Australia – Aspects of Economic Impact ‐ May 2015 16 ______________________________________________________________________________________________
UNCLASSIFIED
16
This emphasises the importance to Australia when purchasing a new class of submarine of being reasonably
certain of the ultimate price of the vessels and their ability to be reliably deployed for military operations.
A clear and current ability to completely plan and build ‐ rather than simply refurbish or modify ‐ a
submarine to a new design and to demonstrably high levels of operational readiness and reliability have
emerged as essential criteria for submarine supplier selection. This recognises, perhaps above all else, the
importance of managing closely the technical and other forms of risk in relation to a project as strategically
important, technically complex and expensive as a new submarine build.
Of all the factors with the potential to influence the economic dimensions of decisions in relation to where
a new submarine should be built and in what quantities, the potential premium in cost and risk associated
with a domestic build is perhaps the most important.
The issue is linked in part to a subject which has attracted less public attention than it deserves namely the
possibility that, even if the initial bid price of a submarine built in Australia appears reasonable, cost
overruns after a build contract has been signed and work commences could deliver a price premium by
’indirect’ ‐ but by no means potentially inconsequential ‐ means.
Few if any public commentators have offered a solution to the potential problem of cost overruns, when
complex weapons system production around the world is widely acknowledged as prone to unplanned or
unexpected increases in cost.
And very little public recognition has been given to the fact that after contracts for major defence capital
equipment projects like a submarine build are signed the bargaining power or ‘commercial leverage’ in any
contractual relationship all too readily shifts from Government to industry. This occurs for the simple
reason that it can be extremely costly for Government to cancel the contract and start again with a new
builder should the performance of its original supplier prove problematic.
It is difficult for Government to overcome the problem of poor contractor performance on a project like a
submarine build through regulating the profits and costs of its suppliers. That is, it is difficult to try and
force an inefficient supplier to become efficient.
Effective regulation requires greater information about efficient industry costs than a regulator like Defence
would typically hold and must ultimately be backed by credible threats of withholding payment. The latter
is difficult to do with contracts that are vital to national security and might contribute substantially to
regional employment.
Where suppliers within Australia can threaten local job losses should demands for price rises be refused, it
may be more difficult for governments to insist on holding to the initial contract terms. In contrast, when
equipment is sourced overseas, it can be easier for Australian governments to insist on the supplier bearing
any losses.
The issue of price premiums is sometimes linked to the argument that such premiums might be avoided if
Australia moves from a batch to a continuous build program for naval shipbuilding. A common perception is
that a continuous build allows industry to avoid the sometimes high costs of decreasing and then increasing
Building Submarines in Australia – Aspects of Economic Impact ‐ May 2015 17 ______________________________________________________________________________________________
UNCLASSIFIED
17
its build capacity in response to fluctuating Defence demand and, in doing so, substantially removes the
prospect of a price premium being paid.
However, this overlooks the possibility that some continuous builds ‐ especially those for small fleets ‐
might only be possible by retiring existing and/or newly constructed vessels before the end of their
available operating lives. Early retirement makes way for the kind of new construction which keeps the
shipbuilding workforce gainfully employed and provides scope for increases in shipbuilding productivity.
But any accelerated retirement of otherwise usable capability, if it was to occur, also represents a cost. It
amounts to a price premium borne for the sake of ensuring continuity of production. Where the production
of new vessels must occur at relatively short intervals to support a continuous build program and fleet sizes
are small, this price premium could be significant.
Finally, it needs to be kept in mind that the rise in industrial productivity needed to offset the effects of a
price premium may be larger than first impressions suggest if productivity improvements are restricted to
only a portion of the inputs a build requires.
For example, were there little scope for improvements in the productivity of land, materials and capital, the
burden of offsetting a premium on the overall price of a submarine would fall on labour. Given that labour
tends to account for a minority of the overall cost of the submarine, the percentage increase in labour
productivity required to offset the effects of any given price premium would need to be substantially higher
than the proportionate price premium itself. If the existing industrial relations framework applying to a
domestic submarine build largely matches the framework in place in comparable Australian industries, the
task of achieving such high levels of (labour) productivity improvement may be more difficult to achieve
than initial impressions suggest.
With these points as background, proponents of a domestic submarine build have to this point been
reluctant to acknowledge the possibility of a premium let alone attempt to quantify its possible economic
effects ‐ even in the realm of the hypothetical.
This report makes no assertions as to whether a premium might emerge in future or at what level. Only
time will tell if premiums will emerge. If a number of public commentators are to be believed, the prospect
of a premium is slim. Instead, the report simply tests how sensitive estimates of economic impact are to any
potential price premium, under a number of purely hypothetical price scenarios.
4. What is the likely economic impact if a submarine is designed and essentially built overseas but Australian industry contributes to its construction, not only by undertaking tasks required to be conducted in‐country for logistical or national security reasons but others which the industry has the technical ‐ and perhaps economic ‐ capacity to provide?
In late 2014, a study prepared by Raytheon Australia canvassed a number of options in relation to
Australian industry participation in an overseas submarine build. The study sought to explore a ‘middle
ground’ between relying on overseas expertise ‐ to minimise the technical, and associated financial, risks
of a submarine project ‐ and allowing Australian‐based companies to benefit from a build project.2
2 See Raytheon Australia, SEA 1000 ‐ A Hybrid Build Precis, Canberra, September 2014.
Building Submarines in Australia – Aspects of Economic Impact ‐ May 2015 18 ______________________________________________________________________________________________
UNCLASSIFIED
18
The Raytheon study identified a number of tasks through which Australian defence manufacturers might
provide project support, in a situation where Australia was (hypothetically) required to rely on a submarine
designed overseas and mostly constructed in a foreign shipyard. A number of these tasks appear substantial
in economic terms.
In theory at least, the Raytheon study raises the possibility that the design and production phases of a
submarine build might be so tightly connected in engineering terms that to separate the two ‐ by splitting
them between different countries ‐ could be uneconomic. In a situation where Australia is arguably least
well equipped to tackle the design aspects of the project, a tight design‐production nexus suggests that
there could be circumstances in which the bulk of both tasks may best be done in one location overseas.
If all of this is correct, one of the most important aspects of an economic impact evaluation involves the
following question: to what degree might Australian input to a submarine produced mainly abroad narrow
the difference in economic effects between an essentially Australian and overseas build. In short, to what
degree might Australian industry participation in an overseas build help to offset the broader domestic
economic effects from a project being assigned to an overseas prime contractor.
The answer hinges on first estimating what kinds of levels of participation might realistically be expected for
Australian industry in an overseas build and then understanding the avenues through which this affects the
size and structure of the Australian economy.
In a situation where crowding out will apply, it is possible that any attempt to maximise Australian industry
participation in an overseas build will have a smaller positive economic impact than participation rates
alone suggest. This would especially be the case if higher Australian industry participation rates involved
goods and services which were not competitively priced. In this case, price premiums for the submarines
would be driven up and efficient domestic resource allocation distorted.
This report examines these issues under a number of different scenarios relating to levels of Australian
industry content if a submarine was constructed abroad.
5. Would a submarine built overseas deprive the Australian Government of much of the tax revenue it would have received had the vessels been constructed in Australia?
Much public debate on whether a new class of submarines should be built in Australia has been taken up by
claims from Australian Business Limited and others in relation to a domestic build’s tax advantages relative
to an overseas supply solution. The concern is this case is that tax effects might substantially disadvantage
Government from a budgetary perspective.
Based in large part on economic research sponsored by the Royal United Services Institute (RUSI) in the
United Kingdom, which did not rely on a CGE modelling framework, claims have been made that if the
vessels are built in Australia Government would recoup a substantial proportion of their costs through the
taxation system.3
However, proponents of a local build go on to assert that Government would lose substantial amounts of
tax revenue ‐ and therefore pay substantially more in net budgetary terms for new submarines ‐ if the
3 Taylor T. and Louth J., The Destinations of the Defence Pound, Briefing Paper, Royal United Services Institute, London, 2012.
Building Submarines in Australia – Aspects of Economic Impact ‐ May 2015 19 ______________________________________________________________________________________________
UNCLASSIFIED
19
vessels were produced overseas. The resultant tax advantages are sometimes held to outweigh the impact
on the Government’s budget of any price premium Australia might pay for favouring domestic over foreign
submarine production.
However, this position overlooks how tax revenues are affected should the submarines be built overseas. In
particular, it overlooks the possibility that over time the Australian resources which would have gone into
their domestic production might have been put to productive use in other areas of the Australian economy
‐ where they pay taxes.
This paper attempts to determine whether the very large differences in tax revenue between a domestic
and overseas submarine build claimed by supporters of work by RUSI still hold in a CGE modelling context.
6. Could any new knowledge in the form of technologies and workforce skills associated with building submarines in Australia ‘spillover’ to promote substantial growth through productivity improvement across the economy?
Again, a great deal of public attention has been directed to the notion that building a submarine in Australia
will create and then disseminate ‐ at little or no cost ‐ new technologies and skills which ‘spillover’ to
improve productivity and help create substantial, new industries in other areas of the economy. Claims of
this kind by the South Australian Government and others have drawn heavily on research by Professor
Gunnar Eliasson.
There is little doubt that a project like a submarine will have some, positive spillover effects. However,
claims that these spillovers are especially high rely on historical experience from either overseas and/or
Australian projects other than submarine production ‐ in a situation where the effects are widely
acknowledged as being sensitive to individual circumstances.
Surprisingly little attention to been given to the issue of how far extrapolations based on experience outside
the submarine arena, and even outside Australia, can be used to infer how the spillover effects from a new
class of submarines purchased by Australia might evolve.
This report reviews existing spillovers data and adds new information ‐ partly from Australia’s Collins
experience ‐ to provide a broader perspective.
Building Submarines in Australia – Aspects of Economic Impact ‐ May 2015 20 ______________________________________________________________________________________________
UNCLASSIFIED
20
MEASURING ECONOMIC IMPACT
Measuring the economic impact of a large Defence capital equipment project like building submarines is
underpinned by a number of concepts in relation to how the project ‘moves through’ the economy and what
happens along the way.
Economic Contribution
The simplest way to examine what occurs is to begin with the activities of the builder itself. Once a contract for a
submarine is signed with Defence, economic activity rises as the builder increases its production by drawing on its
own resources of land, labour and capital.
However, to complete the submarines, the builder must also access inputs from external domestic suppliers of
materials ‐ like steel ‐ finished components ‐ like pumps ‐ and consumables like energy. It must also rely on
domestic sub‐contractors offering specialist engineering, business support and other services. These suppliers will
rely in turn on other Australian‐based companies to provide some of what they require.
This process continues until all of the inputs needed to build the submarine are obtained. Economic activity within
Australia is generated at each step along the way, noting that not everything required to build a submarine can be
sourced from Australian‐based suppliers and must therefore be imported.
At the same time, those who are employed by the submarine builder as well as those in its (extended) domestic
supply chain earn income which is spent on a range of goods and services unrelated to submarines including items
produced domestically. These might include consumer goods ‐ like food or furniture. This expenditure contributes
in its own right to activity somewhere else in the economy until eventually its effect dissipates as some of the money
involved is saved, taxed or spent on imports.
The economic contribution of the submarine build described above is measured using the so‐called Input‐Output (I‐
0) model. ‘Multipliers’ derived from an I‐O model provide a metric for gauging the length and depth of supply chains.
Broadly, these multipliers trace the cascading impact of a dollar outlay as the income it generates percolates
through the economy. Multipliers indicate not only how a specified amount of money invested by Defence in a
project is divided between the different areas of industry which contribute to that project but how broader
consumption is affected. The different elements which contribute to the multipliers used in this report are described
in Attachment A.
The economic impact model of submarine acquisition and sustainment commissioned recently by the South
Australian Government and undertaken by the National Institute of Economic and Industry Economics (NIEIR) is
based predominantly on an I‐O methodology.4
4 Economic Development Board South Australia, Economic Analysis of Australia’s Future Submarine Program, op. cit..
Building Submarines in Australia – Aspects of Economic Impact ‐ May 2015 21 ______________________________________________________________________________________________
UNCLASSIFIED
21
Crowding Out
(a) Overview
Approaching the estimation of economic impact by looking solely at how expenditure on a submarine build ‘trickles’
from one level of the economy to another ignores the fact that:
higher taxes or lower levels of other Government expenditure are ultimately needed to finance the project
and will reduce levels of economic activity in other parts of the economy;
at least some of the resources devoted to a project might ‐ in the longer term at least ‐ be employed in
other industries should the project not go ahead or at least not go ahead within Australia;
a large project might place upward pressure on resource costs ‐ like skilled labour ‐ that are in short
supply. By raising industry costs, this kind of pressure has the potential to adversely affect other parts of
the economy including those which export their goods or face import competition; and
as activity levels change in different parts of the economy in response to a project, prices may change with
them, causing resources to be reallocated between competing uses.5
All of these factors are covered by the concept of crowding out which is described in more detail in Attachment B
and quantified using computable general equilibrium (CGE) models. The differences between CGE and I‐O models
are considered in more detail in Attachment C. CGE models tend to provide a conservative estimate of economic
impact.
(b) The Labour Market Dimension
A CGE approach to economic impact modelling assumes that labour is reasonably ‘mobile’ in the long run, by being
able to shift between different jobs and job locations, and that the labour market adjusts wages in response to
changing market conditions to move the economy close to full employment.6
In a submarine context, this approach to labour market adjustment does not necessarily mean that any worker
‘displaced’ as a result of a submarine build not proceeding ‐ or at least not proceeding in Australia ‐ will necessary
find employment elsewhere, in the short term at least. Nor does it mean that every ‘displaced’ person who does find
5 This could be mitigated to some degree if the project relies on material, component or other inputs sourced from overseas. As imports needed
to build the submarine rise, the real exchange rate depreciates. This assists traditional export and import‐competing sectors.
6 For example, any increase in employment arising from the construction of submarines might in the short run lead to increased employment, but
in the long run lead to a higher real wage rate which reduces the incentive generally for producers to employ. Employment is demand determined, with supply adjusting to match demand at the going real wage rate. This is a medium to long‐run assumption, made in nearly all economic forecasts of the labour market. Initially there are employment gains at the national level, but over time real wage adjustment steadily eliminates the short‐term gains. In the long run, the benefits of the submarine project in the national labour market accrue as an increase in the real wage rate, rather than as a change in employment. Note that in terms of simple add ups of the annual changes in employment there is a positive gain, due to the short to medium term increases.
Building Submarines in Australia – Aspects of Economic Impact ‐ May 2015 22 ______________________________________________________________________________________________
UNCLASSIFIED
22
alternative work will necessarily secure another job offering remuneration or career opportunities comparable to
those submarine construction might have provided.7
Instead, the approach emphasises two points:
few people may have the skills and experience necessary to transition readily, if at all, into something as
complex and demanding as a submarine build, even in areas with higher than average unemployment; and
the people that do have the requisite qualifications and experience may be better placed than many others
to secure jobs in other areas of the economy should the need arise to maintain or seek alternative forms of
employment.8
(c) The Geographic Dimension
The different facets of economic contribution and crowding out and how they are modelled mean that the economic
impact of a domestic submarine build is difficult to predict a priori. That is, until all relevant data are collected and a
CGE economic impact model is run, it is difficult to predict an outcome.
However, one point is reasonably clear: the economic impact of building a submarine in Australia could vary
substantially depending on whether national, state or regional areas are being considered. As the geographic
boundaries over which economic impact is measured expand, so to do the possibilities for a submarine build to
displace other types of economic activity through crowding out. This means that some regions will benefit and
expand, probably at the expense of others.
An Overseas Buy
The points above focus on building a submarine in Australia. From an economic point of view, an overseas build
differs from an Australian build in two respects.
One is the degree of Australian content. An overseas build will have a smaller Australian content than an Australian
build. The other is the location and ownership of the builder(s) and its influence on tax and company dividends.
Foreign‐owned firms disburse their after‐tax profit to overseas owners. Domestic‐firms disburse the majority of their
after‐tax profit to Australian owners.
In reality, of course, some (potentially large) part of Australian production would be undertaken by foreign owned
firms, so not all the profits from domestic construction would accrue to Australian shareholders. Nonetheless, it is
reasonable to assume that domestic shareholders obtain a higher share of the profits from domestic construction
than they would from construction overseas.
7 The word ‘displaced’ refers in this case to the fact Australia does not currently build submarines and that consequently, if a domestic build did not proceed, it would not result in submarine workers losing their existing jobs but those wishing to be involved in the project (whether employed elsewhere or unemployed) not be able to participate in submarine build tasks. 8 The issue of scarcity of resources in a Defence capital equipment context, especially skilled labour, is not a new issue. It was investigated in
some detail in Industry Commission, Defence Procurement, Report No. 41, Canberra, 30 August 1994, p. 266. The Commission held the view that such scarcity was a legitimate concern ‐ see p. 131.
Building Submarines in Australia – Aspects of Economic Impact ‐ May 2015 23 ______________________________________________________________________________________________
UNCLASSIFIED
23
It follows that relative to an Australian build, an overseas build directly uses less Australian‐produced products,
requires more foreign made inputs and yields less dividend income for Australian consumption and less in tax
payments to Australian governments.9
However, there are two additional aspects of an overseas build which are also important to note. Firstly, all of this
assumes that the overseas build and Australian build cost the same. In other words, there is no ‘price premium’
associated with an Australian build in the sense of Australia paying more to build a submarine in‐country than it
would to obtain a vessel of equivalent capability and availability from a foreign supplier. For the purpose of this
report, a price premium is defined as the difference between the price of a submarine built in Australia and the price
of a submarine built overseas, expressed as a proportion of the price of a submarine built in Australia.
From an economic impact perspective, a price premium represents ‘wasted’ expenditure. Waste is spending above
opportunity cost and represents a real cost to the economy that directly lowers real Gross Domestic Product (GDP)
which measures the value of the economy’s overall productive output. The cost could be in the form of resources
inputs ‐ labour, capital and materials ‐ used inefficiently and/or profits that are larger than normal. Either way,
the waste is a form of productivity decline when productivity growth is the desired outcome.
Secondly, due to crowding out effects, it is possible that a given increase in the level of Australian industry
participation in an overseas build might result in a disproportionately small economic impact.
A relatively small increase in impact from a seemingly large rise in Australian industry participation is possible where
constraints on the supply of some key inputs apply: labour of certain occupation types, being one example. As the
Australian content on an overseas build rises, so does demand for resources used to produce that content. And as
demand rises for inputs in restricted supply, their price will rise. These price rises can translate into additional costs
for all industries using those inputs. For industries that cannot pass on those cost increases (e.g. industries that
produce traditional exports in agriculture and mining) increased cost leads to reduced competitiveness and hence to
reduced production.
Intensity of Impact
Bringing these points together, there are four principal ‘avenues’ through which the domestic production of a major
item of defence capital equipment like a submarine might generate a strong, positive economic impact that CGE
modelling techniques will capture. These are, if the activities carried out in Australia or ‘crowded‐in’:
have higher value‐added per dollar of output ‐ or levels of productivity ‐ than industries which have
declined in size as a result of crowding out;
rely to a lesser degree than these industries on labour and other resources in short supply;
create jobs for the long term unemployed; and
deliver submarines at cheaper prices than those from foreign shipyards.
9 But not everything is negative. In requiring more imports, an overseas build will put downward pressure on the exchange rate. A lower
exchange rate, all else being equal, improves the competitiveness of export‐oriented industries on overseas markets and import‐competing industries on local markets. This leads to increased production for Australia’s traded goods sector.
Building Submarines in Australia – Aspects of Economic Impact ‐ May 2015 24 ______________________________________________________________________________________________
UNCLASSIFIED
24
In addition, a domestic submarine build might distinguish itself from an economic impact perspective if it can offer
so‐called spillovers. These are the fruits of investment in new technologies or labour skilling in a project which flow
to those outside the project, at a charge which is less than the value of the benefits they deliver to others. Spillover
effects are not normally included in CGE modelling or the multipliers on which such modelling relies, and must
therefore be estimated as a separate exercise.
It is important to note the inherent inconsistencies or tensions which exist between some of these potential
contributors to impact. Perhaps the most obvious is that the long term unemployed may be among the least well
equipped people to deliver the productivity and spillovers on which a strong, positive economic impact may depend.
And, as already noted, the long term unemployed may be among the least well positioned to fill job vacancies for a
project as technically demanding as a submarine build.
Conversely, building a new class of submarine within Australia is likely to have a weaker and perhaps even negative
economic impact if the activities crowded in have:
lower value‐added per dollar of output than the activities crowded out;
a heavy reliance on specialised labour skills in short supply;
a reliance on substantial levels of Government assistance in the form of price premiums to secure orders
against foreign ship builders; and
limited spillover effects.
Some Constraining Factors
Expanding on some of these issues, there are three factors working against a submarine build making a strong
positive contribution to the Australian economy at a national level at least.
The first is that the submarines do not generate income or ‘wealth’ in the same way as commercial products, due to
their restricted end use. In essence, submarines contribute instead to the ‘public good’ of national defence.
Assuming the public good is being supplied to the levels demanded by the community, submarines enhance the
efficiency of that supply if the cost of achieving the same level of defence without submarines is greater than the
cost of doing so with them. Even so, the supply of public goods comes at some cost in terms of the supply of private
goods.
The second factor is that, if a submarine is taxpayer funded, imposing additional taxes to pay for the vessels can
distort economic efficiency in a way which is not commonly appreciated or typically captured in CGE models. Taxes
can distort investment decisions across the economy by driving a wedge between market valuations ‐ which are
reflected in pre‐tax prices and incomes ‐ and the after‐tax prices and incomes faced by private decision‐makers. As
the extent of that wedge differs across activities, it can prevent resources from being allocated to their most highly
valued uses.
The outcome is an excess burden or deadweight loss, which is conventionally measured as the difference between
the loss taxpayers incur as a result of the tax and the revenue the government receives. As that loss can be material,
the economic cost to Australia of a tax to pay for submarines may be higher than the nominal value of the tax itself ‐
Building Submarines in Australia – Aspects of Economic Impact ‐ May 2015 25 ______________________________________________________________________________________________
UNCLASSIFIED
25
perhaps substantially so. Attachment D provides more background on the tax issue in the context of recent work by
the Royal United Services Institute in the United Kingdom.10
The third factor which may create a tendency for building submarines to dampen the project’s contribution to
Australia’s economic prospects occurs where a price premium is paid and domestic production of the submarines
consequently relies on Government assistance to industry.
Industry assistance is often considered inimical to efficient resource allocation, by allowing its recipients to ‘hoard’
resources which might have been used more productively in unassisted ‐ and therefore more economically efficient
‐ parts of the economy. This can be harmful to long term growth in industry productivity, by removing or at least
reducing the incentive for assisted companies to strive for improvement through innovation and general cost
consciousness. Over the longer term, assistance can contribute to the creation of ‘infant’ industries which may
never move from a dependence on Government support.
Applied to submarines, industry assistance raises the possibility of Defence having to pay more for these vessels not
once but on a continual basis ‐ perhaps in larger and larger amounts ‐ unless controlled by an effective form of
industry price regulation which can be unusually difficult for Defence to devise and apply. It also raises the
unwelcome possibility of Government assistance for domestic submarine production setting a precedent for
assistance to other areas of defence industry and perhaps even commercial areas of the economy.11
10 See Findlay C. and Jones R., “The Marginal Cost of Australian Income Taxation”, Economic Record, 1982, 58, pp. 253‐262. Findlay and Jones
(1982) derive an estimate of between $1.23 and $1.65 for the social marginal costs of public funds (MCF) for Australia. That is, to be economically justified, the last dollar of government spending should create an economic return of at least 23 percent and perhaps as high as 65 per cent. The marginal deadweight loss (MDWL) of a tax is calculated as the incremental cost of raising a particular tax divided by the incremental change in revenue. The MCF is simply one plus the MDWL. For a recent discussion of the effects of tax distortion and other resource allocation issues relating to defence capital equipment expenditure in the United States see Zycher B.M., “Economic Effects of Reductions in Defense Outlays”, Policy Analysis No. 706, Cato Institute Washington D.C., 8 August 2012. Zycher assesses the excess burden that extra tax needed to pay for defence capital equipment imposes upon the economy, in the form of distortions that reduce aggregate output, at a minimum of 35%. 11 Viewed from a purely Defence perspective, paying a higher price to support domestic equipment manufacture might mean that the
Department can purchase less with a given budget ‐ and the Australian Defence Force (ADF) must sacrifice capability as a result. If so, Defence should pay a price premium for submarines primarily for two reasons: where the difference in price between a domestic and overseas source of equipment is offset by the lower in‐country equipment sustainment costs a domestic build might facilitate; or, where such a build supports Australian industry capabilities which cannot be obtained from overseas and are of such high military‐strategic value to the operational
Building Submarines in Australia – Aspects of Economic Impact ‐ May 2015 26 ______________________________________________________________________________________________
UNCLASSIFIED
26
THE MODELLING STRATEGY
A Collins Focus
Planning for the Future Submarine Program is still in its formative stages. Consequently, it is difficult to obtain the
data needed to assess all aspects of the economic impact of a new domestic submarine project. Indeed, important
pieces of information have still to be generated to complete an overall cost‐benefit analysis of investing in a new
submarine capability. This information might not be available until potential suppliers have submitted to
Government more detail on the submarines they have to offer, expected towards the end of 2015.
Consequently, from an economic impact perspective, it is difficult to be certain at this stage about three key issues:
the differences in cost between a new class of submarine sourced from Australia and a new class sourced
from overseas;
the degree to which a domestic build might help to minimise domestic sustainment costs, noting that there
are several avenues through which these costs might be contained if the vessels were to be built overseas;
and
the degree to which any rise in sustainment activity in Australia associated with a potential increase in the
size of a new submarine fleet might compare to the employment involved in the fleet’s production.
Nonetheless, sufficient data are available to explore economic impact under a narrower and hypothetical but still
useful scenario: building six Collins class submarines at their current level of capability, commencing now and
following a build strategy similar to that applying when the vessels were first produced. Unlike a Future Submarine,
sufficient cost data are available for the Collins vessels to model the economic impact of a similar type of project in
some detail.
Very little economic modelling has been conducted covering the Collins submarines deployed currently by the Royal
Australian Navy, despite their production being one of Australia’s largest infrastructure projects. While the Industry
Commission (IC) examined the issue in 1994, this was during the early stages of the Collins project. Since then more
complete cost information and improved economic modelling techniques have emerged. Although of some
relevance, economic impact data for a range of Australian naval surface ships can be difficult to interpret and may
not necessarily translate to a submarine environment.
The VUMRF Model
The report uses Collins cost data as input to the Victoria University Multi‐Regional Forecasting (VUMRF) model. The
VUMRF model is a CGE model. It is used here to estimate the economic impacts of submarine production by
providing a detailed view not only of the Australian economy but also the economy of South Australia ‐ the
geographic epicentre of the Collins project and the assumed site for most of any future domestic submarine build. 12
12 For a description of the VUMRF CGE model used in this report see Adams P., MMRF: Monash Multi‐Regional Forecasting Model: A Dynamic
Multi‐Regional Applied General Equilibrium Model of the Australian Economy, Monash University, Centre of Policy Studies, 2008 and Monash University, Koopman R. and Rimmer M., “The MONASH Style Computable General Equilibrium Modelling: A Framework for Practical Policy Analysis” in Dixon, P. and Jorgenson, D., Handbook of Computable General Equilibrium Modelling, Elsevier, Amsterdam, 2013.
Building Submarines in Australia – Aspects of Economic Impact ‐ May 2015 27 ______________________________________________________________________________________________
UNCLASSIFIED
27
The VUMRF model has a framework well suited to industry level economic analysis and an assessment of the tax
effects of large infrastructure projects. It has been used widely in policy analysis including recent work by the
Commonwealth Treasury on climate change and research by the Productivity Commission into the future of the
Australian motor vehicle industry. VUMRF has been the subject of extensive public and peer review.
Coverage and Caveats
The results presented in the report are subject to a number of important caveats:
economic impact modelling constitutes only one part of the cost‐benefit framework on which decisions in
relation to submarine source selection should be made;13
CGE modelling is not the only approach which might cast light on the economic effects of submarine
building;
no economic model used to estimate impact can capture fully the structure of the Australian economy ‐
CGE models are not designed specifically to deal with the regional socio‐economic effects of industrial
decline;
the information presented in the report is preliminary in the sense that improved data and more refined
modelling techniques might be available in future and the precise nature of the submarine procurement
options open to Australia in the period ahead are difficult to determine at this stage;
the Collins experience is in some respects unique and therefore unlikely to mirror the nature of a new class
of submarines in all respects;
as a predictor of what might occur in future, the results from the report may be influenced in part by how
other naval shipbuilding projects evolve including those for surface combatants;
the submarine cost data used have been prepared solely for the purpose of estimating Collins‐related
economic impact and may not be suitable as a basis for estimating the cost of a Future Submarine;
there is no clear or universal view in relation to the discount rates that might be used convert some
elements of economic impact to their present value, should the need for discounting arise;
at this stage, it has not been possible to estimate the savings in submarine sustainment within Australia
that might arise if the vessels are built domestically rather than overseas;
the report does not purport to deal with broader issues around defence industry and manufacturing
industry development including recent public debate in relation to theories of ‘economic complexity’.
Although relevant to the economic impact of a submarine build, such matters are left to industry policy
makers and may be addressed in the forthcoming Defence White Paper and Defence Industry Policy
Statement; and
13 A range of military‐strategic and other issues may also be important factors in source selection decisions. One such issue is the potential importance of building a submarine in‐country for reasons of national sovereignty including issues like protecting technologies Australia considers sensitive. Currently, industry capabilities considered important for Australia to retain in‐country for military‐strategic reasons are covered through the Defence Priority Industry Capabilities (PIC) program. Naval shipbuilding in its entirety ‐ including submarine design and construction ‐ is not currently designated as a PIC, although the domestic development and support of certain systems onboard Australia’s existing fleet of Collins
submarines do have PIC status.
Building Submarines in Australia – Aspects of Economic Impact ‐ May 2015 28 ______________________________________________________________________________________________
UNCLASSIFIED
28
the economic impact of building submarines might necessarily resemble the economic impact associated
with other Defence capital equipment projects.
With these points in mind, the report is designed more to illustrate the dynamics underpinning the measurement of
impact in a submarine environment using CGE modelling techniques than to provide a precise indication of what the
economic effects of building a new class of submarine in Australia might be, especially at a regional level.
In the absence of data on the sustainment savings from a domestic build in particular, the report might be an early
step in what could be an extended process of economic analysis.
Policy Scenarios and Base Case
Using a CGE model of the Australian economy, the effects of building six Collins equivalent submarines are
calculated and presented in this report in terms of two potential build scenarios ‐ an Australian build and an
overseas build. DMO makes no comment in relation to which of these scenarios is more likely.
For each scenario, a comparison is made of changes in the long‐run size and structure of the Australian economy
where the Government invests in a submarine project on the scale of Collins against the ‘base case’ in which that
investment does not occur.
A long run outlook is taken given the extended time frame ‐ of decades rather than months or years ‐ over which
building of fleet of submarines tends to take place. An extended time frame for analysis reflects in part the
likelihood that, if Australia’s next class of submarines is built in‐country, it may adopt a continuous rather than batch
build method.
The base case covers everything that is known about Australia’s economic future including announced changes in
government policies and confirmed investments in large projects. This extends to the effects of an imminent decline
in domestic motor vehicle manufacturing.
The differences in economic impact between an Australian and overseas build are compared when the vessels
offered from both sources are equal in all respects including price. Subsequently, these differences are estimated for
two different situations:
where the price of a domestically produced vessel is higher than the price of an overseas built vessel (i.e.
where a price premium to support domestic production applies); and,
where the level of Australian industry participation in a submarine built overseas varies.
Although the price premium and Australian industry content scenarios selected draw in part on recent public
discussion, they remain exploratory. How the parameters are set for each situation is detailed in Attachment D.
Building Submarines in Australia – Aspects of Economic Impact ‐ May 2015 29 ______________________________________________________________________________________________
UNCLASSIFIED
29
Measures of Economic Impact
In order to gauge economic impact, the paper uses four key measures:
real Gross Domestic Product (GDP) which is an indicator of the size of the economy gauged in terms of what
it produces;
real consumption which is a measure of the size of the economy in terms of the value of goods and services
which those in Australia’s private and public sectors can use;
employment, measured as the number of full‐time equivalent (FTE) jobs created as a result of a submarine
build; and
taxes which include the income, sales and other taxes collected by Government ‐ other than the taxes
raised to cover a submarine’s costs.
All of these measures add to an understanding of a submarine build’s economic impact.
However, all other factors being equal, real consumption stands out for several reasons: national welfare ultimately
depends on consumption not production; the final goal of employment is to allow Australians to achieve and sustain
reasonable consumption levels; and, while tax revenue is clearly vital to the sustainability of the government’s
budgetary position, the aim of fiscal policy is to underpin national prosperity rather than maximise the government’s
tax revenue for its own sake.
Given real consumption’s central role in measuring economic impact, it is important to note at the outset that some
fall in real consumption is necessary to pay for submarines and therefore to secure the defence of the nation. This
kind of reduction does not represent a reduction in national welfare. The underlying dynamics associated with
measures of real consumption are detailed in Attachment E.
Timing and Scope
In modelling the economic impact of a Collins equivalent submarine build, the decision was made to evaluate the
build commencing now rather than in 1986‐87 when work actually commenced on the Collins project or the late
2020s when construction on a Future Submarine is expected to begin in earnest.
This was done for a number of reasons: the added costs of ‘winding‐back’ a model of the Australian economy to the
late 1980s; preliminary modelling indicating that a submarine project start date of the mid‐late 2020s delivered
patterns of economic impact very similar to those based on a current start date; and, the fact that the objective of
economic modelling at this stage is to do no more than illustrate what submarine construction in general might do in
a CGE modelling context ‐ rather than present an economic history of the Collins project or a definitive view on the
form the economic impact of a Future Submarine Program will take.
Commensurate with the long term nature of any submarine build project, the particular CGE model selected for this
project, VUMRF, assesses the long term structure or ‘steady state’ of the economy rather than short term
fluctuations linked to the business cycle.
Building Submarines in Australia – Aspects of Economic Impact ‐ May 2015 30 ______________________________________________________________________________________________
UNCLASSIFIED
30
The CGE model assumes that there are no beneficial externalities which might influence impact, as might arise were
a submarine build to permanently improve the productivity of those connected with the project (through spillovers).
The revenue needed to pay for a submarine is assumed to be drawn from across both defence and commercial areas
of the economy through a non‐distortionary tax.14
For modelling purposes, the economic impact of a Collins equivalent build is defined to include not only the initial
construction phase of the project but also subsequent phases for rectifying deficiencies in vessel performance and
enhancing the vessels’ performance characteristics to bring them to their current level of capability. This approach
was adopted partly to ensure that the full impact of a build project was assessed for South Australia in particular.
The Collins build project had a relatively uneven cost profile, with high initial outlays and a long ‘tail’. For modelling
purposes and to assist with the presentation of results, relatively small amounts of cost relating to Collins
rectification and enhancement are therefore brought forward into a core 16 year build period. This is unlikely to
create any significant bias.
Finally, to facilitate modelling, the costs associated with building the Collins submarines are divided into three
categories ‐ design, construction and test ‐ given that each category has distinct economic features. Further,
construction of the platform is separated from that of the combat system given that these two aspects of a
submarine build also differ significantly in their economic characteristics.
Inference
Using economic impact data on the Collins equivalent submarines to infer what might occur if a new class of vessels
is constructed in Australia, highlights two points.
The first is an assumption that there is a reasonable degree of similarity between the Collins and Future Submarines
in relation to build method. More specifically, the approach assumes some similarities between the two classes of
submarine in relation to final platform and combat systems structure, modular build sequence, build location,
industrial productivity and construction ‘learning curve’, Australian content and reliance on supporting
infrastructure.
The second is that although the Collins experience might be regarded as somewhat unique in terms of the unusually
high level of additional effort required to bring the submarines’ combat system to fruition, no separate downward
adjustments to cost are made. The primary rationale for making no adjustment is that any future domestic
submarine project is also likely to encounter unforeseen challenges ‐ if not with the combat system, then with
other project activities.
Sustainment
The modelling results presented in the paper focus on Collins submarine build costs ‐ covering design, initial
construction, rectification and enhancements ‐ despite this historically accounting for almost the same proportion
14 This does not cater for the possibility that the costs of building additional submarines might in practice be more narrowly based in the sense of
being met by a reduction in expenditure in other Department of Defence (‘Defence’) capital equipment projects supported by Australian industry. If so, economic activity in one area of defence industry ‐ submarines ‐ would rise but only at the expense of defence manufacturing elsewhere. However, at this early stage in Future Submarine planning, it is not possible to identify the potentially displaced Defence project(s) involved.
Building Submarines in Australia – Aspects of Economic Impact ‐ May 2015 31 ______________________________________________________________________________________________
UNCLASSIFIED
31
of the total cost of the submarines as sustainment over the expected operating life of the vessels. There are a
number of reasons for excluding sustainment activities at this stage of an economic modelling exercise.
One is that irrespective of whether Australia’s submarines are built domestically or overseas, it appears likely that a
substantial proportion of their sustainment will occur in‐country ‐ for both economic and national security reasons.
If so, the issue of domestic economic impact is less relevant to decisions on where sustainment work on submarines
takes place than it is to decisions on where the vessels should be built.
Another is that the rate of sustainment effort more modern submarines will require has not yet been determined
with reasonable certainty. Such effort may not necessarily coincide with that of Collins class vessels, due to advances
in submarine technologies. This makes drawing any inference from the Collins experience more difficult from a
sustainment than a build perspective. The fact that the sustainment of the Collins is ongoing, while construction is
complete, adds to the inference problems as there may still be surprises in terms of sustainment costs as the
submarine fleet ages.
Finally, the extent to which a domestic build might reduce subsequent sustainment costs is difficult to estimate at
this stage ‐ noting that a domestic build may be less important as a means of lowering sustainment costs if Australia
can ‘reach‐back’ to an overseas submarine designer in the longer term.
There are a number of reasons to suggest that the sustainment savings from a domestic rather than overseas build
may be smaller than they first appear:
transfers of intellectual property from an overseas designer/builder to an Australian sustainer can help to
contain sustainment costs;
an overseas builder of submarines might also be well versed in sustaining its own vessels, and therefore be
well positioned to transfer sustainment‐specific information to its submarine export customers;
in the same way as the companies involved in assembling cars can exist separately from those who service
them, many of the individual companies involved in sustaining submarines might not have been involved in
a submarine build and therefore no been in a position to benefit directly from build activity; and
not all of the skills required for a submarine build might remain within the builder for long enough to
support sustainment activity , even with a shift from a batch to a continuous build program.
Unfortunately, the exact paths through which an Australian build might help to reduce Australian sustainment costs
‐ relative to an overseas build ‐ have not been enunciated clearly in existing studies of economic impact for
Defence capital equipment projects including naval build projects. Beyond the notion that spare parts might be
more quickly accessed or repaired if produced in Australia rather than overseas and the fact that it can be expensive
to transfer relatively small numbers of technical experts between Australia and an overseas build location (in both
directions) to assist with domestic sustainment, precious little exists to explain or quantify the sustainment cost
savings involved.
Until two related issues become clearer it is difficult to draw firm conclusions about the economic nexus between
build location and sustainment costs: the extent to which sustainment requirements can be successfully
incorporated into the design and build of a new submarine; and, how the transfer to Australia of intellectual
property associated with these tasks will be managed to support in‐country sustainment requirements.
Building Submarines in Australia – Aspects of Economic Impact ‐ May 2015 32 ______________________________________________________________________________________________
UNCLASSIFIED
32
Consequently, the report sets aside sustainment economic impact matters until more definitive information
becomes available.
Data Input
Finally, for modelling purposes, the costs of building the Collins submarines were drawn from extensive financial
records held within Defence. These records detailed the value, timing and distribution of Departmental expenditure
on the various elements which make up the submarines, to a high level of granularity.
From a cost break‐down perspective, five features of the Collins build stand out:
the costs of initial construction far outweighed the cost of subsequent rectification and enhancement;
two constituent parts to the submarines dominated the vessels’ overall costs, namely the hull and the
combat system ‐ which absorbed Defence expenditure in roughly equal proportions;
building the submarines was labour intensive, with the majority of labour costs being associated with ‘white
collar’ rather than ‘blue collar’ skills;
the majority of overall build costs, including those relating to white collar labour, tended to be fixed rather
than variable which means that they needed to be incurred largely irrespective of how many submarines
were produced; and
it was not until the third of the six vessels was completed that scale and related efficiencies were able to be
substantially realised and the unit costs of the submarines potentially minimised.
Attachment G provides a comprehensive profile of Collins build costs by Defence project, vessel system, geographic
location and other dimensions of the project.
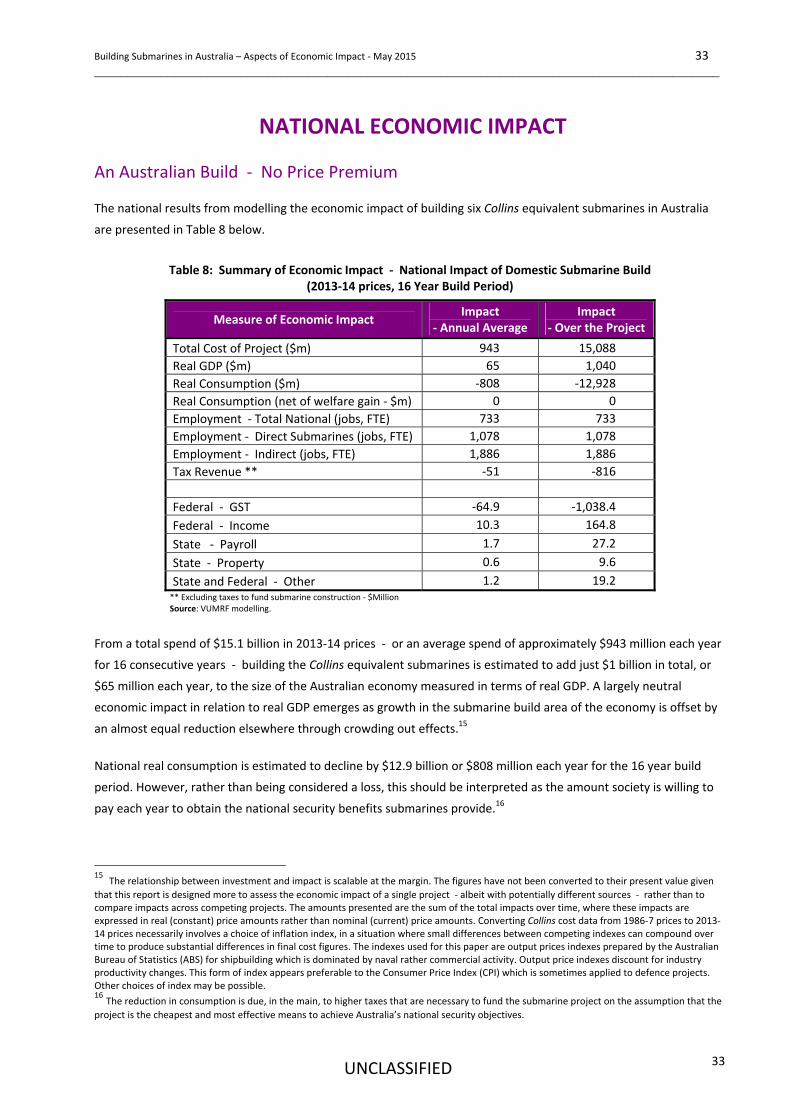
Building Submarines in Australia – Aspects of Economic Impact ‐ May 2015 33 ______________________________________________________________________________________________
UNCLASSIFIED
33
NATIONAL ECONOMIC IMPACT
An Australian Build ‐ No Price Premium
The national results from modelling the economic impact of building six Collins equivalent submarines in Australia
are presented in Table 8 below.
Table 8: Summary of Economic Impact ‐ National Impact of Domestic Submarine Build
(2013‐14 prices, 16 Year Build Period)
Measure of Economic Impact Impact
‐ Annual Average Impact
‐ Over the Project
Total Cost of Project ($m) 943 15,088
Real GDP ($m) 65 1,040
Real Consumption ($m) ‐808 ‐12,928
Real Consumption (net of welfare gain ‐ $m) 0 0
Employment ‐ Total National (jobs, FTE) 733 733
Employment ‐ Direct Submarines (jobs, FTE) 1,078 1,078
Employment ‐ Indirect (jobs, FTE) 1,886 1,886
Tax Revenue ** ‐51 ‐816
Federal ‐ GST ‐64.9 ‐1,038.4
Federal ‐ Income 10.3 164.8
State ‐ Payroll 1.7 27.2
State ‐ Property 0.6 9.6
State and Federal ‐ Other 1.2 19.2 ** Excluding taxes to fund submarine construction ‐ $Million Source: VUMRF modelling.
From a total spend of $15.1 billion in 2013‐14 prices ‐ or an average spend of approximately $943 million each year
for 16 consecutive years ‐ building the Collins equivalent submarines is estimated to add just $1 billion in total, or
$65 million each year, to the size of the Australian economy measured in terms of real GDP. A largely neutral
economic impact in relation to real GDP emerges as growth in the submarine build area of the economy is offset by
an almost equal reduction elsewhere through crowding out effects.15
National real consumption is estimated to decline by $12.9 billion or $808 million each year for the 16 year build
period. However, rather than being considered a loss, this should be interpreted as the amount society is willing to
pay each year to obtain the national security benefits submarines provide.16
15 The relationship between investment and impact is scalable at the margin. The figures have not been converted to their present value given
that this report is designed more to assess the economic impact of a single project ‐ albeit with potentially different sources ‐ rather than to compare impacts across competing projects. The amounts presented are the sum of the total impacts over time, where these impacts are expressed in real (constant) price amounts rather than nominal (current) price amounts. Converting Collins cost data from 1986‐7 prices to 2013‐14 prices necessarily involves a choice of inflation index, in a situation where small differences between competing indexes can compound over time to produce substantial differences in final cost figures. The indexes used for this paper are output prices indexes prepared by the Australian Bureau of Statistics (ABS) for shipbuilding which is dominated by naval rather commercial activity. Output price indexes discount for industry productivity changes. This form of index appears preferable to the Consumer Price Index (CPI) which is sometimes applied to defence projects. Other choices of index may be possible. 16 The reduction in consumption is due, in the main, to higher taxes that are necessary to fund the submarine project on the assumption that the
project is the cheapest and most effective means to achieve Australia’s national security objectives.
Building Submarines in Australia – Aspects of Economic Impact ‐ May 2015 34 ______________________________________________________________________________________________
UNCLASSIFIED
34
For the same annual average investment of $943 million each year for 16 years, approximately 2,964 Full Time
Equivalent (FTE) jobs are estimated to be created and supported nationally each year ‐ around 1,078 directly within
the submarine builder and some of its closest sub‐contractors, and a further 1,889 indirectly associated with the
extended supply chain supporting the vessels’ build. For every 1.0 job created directly, a further 1.75 jobs are
created indirectly.
However, only 733 FTE jobs in total are added to employment across Australia, as crowding out reduces job numbers
by approximately 2,234 FTE positions in other areas of the economy. Thus, while the number of jobs in the
submarine construction industry rises this comes only at the expense of employment elsewhere.17
On the basis of all of the following measures of relative size, the impact of the build is assessed as small:
the overall increase in production associated with the project equates to around 7 percent of total project
cost and less than .01 percent ‐ or one hundredth of one percent ‐ of the size of the entire Australian
economy measured in terms of real GDP;
although difficult to gauge precisely, DMO estimates that the size of the in‐country spend on submarines
would be approximately 11.5 percent of the current overall size of Australian defence industry measured on
the basis of Defence’s in‐country expenditure on acquiring and sustaining capital equipment; and
DMO also estimates that the additional 733 jobs created in net terms across the country is just 0.081
percent ‐ or around eight hundredths of one percent ‐ of the current overall employment base of the
Australian manufacturing sector and approximately 0.006 percent ‐ or sixth thousandths of one percent ‐
of the current entire Australian workforce.
These results are consistent with those from the only published study to date on the Collins submarine build,
although comparisons across studies are not easily made due to differences in data, modelling methods and
modelling objectives. In its 1994 report on Defence Procurement, the Industry Commission (IC ‐ now Productivity
Commission) used a CGE approach in the form of an early version of the VUMRF model to conclude that the “the
overall impact on the economy as a whole is negligible.”18
The results suggest that submarine construction may not be a particularly useful or potent instrument for promoting
economic growth. They imply that: Australia should seek to purchase only the minimum number, size and capability
of vessels it needs to satisfy the nation’s essential military‐strategic needs; and, military‐strategic issues should
dominate decisions in relation to submarine source selection.
An Overseas Build ‐ No Price Premium
When a submarine is purchased from overseas, for the same average spend of $15.1 billion or $943 million each
year for 16 years, building the Collins equivalent submarines is estimated to reduce the size of the Australian
economy by between $1.25 billion and $1.7 billion ‐ or between $72 million and $104 million annually ‐ measured
in terms of real GDP. The exact impact depends on the level of Australian content involved.
17 For the purpose of this report, the term direct effect refers to employment within the company building the submarines including some of its
long time sub‐contractors. The term indirect effect refers to all other supply chain effects the project generates including its effects on companies supplying goods and services to the builder and the consumer spending associated with those employed along the chain. Appendix B describes the approach in more detail. 18 Industry Commission, Defence Procurement, Report No. 41, Canberra, 30 August 1994, p.159, p.285 and p.287.
Building Submarines in Australia – Aspects of Economic Impact ‐ May 2015 35 ______________________________________________________________________________________________
UNCLASSIFIED
35
The decline in real GDP is larger when Australian‐based companies are able to provide few goods and services to the
overseas builder ‐ and smaller when the scope for Australian industry participation in suppling inputs to an
overseas builder expands.
The impact of an overseas submarine build on real consumption follows suit. In this case, real consumption declines
by between $19.2 billion and $20.4 billion ‐ or $1.1 billion and $1.2 billion each year. The fall in consumption is
greater than for the Australian build scenario because the stimulus to real GDP, and hence to real income from
labour and capital in the overseas build case, is less than in the Australian build case.
However, remembering that $12.9 billion ‐ or $808 million per annum ‐ of these declines is not associated with a
welfare loss given the national security benefits a submarine provides, the actual drops in real consumption equate
to between $6.3 billion and $7.5 billion or between $393 million and $467 million per annum.
Tax revenue (excluding tax raised directly to fund submarine construction) is negative at between ‐$1.5 billion and
‐$1.6 billion or ‐$96 million and ‐$101 million each year. For the same investment of $15.1 billion or $943 million per
year, between 205 and 47 FTE jobs are estimated to be created and supported annually inside Australia over the
build period, after crowding out effects are considered.
On the basis of the following measures of relative size, the impact of the overseas build is assessed as negative but
small:
the overall decrease in production associated with the project equates on average to around 9 percent of
total project cost and less than .01 percent ‐ or one hundredth of one percent ‐ of the size of the entire
Australian economy measured in terms of real GDP;
although difficult to gauge precisely, DMO estimates that the size of the in‐country spend on submarines
built overseas would be approximately 2.2 percent of the current overall size of Australian defence industry
measured on the basis of Defence’s in‐country expenditure on acquiring and sustaining capital equipment;
and
DMO also estimates that the 126 jobs created on average in net terms across the country is just 0.014
percent ‐ or slightly more than one hundredth of one percent ‐ of the current overall employment base of
the Australian manufacturing sector and approximately 0.001 percent ‐ or one thousandth of one percent
‐ of the current entire Australian workforce.
Finally, higher levels of Australian industry participation in an overseas build project lead to higher economic
benefits for Australia but not in proportion to the changes in the rates of participation involved, as crowding out
effects take hold.
For example, a more than four fold or 400 percent increase in Australian content ‐ from 5 percent of the total cost
of a submarine to 21 percent ‐ equates on an average annual basis to $151 million but delivers only a $32 million or
31 percent improvement in real GDP, a $74 million or 6 percent improvement in real consumption and a $14 million
or 11 percent improvement in tax revenue each year. Measured in terms of real GDP, the improvement is equal to
only 3 percent of the total cost of the submarine project.
The corresponding figures are a 336 percent or 158 FTE jobs improvement in total national employment and a 298
percent or 263 FTE jobs increase in direct submarine employment. However, while employment numbers and
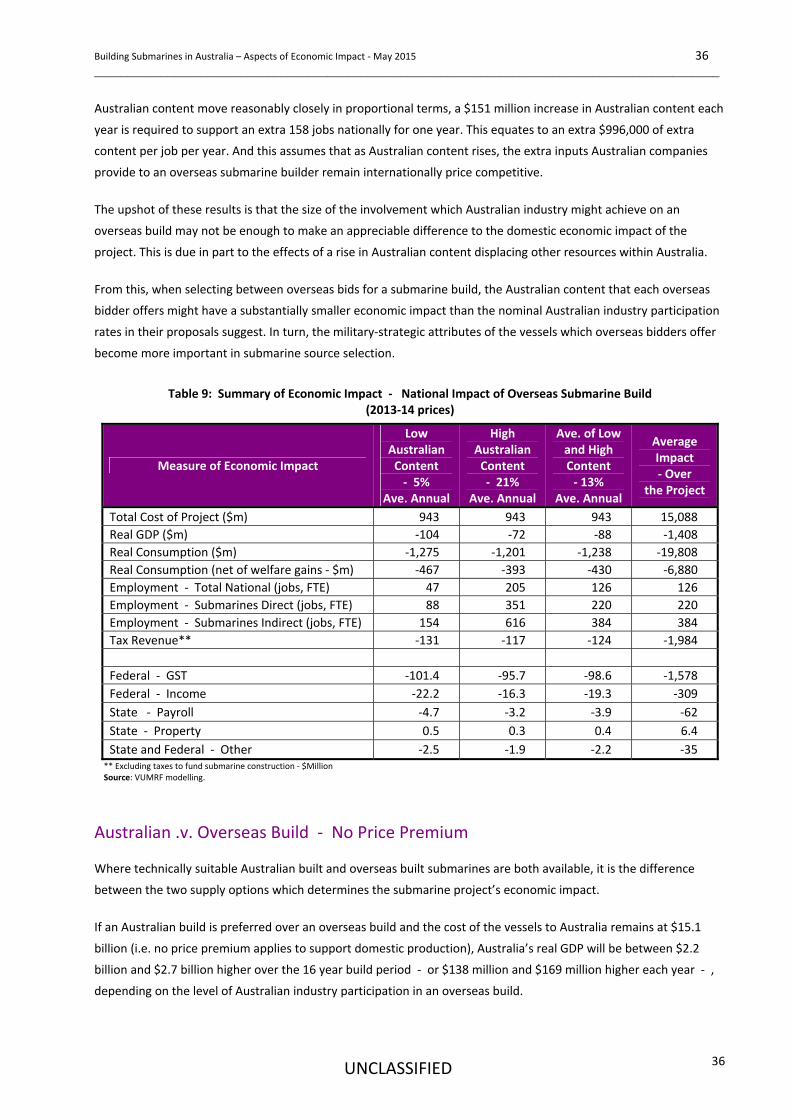
Building Submarines in Australia – Aspects of Economic Impact ‐ May 2015 36 ______________________________________________________________________________________________
UNCLASSIFIED
36
Australian content move reasonably closely in proportional terms, a $151 million increase in Australian content each
year is required to support an extra 158 jobs nationally for one year. This equates to an extra $996,000 of extra
content per job per year. And this assumes that as Australian content rises, the extra inputs Australian companies
provide to an overseas submarine builder remain internationally price competitive.
The upshot of these results is that the size of the involvement which Australian industry might achieve on an
overseas build may not be enough to make an appreciable difference to the domestic economic impact of the
project. This is due in part to the effects of a rise in Australian content displacing other resources within Australia.
From this, when selecting between overseas bids for a submarine build, the Australian content that each overseas
bidder offers might have a substantially smaller economic impact than the nominal Australian industry participation
rates in their proposals suggest. In turn, the military‐strategic attributes of the vessels which overseas bidders offer
become more important in submarine source selection.
Table 9: Summary of Economic Impact ‐ National Impact of Overseas Submarine Build
(2013‐14 prices)
Measure of Economic Impact
Low Australian Content ‐ 5%
Ave. Annual
High Australian Content ‐ 21%
Ave. Annual
Ave. of Low and High Content ‐ 13%
Ave. Annual
Average Impact ‐ Over
the Project
Total Cost of Project ($m) 943 943 943 15,088
Real GDP ($m) ‐104 ‐72 ‐88 ‐1,408
Real Consumption ($m) ‐1,275 ‐1,201 ‐1,238 ‐19,808
Real Consumption (net of welfare gains ‐ $m) ‐467 ‐393 ‐430 ‐6,880
Employment ‐ Total National (jobs, FTE) 47 205 126 126
Employment ‐ Submarines Direct (jobs, FTE) 88 351 220 220
Employment ‐ Submarines Indirect (jobs, FTE) 154 616 384 384
Tax Revenue** ‐131 ‐117 ‐124 ‐1,984
Federal ‐ GST ‐101.4 ‐95.7 ‐98.6 ‐1,578
Federal ‐ Income ‐22.2 ‐16.3 ‐19.3 ‐309
State ‐ Payroll ‐4.7 ‐3.2 ‐3.9 ‐62
State ‐ Property 0.5 0.3 0.4 6.4
State and Federal ‐ Other ‐2.5 ‐1.9 ‐2.2 ‐35 ** Excluding taxes to fund submarine construction ‐ $Million Source: VUMRF modelling.
Australian .v. Overseas Build ‐ No Price Premium
Where technically suitable Australian built and overseas built submarines are both available, it is the difference
between the two supply options which determines the submarine project’s economic impact.
If an Australian build is preferred over an overseas build and the cost of the vessels to Australia remains at $15.1
billion (i.e. no price premium applies to support domestic production), Australia’s real GDP will be between $2.2
billion and $2.7 billion higher over the 16 year build period ‐ or $138 million and $169 million higher each year ‐ ,
depending on the level of Australian industry participation in an overseas build.
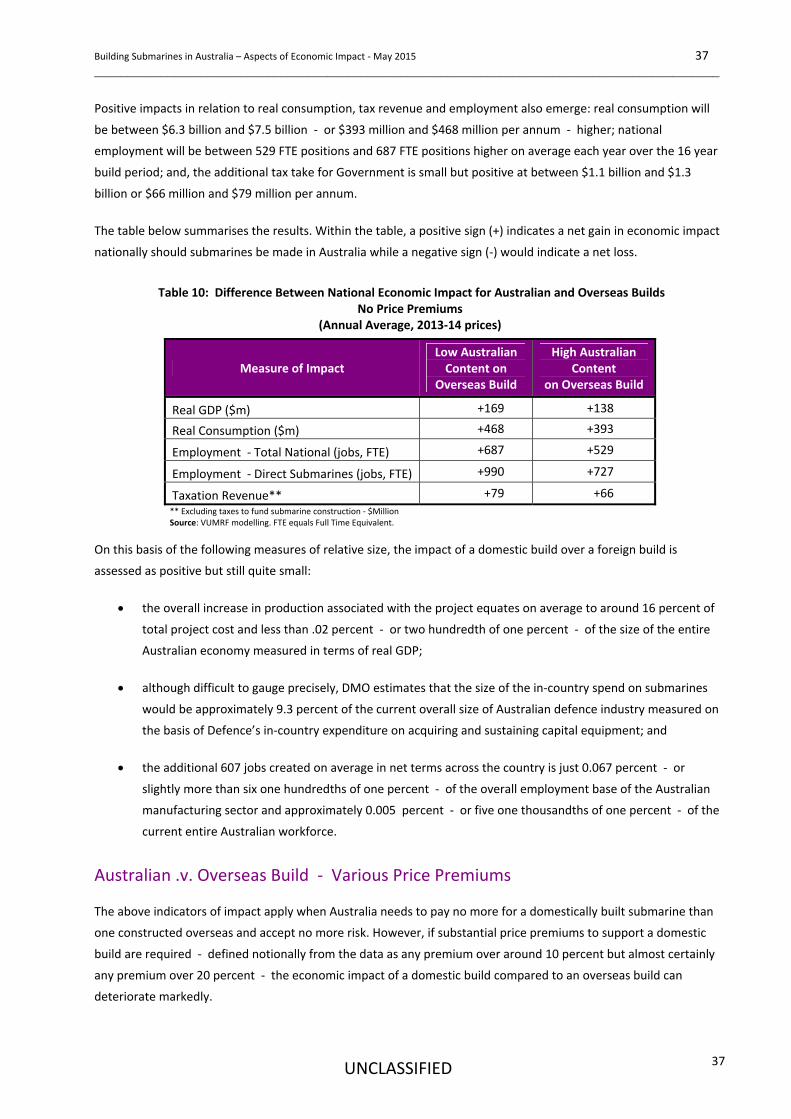
Building Submarines in Australia – Aspects of Economic Impact ‐ May 2015 37 ______________________________________________________________________________________________
UNCLASSIFIED
37
Positive impacts in relation to real consumption, tax revenue and employment also emerge: real consumption will
be between $6.3 billion and $7.5 billion ‐ or $393 million and $468 million per annum ‐ higher; national
employment will be between 529 FTE positions and 687 FTE positions higher on average each year over the 16 year
build period; and, the additional tax take for Government is small but positive at between $1.1 billion and $1.3
billion or $66 million and $79 million per annum.
The table below summarises the results. Within the table, a positive sign (+) indicates a net gain in economic impact
nationally should submarines be made in Australia while a negative sign (‐) would indicate a net loss.
Table 10: Difference Between National Economic Impact for Australian and Overseas Builds
No Price Premiums (Annual Average, 2013‐14 prices)
Measure of Impact Low Australian Content on
Overseas Build
High Australian Content
on Overseas Build
Real GDP ($m) +169 +138
Real Consumption ($m) +468 +393
Employment ‐ Total National (jobs, FTE) +687 +529
Employment ‐ Direct Submarines (jobs, FTE) +990 +727
Taxation Revenue** +79 +66
** Excluding taxes to fund submarine construction ‐ $Million Source: VUMRF modelling. FTE equals Full Time Equivalent.
On this basis of the following measures of relative size, the impact of a domestic build over a foreign build is
assessed as positive but still quite small:
the overall increase in production associated with the project equates on average to around 16 percent of
total project cost and less than .02 percent ‐ or two hundredth of one percent ‐ of the size of the entire
Australian economy measured in terms of real GDP;
although difficult to gauge precisely, DMO estimates that the size of the in‐country spend on submarines
would be approximately 9.3 percent of the current overall size of Australian defence industry measured on
the basis of Defence’s in‐country expenditure on acquiring and sustaining capital equipment; and
the additional 607 jobs created on average in net terms across the country is just 0.067 percent ‐ or
slightly more than six one hundredths of one percent ‐ of the overall employment base of the Australian
manufacturing sector and approximately 0.005 percent ‐ or five one thousandths of one percent ‐ of the
current entire Australian workforce.
Australian .v. Overseas Build ‐ Various Price Premiums
The above indicators of impact apply when Australia needs to pay no more for a domestically built submarine than
one constructed overseas and accept no more risk. However, if substantial price premiums to support a domestic
build are required ‐ defined notionally from the data as any premium over around 10 percent but almost certainly
any premium over 20 percent ‐ the economic impact of a domestic build compared to an overseas build can
deteriorate markedly.
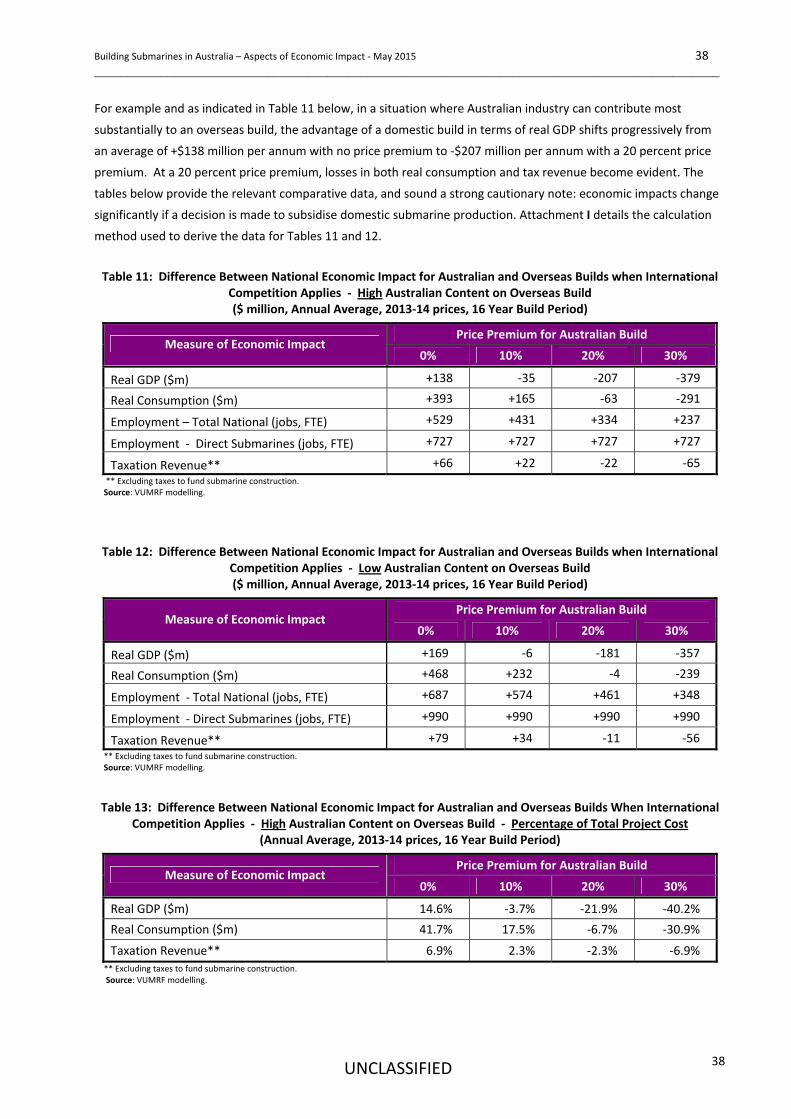
Building Submarines in Australia – Aspects of Economic Impact ‐ May 2015 38 ______________________________________________________________________________________________
UNCLASSIFIED
38
For example and as indicated in Table 11 below, in a situation where Australian industry can contribute most
substantially to an overseas build, the advantage of a domestic build in terms of real GDP shifts progressively from
an average of +$138 million per annum with no price premium to ‐$207 million per annum with a 20 percent price
premium. At a 20 percent price premium, losses in both real consumption and tax revenue become evident. The
tables below provide the relevant comparative data, and sound a strong cautionary note: economic impacts change
significantly if a decision is made to subsidise domestic submarine production. Attachment I details the calculation
method used to derive the data for Tables 11 and 12.
Table 11: Difference Between National Economic Impact for Australian and Overseas Builds when International
Competition Applies ‐ High Australian Content on Overseas Build ($ million, Annual Average, 2013‐14 prices, 16 Year Build Period)
Price Premium for Australian Build Measure of Economic Impact
0% 10% 20% 30%
Real GDP ($m) +138 ‐35 ‐207 ‐379
Real Consumption ($m) +393 +165 ‐63 ‐291
Employment – Total National (jobs, FTE) +529 +431 +334 +237
Employment ‐ Direct Submarines (jobs, FTE) +727 +727 +727 +727
Taxation Revenue** +66 +22 ‐22 ‐65
** Excluding taxes to fund submarine construction. Source: VUMRF modelling.
Table 12: Difference Between National Economic Impact for Australian and Overseas Builds when International Competition Applies ‐ Low Australian Content on Overseas Build ($ million, Annual Average, 2013‐14 prices, 16 Year Build Period)
Price Premium for Australian Build Measure of Economic Impact
0% 10% 20% 30%
Real GDP ($m) +169 ‐6 ‐181 ‐357
Real Consumption ($m) +468 +232 ‐4 ‐239
Employment ‐ Total National (jobs, FTE) +687 +574 +461 +348
Employment ‐ Direct Submarines (jobs, FTE) +990 +990 +990 +990
Taxation Revenue** +79 +34 ‐11 ‐56
** Excluding taxes to fund submarine construction. Source: VUMRF modelling.
Table 13: Difference Between National Economic Impact for Australian and Overseas Builds When International Competition Applies ‐ High Australian Content on Overseas Build ‐ Percentage of Total Project Cost
(Annual Average, 2013‐14 prices, 16 Year Build Period)
Price Premium for Australian Build Measure of Economic Impact
0% 10% 20% 30%
Real GDP ($m) 14.6% ‐3.7% ‐21.9% ‐40.2%
Real Consumption ($m) 41.7% 17.5% ‐6.7% ‐30.9%
Taxation Revenue** 6.9% 2.3% ‐2.3% ‐6.9%
** Excluding taxes to fund submarine construction. Source: VUMRF modelling.
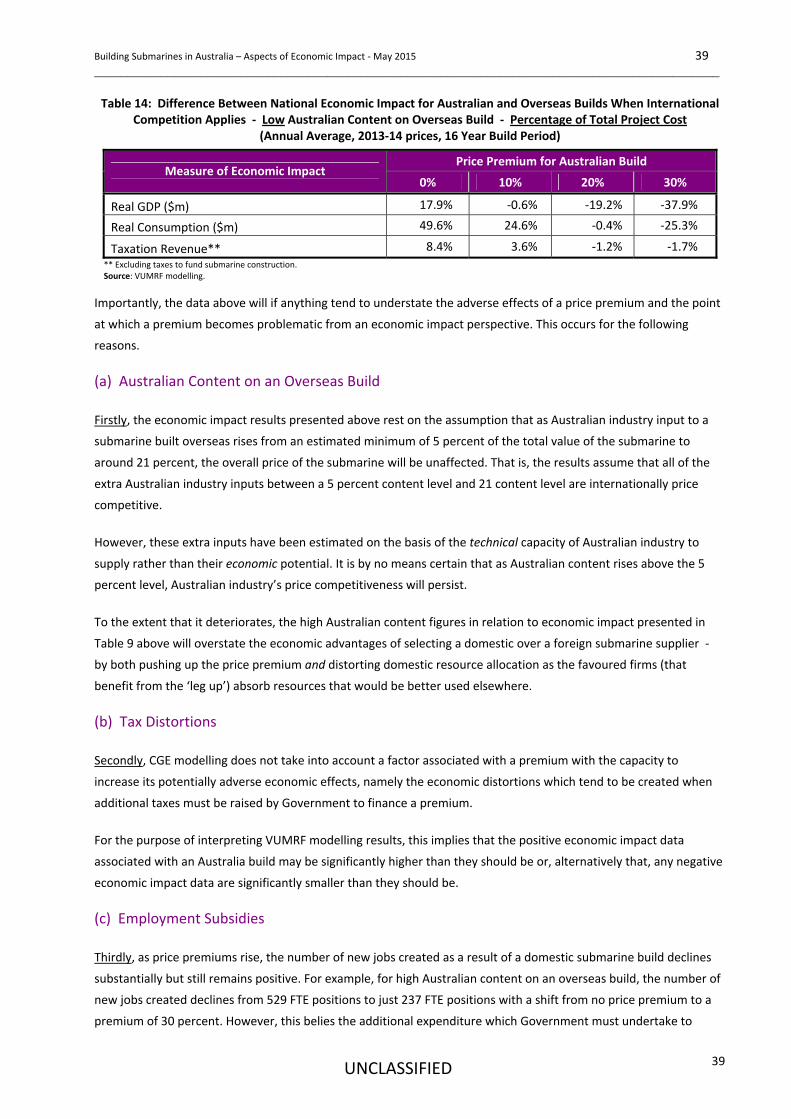
Building Submarines in Australia – Aspects of Economic Impact ‐ May 2015 39 ______________________________________________________________________________________________
UNCLASSIFIED
39
Table 14: Difference Between National Economic Impact for Australian and Overseas Builds When International Competition Applies ‐ Low Australian Content on Overseas Build ‐ Percentage of Total Project Cost
(Annual Average, 2013‐14 prices, 16 Year Build Period)
Price Premium for Australian Build Measure of Economic Impact
0% 10% 20% 30%
Real GDP ($m) 17.9% ‐0.6% ‐19.2% ‐37.9%
Real Consumption ($m) 49.6% 24.6% ‐0.4% ‐25.3%
Taxation Revenue** 8.4% 3.6% ‐1.2% ‐1.7%
** Excluding taxes to fund submarine construction. Source: VUMRF modelling.
Importantly, the data above will if anything tend to understate the adverse effects of a price premium and the point
at which a premium becomes problematic from an economic impact perspective. This occurs for the following
reasons.
(a) Australian Content on an Overseas Build
Firstly, the economic impact results presented above rest on the assumption that as Australian industry input to a
submarine built overseas rises from an estimated minimum of 5 percent of the total value of the submarine to
around 21 percent, the overall price of the submarine will be unaffected. That is, the results assume that all of the
extra Australian industry inputs between a 5 percent content level and 21 content level are internationally price
competitive.
However, these extra inputs have been estimated on the basis of the technical capacity of Australian industry to
supply rather than their economic potential. It is by no means certain that as Australian content rises above the 5
percent level, Australian industry’s price competitiveness will persist.
To the extent that it deteriorates, the high Australian content figures in relation to economic impact presented in
Table 9 above will overstate the economic advantages of selecting a domestic over a foreign submarine supplier ‐
by both pushing up the price premium and distorting domestic resource allocation as the favoured firms (that
benefit from the ‘leg up’) absorb resources that would be better used elsewhere.
(b) Tax Distortions
Secondly, CGE modelling does not take into account a factor associated with a premium with the capacity to
increase its potentially adverse economic effects, namely the economic distortions which tend to be created when
additional taxes must be raised by Government to finance a premium.
For the purpose of interpreting VUMRF modelling results, this implies that the positive economic impact data
associated with an Australia build may be significantly higher than they should be or, alternatively that, any negative
economic impact data are significantly smaller than they should be.
(c) Employment Subsidies
Thirdly, as price premiums rise, the number of new jobs created as a result of a domestic submarine build declines
substantially but still remains positive. For example, for high Australian content on an overseas build, the number of
new jobs created declines from 529 FTE positions to just 237 FTE positions with a shift from no price premium to a
premium of 30 percent. However, this belies the additional expenditure which Government must undertake to
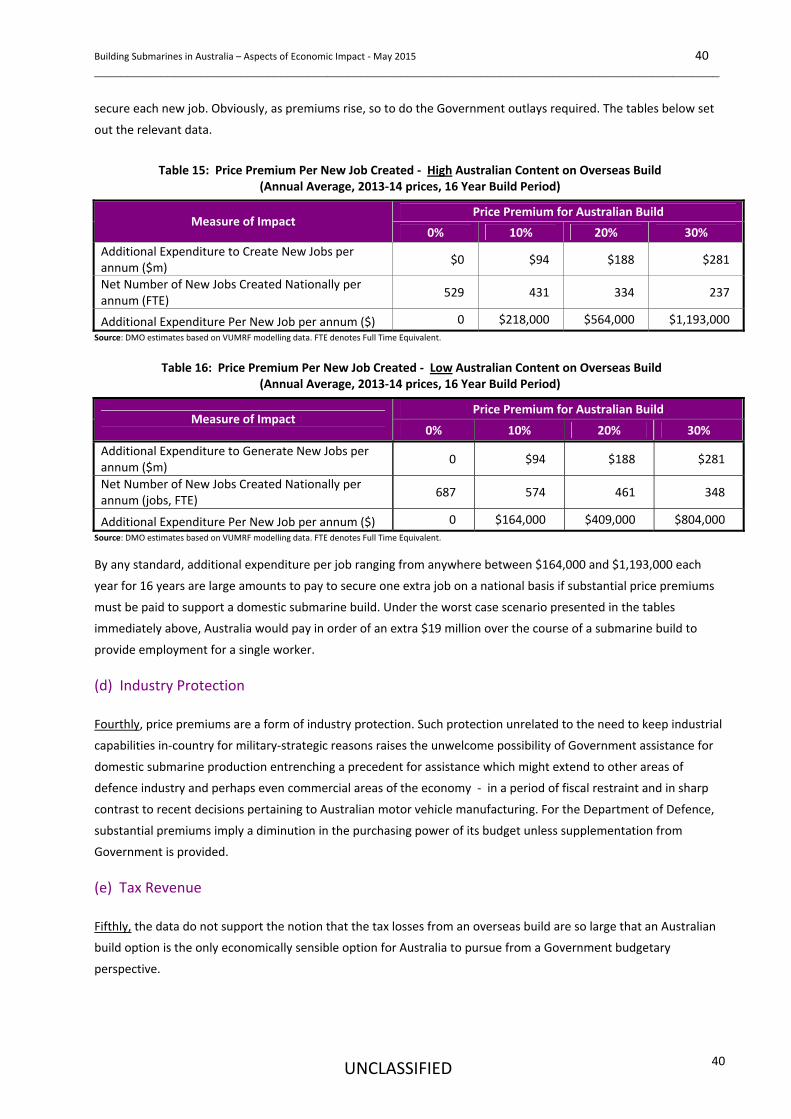
Building Submarines in Australia – Aspects of Economic Impact ‐ May 2015 40 ______________________________________________________________________________________________
UNCLASSIFIED
40
secure each new job. Obviously, as premiums rise, so to do the Government outlays required. The tables below set
out the relevant data.
Table 15: Price Premium Per New Job Created ‐ High Australian Content on Overseas Build
(Annual Average, 2013‐14 prices, 16 Year Build Period)
Price Premium for Australian Build Measure of Impact
0% 10% 20% 30%
Additional Expenditure to Create New Jobs per annum ($m)
$0 $94 $188 $281
Net Number of New Jobs Created Nationally per annum (FTE)
529 431 334 237
Additional Expenditure Per New Job per annum ($) 0 $218,000 $564,000 $1,193,000
Source: DMO estimates based on VUMRF modelling data. FTE denotes Full Time Equivalent.
Table 16: Price Premium Per New Job Created ‐ Low Australian Content on Overseas Build
(Annual Average, 2013‐14 prices, 16 Year Build Period)
Price Premium for Australian Build Measure of Impact
0% 10% 20% 30%
Additional Expenditure to Generate New Jobs per annum ($m)
0 $94 $188 $281
Net Number of New Jobs Created Nationally per annum (jobs, FTE)
687 574 461 348
Additional Expenditure Per New Job per annum ($) 0 $164,000 $409,000 $804,000
Source: DMO estimates based on VUMRF modelling data. FTE denotes Full Time Equivalent.
By any standard, additional expenditure per job ranging from anywhere between $164,000 and $1,193,000 each
year for 16 years are large amounts to pay to secure one extra job on a national basis if substantial price premiums
must be paid to support a domestic submarine build. Under the worst case scenario presented in the tables
immediately above, Australia would pay in order of an extra $19 million over the course of a submarine build to
provide employment for a single worker.
(d) Industry Protection
Fourthly, price premiums are a form of industry protection. Such protection unrelated to the need to keep industrial
capabilities in‐country for military‐strategic reasons raises the unwelcome possibility of Government assistance for
domestic submarine production entrenching a precedent for assistance which might extend to other areas of
defence industry and perhaps even commercial areas of the economy ‐ in a period of fiscal restraint and in sharp
contrast to recent decisions pertaining to Australian motor vehicle manufacturing. For the Department of Defence,
substantial premiums imply a diminution in the purchasing power of its budget unless supplementation from
Government is provided.
(e) Tax Revenue
Fifthly, the data do not support the notion that the tax losses from an overseas build are so large that an Australian
build option is the only economically sensible option for Australia to pursue from a Government budgetary
perspective.

Building Submarines in Australia – Aspects of Economic Impact ‐ May 2015 41 ______________________________________________________________________________________________
UNCLASSIFIED
41
The net gain in tax revenue from an Australian build when an overseas option is available and domestic and overseas
purchase prices are equivalent is estimated at 9 percent of the price of the Collins submarines. This is well below the
corresponding figure claimed by Australian advocates of a domestic submarine build, and cited from research in the
United Kingdom, of 36 percent. And even a 9 percent gain evaporates quickly in the presence of significant price
premiums. Obviously, if there are differences in technical risk or in capability associated with domestic compared to
overseas sourcing, those aspects too must be taken into consideration.
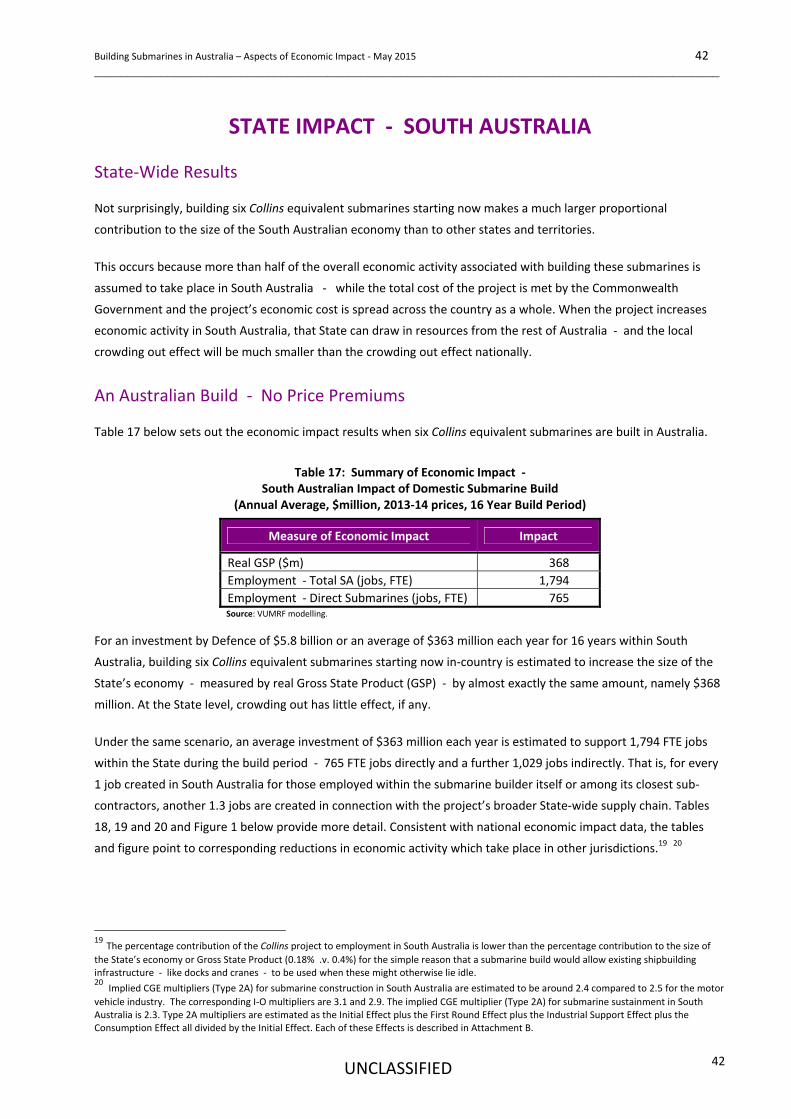
Building Submarines in Australia – Aspects of Economic Impact ‐ May 2015 42 ______________________________________________________________________________________________
UNCLASSIFIED
42
STATE IMPACT ‐ SOUTH AUSTRALIA
State‐Wide Results
Not surprisingly, building six Collins equivalent submarines starting now makes a much larger proportional
contribution to the size of the South Australian economy than to other states and territories.
This occurs because more than half of the overall economic activity associated with building these submarines is
assumed to take place in South Australia ‐ while the total cost of the project is met by the Commonwealth
Government and the project’s economic cost is spread across the country as a whole. When the project increases
economic activity in South Australia, that State can draw in resources from the rest of Australia ‐ and the local
crowding out effect will be much smaller than the crowding out effect nationally.
An Australian Build ‐ No Price Premiums
Table 17 below sets out the economic impact results when six Collins equivalent submarines are built in Australia.
Table 17: Summary of Economic Impact ‐
South Australian Impact of Domestic Submarine Build (Annual Average, $million, 2013‐14 prices, 16 Year Build Period)
Measure of Economic Impact Impact
Real GSP ($m) 368
Employment ‐ Total SA (jobs, FTE) 1,794
Employment ‐ Direct Submarines (jobs, FTE) 765 Source: VUMRF modelling.
For an investment by Defence of $5.8 billion or an average of $363 million each year for 16 years within South
Australia, building six Collins equivalent submarines starting now in‐country is estimated to increase the size of the
State’s economy ‐ measured by real Gross State Product (GSP) ‐ by almost exactly the same amount, namely $368
million. At the State level, crowding out has little effect, if any.
Under the same scenario, an average investment of $363 million each year is estimated to support 1,794 FTE jobs
within the State during the build period ‐ 765 FTE jobs directly and a further 1,029 jobs indirectly. That is, for every
1 job created in South Australia for those employed within the submarine builder itself or among its closest sub‐
contractors, another 1.3 jobs are created in connection with the project’s broader State‐wide supply chain. Tables
18, 19 and 20 and Figure 1 below provide more detail. Consistent with national economic impact data, the tables
and figure point to corresponding reductions in economic activity which take place in other jurisdictions.19 20
19 The percentage contribution of the Collins project to employment in South Australia is lower than the percentage contribution to the size of
the State’s economy or Gross State Product (0.18% .v. 0.4%) for the simple reason that a submarine build would allow existing shipbuilding infrastructure ‐ like docks and cranes ‐ to be used when these might otherwise lie idle. 20 Implied CGE multipliers (Type 2A) for submarine construction in South Australia are estimated to be around 2.4 compared to 2.5 for the motor
vehicle industry. The corresponding I‐O multipliers are 3.1 and 2.9. The implied CGE multiplier (Type 2A) for submarine sustainment in South Australia is 2.3. Type 2A multipliers are estimated as the Initial Effect plus the First Round Effect plus the Industrial Support Effect plus the Consumption Effect all divided by the Initial Effect. Each of these Effects is described in Attachment B.
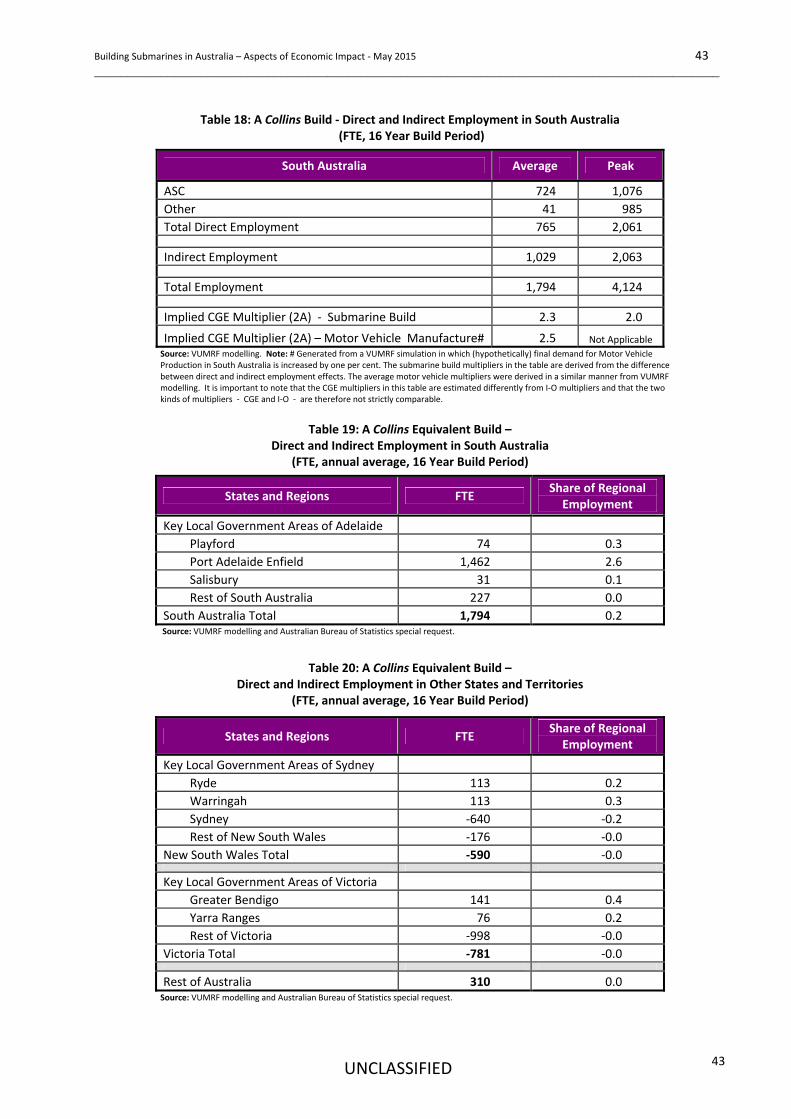
Building Submarines in Australia – Aspects of Economic Impact ‐ May 2015 43 ______________________________________________________________________________________________
UNCLASSIFIED
43
Table 18: A Collins Build ‐ Direct and Indirect Employment in South Australia
(FTE, 16 Year Build Period)
South Australia Average Peak
ASC 724 1,076
Other 41 985
Total Direct Employment 765 2,061
Indirect Employment 1,029 2,063
Total Employment 1,794 4,124
Implied CGE Multiplier (2A) ‐ Submarine Build 2.3 2.0
Implied CGE Multiplier (2A) – Motor Vehicle Manufacture# 2.5 Not Applicable
Source: VUMRF modelling. Note: # Generated from a VUMRF simulation in which (hypothetically) final demand for Motor Vehicle Production in South Australia is increased by one per cent. The submarine build multipliers in the table are derived from the difference between direct and indirect employment effects. The average motor vehicle multipliers were derived in a similar manner from VUMRF modelling. It is important to note that the CGE multipliers in this table are estimated differently from I‐O multipliers and that the two kinds of multipliers ‐ CGE and I‐O ‐ are therefore not strictly comparable.
Table 19: A Collins Equivalent Build –
Direct and Indirect Employment in South Australia (FTE, annual average, 16 Year Build Period)
States and Regions FTE Share of Regional Employment
Key Local Government Areas of Adelaide
Playford 74 0.3
Port Adelaide Enfield 1,462 2.6
Salisbury 31 0.1
Rest of South Australia 227 0.0
South Australia Total 1,794 0.2 Source: VUMRF modelling and Australian Bureau of Statistics special request.
Table 20: A Collins Equivalent Build – Direct and Indirect Employment in Other States and Territories
(FTE, annual average, 16 Year Build Period)
States and Regions FTE Share of Regional Employment
Key Local Government Areas of Sydney
Ryde 113 0.2
Warringah 113 0.3
Sydney ‐640 ‐0.2
Rest of New South Wales ‐176 ‐0.0
New South Wales Total ‐590 ‐0.0 Key Local Government Areas of Victoria
Greater Bendigo 141 0.4
Yarra Ranges 76 0.2
Rest of Victoria ‐998 ‐0.0
Victoria Total ‐781 ‐0.0
Rest of Australia 310 0.0 Source: VUMRF modelling and Australian Bureau of Statistics special request.
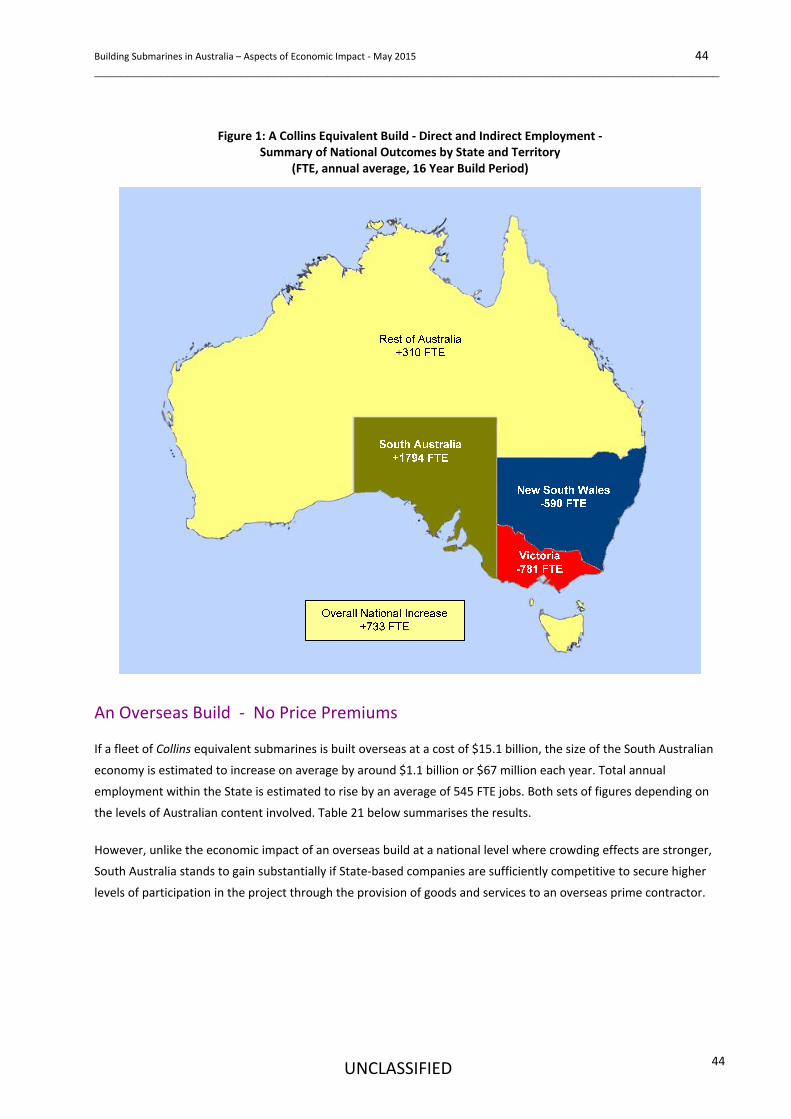
Building Submarines in Australia – Aspects of Economic Impact ‐ May 2015 44 ______________________________________________________________________________________________
UNCLASSIFIED
44
Figure 1: A Collins Equivalent Build ‐ Direct and Indirect Employment ‐ Summary of National Outcomes by State and Territory
(FTE, annual average, 16 Year Build Period)
An Overseas Build ‐ No Price Premiums
If a fleet of Collins equivalent submarines is built overseas at a cost of $15.1 billion, the size of the South Australian
economy is estimated to increase on average by around $1.1 billion or $67 million each year. Total annual
employment within the State is estimated to rise by an average of 545 FTE jobs. Both sets of figures depending on
the levels of Australian content involved. Table 21 below summarises the results.
However, unlike the economic impact of an overseas build at a national level where crowding effects are stronger,
South Australia stands to gain substantially if State‐based companies are sufficiently competitive to secure higher
levels of participation in the project through the provision of goods and services to an overseas prime contractor.
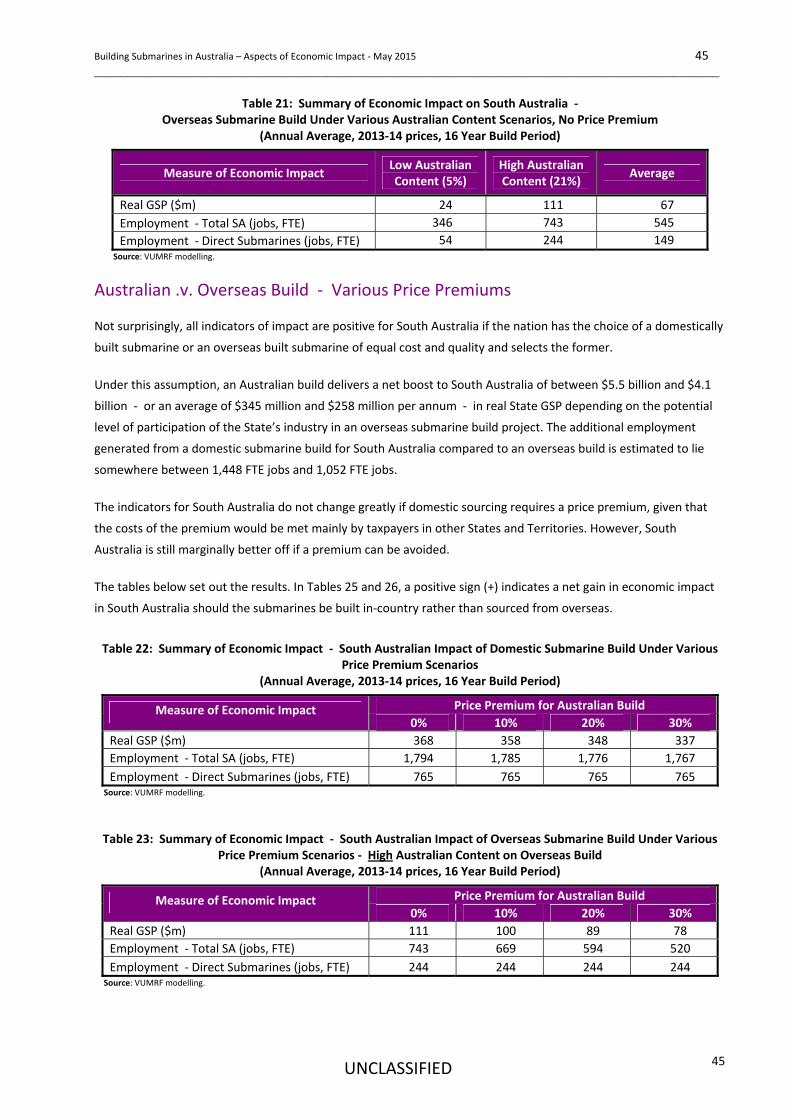
Building Submarines in Australia – Aspects of Economic Impact ‐ May 2015 45 ______________________________________________________________________________________________
UNCLASSIFIED
45
Table 21: Summary of Economic Impact on South Australia ‐ Overseas Submarine Build Under Various Australian Content Scenarios, No Price Premium
(Annual Average, 2013‐14 prices, 16 Year Build Period)
Measure of Economic Impact Low Australian Content (5%)
High Australian Content (21%)
Average
Real GSP ($m) 24 111 67
Employment ‐ Total SA (jobs, FTE) 346 743 545
Employment ‐ Direct Submarines (jobs, FTE) 54 244 149 Source: VUMRF modelling.
Australian .v. Overseas Build ‐ Various Price Premiums
Not surprisingly, all indicators of impact are positive for South Australia if the nation has the choice of a domestically
built submarine or an overseas built submarine of equal cost and quality and selects the former.
Under this assumption, an Australian build delivers a net boost to South Australia of between $5.5 billion and $4.1
billion ‐ or an average of $345 million and $258 million per annum ‐ in real State GSP depending on the potential
level of participation of the State’s industry in an overseas submarine build project. The additional employment
generated from a domestic submarine build for South Australia compared to an overseas build is estimated to lie
somewhere between 1,448 FTE jobs and 1,052 FTE jobs.
The indicators for South Australia do not change greatly if domestic sourcing requires a price premium, given that
the costs of the premium would be met mainly by taxpayers in other States and Territories. However, South
Australia is still marginally better off if a premium can be avoided.
The tables below set out the results. In Tables 25 and 26, a positive sign (+) indicates a net gain in economic impact
in South Australia should the submarines be built in‐country rather than sourced from overseas.
Table 22: Summary of Economic Impact ‐ South Australian Impact of Domestic Submarine Build Under Various
Price Premium Scenarios (Annual Average, 2013‐14 prices, 16 Year Build Period)
Price Premium for Australian Build Measure of Economic Impact 0% 10% 20% 30%
Real GSP ($m) 368 358 348 337
Employment ‐ Total SA (jobs, FTE) 1,794 1,785 1,776 1,767
Employment ‐ Direct Submarines (jobs, FTE) 765 765 765 765 Source: VUMRF modelling.
Table 23: Summary of Economic Impact ‐ South Australian Impact of Overseas Submarine Build Under Various Price Premium Scenarios ‐ High Australian Content on Overseas Build
(Annual Average, 2013‐14 prices, 16 Year Build Period)
Price Premium for Australian Build Measure of Economic Impact 0% 10% 20% 30%
Real GSP ($m) 111 100 89 78
Employment ‐ Total SA (jobs, FTE) 743 669 594 520
Employment ‐ Direct Submarines (jobs, FTE) 244 244 244 244 Source: VUMRF modelling.
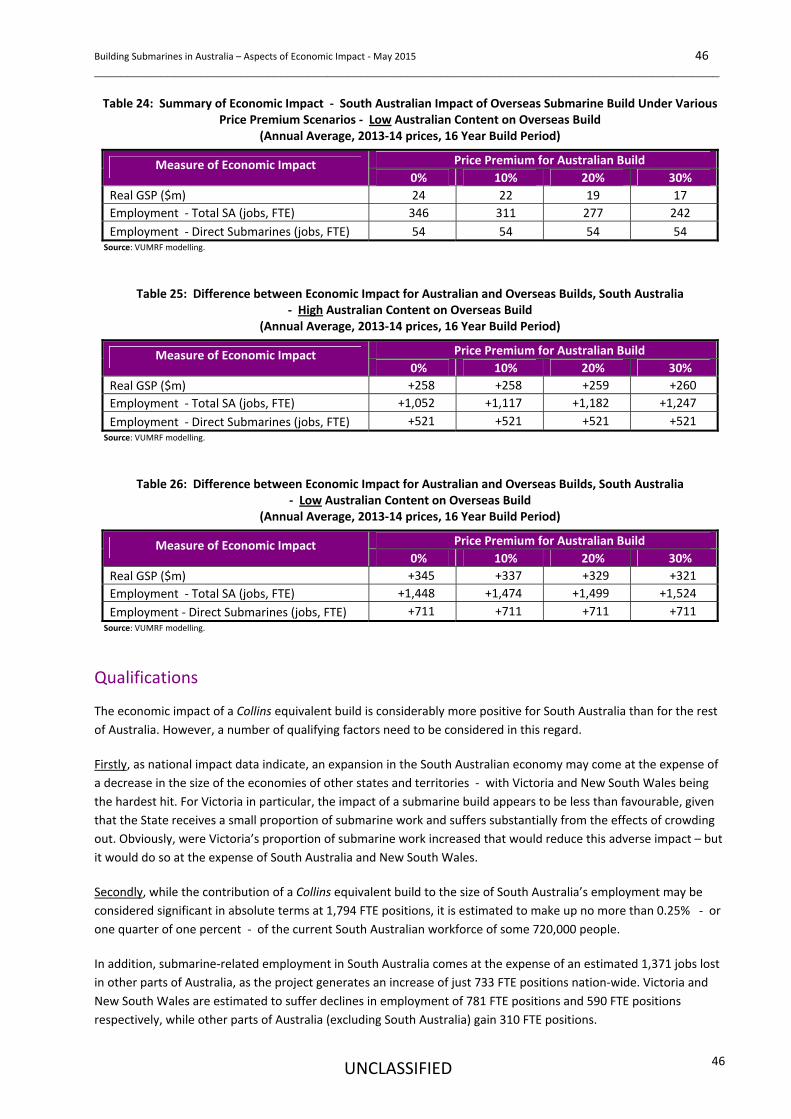
Building Submarines in Australia – Aspects of Economic Impact ‐ May 2015 46 ______________________________________________________________________________________________
UNCLASSIFIED
46
Table 24: Summary of Economic Impact ‐ South Australian Impact of Overseas Submarine Build Under Various Price Premium Scenarios ‐ Low Australian Content on Overseas Build
(Annual Average, 2013‐14 prices, 16 Year Build Period)
Price Premium for Australian Build Measure of Economic Impact 0% 10% 20% 30%
Real GSP ($m) 24 22 19 17
Employment ‐ Total SA (jobs, FTE) 346 311 277 242
Employment ‐ Direct Submarines (jobs, FTE) 54 54 54 54 Source: VUMRF modelling.
Table 25: Difference between Economic Impact for Australian and Overseas Builds, South Australia ‐ High Australian Content on Overseas Build
(Annual Average, 2013‐14 prices, 16 Year Build Period)
Price Premium for Australian Build Measure of Economic Impact 0% 10% 20% 30%
Real GSP ($m) +258 +258 +259 +260
Employment ‐ Total SA (jobs, FTE) +1,052 +1,117 +1,182 +1,247
Employment ‐ Direct Submarines (jobs, FTE) +521 +521 +521 +521 Source: VUMRF modelling.
Table 26: Difference between Economic Impact for Australian and Overseas Builds, South Australia ‐ Low Australian Content on Overseas Build
(Annual Average, 2013‐14 prices, 16 Year Build Period)
Price Premium for Australian Build Measure of Economic Impact 0% 10% 20% 30%
Real GSP ($m) +345 +337 +329 +321
Employment ‐ Total SA (jobs, FTE) +1,448 +1,474 +1,499 +1,524
Employment ‐ Direct Submarines (jobs, FTE) +711 +711 +711 +711 Source: VUMRF modelling.
Qualifications
The economic impact of a Collins equivalent build is considerably more positive for South Australia than for the rest
of Australia. However, a number of qualifying factors need to be considered in this regard.
Firstly, as national impact data indicate, an expansion in the South Australian economy may come at the expense of
a decrease in the size of the economies of other states and territories ‐ with Victoria and New South Wales being
the hardest hit. For Victoria in particular, the impact of a submarine build appears to be less than favourable, given
that the State receives a small proportion of submarine work and suffers substantially from the effects of crowding
out. Obviously, were Victoria’s proportion of submarine work increased that would reduce this adverse impact – but
it would do so at the expense of South Australia and New South Wales.
Secondly, while the contribution of a Collins equivalent build to the size of South Australia’s employment may be
considered significant in absolute terms at 1,794 FTE positions, it is estimated to make up no more than 0.25% ‐ or
one quarter of one percent ‐ of the current South Australian workforce of some 720,000 people.
In addition, submarine‐related employment in South Australia comes at the expense of an estimated 1,371 jobs lost
in other parts of Australia, as the project generates an increase of just 733 FTE positions nation‐wide. Victoria and
New South Wales are estimated to suffer declines in employment of 781 FTE positions and 590 FTE positions
respectively, while other parts of Australia (excluding South Australia) gain 310 FTE positions.
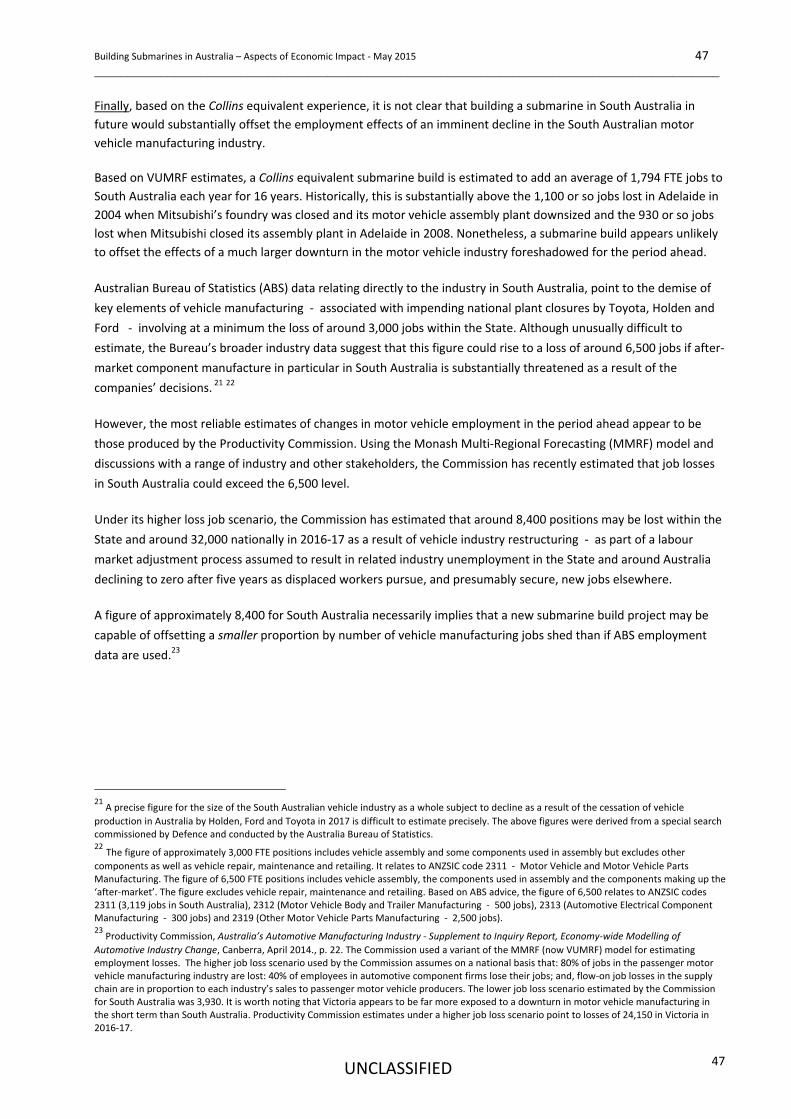
Building Submarines in Australia – Aspects of Economic Impact ‐ May 2015 47 ______________________________________________________________________________________________
UNCLASSIFIED
47
Finally, based on the Collins equivalent experience, it is not clear that building a submarine in South Australia in
future would substantially offset the employment effects of an imminent decline in the South Australian motor
vehicle manufacturing industry.
Based on VUMRF estimates, a Collins equivalent submarine build is estimated to add an average of 1,794 FTE jobs to
South Australia each year for 16 years. Historically, this is substantially above the 1,100 or so jobs lost in Adelaide in
2004 when Mitsubishi’s foundry was closed and its motor vehicle assembly plant downsized and the 930 or so jobs
lost when Mitsubishi closed its assembly plant in Adelaide in 2008. Nonetheless, a submarine build appears unlikely
to offset the effects of a much larger downturn in the motor vehicle industry foreshadowed for the period ahead.
Australian Bureau of Statistics (ABS) data relating directly to the industry in South Australia, point to the demise of
key elements of vehicle manufacturing ‐ associated with impending national plant closures by Toyota, Holden and
Ford ‐ involving at a minimum the loss of around 3,000 jobs within the State. Although unusually difficult to
estimate, the Bureau’s broader industry data suggest that this figure could rise to a loss of around 6,500 jobs if after‐
market component manufacture in particular in South Australia is substantially threatened as a result of the
companies’ decisions. 21 22
However, the most reliable estimates of changes in motor vehicle employment in the period ahead appear to be
those produced by the Productivity Commission. Using the Monash Multi‐Regional Forecasting (MMRF) model and
discussions with a range of industry and other stakeholders, the Commission has recently estimated that job losses
in South Australia could exceed the 6,500 level.
Under its higher loss job scenario, the Commission has estimated that around 8,400 positions may be lost within the
State and around 32,000 nationally in 2016‐17 as a result of vehicle industry restructuring ‐ as part of a labour
market adjustment process assumed to result in related industry unemployment in the State and around Australia
declining to zero after five years as displaced workers pursue, and presumably secure, new jobs elsewhere.
A figure of approximately 8,400 for South Australia necessarily implies that a new submarine build project may be
capable of offsetting a smaller proportion by number of vehicle manufacturing jobs shed than if ABS employment
data are used.23
21 A precise figure for the size of the South Australian vehicle industry as a whole subject to decline as a result of the cessation of vehicle
production in Australia by Holden, Ford and Toyota in 2017 is difficult to estimate precisely. The above figures were derived from a special search commissioned by Defence and conducted by the Australia Bureau of Statistics. 22 The figure of approximately 3,000 FTE positions includes vehicle assembly and some components used in assembly but excludes other
components as well as vehicle repair, maintenance and retailing. It relates to ANZSIC code 2311 ‐ Motor Vehicle and Motor Vehicle Parts Manufacturing. The figure of 6,500 FTE positions includes vehicle assembly, the components used in assembly and the components making up the ‘after‐market’. The figure excludes vehicle repair, maintenance and retailing. Based on ABS advice, the figure of 6,500 relates to ANZSIC codes 2311 (3,119 jobs in South Australia), 2312 (Motor Vehicle Body and Trailer Manufacturing ‐ 500 jobs), 2313 (Automotive Electrical Component Manufacturing ‐ 300 jobs) and 2319 (Other Motor Vehicle Parts Manufacturing ‐ 2,500 jobs). 23 Productivity Commission, Australia’s Automotive Manufacturing Industry ‐ Supplement to Inquiry Report, Economy‐wide Modelling of
Automotive Industry Change, Canberra, April 2014., p. 22. The Commission used a variant of the MMRF (now VUMRF) model for estimating employment losses. The higher job loss scenario used by the Commission assumes on a national basis that: 80% of jobs in the passenger motor vehicle manufacturing industry are lost: 40% of employees in automotive component firms lose their jobs; and, flow‐on job losses in the supply chain are in proportion to each industry’s sales to passenger motor vehicle producers. The lower job loss scenario estimated by the Commission for South Australia was 3,930. It is worth noting that Victoria appears to be far more exposed to a downturn in motor vehicle manufacturing in the short term than South Australia. Productivity Commission estimates under a higher job loss scenario point to losses of 24,150 in Victoria in 2016‐17.
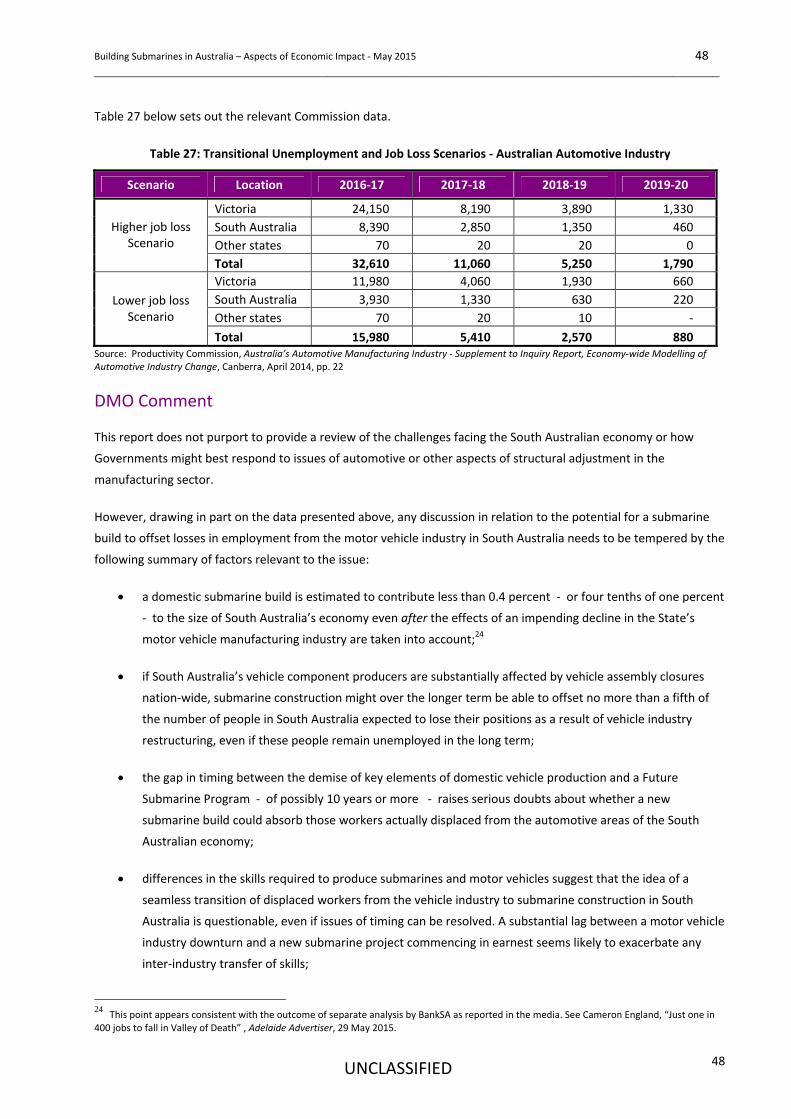
Building Submarines in Australia – Aspects of Economic Impact ‐ May 2015 48 ______________________________________________________________________________________________
UNCLASSIFIED
48
Table 27 below sets out the relevant Commission data.
Table 27: Transitional Unemployment and Job Loss Scenarios ‐ Australian Automotive Industry
Scenario Location 2016‐17 2017‐18 2018‐19 2019‐20
Victoria 24,150 8,190 3,890 1,330
South Australia 8,390 2,850 1,350 460
Other states 70 20 20 0
Higher job loss Scenario
Total 32,610 11,060 5,250 1,790
Victoria 11,980 4,060 1,930 660
South Australia 3,930 1,330 630 220
Other states 70 20 10 ‐
Lower job loss Scenario
Total 15,980 5,410 2,570 880 Source: Productivity Commission, Australia’s Automotive Manufacturing Industry ‐ Supplement to Inquiry Report, Economy‐wide Modelling of Automotive Industry Change, Canberra, April 2014, pp. 22
DMO Comment
This report does not purport to provide a review of the challenges facing the South Australian economy or how
Governments might best respond to issues of automotive or other aspects of structural adjustment in the
manufacturing sector.
However, drawing in part on the data presented above, any discussion in relation to the potential for a submarine
build to offset losses in employment from the motor vehicle industry in South Australia needs to be tempered by the
following summary of factors relevant to the issue:
a domestic submarine build is estimated to contribute less than 0.4 percent ‐ or four tenths of one percent
‐ to the size of South Australia’s economy even after the effects of an impending decline in the State’s
motor vehicle manufacturing industry are taken into account;24
if South Australia’s vehicle component producers are substantially affected by vehicle assembly closures
nation‐wide, submarine construction might over the longer term be able to offset no more than a fifth of
the number of people in South Australia expected to lose their positions as a result of vehicle industry
restructuring, even if these people remain unemployed in the long term;
the gap in timing between the demise of key elements of domestic vehicle production and a Future
Submarine Program ‐ of possibly 10 years or more ‐ raises serious doubts about whether a new
submarine build could absorb those workers actually displaced from the automotive areas of the South
Australian economy;
differences in the skills required to produce submarines and motor vehicles suggest that the idea of a
seamless transition of displaced workers from the vehicle industry to submarine construction in South
Australia is questionable, even if issues of timing can be resolved. A substantial lag between a motor vehicle
industry downturn and a new submarine project commencing in earnest seems likely to exacerbate any
inter‐industry transfer of skills;
24 This point appears consistent with the outcome of separate analysis by BankSA as reported in the media. See Cameron England, “Just one in 400 jobs to fall in Valley of Death” , Adelaide Advertiser, 29 May 2015.
Building Submarines in Australia – Aspects of Economic Impact ‐ May 2015 49 ______________________________________________________________________________________________
UNCLASSIFIED
49
many or even most of the vehicle manufacturing workers in South Australia who could possibly be helped
as a result of a submarine build might only obtain a job at the expense of other people around the country,
given the economic crowding out effects estimated from VUMRF modelling likely to be associated with a
submarine build at a national level;
available evidence suggests that economic activities other than submarine construction might be able to
offer employment opportunities for a substantial proportion of those displaced by a vehicle industry
downturn;
State and Commonwealth Government assistance measures are in place to assist retrenched automotive
industry workers pursue new employment opportunities; and
as the Productivity Commission has noted, defence capital equipment projects might not be the most
economically efficient method for remedying the effects of changes in automotive industry structure
especially if a price premium must be paid to support domestic submarine production.
These points bring out one of the most important policy issues relevant to the economic impact of a submarine
project: if it is accepted that the economy is capable of re‐absorbing over time the relatively large number of
generally lower skilled workers engaged in motor vehicle manufacture, as recent developments in relation to
manufacturing industry policy suggest, then it might also be argued that the same economy should be able to absorb
the much smaller number of more highly skilled workers which would be notionally ‘displaced’ if a new class of
submarines was built overseas rather than in Australia.
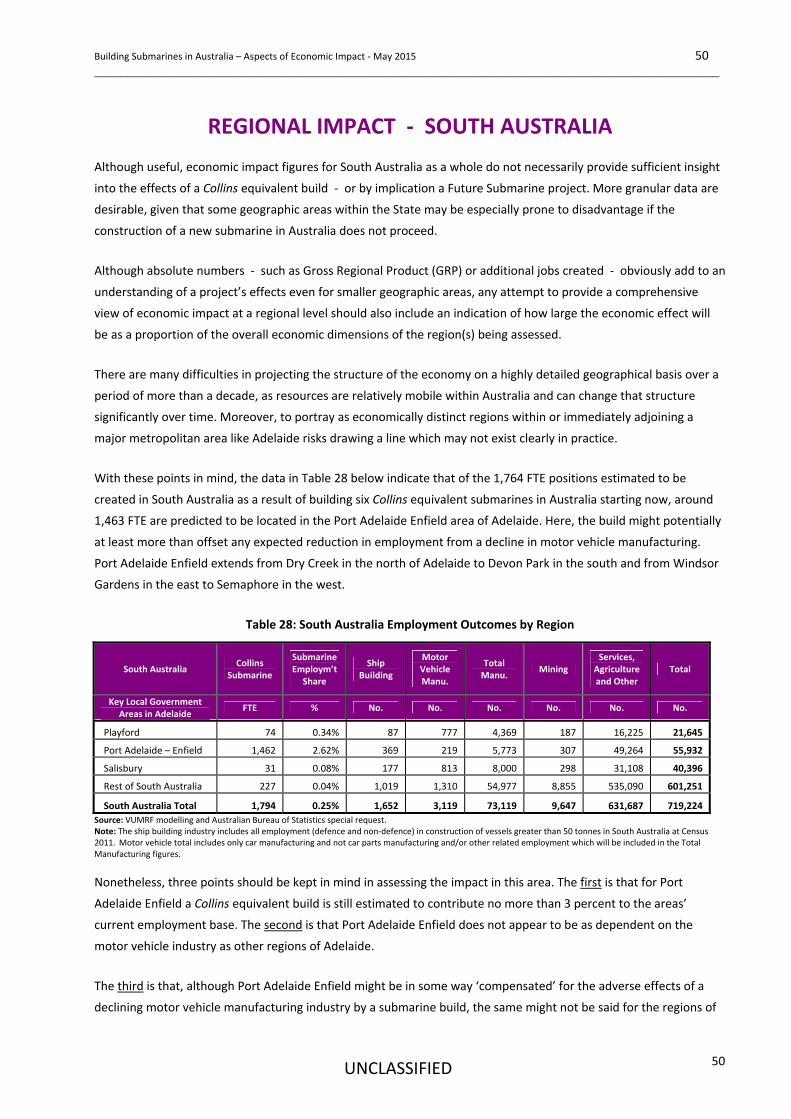
Building Submarines in Australia – Aspects of Economic Impact ‐ May 2015 50 ______________________________________________________________________________________________
UNCLASSIFIED
50
REGIONAL IMPACT ‐ SOUTH AUSTRALIA
Although useful, economic impact figures for South Australia as a whole do not necessarily provide sufficient insight
into the effects of a Collins equivalent build ‐ or by implication a Future Submarine project. More granular data are
desirable, given that some geographic areas within the State may be especially prone to disadvantage if the
construction of a new submarine in Australia does not proceed.
Although absolute numbers ‐ such as Gross Regional Product (GRP) or additional jobs created ‐ obviously add to an
understanding of a project’s effects even for smaller geographic areas, any attempt to provide a comprehensive
view of economic impact at a regional level should also include an indication of how large the economic effect will
be as a proportion of the overall economic dimensions of the region(s) being assessed.
There are many difficulties in projecting the structure of the economy on a highly detailed geographical basis over a
period of more than a decade, as resources are relatively mobile within Australia and can change that structure
significantly over time. Moreover, to portray as economically distinct regions within or immediately adjoining a
major metropolitan area like Adelaide risks drawing a line which may not exist clearly in practice.
With these points in mind, the data in Table 28 below indicate that of the 1,764 FTE positions estimated to be
created in South Australia as a result of building six Collins equivalent submarines in Australia starting now, around
1,463 FTE are predicted to be located in the Port Adelaide Enfield area of Adelaide. Here, the build might potentially
at least more than offset any expected reduction in employment from a decline in motor vehicle manufacturing.
Port Adelaide Enfield extends from Dry Creek in the north of Adelaide to Devon Park in the south and from Windsor
Gardens in the east to Semaphore in the west.
Table 28: South Australia Employment Outcomes by Region
South Australia Collins
Submarine
Submarine Employm’t
Share
Ship Building
Motor Vehicle Manu.
Total Manu.
Mining Services, Agriculture and Other
Total
Key Local Government Areas in Adelaide
FTE % No. No. No. No. No. No.
Playford 74 0.34% 87 777 4,369 187 16,225 21,645
Port Adelaide – Enfield 1,462 2.62% 369 219 5,773 307 49,264 55,932
Salisbury 31 0.08% 177 813 8,000 298 31,108 40,396
Rest of South Australia 227 0.04% 1,019 1,310 54,977 8,855 535,090 601,251
South Australia Total 1,794 0.25% 1,652 3,119 73,119 9,647 631,687 719,224
Source: VUMRF modelling and Australian Bureau of Statistics special request. Note: The ship building industry includes all employment (defence and non‐defence) in construction of vessels greater than 50 tonnes in South Australia at Census 2011. Motor vehicle total includes only car manufacturing and not car parts manufacturing and/or other related employment which will be included in the Total Manufacturing figures.
Nonetheless, three points should be kept in mind in assessing the impact in this area. The first is that for Port
Adelaide Enfield a Collins equivalent build is still estimated to contribute no more than 3 percent to the areas’
current employment base. The second is that Port Adelaide Enfield does not appear to be as dependent on the
motor vehicle industry as other regions of Adelaide.
The third is that, although Port Adelaide Enfield might be in some way ‘compensated’ for the adverse effects of a
declining motor vehicle manufacturing industry by a submarine build, the same might not be said for the regions of

Building Submarines in Australia – Aspects of Economic Impact ‐ May 2015 51 ______________________________________________________________________________________________
UNCLASSIFIED
51
Adelaide in which motor vehicle production is currently concentrated ‐ including Playford and Salisbury ‐ or for the
State as a whole. For these geographic localities, a Collins equivalent build does not seem capable of having strong
offsetting employment effects ‐ although it is important to note that, for Playford at least, local levels of
unemployment well above the national average suggest that any contribution to local economic activity may be
especially welcome.
The socio‐economic impact of a submarine build in those regions of South Australia prone to unusually high levels of
unemployment may warrant closer scrutiny.
Building Submarines in Australia – Aspects of Economic Impact ‐ May 2015 52 ______________________________________________________________________________________________
UNCLASSIFIED
52
SPILLOVERS
The Concept
Most models of the economy do not deal fully with one aspect of potential economic impact which has attracted
considerable public comment but thus far proven unusually difficult to quantify, namely spillovers.
There is no universally accepted approach to defining and categorising spillovers. However, they might be described
in broad terms as any benefit a project generates ‐ typically through some kind of knowledge created from research
and development (R&D) ‐ which goes beyond the project itself but for which its owners and operators are not fully
compensated in financial terms. Put simply, spillovers are transfers of knowledge beyond the project which are
made available to others at a price less than the value of the benefits they deliver. Such spillovers promote
productivity growth in the economy as a whole and, in this sense, are akin to a positive shock to the economy’s
productive potential.
Additionally, the term may refer to indirect effects the project has on the structure and functioning of markets. For
example, if the project generating a spillover expands the local market for a particular input, it may make the supply
of that input more competitive through facilitating the exploitation of economies of scale or scope. This in turn could
benefit purchasers of that input through lower prices and improved product quality. Equally, a larger local market
may facilitate local production of the input, potentially economising on transport costs as well as the costs local
buyers face in identifying and managing their sources of supply. Finally, the co‐location of several activities that are
in the same industry, or use similar inputs, might further accelerate the diffusion of new technologies and skills.
In economic terms, spillover benefits are ‘external’ to the project. They do not enter into the costs directly
attributable to the project nor the benefits accruing to users of goods or services the project produces. In this sense,
the project is not able to ‘appropriate’ the gains which spillovers deliver.
This creates a divergence between the project‐specific return ‐ which measures the net benefit to those
undertaking the project, after taking into account the project’s costs ‐ and the return to society as whole which also
includes the value of any spillovers along with any incremental costs of securing them.
From this, the extent of any spillovers can be measured as the difference between the social and private returns on
the investment made in the project, after allowing for the fact that the resources that investment absorbed might
have been diverted for other purposes.
The Implications
The inability of the investor in the project to fully capture a project’s broader benefits can give rise to ‘imperfections’
in the way investment decisions in relation to the project are made. In particular, in deciding whether or not to
proceed with the project or in selecting among alternative ways in which the project might proceed, the investor
may not take account of the wider gains to society. Investment decisions might be distorted as a result. For example,
it may be that had the wider gains been fully taken into account, more resources would have been invested in the
project.
Building Submarines in Australia – Aspects of Economic Impact ‐ May 2015 53 ______________________________________________________________________________________________
UNCLASSIFIED
53
The risk of this kind of under‐investment is often viewed as justifying a Government response ‐ and has proven
attractive to proponents of the acquisition of major items of Defence capital equipment from Australian rather than
overseas suppliers. The concept implies that Defence should be willing to pay a price premium to acquire some
goods and services produced domestically, as this generates wider benefits that ultimately accrue to the Australian
economy.
Intra and Inter Firm Productivity Effects
Spillovers can create economic value on the production side of the economy through enabling the use of fewer
resources to deliver the same volume of output or, expressed another way, the use of the same amount of
resources to achieve a higher output level. Society gains from increased productivity by being able to obtain more
from the limited resources at its disposal.
More specifically, spillovers from defence projects may arise through:
the project leading to, or in other ways facilitating, the development of new products which have value
above and beyond their use in the project itself;
the development of more efficient production technologies or processes which lower production costs;
the development of new skills which make the workforce more productive; and
external economies of scale, where increased activity in an industry leads to reductions in costs for other
industry participants including those in the extended supply chain.25
In this context, spillovers have two dimensions. One involves the firm that is undertaking the project generating
new knowledge which it uses to improve its own performance. The technologies or skills involved can be embodied
in a process or a finished good or service or exist separately. For example, a firm might in the course of a project
develop a better process for welding steel plate which can be used in another area of the firm to enhance that area’s
productivity.
In this case, the benefits are captured within the firm but not in the project which generated them. If the firm prices
these benefits into its bid for the project, as it would in a strongly competitive environment, the buyer will face the
correct incentive in relation to the scale on which the project is undertaken. If not, the scale of the project might
differ from that which makes society best off.
The other, perhaps more commonly cited, dimension to spillovers involves new knowledge which a firm develops
but is then used by others. In this case, the impact might be felt within the firm’s own supply chain, other firms
working in the same industry (like defence) or firms working in completely different industries.
Spillovers extending beyond the investor’s own business normally arise for several reasons:
the organisation which generated the knowledge may be unable to prevent others from using it without
itself incurring heavy costs (imitation, reverse engineering and the transfer of knowhow as a result of
movements in personnel are common occurrences); and
25 From these points, a domestic submarine build leading to reductions in the domestic costs of submarine sustainment would ‐ if the reductions
actually occurred ‐ qualify as a spillover.
Building Submarines in Australia – Aspects of Economic Impact ‐ May 2015 54 ______________________________________________________________________________________________
UNCLASSIFIED
54
a given piece of new technological knowledge can be employed simultaneously by any number of firms at
no extra cost of provision, without the intrinsic usefulness of the knowledge being diminished for any one
of them.26
These kinds of spillovers can play an important role in economic models. For example, in models of endogenous
economic growth, the fact that once a design or a blueprint has been created it can be used repeatedly at no extra
cost can underpin growth that is more rapid and sustained than traditional models allow for, especially if innovation
today facilities innovation tomorrow. Equally, in the ‘new economic geography’, regions and countries may gain a
cumulative advantage if spillovers occur more readily within a cluster of co‐located firms than they do when firms
operate at a distance (in other words, if there are ‘economies of agglomeration’).
However, because the knowledge being transferred is effectively under‐priced (as the gains are not fully captured by
the innovator), its originators may lack the incentive to invest enough in research or other spillover‐generating
activities. Some form of Government intervention may be required to overcome the problem and kick‐start what is
expected to become a self perpetuating processes for knowledge development and diffusion.
In the case of a domestic submarine build, government intervention might take several forms: Defence paying a
higher price ‐ or ‘price premium’ ‐ for a submarine built in Australia rather than overseas; the Department
providing the submarine builder or its suppliers with grants or other types of financial incentives to undertake more
research and development or skilling projects than it otherwise would; or, waiving the Commonwealth’s ownership
rights to the submarine research and development it has funded.27
That said, the theoretical case underpinning spillovers is far better developed than their empirical measurement.
Indeed, it is in the nature of spillovers ‐ as un‐priced or under‐priced effects that may be quite remote from the
project in which they originated ‐ that their practical identification and quantification will prove problematic.
Considerable care is therefore required in advancing claims of substantial spillover effects.
The Defence Environment
The creation and diffusion of knowledge in a defence‐specific environment is often viewed in terms of two
conflicting influences. On the one hand, defence expenditure may encourage the development of knowledge more
sophisticated than that required in the commercial sector and so promote ‘leading edge’ innovation. From sustained
expenditure of this kind, knowledge accumulates over time and the costs of its application diminish with economies
of scale ‐ to the point where the knowledge becomes attractive to others, inside and outside defence industry who
adopt and adapt it to new uses.
In a defence environment, these processes are most likely to operate where: projects are well funded and have a
major R&D or training element, with at least some of that R&D or training being of general applicability; firms
generating and receiving new knowledge group together in geographic clusters and outsource to each other; skilled
labour is relatively mobile within and between firms; technical training institutions support the work of defence
contractors; foreign‐owned subsidiaries of international defence firms are willing to transfer skilled personnel and
26 Industry Assistance Commission, Research and Development, Canberra, 1995, p. 64. 27 Ibid., p.153.
Building Submarines in Australia – Aspects of Economic Impact ‐ May 2015 55 ______________________________________________________________________________________________
UNCLASSIFIED
55
intellectual property from their overseas parents to Australia; and, entrepreneurial drive to start new ventures is
high and the barriers to new firm creation are low.
However, while these factors may suggest spillovers could be significant, there are also factors that point the other
way in a submarine context:
the firm undertaking a major defence project usually has a strong incentive to tailor its efforts to the
specific needs of its customer, Defence, with the requirements of other users being afforded a lower
priority. This is all the more so if those users are not contributing to the project’s cost;
the very specialised nature of the knowledge required to meet Defence’s needs means the innovation and
skills developed in a project may not necessarily be those with the highest capacity to improve productivity
within other areas of defence industry or beyond;28
spillover or external benefits are likely to be far greater for basic research and development than for the
kinds of purpose‐specific innovation characterising much of the construction of complex weapons systems
including submarines;
while in some areas of defence there are parallels between defence and civilian systems ‐ for example, the
development of airframes for strategic bombers had a substantial bearing on commercial aircraft ‐ there
are few overlaps between submarines and civilian vessels; and
the most significant new technologies that might emerge from building these systems may well be those
connected with Australia seeking to achieve military superiority. These technologies are normally withheld
from other markets for reasons of national security, given that the primary purpose of building weapons
suited to Australia’s needs is to not only secure a military advantage but to hold that advantage for as long
as possible.
The South Australian Government View
(i) The Position
The potential magnitude of spillovers from a domestic submarine build has recently been described by the South
Australian Government in the following terms:
“Whilst the potential should not be overstated, extremely detailed analysis by Professor
Gunnar Eliasson has shown that a major industrial government project of appropriate
complexity has the potential to generate a flow of technology spin‐offs which, depending
on the capacity of local industry to exploit, could produce an economic return to match or
partially offset the level of government investment in the original project.
Through this analysis, Eliasson has demonstrated that the Swedish JAS 39 Gripen aircraft
project generated, over and above opportunity costs, an additional return to the Swedish
economy of at least 2.6 times the original development investment over a 25 year period,
28 For a discussion on the more general issues involved see Saal D.A. “The Impact of Procurement‐Driven Technological Change on U.S.
Manufacturing Productivity Growth”, Defence and Peace Economics, 12(6), pp. 537‐568, especially p. 540. Saal measures the rate of total factor productivity as the efficiency in use of all primary factors of production – capital and labour. A one per cent increase in efficiency in use means that to produce the same level of output, one per cent fewer physical inputs of labour and capital are required.
Building Submarines in Australia – Aspects of Economic Impact ‐ May 2015 56 ______________________________________________________________________________________________
UNCLASSIFIED
56
equating to an average investment per year of 0.17 per cent of GNP against an annual
return of 0.43 per cent. In effect, the Swedish people got one of the world’s most advanced
combat aircraft systems for free.”29
(ii) The Calculation
The comments by the South Australian Government provide limited insights into the mechanics behind the
estimation of the (potential) spillover effects involved. However, the figure of 2.6 appears to have been estimated by
Professor Eliasson as follows.
The cost of developing the Gripen jet fighter over the period 1982 to 2007 was 77 billion Swedish Kronor (SEK) in
2007 prices. The benefits from this investment were estimated to be 350 billion SEK over the same period, measured
in terms of an increase in Sweden’s Gross Domestic Product (GDP).
These benefits emerged from a combination of new firm formation, productivity improvements in existing
commercial companies in Sweden and exports of the Gripen aircraft. They covered both intra‐firm and inter‐firm
spillover effects and were measured net of opportunity costs in the form of the new products or improved
productivity that was either displaced by the Gripen fighter project or would have occurred anyway if the project
had not proceeded.
On this basis, the (opportunity) costs of the investment were estimated to be 131.5 billion SEK ‐ from investing the
original 77 billion SEK on financial markets at an annual rate of return of 4 percent between 1982 and 2007. That is,
the opportunity cost was defined as the present value of the amount of capital invested in the development of the
Gripen if it had been directed to financial markets instead. These markets were assumed to have been the next best
alternative use for investment funding.
From this, the benefit:cost ratio of investing in the R&D elements of Gripen equated to 2.6 ‐ calculated as 350
billion SEK/131.5 billion SEK. Professor Eliasson noted that a figure of 2.6 may be conservative in the sense of
excluding what spillovers may do in adding to market competition within the economy and lowering consumer
prices.
The Eliasson ‘spillover multiplier’ is a ratio comparing the development cost of the Gripen aircraft to the change in
Sweden’s economic welfare measured by GDP. It indicates that Sweden was able to recoup the original value of its
R&D investment plus generate economic growth equal to 1.6 times the value of that investment after taking into
account the investment’s opportunity cost (as defined by Professor Eliasson). For every 1 SEK invested by the
originator of a new technology or skill after adjusting for the opportunity cost involved, a further 1.6 SEK in
economic activity was generated within or outside the firms involved which flowed to Swedish society at large.30
29 Defence SA Advisory Board, Guarding our Edge ‐ Building and Sustaining the Future Submarine in Australia, Adelaide, 2012, p. 21. 30 The calculation method used by Professor Eliasson is described in Eliasson G. Public Procurement as Innovation Policy ‐ The Case of the Swedish
Multipurpose Combat Aircraft Gripen, Paper to be presented to the 15th International Joseph A. Schumpeter Conference, Jena, Germany, July 27‐30th, 2014, pp. 2‐3. However, it is not clear from Professor Eliasson’s analysis who this benefit accrued to i.e. how much of it was captured by the firms undertaking the project as against the benefit that flowed to the Swedish economy more generally.
Building Submarines in Australia – Aspects of Economic Impact ‐ May 2015 57 ______________________________________________________________________________________________
UNCLASSIFIED
57
DMO Comment
With this as background, the comments of the South Australian Government cited above are clear in suggesting that,
subject to appropriate qualifications, an Australian submarine build might have significant spillover effects.
Nonetheless, any claim that the return from a build of this kind might be high enough to offset most or all of the cost
of submarines can questioned on at least eight counts.
(i) Aircraft‐Submarine Comparisons
The first is that thus far the only inferences made in relation to the spillovers from an Australian built submarine are
those drawn from Swedish aircraft. A better basis for comparison/extrapolation might be from Swedish submarine
production to Australian submarine production.
Sweden has a well developed conventional submarine industry. Indeed, Australia’s Collins class submarines are
based on a Swedish design. Swedish submarine builder, Kockums, appears to share many similarities with ASC in
terms of its size, structure and degree of business diversification. With this in mind, it is unusual that the same
spillovers analysis for Gripen aircraft in Sweden has apparently not been carried out for submarines in Sweden or
that few comparisons appear to have been made between the Gripen spillovers experience and spillovers for a
broader range of Swedish defence capital equipment projects.31
As a general observation, the aviation industry appears to have been associated with a larger number of new
technologies with broad application ‐ including composite materials ‐ than shipbuilding whose track‐record for
innovation has been less obvious with the possible exception of specialised paints.
In addition, it is worth noting that although Sweden successfully developed the Gripen project which in turn
generated substantial spillovers, Sweden appears to have had much less success in fostering a domestic commercial
shipbuilding industry. By all accounts, the Swedish Government lost large amounts of money during the 1970s in
attempting to support its own commercial shipbuilding industry in the face of competition from other countries
including those in Asia. This experience may reflect in part the intrinsic differences between shipbuilding ‐ where
spillover effects are more difficult to create ‐ and aircraft manufacture whose industrial structure appears more
open to spillover activity.32
(ii) Underlying Mechanics
The second is that although a spillovers multiplier of 2.6 has been inferred for submarine construction in Australia it
has not been supported by a description of how the generation and transfer of relevant knowledge occurs. In
particular, the path by which the presumed transfers of knowledge ‐ within the submarine builder, beyond the
builder but inside the broader submarine construction industry or more widely ‐ take place have not been clearly
articulated. Claims that spillovers of a certain magnitude are likely to occur are obviously strengthened if the
mechanisms causing those effects are transparent.
31 In its October 2014 study on the economic impact of building submarines in Australia, the National Institute of Economic and Industry Research
(NIEIR) refer to Swedish research showing a submarine spillovers multiplier of 3. However, the study did not publish the source of this figure. Several attempts were made by DMO to contact NIEIR in relation to where the figure of 3 had been produced and how it had been derived but no response from the Institute has yet been received. 32 Edward G. Keating et. al., The Economic Consequences of Investing in Shipbuilding, Rand Corporation, Santa Monica, 2015, p. 55.
Building Submarines in Australia – Aspects of Economic Impact ‐ May 2015 58 ______________________________________________________________________________________________
UNCLASSIFIED
58
More specifically, advocates of an Australian submarine build based on spillovers have provided little evidence to
shed light on the following issues: what activities the spillovers involve; why the originators of spillovers are unable
to capture the full benefits of their investment; the degree to which the value of spillovers emerging from a
submarine build might dissipate over time; and, the possibility that these spillovers might be confused with
spillovers from other industries which a submarine build enjoys.
In addition, limited attention has been given to the intrinsic limitations which might prevent new knowledge
developed from a submarine build project being used elsewhere. For example, submarines need to operate with
very high degrees of reliability under extreme physical conditions. For this reason alone, the vessels might as a
general rule need to rely less on technologies that are new or experimental and more on those with an already
proven track record. Proven technologies tend to be associated with lower spillover effects. Submarines also
operate in such a specific medium, namely underwater in a combat role, that the technologies they employ could
have limited application even in the larger sea surface, land or air environments in which modern Defence Forces
must operate. Their applicability in a civilian environment is, of course, likely to be even more limited.
(iii) The R&D Base
The third is that although covering intra‐firm and inter‐firm effects, the spillover multiplier associated with Eliasson’s
work on Gripen aircraft of 2.6 relates only to the realisable research and development (R&D) element of a
submarine build.
However, from a purely R&D perspective, the Gripen experience appears somewhat unusual. Between 1982 and
2007, the R&D cost of the project (including the production of prototype aircraft) far exceeded the subsequent value
of aircraft manufacture ‐ 77 billion Swedish Kronor for R&D versus 45 billion Swedish Kronor for manufacture, all
expressed in constant 2007 prices. That is, R&D accounted for around 60 percent of the project’s total cost.
A 2.6 spillovers multiplier applied to this kind of R&D expenditure base will necessarily produce estimates of a very
large social benefit. Indeed, it delivers a net benefit essentially equal to the value of the entire Gripen project ‐ to
support the claim that Sweden got the Gripen “for free”.33
With this in mind, noticeably absent from most public discussion on the extent of spillovers from an Australian
submarine build is an estimate of the proportion of the cost of the submarines to which a spillovers multiplier of 2.6
or any other number should be applied.
There are two reasons for suspecting that the same level of R&D intensity as applied to the Gripen may not
necessarily apply in an Australian submarine environment. One is that the majority of technology spillovers
identified in relation to Gripen arise from original design work. However, if one of the principal purposes of selecting
a new class of submarine for Australia is to minimise technical ‐ and therefore financial ‐ risk, by drawing as much
as possible on already well tested solutions, the same degree of R&D intensity may not apply.
33 (60% of the value of the project x 2.6} – (60% of the value of the project) = 96% of the value of the project. The calculation method used by
Professor Eliasson is described in Eliasson G., Public Procurement as Innovation Policy ‐ The Case of the Swedish Multipurpose Combat Aircraft Gripen, op. cit., p. 5
Building Submarines in Australia – Aspects of Economic Impact ‐ May 2015 59 ______________________________________________________________________________________________
UNCLASSIFIED
59
The other is that a review by DMO of Defence’s outlays on the Collins build suggests that even on that project, which
had a significant developmental component, outlays on the inputs most likely to generate spillovers accounted for a
relatively small share of total project costs.
Pumps, carbon fibre, glass reinforced plastic, welding, steel, integrated logistic support, block build strategies,
batteries and anechoic coatings and adhesives are the aspects of a Collins build most frequently cited as having
spillovers potential. Yet DMO estimates suggest that the total amounts of Defence expenditure going into these
areas in Australia accounted for no more than 1.6 percent of the costs incurred in the project’s initial build phase.
This figure will understate a spillovers base by excluding a workforce skilling component ‐ although at least some of
this effect is likely to be offset by the fact that the Gripen project had an estimated white collar workforce of around
75 percent compared to the estimated Collins white collar workforce of around 55 percent. However, it may
substantially overstate the technology cost base to which a spillovers multiplier should be applied by covering the
total value of the goods and services provided under each product category rather than their R&D element.
In a recent study commissioned by the South Australian Government, NIEIR estimated that research and
development would absorb around 4 percent of the total costs a building a new class submarine. Clearly, both the
DMO and NIEIR figures of an R&D expenditure base differ markedly from those of the Gripen experience. The next
section of the report reviews the NIEIR study in more detail including its overall approach to estimating spillover
effects.
(iv) Receiver Competence
A fourth qualification on generalising from the Swedish experience is that realising a spillovers multiplier of 2.6
depends critically on the ‘local entrepreneurial environment’. Even if a new piece of knowledge is created through a
domestic submarine project, it requires a range of supporting companies in‐country to take the idea and either use it
to improve productivity or develop it into another type of product ‐ ‘receiver competence’. The absence of strong
commercialisation abilities of these kinds might negate most, if not all, potential spillover effects.34
The example of the Gripen aircraft helps to illustrate the point. The three largest companies working on the Gripen
project ‐ Ericsson, Saab and Volvo Aero ‐ were large and substantially diversified firms. They were well positioned
to adapt defence technologies and practices from Gripen to the extensive commercial and defence arms of their
national and international businesses.
For submarine construction in Australia were a domestic build to proceed, a very different situation might apply. In
contrast to the Gripen experience, the company responsible for building the Collins submarines ‐ ASC ‐ might
assume prime responsibility for building the next generation of vessels. However, if not sold to a large multinational
defence company, ASC would probably be limited to one or a small number of products in the defence sector with
few immediate or obvious prospects for either domestic or overseas expansion.
Given the sensitivity of its mission, ASC is unlikely to diversify in the way companies such as Ericsson, Saab and Volvo
have. Issues of national security alone might restrict its ability to transfer knowledge from defence to civilian uses
34 Eliasson G., Public Procurement as Innovation Policy ‐ The Case of the Swedish Multipurpose Combat Aircraft Gripen, op. cit., 2014, p. 36.
Building Submarines in Australia – Aspects of Economic Impact ‐ May 2015 60 ______________________________________________________________________________________________
UNCLASSIFIED
60
and place a cap on the company’s size. As Bloom, Schankerman and van Reenen (2013) point out, the potential to
generate spillovers tends to increase as a company grows.35
Moreover, the kinds of spillover multipliers associated with the Gripen hinge at least in part on innovation in a
defence capital equipment project leading to extensive export orders. This may have been true for the Gripen for
which South Africa, Brazil, Switzerland, Hungary, Thailand and the Czech Republic have apparently placed substantial
orders. But, if the Collins experience is anything to go by, the assumption of a burgeoning export market becomes
more tenuous for a future Australian submarine build.
It is also relevant to note that the spillovers from Gripen appear to have been facilitated by a well established ‘triple
helix’ regional development structure whereby Sewden’s Linpoking aerospace cluster developing the aircraft ‐
consisting of Saab and other companies, Linkpoing University and Local Government ‐ all combined to create a
tight, mutually reinforcing industrial support structure. The helix took decades to mature. The region in and around
the ASC site in Adelaide does not appear to have the same economic infrastructure.36
In its April 2015 study into Australia’s Naval Shipbuilding Enterprise, RAND offered the following conclusions in
relation to any attempt to extrapolate from the Gripen experience a spillovers effect for Australian naval
shipbuilding more generally:
“On the other hand, the high level of spillovers and spin‐offs seen in the Gripen case study
are not consistent with experiences at U.S. shipyards. NNS [Newport News Shipyard]
appears to have generated relatively few spillovers. Indeed, the entire Hampton Roads
region has been critiqued for a dearth of entrepreneurial activity. Likewise, no cluster of
suppliers has yet emerged around Austal USA. Evidence from U.S. shipbuilding suggests
that the Gripen example is overly optimistic from an economic development perspective.”37
“Favorable spillovers would occur if the process of shipbuilding gives rise to ancillary
benefits. In the Gripen case in Sweden, the program is credited with leading to
technological developments in many realms, some quite far removed from shipbuilding
(including, indeed, a firm that produces advanced solutions for tooth implants). Sweden’s
Gripen program is credited with energizing the so‐called Linkoping aerospace cluster that
has clearly had a transformational effect on its region. Unfortunately, RAND’s analysis of
shipbuilding in the United States did not find favorable spillovers in the fashion of Gripen.
Shipbuilding has been favorable to local economies, but it has done so in a more modest
fashion, without the ecosystem of favorable spin‐offs and spillovers associated with
Gripen. We do not think an outcome from shipbuilding similar to that in Silicon Valley from
technology is a realistic aspiration. The Gripen analogy is inapt.”38
35 Bloom N., Schankerman M. and van Reenen, J., “Identifying Technology Spillovers and Product Market Rivalry”, Econometrica, 3 July 2013,
81(4), pp. 1347‐1393. 36 Kloftsen M., Jones‐Evans D. and Scharberg C., “Growing the Linkoping Technopole – A Longitudinal Study of Triple Helix Development in Sweden”, Journal of Technology Transfer, 24, 1999, pp. 125‐138. 37 Birkler. J. et.al., Australia’s Naval Shipbuilding Enterprise Preparing for the 21
st Century, RAND Corporation, Santa Monica, April 2015, p. 137.
38 Ibid., p. 147
Building Submarines in Australia – Aspects of Economic Impact ‐ May 2015 61 ______________________________________________________________________________________________
UNCLASSIFIED
61
(v) Econometric Data
The fifth is that more recent work by Professor Eliasson released in July 2014 suggests that although the Gripen
experience might have contributed in part towards the adoption of a 2.6 spillovers multiplier for Australian
submarines, the 2.6 figure itself is actually derived from a series of review articles in the economics literature.
These articles summarise the results of a myriad of econometric (i.e. statistical) studies, for a range of countries. The
studies explore the relationship between research and development expenditure broadly defined and economic
growth, where growth is typically measured in terms of either increases in GDP or rates of national productivity
improvement.
In particular, a figure of 2.6 appears to have been drawn from review articles by Weiser (2005) and to a lesser extent
the work of Hall et.al. (2010).39 Referring to Weiser in particular, Professor Eliasson notes the following:
“ So what numbers should be entered into an ex ante cost benefit calculation on the local development of
an Australian submarine? The fast answer is that a detailed study of the Gripen type is necessary to say
anything credible, but let me try anyhow and refer to the econometric studies available…..
Weiser summarises his survey by noting that the evidence points to sizable spillovers and social returns
“which are more than twice as high as the private returns”. To be on the safe side I go for the low end,
which should be around 1.5 to 2. That number still corresponds to an impressive social return to those R&D
investments. So to judge from empirical evidence 1.5 for a submarine development project in Australia
cannot be criticised for being an overestimation.40
As indicated by Weiser:
“…from the studies in Table 7, the mean ratio of national (that is, private plus total spillover) returns to
industry (that is, private plus intra‐industry spillover) returns on R&D are approximately 2.5 (90/37). That
is, the social return on R&D is on average at least twice as high as the private return.”41
In turn, this draws heavily on the earlier findings of Australia’s Industries Assistance Commission (IAC), which
although conducted in‐country was restricted primarily to spillover studies covering other countries. From its
research into the effects of research and development on economic growth, the Commission concluded the
following:
From the industry level studies presented in table QA12, the ratio of total (that is private plus total
spillover benefits) to industry (that is private plus intra‐industry spillovers) benefits from R&D vary between
0.1 to 4.0 as to 1, with most lying in the range 1.2 to 2.0 as to 1 and a mean of approximately 1.6.42
However, any reliance on Weiser and the IAC in particular needs to be qualified in at least two respects.
39 Wieser R., “Research and Development Productivity and Spillovers ‐ Empirical Evidence at the Firm Level”, Journal of Economic Surveys, 2005,
19(4), pp. 587‐621 and Hall B.H., Mairesse J., and Mohnen P., "Measuring the Returns to R&D", pp. 1033‐1082 in Hall and Rosenberg (eds), 2010, Handbook of Economics and Technical Change, Elsevier, 2010.. 40 Eliasson G. Public Procurement as Innovation Policy ‐ The Case of the Swedish Multipurpose Combat Aircraft Gripen, op. cit., 2014, p. pp. 44‐45. 41 Wieser R., “Research and Development Productivity and Spillovers”, op. cit., p.614.
42 Industry Assistance Commission, “Quantifying the Returns to R&D: The Evidence to Date”, Research and Development, op. cit., Appendix QA, p.
QA38.
Building Submarines in Australia – Aspects of Economic Impact ‐ May 2015 62 ______________________________________________________________________________________________
UNCLASSIFIED
62
One is that Professor Eliasson’s estimate is a benefit‐cost ratio. However, the estimate he cites from Weiser is a ratio
of social to private returns. Unlike Professor Eliasson’s ratio, the Weiser figures do not in themselves indicate
whether the net returns from private investment in a project are positive or negative. They simply indicate that the
returns that flow to society more broadly are 1.2 to 2.0 times those that flow to the innovating firm itself. As a
result, the two sets of figures may not be strictly comparable.
The other perhaps more important qualification is that, putting issues of data comparability aside, it can be difficult
to draw direct inferences from Weiser’s survey to an Australian submarine context. This applies for a number of
reasons:
statistical relationships between R&D and the size or productivity of an economy are not per se a test of
causality. In the absence of appropriate techniques to deal with the simultaneity problem, namely whether
research and development expenditure stimulates economic/productivity growth or vice versa, they may be
more a test of association, with the extent (and mechanisms) of the underlying causation remaining to be
teased out;
more generally, econometric techniques are not easily applied due to problems which range from
measuring stocks of research and development expertise held within companies, industries and even entire
countries through to specifying equations which capture not only the impact of spillovers on economic
growth or productivity improvement but the impact of other factors;
econometric studies of the kind reviewed by Weiser are widely acknowledged as better suited to revealing
the average returns to research and development investment in the past across industries and even
countries and whether these appear to be changing over time than they are to predicting the returns that
might emerge from an individual project which has yet to commence;
the studies reviewed by Weiser apply to countries other than Australia which might have quite different
entrepreneurial environments for first developing and then disseminating and applying a new technology or
skill;
the studies cited in Weiser show social rates of return on research and development ranging from 18
percent to 329 percent, with an average of 90 percent. This average is substantially lower than the 166
percent return associated with an Eliasson spillover multiplier of 2.6. A multiplier of 2.6 might therefore be
considered an outlier;
expanding from this point, most if not all of the econometric models cited by Weiser and Hall et. al. have
been applied using commercial R&D data which may fail to reflect the kinds of restrictions in relation to
technology and other resource movements which characterise defence capital equipment projects
including restrictions relevant to national security; and
the results of the studies canvassed by Weiser appear not to have been compared against those from an
extensive literature which has explored how shifts in national defence expenditure (but not necessarily
expenditure on defence R&D) are correlated with changes in national economic/productivity growth, for a
wide range of countries including Australia.
In respect of this last point, the two major sources of meta analyses conducted thus far on econometric studies
exploring the links between military expenditure and economic growth ‐ by Awaworyi and Lew (2014) and Alptekin
Building Submarines in Australia – Aspects of Economic Impact ‐ May 2015 63 ______________________________________________________________________________________________
UNCLASSIFIED
63
and Levine (2012) ‐ suggest that, for developed countries, some form of positive relationship between military
expenditure and economic growth is likely though much depends on the time period considered and the method
used.
However, the available data also suggests that this relationship might now be weaker than it was decades ago. More
importantly, the meta analyses exclude Australia within the sample of countries covered. The only published
econometric study to explore the link between military expenditure and economic growth in an Australian
environment is by Madden and Hazelhurst (1995). This study found no statistically significant correlation between
the two variables. 43 44
The results of defence‐specific econometric research do not by themselves mean that defence expenditure is
incapable of generating positive spillovers in an Australian submarine context. But they do caution that a nexus
between the two variables should not be assumed as automatic. Any attempt to extrapolate from overseas
experience on the basis of econometric data may be considerably more challenging than it first appears.
Problems in relation to extrapolation arise in part because of the difficulty of estimating what spillovers would have
been generated under the counterfactual where the same investment was directed to another use. The Industries
Assistance Commission (IAC) in its 1995 report on research and development discusses in more detail the plethora of
technical hurdles involved.45
(vi) The Case Study Evidence
The sixth is that, as econometric results suggest and Professor Eliasson acknowledges, it might only be detailed case
studies that provide a reliable estimate of spillovers relevant to submarine construction in Australia.
However, of the of two primary sources of case study evidence currently available pertaining to domestic
submarines production in Australia ‐ one sponsored recently by DMO dealing primarily with Collins technologies,
and another by Professor Eliasson dealing with Collins human capital ‐ neither suggests a strong spillover effect.
Case study data from naval surface ship construction in Australia, which might provide additional but less directly
relevant guidance on the issue, deliver mixed results.
(a) Technology Case Studies for Collins
The outcome from a series of company interviews sponsored by DMO and undertaken by consultants
Macroeconomics in early 2014 in relation to new technologies in particular suggest that, for inter firm spillovers at
least, the impact of the Collins submarine build was small. According to Macroeconomics:
“Consultations with Collins stakeholders both within and outside Defence failed to identify
technological changes from the original Collins build project that lead to measurable
impacts. Stakeholders identified a list of technological developments that were associated
43 Awaworyi S. and Yew S.L., The Effect of Military Expenditure on Growth: An Empirical Synthesis, Discussion Paper 25/14, Department of
Economics, Monash University, Melbourne, 2014, and Alptekin A. and Levine P. “Military Expenditure and Economic Growth: A Meta Analysis”, European Journal of Political Economy, 2012, 28(4), pp.636‐650. 44 Madden G.G. and Haslehurst P.I., “Causal Analysis of Australian Economic Growth and Military Expenditure: A Note”, Defence and Peace
Economics, 1995, 6(2), pp. 115‐121. 45 Industry Assistance Commission, “Quantifying the Returns to R&D: The Evidence to Date”, op. cit., pp.QA1‐74 and especially pp. QA20‐QA31.
Building Submarines in Australia – Aspects of Economic Impact ‐ May 2015 64 ______________________________________________________________________________________________
UNCLASSIFIED
64
with the project. But in each case, they seem to have had very limited application beyond
the project for a variety of reasons.
Pumps, carbon fibre and glass reinforced plastic (already established in the commercial
sphere before the submarine build commenced); welding skills (technically unique to naval
shipbuilding); a new metallurgical ‘recipe’ for steel (unique to naval shipbuilding and
already shared with foreign project partners); the Integrated Ship Control Management
and Monitoring System (ISCMMS), block build strategies and batteries (restricted to
defence applications, not successfully marketed for domestic or export use when
innovation was leading edge or available to Australia through other channels); and
anechoic coatings and adhesives (restricted distribution for national security reasons).” 46
This is not to deny that the submarines were reliant on very advanced or even leading edge technologies, that
people working on the project acquired valuable skills or that the Collins experience in relation to spillovers might
not differ under a Future Submarine project. Nor does it imply that interviews of the kind conducted by
Macroeconomics can necessarily elicit all of the information on spillovers that might be relevant. However, it does
suggest that, based on available interview data, these technologies were created, distributed and absorbed only on
a small scale, if at all, outside the project itself.
(b) Human Capital Case Studies for Collins
Professor Eliasson’s work suggests that it is the human capital rather than technology aspect which may well
generate the largest spillover effects from an in‐country submarine build. Yet, his own 2013 study on human capital
spillovers in a Collins context delivers inconclusive results.47
An ASC‐sponsored survey in 2013 by Professor Eliasson examined through face‐to‐face interviews the experience of
10 former Collins key production staff who moved from ASC into other companies. Among other things, survey
participants were asked how much additional income they had earned for themselves and their subsequent
employers because of the skills they had gained on the Collins project. In theory, any increase in skills that occurs as
a result of experience working on the Collins should, if the skills are indeed transferable between firms, allow the
employees to achieve higher earnings
While a small survey sample size limited the scope of analysis, it is worth noting that the 10 individuals selected for
interview appear to be those ASC itself considered most likely to have been associated with substantial spillover
effects. That is, sample selection appears biased towards maximising survey results. 48
However, very few survey participants listed technical skills they obtained on the job as being the reason for any
additional remuneration they attracted after leaving ASC. And most participants viewed the mainly project
management‐related skills they had gained while working on the submarines as skills they might have obtained
46 Macroeconomics correspondence with DMO 5 August 2014. 47 See Eliasson G., Advanced Public Procurement as Industrial Policy ‐ The Aircraft Industry as a Technical University, Springer, New York, 2010, p.
40 ‐ “The most important avenue of technology or competence diffusion, therefore, the market for competence, when people with competence move between jobs and firms.”
48 Gunnar Eliasson is a Professor Emeritus of Industrial Economics at the Royal Institute of Technology (KTH) in Stockholm, Sweden. His work on
submarines in Australia appears to have been sponsored, at least in part, by ASC.
Building Submarines in Australia – Aspects of Economic Impact ‐ May 2015 65 ______________________________________________________________________________________________
UNCLASSIFIED
65
elsewhere. On balance, the case study does not provide clear or strong support for a significant spillovers effect,
subject to the qualification that the study was a pilot investigation.49
(c) ACIL Allen Consulting Studies
As far as DMO can ascertain, the only other study to examine the extent of spillovers in an Australian submarine
context is ACIL Allen Consulting (2013 ‐ ‘ACIL’) which also looked at major naval combatant shipbuilding more
broadly.
However, the 2013 ACIL study provides little in terms of an overall estimate of the final impacts which spillovers
might have in a submarine context. The very small number of submarine‐related case studies cited in the study ‐
which were limited to just two of many areas of the project potentially subject to spillover effects, namely steel and
fluid/waste systems ‐ permit few concrete conclusions to be drawn.50
It can be argued that other studies by ACIL (and its predecessors Tasman Economics and Tasman Asia Pacific) on
naval surface ship construction might provide stronger evidence ‐ from which the extent of spillovers from
submarines might be inferred. However, a strong synergy between submarines and other naval vessels remains to
be proven. In any event, the extent of the spillovers associated with surface ship construction evident from the
studies is not particularly clear or strong.
Tasman Economics (2002) asked businesses involved in the Minehunter Coastal Project to indicate whether their
productivity had increased as a result of being involved in the project. The vast majority indicated no change. For the
35 per cent of respondents reporting a positive productivity impact, the improvement averaged only 2.24 percent.
Only around one quarter of the firms surveyed reported receiving technology transfers as a result of being involved
in the project and only 30 per cent of those stated that the technology had a positive impact on productivity.51
Similar results emerged from an earlier Tasman Asia Pacific (2000) survey of 127 businesses involved in the ANZAC
Ship Project. In this case, only slightly more than half of the firms reported some form of technology transfer from a
ship build through the use of existing published material, staff training and research and development. Patterns in
relation to the overall magnitude of spillovers from the project, through productivity improvement, were mixed.52
Self‐reported surveys like those used by ACIL or its predecessors have some natural drawbacks. These include
survivor bias and the difficulty in attributing productivity gains to a particular project. Further, it is difficult to assess
the causality of productivity gains flowing from a project or to identify gains that would have accrued if the
resources had been used in some other way. The absence of a carefully defined control group makes these issues all
the more acute and cautions against drawing strong inferences from the surveys’ results.
49 Eliasson G., The Advanced Firm as a Technical University ‐ A Pilot Study in Human Capital Creation on the Collins Submarine Project in
Australia 1986‐2004, Swedish Entrepreneurship Forum Conference, 2013. 50 ACIL Allen Consulting, Naval Shipbuilding and Through Life Support ‐ Economic Value to Australia, Maintaining Capabilities and Capacity,
Canberra, December 2013., pp. 20‐28, http://www.hunterdefence.com.au/SiteFiles/hunterdefencecomau/Shipbuilding_report_to_AIG.pdf. 51 Tasman Economics, Impact of Major Defence Projects: A Case Study of the Minehunter Coastal Project ‐ Final Report, Canberra, January 2002. 52 Tasman Asia Pacific, Impact of Major Defence Projects: A Case Study of the ANZAC Ship Project ‐ Final Report, Canberra, February 2000.
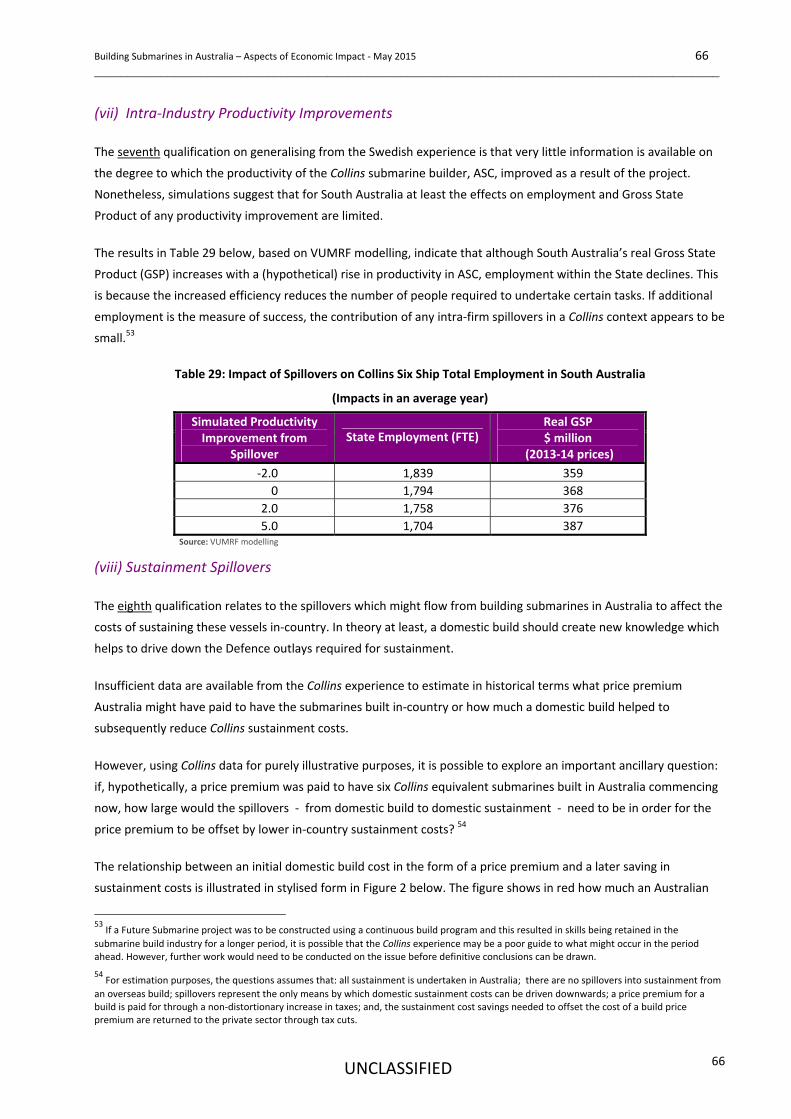
Building Submarines in Australia – Aspects of Economic Impact ‐ May 2015 66 ______________________________________________________________________________________________
UNCLASSIFIED
66
(vii) Intra‐Industry Productivity Improvements
The seventh qualification on generalising from the Swedish experience is that very little information is available on
the degree to which the productivity of the Collins submarine builder, ASC, improved as a result of the project.
Nonetheless, simulations suggest that for South Australia at least the effects on employment and Gross State
Product of any productivity improvement are limited.
The results in Table 29 below, based on VUMRF modelling, indicate that although South Australia’s real Gross State
Product (GSP) increases with a (hypothetical) rise in productivity in ASC, employment within the State declines. This
is because the increased efficiency reduces the number of people required to undertake certain tasks. If additional
employment is the measure of success, the contribution of any intra‐firm spillovers in a Collins context appears to be
small.53
Table 29: Impact of Spillovers on Collins Six Ship Total Employment in South Australia
(Impacts in an average year)
Simulated Productivity Improvement from
Spillover
State Employment (FTE) Real GSP $ million
(2013‐14 prices)
‐2.0 1,839 359
0 1,794 368
2.0 1,758 376
5.0 1,704 387 Source: VUMRF modelling
(viii) Sustainment Spillovers
The eighth qualification relates to the spillovers which might flow from building submarines in Australia to affect the
costs of sustaining these vessels in‐country. In theory at least, a domestic build should create new knowledge which
helps to drive down the Defence outlays required for sustainment.
Insufficient data are available from the Collins experience to estimate in historical terms what price premium
Australia might have paid to have the submarines built in‐country or how much a domestic build helped to
subsequently reduce Collins sustainment costs.
However, using Collins data for purely illustrative purposes, it is possible to explore an important ancillary question:
if, hypothetically, a price premium was paid to have six Collins equivalent submarines built in Australia commencing
now, how large would the spillovers ‐ from domestic build to domestic sustainment ‐ need to be in order for the
price premium to be offset by lower in‐country sustainment costs? 54
The relationship between an initial domestic build cost in the form of a price premium and a later saving in
sustainment costs is illustrated in stylised form in Figure 2 below. The figure shows in red how much an Australian
53 If a Future Submarine project was to be constructed using a continuous build program and this resulted in skills being retained in the
submarine build industry for a longer period, it is possible that the Collins experience may be a poor guide to what might occur in the period ahead. However, further work would need to be conducted on the issue before definitive conclusions can be drawn.
54 For estimation purposes, the questions assumes that: all sustainment is undertaken in Australia; there are no spillovers into sustainment from
an overseas build; spillovers represent the only means by which domestic sustainment costs can be driven downwards; a price premium for a build is paid for through a non‐distortionary increase in taxes; and, the sustainment cost savings needed to offset the cost of a build price premium are returned to the private sector through tax cuts.
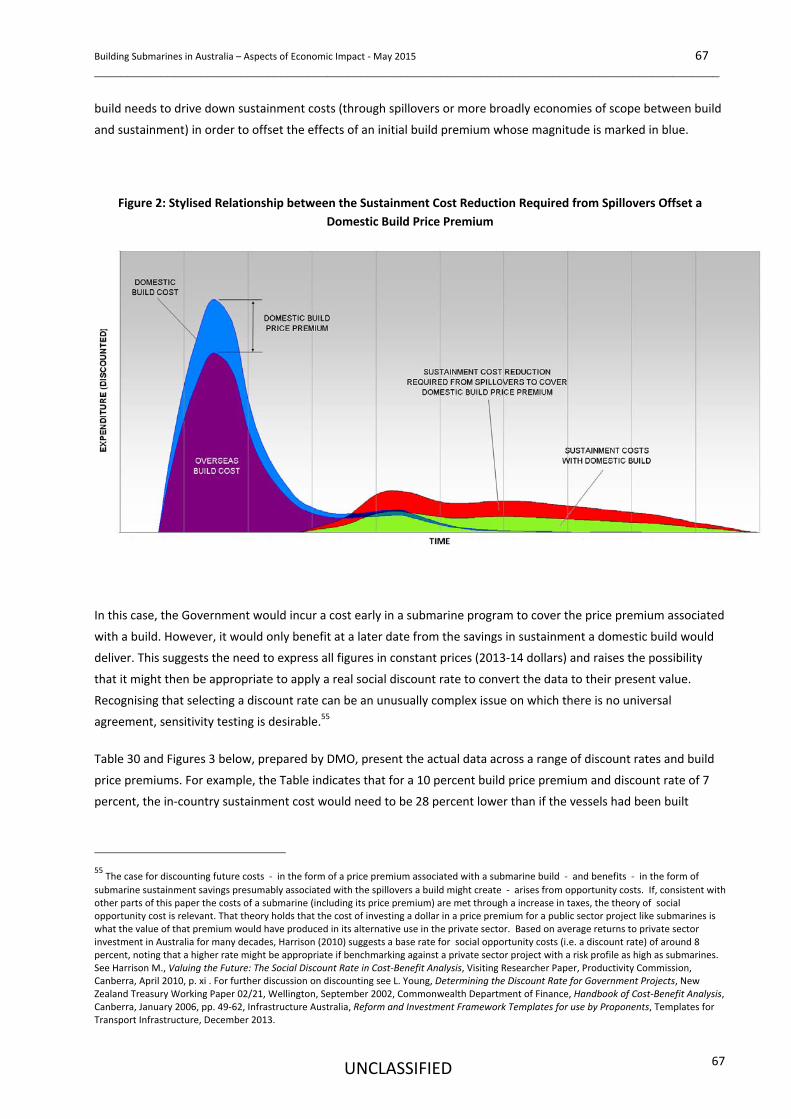
Building Submarines in Australia – Aspects of Economic Impact ‐ May 2015 67 ______________________________________________________________________________________________
UNCLASSIFIED
67
build needs to drive down sustainment costs (through spillovers or more broadly economies of scope between build
and sustainment) in order to offset the effects of an initial build premium whose magnitude is marked in blue.
Figure 2: Stylised Relationship between the Sustainment Cost Reduction Required from Spillovers Offset a
Domestic Build Price Premium
In this case, the Government would incur a cost early in a submarine program to cover the price premium associated
with a build. However, it would only benefit at a later date from the savings in sustainment a domestic build would
deliver. This suggests the need to express all figures in constant prices (2013‐14 dollars) and raises the possibility
that it might then be appropriate to apply a real social discount rate to convert the data to their present value.
Recognising that selecting a discount rate can be an unusually complex issue on which there is no universal
agreement, sensitivity testing is desirable.55
Table 30 and Figures 3 below, prepared by DMO, present the actual data across a range of discount rates and build
price premiums. For example, the Table indicates that for a 10 percent build price premium and discount rate of 7
percent, the in‐country sustainment cost would need to be 28 percent lower than if the vessels had been built
55 The case for discounting future costs ‐ in the form of a price premium associated with a submarine build ‐ and benefits ‐ in the form of
submarine sustainment savings presumably associated with the spillovers a build might create ‐ arises from opportunity costs. If, consistent with other parts of this paper the costs of a submarine (including its price premium) are met through a increase in taxes, the theory of social opportunity cost is relevant. That theory holds that the cost of investing a dollar in a price premium for a public sector project like submarines is what the value of that premium would have produced in its alternative use in the private sector. Based on average returns to private sector investment in Australia for many decades, Harrison (2010) suggests a base rate for social opportunity costs (i.e. a discount rate) of around 8 percent, noting that a higher rate might be appropriate if benchmarking against a private sector project with a risk profile as high as submarines. See Harrison M., Valuing the Future: The Social Discount Rate in Cost‐Benefit Analysis, Visiting Researcher Paper, Productivity Commission, Canberra, April 2010, p. xi . For further discussion on discounting see L. Young, Determining the Discount Rate for Government Projects, New Zealand Treasury Working Paper 02/21, Wellington, September 2002, Commonwealth Department of Finance, Handbook of Cost‐Benefit Analysis, Canberra, January 2006, pp. 49‐62, Infrastructure Australia, Reform and Investment Framework Templates for use by Proponents, Templates for Transport Infrastructure, December 2013.
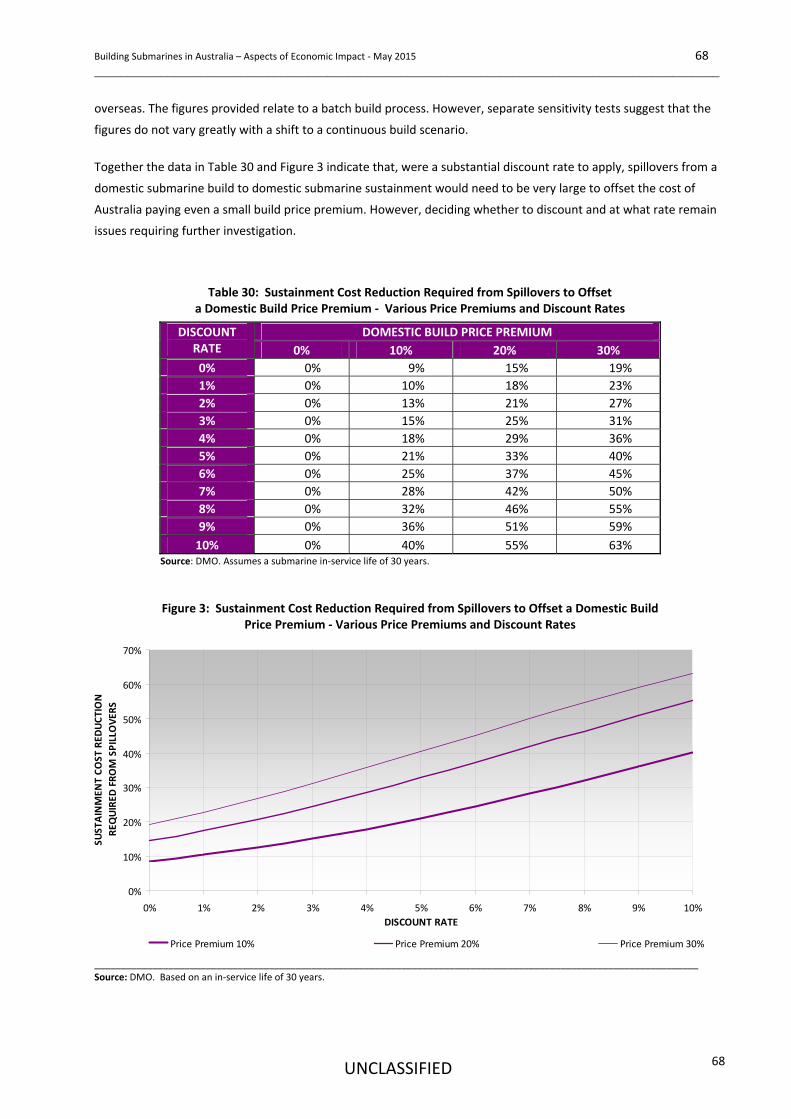
Building Submarines in Australia – Aspects of Economic Impact ‐ May 2015 68 ______________________________________________________________________________________________
UNCLASSIFIED
68
overseas. The figures provided relate to a batch build process. However, separate sensitivity tests suggest that the
figures do not vary greatly with a shift to a continuous build scenario.
Together the data in Table 30 and Figure 3 indicate that, were a substantial discount rate to apply, spillovers from a
domestic submarine build to domestic submarine sustainment would need to be very large to offset the cost of
Australia paying even a small build price premium. However, deciding whether to discount and at what rate remain
issues requiring further investigation.
Table 30: Sustainment Cost Reduction Required from Spillovers to Offset a Domestic Build Price Premium ‐ Various Price Premiums and Discount Rates
DOMESTIC BUILD PRICE PREMIUM DISCOUNT RATE 0% 10% 20% 30%
0% 0% 9% 15% 19%
1% 0% 10% 18% 23%
2% 0% 13% 21% 27%
3% 0% 15% 25% 31%
4% 0% 18% 29% 36%
5% 0% 21% 33% 40%
6% 0% 25% 37% 45%
7% 0% 28% 42% 50%
8% 0% 32% 46% 55%
9% 0% 36% 51% 59%
10% 0% 40% 55% 63% Source: DMO. Assumes a submarine in‐service life of 30 years.
Figure 3: Sustainment Cost Reduction Required from Spillovers to Offset a Domestic Build Price Premium ‐ Various Price Premiums and Discount Rates
0%
10%
20%
30%
40%
50%
60%
70%
0% 1% 2% 3% 4% 5% 6% 7% 8% 9% 10%
DISCOUNT RATE
SUSTAINMENT COST REDUCTION
REQUIRED FROM SPILLO
VERS
Price Premium 10% Price Premium 20% Price Premium 30%
__________________________________________________________________________________________________________________ Source: DMO. Based on an in‐service life of 30 years.
Building Submarines in Australia – Aspects of Economic Impact ‐ May 2015 69 ______________________________________________________________________________________________
UNCLASSIFIED
69
Conclusions
Bringing these eight points together, it might be reasonable to assert ‐ as Professor Eliasson does ‐ that spillovers
should form part of any cost‐benefit analysis of a defence capital equipment project as large and technically complex
as submarines before a decision on project sourcing is made. This is partly because the build location‐sustainment
cost nexus forms part of a spillovers effect.
Nonetheless, it is not clear on the historical and other evidence currently available that spillovers associated
specifically with submarines built in Australia are likely to be sufficiently large that they should or could determine
the outcome of economic impact modelling in relation to a submarine build or decide the outcome of submarine
sourcing decisions.
On balance, available evidence tends to support the view that the new knowledge an Australian submarine build
would create is likely to be much smaller than commonly believed. The evidence suggests that the new knowledge
created by a submarine build tends to be: technically specific to submarines or the defence sector; withheld from
other parts of the economy for reasons of national security; held tightly by the submarine builder or its suppliers to
maximise their own commercial advantage, in markets where product quality rather than price can often be more
important to securing long term contracts; logistically difficult and costly to transfer from the submarine builder to
other companies, even where the Commonwealth owns the intellectual property; and, capable of being introduced
into Australia through avenues other than submarine construction.
This implies that in the period ahead the onus of proof in relation to any claim of substantial spillover effects should
rest with its proponents.
Building Submarines in Australia – Aspects of Economic Impact ‐ May 2015 70 ______________________________________________________________________________________________
UNCLASSIFIED
70
AN ALTERNATIVE APPROACH ‐ NIEIR
Background
In September 2014, the South Australian Economic Development Board released the results of a study on the
economic effects of building a new class of submarine in Australia, prepared by the National Institute of Economic
and Industry Research (NIEIR). The study covers the costs of 12 new submarines and their sustainment.
The aim of this report is not to present a critique of the NIEIR study. Insufficient data and time have been available
for the purpose, including work in relation to what changes would need to be made to the structure of the VUMRF
model to yield economic impact results similar to those of the Institute. However, because the NIEIR study is the
only economic impact assessment of building submarines in Australia released publicly over the past 20 years and
certain aspects of the document are reasonably clear, a number of its findings warrant attention.
The Study
The NIEIR study begins from the proposition that building a new class of submarine in Australia would be no more
expensive than purchasing the vessels from overseas ‐ and therefore that both domestic and overseas supply
options are equally available and equally competitive. That is, no price premiums are paid. A build purchase price of
around $20 billion in today’s prices is assumed.
The document goes on to accept that the submarine must be paid for somehow: in this case through a reduction of
equivalent value in other forms of Government expenditure. In doing so, the study adopts one element of a CGE
method of analysis.
Finally, the study assumes that whatever resources ‐ in the form of land, capital and labour ‐ a domestic
submarine build might require are feely available in the sense that the use of these resources for any one project
does not reduce their availability for other projects. This is due in part to an expected decline in Australia’s motor
vehicle and mining industries which, the study claims, would release people into the Australian labour market in
sufficient numbers and with sufficient skills to more than cater for the needs of any future in‐country submarine
build project. The assumption of freely available resources is associated with an I‐O rather than a CGE analytic
framework.
The Results
The results from the NIEIR study indicate that if a submarine is built in Australia in the absence of an overseas
alternative and with a freely available domestic resource base, its economic impact is likely to be negative. This
appears to be primarily the result of a build promoting activities with lower levels of productivity than the activities
they displace as a result of the project needing to be financed by Government at the expense of economic activity
elsewhere.
However, despite a negative economic impact, a domestic submarine build is still considered by NIEIR to be
economically advantageous to Australia or to make the country “better off” compared to a situation in which the
Building Submarines in Australia – Aspects of Economic Impact ‐ May 2015 71 ______________________________________________________________________________________________
UNCLASSIFIED
71
vessels had been sourced from overseas. Indeed, a net benefit of some $21 billion in net present value terms on a
submarine build is estimated ‐ from a $20 billion submarine investment.
This is because the impact of an overseas build is estimated to be substantially more negative. The reasons why an
overseas build has a more strongly negative economic impact than a domestic build are not described in detail.
However, they appear to be driven by two principal assumptions:
if the submarine was built overseas rather than in Australia, the Australian resources earmarked for
production in‐country ‐ and drawn from those currently unemployed ‐ would remain unemployed; and,
a project as large and complex as a submarine build will generate large spillover effects which would be
totally lost to Australia if the knowledge accumulation on which they rest was created in another country.
DMO Comment
With these points in mind, the NIEIR approach is interesting in at least three respects.
(a) Australian Build ‐ Negative Impact
Firstly, it highlights that even if the proposition is accepted that Australia will be better off as a result of an
Australian submarine build vis‐à‐vis overseas supply, such a project could still reduce Australia’s level of income. It is
just that the reduction caused by a domestic build will be less than that caused by an overseas build. Importantly,
that effect occurs even if an Australian submarine builder can achieve international price competitiveness. If instead
a price premium needs to be paid to support domestic submarine production, the NIEIR approach to modelling
suggests than an even greater reduction in income will occur.
This is not a reason for failing to proceed with a build of this kind. However, it does highlight the need for Defence to
avoid purchasing more submarines than required to satisfy its military‐strategic objectives or vessels that are larger
or more capable than the minimum operational requirements of the ADF demand. ‘Gold‐plated’ equipment
solutions may come at the cost of Australia’s overall prosperity.
(b) Resource Scarcity
Secondly, the study’s assumption in relation to resource use brings into stark relief perhaps the most important
differences between the NIEIR’s largely I‐O approach to analysis and that adopted in CGE models. These differences
hinge on:
what happens to resources, especially labour, if a major infrastructure project like a submarine build does
not proceed in Australia. Noting that submarine building does not currently occur in‐country, do the
resources notionally designated to a domestic build remain idle or is there a reasonable prospect that, over
time, they might be absorbed and put to productive use elsewhere? and
from where are the resources, especially labour, drawn to support a domestic build if this turns out to be
Australia’s preferred option. Are these resources drawn from a pool of unemployed or do they come from
other areas of the economy where they are already put to productive use?
Contrary to the assumption adopted by NIEIR, it would appear that in the event of an overseas build, the resources
notionally allocated to an Australian build could be put to productive use elsewhere. This is due to the relatively
Building Submarines in Australia – Aspects of Economic Impact ‐ May 2015 72 ______________________________________________________________________________________________
UNCLASSIFIED
72
small number of people involved and their relatively high levels of expertise. Many or even most of the people likely
to be involved in building a new class of submarine in Australia do not appear to share the characteristics of those
most likely to remain unemployed for a long period of time. As noted by the Productivity Commission in Attachment
C, these characteristics include poor technical capabilities, poor English language skills and a position in higher age
brackets.
Added to this is the implicit assumption of NIEIR that the automotive industry and mining workers which would
support a domestic submarine build will remain idle from the time the automotive industry downturn commences in
earnest in 2016‐17 and the mining boom fully subsides until a submarine build commences in the early‐mid 2020s.
This assumption is challenged by the Productivity Commission in its recent review of the automotive industry’s
structural adjustment path. The review expects most former industry employees to return to the workforce within
four years. NIEIR’s study makes no mention of the Productivity Commission’s views or any attempt to reconcile the
differences between it and the Commission’s approach to analysis.
Moreover, even if retrenched auto and mining workers were still unemployed after a decade when a new submarine
project would commence, it seems likely that those unable to secure employment in the interim will be among the
least skilled ‐ and therefore among the least likely to be able to transition, without cost, into submarine production.
The NIEIR study does not discuss the substantial amounts of shipbuilding expertise expected to be released into the
Australian defence market in the near future as a result of possible downsizing at BAES’s Williamstown dockyard in
Melbourne and Forgacs in Newcastle. Notionally at least, the workers at these facilities provide a much closer skills
fit to a submarine build than former auto or mining industry employees.
However, it is not at all certain that the people employed currently at these facilities can be fully or even
substantially transferred in future into a submarine environment. As the recent difficulties experienced by ASC in the
construction of Air Warfare Destroyers and the choice of overseas bidders for a Future Submarine program
demonstrate, the skills required for submarine construction might not match those for the construction of major
naval surface combatants.56
There are a number of obstacles to a seamless transfer of workers from a naval surface ship to a submarine
environment:
a new submarine build will not commence in earnest for perhaps another ten years, during which time
skilled and able workers involved do date in fitting out the Landing Helicopter Docking (LHD) ships and
building modules for the Air Warfare Destroyers (AWDs) could well secure employment elsewhere given
their general skills and experience, or exit the workforce altogether;
with the possible exception of the AWDs, the mix of skills required for submarine construction differs from
that for the construction of naval surface ships in the sense of displaying a higher ‘white collar’ element;
and
what remains of a naval surface ship workforce in the aftermath of industrial restructuring at Williamstown
and Newcastle may well be required for the next generation of frigates needed by the Royal Australian
56 Reports in the media has indicate that by the end of 2015, approximately 800 jobs may be lost at the BAE Systems Australia dockyard in
Williamstown in Victoria and a further 660 jobs at Forgacs in Newcastle. See Stewart C., “Shipyard Closures Start with Job Losses”, The Australian, 31 December 2014.
Building Submarines in Australia – Aspects of Economic Impact ‐ May 2015 73 ______________________________________________________________________________________________
UNCLASSIFIED
73
Navy, if a decision is made to produce these vessels in Australia, for the confirmed construction in Australia
of 21 new replacement patrol vessels under the Pacific Maritime Security Program and for the potential
domestic construction of a fleet of Offshore Patrol Vessels to replace the Armidale class patrol boats.
Added to this, it is worth noting two points. One is Australia’s submarine sustainment workforce will still be required
to support a portion of the Collins fleet after construction of a new class of submarines is scheduled to commence
and to then transition to support the new submarine fleet. This at least partly limits the possibility of a submarine
build being able to draw suitably skilled labour away from the sustainment function.
The other is the NIEIR claim that mining or automotive industry workers can transition easily into a submarine build
sits uncomfortably with growing support within Australia ‐ by RAND and others ‐ for continuous naval build
projects including potentially a new submarine build. Integral to a growing preference for continuous building in
Australia are the assumptions that the labour skills naval shipbuilding requires are to some degree unique and that a
continuous build can help to avoid the heavy costs of releasing specialised naval construction workers and then
attempting to rehire or retrain new workers at a later date.
Available data suggest that the NIEIR assumption in relation to alternative resource use ‐ that if a submarine was
not built in Australia the domestic resources which would have gone into its production would remain idle ‐
accounts for around 70 percent of the economic benefit from a domestic versus an overseas submarine build under
its mainly I‐O based model. If so, and these resources do have a reasonable chance of redeployment, much of the
economic benefit estimated by the Institute is lost.
Even if this overall line of argument is not accepted, NIEIR modelling suggests that its results should at least be
compared against those from a CGE model to inform Government decision makers of how economic impact
estimates vary if key modelling assumptions, like those made by NIEIR in relation to labour markets, are altered.
(c) Spillovers
Thirdly, NIEIR raises in its study the notion that a domestic build might be substantially more advantageous than a
foreign build due to spillovers from new knowledge a domestic build creates. Indeed, its study extols the economic
virtues of the creation and diffusion of knowledge associated with economic activities like submarine production
which the Institute considers part of the “back‐bone” of any advanced manufacturing economy.
Available data suggest that spillovers account for around 30 percent of the net economic benefit estimated by NIEIR
in relation to a domestic over a foreign submarine build. Clearly, if spillover effects are overstated by the Institute,
the overall economic benefits claimed become smaller.
However, relatively little information is provided in the study to support the claim. The study’s modelling
assumption in relation to spillovers ‐ that the value of all research and development as well as all material inputs
associated with a submarine build automatically qualify as potential sources of spillover ‐ appear optimistic.
Additionally, there is an obvious tension between NIEIR’s contention that there will be very substantial spillover
benefits as a result of the generation and diffusion of knowledge, and its implied assumption that the project can
readily absorb and productively utilise (without substantial ramp‐up costs) labour so lacking in skills as to be at
serious risk of long‐term unemployment.
Building Submarines in Australia – Aspects of Economic Impact ‐ May 2015 74 ______________________________________________________________________________________________
UNCLASSIFIED
74
Examining the material input issue in more detail, the NIEIR study applied a spillovers multiple to not only the R&D
component of overall submarine cost but to the material input component as well. This approach is interesting for a
number of reasons:
it goes well beyond the results of Professor Eliasson’s own research. There is little or no evidence presented
by the Institute to substantiate the claim that materials are a source of spillover effects or to identify how
such spillovers from materials purchases might occur;
based on the Collins experience, DMO estimates the materials component of the total cost of submarines
to be around 30 percent. This is nearly six times greater than the research and development expenditure
base to which a spillovers multiplier should probably be applied. This might explain why NIEIR’s $5 billion
estimate of the spillover benefits of a domestic build approach is so high. Had the Institute estimated the
spillovers effect on the basis of the project’s R&D cost component only, it would have had to assume a
multiplier of 7 to arrive at a $5 billion figure. There is little, if any, support in the economics literature for a
multiplier of that magnitude;
despite an inflated expenditure base, NIEIR portrays its spillover estimates as conservative by dropping the
spillovers multiplier from the 2.6 suggested by Professor Eliasson to only 0.7. However, the two figures are
not comparable due to different estimation methods. Unlike Professor Eliasson’s figure of 2.6, the
multiplier advocated by NIEIR of 0.7 has not been adjusted for opportunity cost. Placed on a like‐for‐like
basis, 0.7 might therefore be higher than Professor Eliasson’s estimate, not lower.
Nor is there any clear indication of why a multiplier 0.7 was selected by NIEIR over any other number. The
figure does not accord with Professor Eliasson’s work specifically in relation to submarines built in Australia.
It does not correlate with a spillover multiplier of 3 which the Institute cites in its study as applying to
submarine construction in Sweden but for which no source reference is provided;
while a spillover multiplier of 0.7 may seem conservative, its role in the NIEIR analysis means it has a
substantial impact on the results ‐ an impact then made all the greater by the very wide expenditure base
to which it is applied.
More specifically, NIEIR compares the Australian economy with a project building submarines domestically
to an alternative in which the submarines are sourced overseas. Both scenarios involve a reduction in GDP,
relative to the alternative scenario of not procuring submarines at all. But in the case of domestic
production, each $1 spent domestically on materials is offset by a $0.70 spillover benefit ‐ so the cost of $1
of domestic procurement of materials would never be more than $0.30, while each $1 spent overseas
effectively has a cost of $1.
Expressed in these terms, the spillover multiplier implied by NIEIR is not 0.7 but 3.3 ‐ the domestic cost of
$0.30 compared to the foreign cost of $1. A multiplier of 3.3 is significantly higher than Professor Eliasson’s
result for the Gripen and also well above estimates found in the broader economics literature.
Bringing these points together, the approach to spillovers taken by NIEIR appears to suffer from four shortcomings:
the study does not identify what specific aspects of a submarine build may be responsible for spillovers effects; the
expenditure base to which a spillovers multiplier is applied appears too large; little if any justification is given for the
spillover multiplier NIEIR select; and, the study appears to rely on a far larger effective multiplier than the quoted
number suggests.
Building Submarines in Australia – Aspects of Economic Impact ‐ May 2015 75 ______________________________________________________________________________________________
UNCLASSIFIED
75
CONCLUSIONS
This report has explored some of the economic impact issues associated with a hypothetical scenario of building
submarines in Australia. It uses Collins cost data and CGE modelling techniques to help illustrate the potential effects
involved.
A CGE approach to modelling will tend to provide conservative estimates of economic impact by understating the
degree to which a submarine build might absorb unemployed resources and generate spillover effects. For a project
of this kind, some unemployed resources will be absorbed and some spillovers will be created.
Nonetheless, neither of these effects appear to be as large as many people expect. More generally, CGE modelling
offers a number of advantages over I‐O modelling in attempting to gauge the economic effects of a major public
sector project like building submarines, especially over long time horizons.
Drawing on a CGE approach and recognising that this is not the only way in which insights into economic impact
might be obtained, the report’s overall conclusions are as follows:
provided Australian built submarines are reasonably price competitive, the economic impact of a domestic
build should be positive but small unless bolstered by a domestic build reducing domestic sustainment
costs. The extent of sustainment cost savings has still to be determined;
however, economic gains can be quickly negated should Australia be forced to pay a significant price
premium to secure domestic production;
if the discount rate selected to reflect social opportunity cost is significant, the economies of scope
provided through spillovers ‐ and extending from building submarines domestically to sustaining
submarines domestically ‐ would need to be unusually large to offset even a small price premium paid to
support a domestic build project; and
the regional socio‐economic effects of building submarines may be an issue requiring further research.
The outcome of the report for each of the six key policy issues examined are summarised below.
Does the measurement of economic impact of a domestic submarine build differ markedly depending on the
economic model used?
Available data from both Input‐Output (I‐O) and Computable General Equilibrium (CGE) models of building a
submarine in Australia reveal a small negative and small positive effect on the size of the Australian economy,
respectively. However, available I‐O data reveals a strong positive impact for an Australian build when
compared against a strong negative impact for an overseas build. Indeed, the difference in impact is more than
six times higher than the corresponding difference in impact from CGE modelling.
Approximately 70 percent of this difference can be attributed to I‐O modelling making two assumptions: if a
submarine was built in Australia, the labour skills required could be drawn from the ranks of the unemployed;
Building Submarines in Australia – Aspects of Economic Impact ‐ May 2015 76 ______________________________________________________________________________________________
UNCLASSIFIED
76
and, if a submarine was built overseas the labour which would have gone towards a domestic build would be
unable to find alternative employment elsewhere, even in the longer term.
CGE modelling assumes that the workforce needed for a domestic submarine build may be drawn in large part
from those already employed in other areas of the economy, given the specialised nature of the work involved.
It also assumes that, if a submarine is built overseas rather than in Australia, the domestic labour force which
would have been assigned to the project can over time find employment in other areas of the economy.
The remaining 30 percent of the difference can be attributed to the I‐O model’s estimation of substantial
technology spillovers. But this report finds little, if any, historical evidence to suggest a substantial technology
spillover effect.
To what degree might the employment created by building a submarine in‐country offset, in terms of job
numbers, the anticipated decline in employment in motor vehicle manufacturing especially in South
Australia?
Commencing in earnest in the early‐mid 2020s, a new submarine build project may come too late to provide
work for displaced motor vehicle industry employees from a 2016‐17 closure of vehicle manufacture by Ford,
Holden and Toyota. In any event, a submarine build is too small to offset anything other than a small
proportion of the numerical decline in the size of the motor vehicle manufacturing workforce ‐ around 2
percent nationally and 20 percent in South Australia.
If it is accepted that the economy is capable of re‐absorbing over time the relatively large number of generally
lower skilled workers engaged in motor vehicle manufacture, as recent developments in relation to
manufacturing industry policy suggest, it appears likely that the same economy should be able to absorb the
much smaller number of generally more highly skilled workers which would be notionally ‘displaced’ if a new
class of submarines was built overseas ‐ keeping in mind that Australia does not currently build submarines
and the jobs a domestic build would create represent new employment opportunities.
What would be the economic impact if a submarine was built in Australia but at a significantly higher price
than the price of otherwise equivalent vessels produced abroad?
CGE modelling and associated research suggests that the economic impact of an Australian submarine build vis‐
a‐vis an overseas build will turn from marginally positive to negative at a price premium of less than 10
percent. Clear and significantly negative impacts across all measures of economic impact emerge at the 20
percent level.
From an economic impact perspective, price premiums represent wasted expenditure and are treated as a cost
to the economy which directly lowers real Gross Domestic Product (GDP). In a CGE modelling context, it is a
form of declining productivity ‐ when productivity improvement is the desired outcome.
Price premiums provide a form of protection from market competition which can impede long term
productivity growth by fostering a lack of innovation and general cost consciousness within industry. They can
place Defence at greater risk of unwarranted cost overruns after a submarine build contract is signed and work
commences. Such overruns, if they were to occur, would add to final price premiums and are unusually difficult
to control.
Building Submarines in Australia – Aspects of Economic Impact ‐ May 2015 77 ______________________________________________________________________________________________
UNCLASSIFIED
77
What is the likely economic impact if a submarine is designed and essentially built overseas but Australian
industry contributes to its production?
In the event that Australia purchases a new submarine from overseas, the economic impact of the project will
rely in part on the degree to which Australian industry can participate in tasks that must be done in‐country for
logistical and national security reasons and support an overseas prime‐contractor in foreign shipyards. It will
also depend partly on how price competitive relevant Australian suppliers might be.
CGE modelling indicates that as Australian industry support levels rise, so does economic impact. However, the
rise is not proportional. That is, as support increases, economic impact rises but at a slower rate.
This suggests that, in selecting between overseas bids to build a submarine, levels of Australian industry
participation may be less significant than they first appear ‐ and military‐strategic issues become more
important. That impact diminishes significantly if higher Australian industry participation can only be achieved
through the provision of goods and services which are not price competitive.
These results temper any expectation that increasing Australian industry participation rates in an overseas
build will necessarily overcome the (small) losses in economic impact from awarding a submarine build to an
overseas prime‐contractor. Equally importantly, they caution that any attempt to overcome the loss of a
submarine build contract to an overseas shipyard ‐ by extending levels of Australian industry participation
beyond those consistent with the industry’s level of price competitiveness ‐ can erode economic impact by
pushing up price premiums and distorting efficient resource allocation in domestic markets.
Would a submarine built overseas deprive Government of much of the tax revenue it would have received
had the vessels been produced in Australia?
The claim is often made that if submarines were built offshore the tax revenue the Government would receive
would be far lower than if the vessels had been built in‐country. This is true to the extent that for an overseas
build the foreign‐owned builder will pay company taxes to a foreign Government and distribute dividends to
overseas shareholders.
However, such claims are also based on the often unstated assumption that those who would have worked on
submarines if the vessels were built in Australia would remain unemployed ‐ and not pay income and other
taxes ‐ in the event the build project was conducted offshore.
CGE modelling challenges this assumption. Its results indicate that, although a domestic build will generate
more tax revenue for Australian Governments than an overseas build, the differences amount to around 8
percent of the value of the project as opposed to 36 percent claimed by proponents of a domestic submarine
build. In short, claims of tax losses are almost five times higher than CGE modelling suggests.
Could any new knowledge in the form of technologies and workforce skills associated with building
submarines in Australia ‘spillover’ to promote substantial growth across the Australian economy?
Spillovers are not covered in CGE modelling. In theory at least, very large spillovers could turn a negligible or
even significantly negative CGE estimate of economic impact into a strongly positive outcome.
Building Submarines in Australia – Aspects of Economic Impact ‐ May 2015 78 ______________________________________________________________________________________________
UNCLASSIFIED
78
Nonetheless, claims that spillovers are highly significant are based in large part on extrapolations from Swedish
military aircraft manufacture or econometric studies to an Australian submarine build. Econometric studies
attempt to identify, mainly at a country or industry level, the statistical relationship between general research
and development expenditure and economic growth.
There are a number of shortcomings with this kind of extrapolation: aircraft and submarines can have quite
different spillovers characteristics; the Swedish aircraft industry and the Australian submarine industry appear
to have quite different capacities to generate and distribute new knowledge; econometric work focussing on
defence research and development in an Australian environment does not support the notion of a strong
spillovers effect; and, perhaps most importantly, available case study data dealing specifically with the
technology and skills elements of Australia’s own Collins submarine project does not provide strong or
conclusive evidence of a significant spillovers effect.
Available evidence implies that those who believe substantial spillovers will emerge from a new class of
submarine built in Australia should bear the onus of proof in identifying their nature and extent.
Defence Materiel Organisation May 2015 DMO Contact: Rob Bourke [email protected]

Building Submarines in Australia – Aspects of Economic Impact ‐ May 2015 79 ______________________________________________________________________________________________
UNCLASSIFIED
79
Attachment A
The Elements of Economic Contribution
Various ‘effects’ make up the economic contribution of a project.
To begin, there is the ‘initial effect’ which is defined as the value of what is produced by the company contracted to
supply the submarine and some of the sub‐contractors who may work more or less full‐time on the project.
The company must draw on inputs from suppliers of materials, finished components and ancillary providers of
services like legal and accounting advice. In an economic modelling context, the additional economic activity
generated by these firms is referred to as the ‘first round effect’.
In turn, these first‐round suppliers rely on other companies to provide some of what they require and so on, until all
of the inputs required to construct the submarine are obtained. The economic contribution made by these other
companies is referred to as the ‘industrial support effect’.
The overall progression along the industry supply chain ‐ covering both first round suppliers and industrial support
suppliers ‐ makes up the ‘production induced effect’ which is generally taken as the lower boundary for what a
submarine’s contribution to the economy might be.
However, at the same time, those who are employed by the submarine builder as well as its suppliers and their
suppliers earn income which is spent on a range of goods and services. This expenditure can contribute in its own
right to activity somewhere else in the economy. The activity associated with how this income is spent is referred to
as the ‘consumption effect’.
Bringing these points together, estimating the economic contribution a submarine build might make involves
considering the initial effect, production‐induced effect and consumption effect.
So‐called multipliers capture all or part of this impact by gauging the effect of the submarine project as expenditure
on the project takes place and radiates or ‘flows on’ from the builder to others.
Although multipliers take different forms according to whether all or just some of the economic effects of a project
are of interest, arguably the most appropriate is the 2B multiplier. This is calculated as the total multiplier expressed
as a proportion of the initial effect, where the total multiplier is the sum of initial, production‐Induced and
consumption effects.
The terms ‘direct’ effect and ‘indirect’ effect are sometimes also used when describing economic contribution and
impact. These have specific technical meanings. However, for the purpose of this report, ‘direct’ is defined as the
initial effect while ‘indirect’ is defined as the production‐induced effect plus the consumption effect.
Building Submarines in Australia – Aspects of Economic Impact ‐ May 2015 80 ______________________________________________________________________________________________
UNCLASSIFIED
80
Attachment B
I‐O Modelling, CGE Modelling and Crowding Out Effects
An Australian Build
An increase in demand for Australian produced goods and services due to build spending on defence capital
equipment affects the local economy in a variety of ways.
First, there are the direct demand effects experienced by the producers of the final goods and services purchased by
the equipment industries. These are followed by a succession of indirect demand effects, which are first felt when
the equipment builders purchase intermediate inputs from other industries, and construct and install new plant and
equipment.
The initial indirect demand effects set in train further rounds of indirect effects as firms supplying the intermediate
inputs to the ship building and combat systems industries, and constructing their fixed capital, raise their own
production levels in order to meet the increased demand, etc. For example, an important input to the production of
a submarine is the combat system which in part uses business services. As the demand for combat systems
increases, so will the demand for business services, and hence the demand for inputs used in the production of
business services, etc.
At each stage of the process, induced income effects may augment the direct and indirect demand effects. These
occur when the households supplying the additional labour and the owners of the newly utilised capital, spend their
increased incomes on final goods and services. As before, these expenditures set off further successive rounds of
indirect demand effects, and hence further induced income effects.
The sequences of demand effects described above arise from the linkages between industries in the chains of
production and distribution of goods and services. Input‐output (I‐O) models are fashioned to capture these inter‐
industry linkages. As such, they have become a commonly used tool for analysing the effects of large projects on the
economy.
However, input/output calculations generally assume that there are no supply‐side constraints on the economy.
Labour and capital are assumed to be available with perfect elasticity of supply. This includes labour with skills
specific to the equipment build project. There is no trade‐balance constraint, nor any constraint on government
budgets.
As a consequence, the additional demand for locally‐produced commodities generated (directly and indirectly) by
the equipment build project is always accommodated by increased local output, without any crowding out of other
elements of the economy. Hence in a typical input/output calculation, an increase in demand due to the equipment
project generates an increase in local output that is bigger than the direct increase in expenditure. It also generates
a move towards deficit in the balance of trade; the increase in imports (i.e. the spending on foreign goods by the
equipment building industries) not being offset by a fixed level of exports.
Computable general equilibrium (CGE) models allow for the inclusion of constraints absent from input/output
calculations. Generally, input/output calculations can be specified in such models as a special case. Moreover, CGE
Building Submarines in Australia – Aspects of Economic Impact ‐ May 2015 81 ______________________________________________________________________________________________
UNCLASSIFIED
81
models include more general specifications of the behaviour of consumers, producers, investors, etc., than those
allowed for in the input/output framework.
An assumption underlying the input/output model is that, for each industry, fixed amounts of all intermediate inputs
and primary factor inputs are required to produce a unit of output. This rules out all possibilities for producers to
economise in the use of one input by using more of others, i.e. it rules out any possibility of industries adjusting their
input structures in response to changes in relative prices.
In CGE models, substitution possibilities are incorporated so that the behaviour of agents in the model economy is
sensitive to changes in relative prices as well as to quantity variables. For example, if wages rise relative to the cost
of using capital, capital/labour ratios tend to rise.
An implication of including the additional constraints together with an active price mechanism is that the expansion
effects of increases in one element of demand tend to be offset by crowding out of other elements. For example,
suppose the new equipment project pushes up the demand for equipment‐related skilled labour. This will bid up
wage rates, and increase the production costs of all industries in the economy. Industries facing international
competition will be unable to pass on these cost increases without losing sales.
Suppose too, that there is a net increase in demand for imports. If a balance of payments constraint is in place, then
the expansion in equipment‐related imports will put downward pressure on the real exchange rate to prevent the
trade balance from moving towards deficit. This discourages imports, ‘crowding in’ the production of domestic
import‐competing industries. It also lifts the competitiveness on world markets of traditional exporting industries in
mining and agriculture. The consequent reduction in imports and expansion in exports allows the trade balance to
adjust.
In CGE models incorporating a realistic set of economy‐wide constraints, the effects of building a large item of
equipment cannot be anticipated a priori. Indeed, due to crowding out the eventual effects may be less than the
initial impetus to demand. For simulations typical of large defence capital equipment projects, there are three main
crowding out/in effects:
because it is assumed that the submarine investment is funded using money that would otherwise have
been consumed by households, the increase in investment tends to crowd out consumption‐oriented
industries as the economy’s saving rate is forced to increase;
because the increased investment leads to increased employment demand, it causes the real cost of labour
to rise across the economy, reducing the competitiveness of traded goods sectors and crowding out the
production of traditional export and import‐competing industries; and
because the submarine investment is import intensive, increased investment causes imports to rise and the
real exchange rate to depreciate which crowds in the production of traditional export and import‐
competing sectors (offsetting somewhat the crowding out just noted).
An Overseas Build
For submarines, the economics of an overseas buy differs from those for an Australia build due to differences in the
degree of Australian input content, and the location and ownership of the construction firm(s). An overseas buy will
Building Submarines in Australia – Aspects of Economic Impact ‐ May 2015 82 ______________________________________________________________________________________________
UNCLASSIFIED
82
have a smaller Australian content than an Australian build. Foreign‐owned firms disburse their after‐tax profit to
overseas owners, and pay little if any tax in Australia. Domestic‐firms disburse the majority of their after‐tax profit to
Australian owners and pay company tax in Australia. It follows that relative to an Australian build, an overseas buy
directly uses less Australian‐produced products, requires more foreign imports, and yields less dividend and taxation
income for Australian consumption.
But not everything is negative. In requiring more imports, an overseas buy will put downward pressure on the
exchange rate. A lower exchange rate, all else unchanged, improves the competitiveness of export oriented
industries on overseas markets, and import‐competing industries on local markets. This crowds in activity in traded
goods sectors.
However, all of this assumes that the overseas buy and Australian build both cost the same. In other words, there is
no ‘price premium’ associated with an Australian build in the sense of Australia paying more to build a submarine in‐
country than it would to obtain a vessel of equivalent capability and availability from an overseas supplier.
From an economic impact perspective, a price premium represents ‘wasted’ expenditure. Waste is spending above
opportunity cost and represents a real cost to the economy that directly lowers real Gross Domestic Product (GDP)
which measures the value of the economy’s overall productive output. The cost could be in the form of resources
inputs ‐ labour, capital and materials ‐ used inefficiently and/or profits that are larger than normal. Either way,
the waste is a form of productivity decline when productivity growth is the desired outcome.
Building Submarines in Australia – Aspects of Economic Impact ‐ May 2015 83 ______________________________________________________________________________________________
UNCLASSIFIED
83
Attachment C
Choice of Model ‐ I‐O .v. CGE
There are a number of factors which suggest that, in addition to the results of I‐O modelling, CGE results should be
considered in any debate about impact, noting that the results any model delivers depend in part on how it is
‘calibrated’ to address a particular investment project.57
One factor is extensive work by the Productivity Commission which points to the conceptual shortcomings of
economic impact analysis when I‐O tables alone are adopted. Commenting on the uses and abuses of relying on
these tables to measure economic impact, the Commission notes the following:
“Abuse primarily relates to overstating the economic importance of specific sectoral or
regional activities. It is likely that if all such [I‐O] analyses were to be aggregated, they
would sum to much more than the total for the Australian economy. Claims that jobs
‘gained’ directly from the cause being promoted will lead to cascading gains in the wider
economy often fail to give any consideration to the restrictive nature of the assumptions
required for input‐output multiplier exercises to be valid. In particular, these applications
fail to consider the opportunity cost of both spending measures and alternate uses of
resources, and may misinform policy‐makers.”58
The following comments from related work by the Commission add context:
“…it is important that decisions to undertake public investment in large‐scale
infrastructure are based on their aggregate costs and benefits to the Australian
community as a whole, rather than on objectives such as creating jobs in regions affected
by plant closures. In its draft report on public infrastructure, the Commission stated that:
It is argued that investment in public infrastructure could provide
macroeconomic stimulus (either nationally or regionally) by using
investment in public infrastructure to offset the macroeconomic
consequences of the winding down of the mining boom or contraction
of sectors such as manufacturing.
However, the decision to undertake infrastructure investment should be
based on the expected net benefits from the investments. Substantial
care should be taken not to undermine effective project assessment
processes and risk management choices for short‐term benefits…
Cost–benefit analysis provides a mechanism for ensuring the efficient provision of public
infrastructure. In principle, any social and economic benefits of infrastructure investment
57 For an example of the differences in economic impact that can emerge between the use of I‐O and CGE modelling techniques in an Australian
naval shipbuilding environment see Tasman Asia Pacific, Impact of Major Defence Projects: A Case Study of the ANZAC Ship Project ‐ Final Report, op.cit., pp. 43‐49. Economic impact estimates are also available for Coastal Minehunters but these are based on a short term outlook and are therefore not comparable to ANZAC data, see Tasman Economics, Impact of Major Defence Projects: A Case Study of the Minehunter Coastal Project ‐ Final Report, op. cit., pp. 69‐75. 58
Productivity Commission, On Input‐Output Tables: Uses and Abuses, Staff Research Note, Canberra, September 2013. p.1.
Building Submarines in Australia – Aspects of Economic Impact ‐ May 2015 84 ______________________________________________________________________________________________
UNCLASSIFIED
84
in a region experiencing major structural adjustment would be one of the facets considered
in such analysis. However, any such analysis has to be rigorous and avoid dubious
modelling approaches (such as multiplier analysis, chapter 3).
All too often, public investments are prone to ‘optimism bias’ and a confusion between
political and economic objectives (Banks 2012). If governments make poor infrastructure
decisions, this can have a high opportunity cost and act as a long‐term drag on the
economy’s productivity. For instance, a large iconic infrastructure project may displace
funding that would support many smaller projects with collectively greater economic
benefits.”
“Further, the desire to locate a project [such as a defence or shipbuilding project] in a
particular region does not remove the need for a robust assessment of its costs and
benefits to the Australian community as a whole.” 59
Another factor helping to explain why a CGE approach to modelling the economic impact of a submarine build might
be useful is Australia’s recent economic history. Historical experience suggests that the notion embedded in CGE
modelling ‐ that resources displaced through crowding out might have had an alternative use and therefore an
opportunity cost ‐ is not without foundation. Commenting on opportunity cost in the context I‐O modelling and
submarine production, Professor Henry Ergas has recently offered the following observations:
“ The problem [associated with I‐O modelling] is best explained by thinking of a ship built
in Australia. The workers and local subcontractors will receive income they will largely
spend on other locally‐produced goods. By using data on the inputs and outputs of
Australian producers of those goods, it’s possible to trace the direct and the ‘multiplier’
effects of the spend on GDP and tax revenue.
That’s fine, but such an analysis ignores the alternative use of the labour and other inputs
‐ it assumes they’ll sit idle if our hypothetical ship isn’t built. In reality, market forces will
redeploy them elsewhere in the economy where they will contribute to GDP and pay taxes.
That’s especially true in any long run scenario ‐ and this modelling [for a new class of
submarine] stretches over 40 years.
The unreality of input‐output modelling is well understood, so more sophisticated general
equilibrium modelling is the standard approach for addressing long run ‘what if’ questions
about policy.
The SA [South Australian] paper [on the economic impact of building submarines in‐
country] rejects general equilibrium modelling on the grounds that ‘no capacity constraints
are anticipated in the labour market’. That is, it assumes that there will be a pool of
unemployed in Australia for the next 40 years who, but for the opportunity, have the
aptitude to become highly skilled engineers and trades persons. Indeed, as there are no
59 Productivity Commission, Australia’s Automotive Manufacturing Industry, Inquiry Report No. 70, 31 March 2014 (released publicly in August
2014), pp. 238 and 239.
Building Submarines in Australia – Aspects of Economic Impact ‐ May 2015 85 ______________________________________________________________________________________________
UNCLASSIFIED
85
ramp up costs in the model, it assumes all these skills and resources already exist ‐ in
obvious contrast to the findings of the RAND study.
If the economy really was as static and unresponsive as assumed in input‐output
modelling, we could never have absorbed the resource boom. Nor would we ever have
recovered from the removal of tariffs on cars, footwear and clothing. But we did, and the
economy responded with new jobs in new areas. More importantly, consumers came to
enjoy cheaper prices.
There’s a lesson here about buying submarines. The economic argument for mandating
local construction is ultimately no different to the neo‐mercantilist arguments which
sought to hold back productivity‐boosting reforms of the 1980s and 90s. Then as now, the
focus should be on the overall benefits rather than those concentrated in the hands of the
few.”60
Recent work in the United States on the economic impact of defense projects adds weight to this approach while
adding extra insight into the ways in which labour markets adjust to change in a defence environment. Using private
security services as an example, Zycher (2012) neatly summarises the economic dynamics at work. Although
discussed with reference to security services, these dynamics should translate to a submarine environment:
This hypothetical reduction in the market size and price of private security services is a
signal that such services have lost value. “Value” is the goods and services that a given
demander (or the market as a whole) is willing to forgo to obtain security services. The
declining value of security services means that the resources used in the production of
those services—labor, buildings, vehicles, capital, and so on—now yield less (marginal)
value when used in the production of security services relative to their value in the
production of other goods and services…
During the adjustment process, resources, including labor, become unemployed (or
perhaps underemployed). Some resources might be highly specialized in the production of
security services; it may be difficult and time‐consuming for the owners of these inputs to
find new employment. Other resources might be less specialized but difficult to move: they
are specialized geographically, and therefore also may find it difficult to find new
employment quickly. Some resources—labor is a good example—may be more mobile than
others, but the process of changing locales also might take substantial time. Even given
that some of these resources might find alternative employment quickly, increased
unemployment of labor and other resources previously occupied in the production of
private security services is certain for some period of time.
This shift of resources, including labor, across economic sectors is an example of what
economists call “structural unemployment.” It is the result of changes in the underlying
60
Ergas H., “On Economics and Submarines”, The Strategist, Australian Strategic Policy Institute, Canberra, 29 October 2014. Henry Ergas is a
senior economic adviser with Deloitte Access Economics and Professor of Infrastructure Economics, University of Wollongong. The SA paper referred to in this quote is Economic Development Board South Australia, Economic Analysis of Australia’s Future Submarine Program, op. cit,. The RAND study referred to in this quote is RAND Corporation, Australia’s Submarine Design Capabilities and Capacities ‐ Challenges and Options for the Future Submarine, National Security Research Division, Santa Monica, 2011. http://rand.org/pubs/monographs/MG10033.html.
Building Submarines in Australia – Aspects of Economic Impact ‐ May 2015 86 ______________________________________________________________________________________________
UNCLASSIFIED
86
economic conditions of demand and supply that yield shifts in the relative price signals
inducing resources to flow toward and away from various sectors. In other words, as
demand and supply conditions change, the “structure” of the economy changes as well:
some industries grow while others decline, either absolutely or in a relative sense.
Structural unemployment is a fundamental feature of any dynamic economy driven by
constant changes in individual preferences, individual choices, technological shifts, and a
myriad of other factors.
Any owner of an input, including workers suffering from unemployment caused by a
change in market conditions, is worse off, at least temporarily. But the process of allowing
market forces to redirect resource use increases aggregate output and wealth, thus
making virtually all individuals better off over time on net. The movement of resources
from less to more profitable sectors increases the aggregate productivity of the economy.
Therefore, the increased unemployment and other adverse effects of the decline in the de‐
mand for private security services, however unpleasant for those bearing the brunt of the
economic shifts, are not an adverse effect for the economy as a whole. To put it a bit
differently, the short‐term adverse effect of resources unemployed because of a shift in
economic conditions is outweighed by the longer term benefit of a process in which re‐
sources are allocated and reallocated among alternative employments so as to increase
the overall productivity or value of resource use, that is, aggregate wealth.”61
These comments are consistent with the Industry Assistance Commission’s 1994 views on the treatment of resource
scarcity in a defence capital equipment environment using CGE modelling techniques. While acknowledging that the
individual circumstances of a defence equipment project might modify conclusions, the Commission nonetheless
advocated that assumptions underlying CGE modelling remained valid:
“Several participants (the WA Department of Commerce and Trade, Rear‐Admiral Rourke,
and Transfield Shipbuilding) claimed that the ORANI long run labour constraint assumption
was inappropriate. They argued that an expansion in Defence activity need not result in
labour being drawn away from other sectors because labour resources were already
available in times of high unemployment, or could be retrained, and/or the skills could be
imported. The Commission acknowledges that in these situations an expansion in Defence
activity would not be entirely at the expense of other sectors. However, according to the
[Monash Multi‐Regional] model, given a return to lower levels of unemployment,
stimulation of growth in a particular sector of the economy, such as defence, would
ultimately be at the expense of growth in employment in other sectors.62
The findings of Professor Ergas, Dr Zycher and the IAC are also consistent with the following comments on labour
mobility by the Productivity Commission from its 2014 report on automotive manufacturing in Australia:
61 Zycher B.M., “Economic Effects of Reductions in Defense Outlays”, op. cit., pp. 4‐5.
62 Industry Commission, Defence Procurement, op. cit., p. 131. The term ORANI was then name given to the large‐scale multi‐sectoral model of
the Australian economy employed by the Commission at that time.
Building Submarines in Australia – Aspects of Economic Impact ‐ May 2015 87 ______________________________________________________________________________________________
UNCLASSIFIED
87
The labour market in Australia is dynamic — many employees lose their jobs in any one
year and many people who are jobless are hired. In the year ending February 2013, about
355,000 people were involuntarily retrenched across Australia.
Retrenched employees face costs associated with job search and training, and some will
have lower paid or less secure jobs once re‐employed. Loss of employment is particularly
challenging for older people, or those with poor English proficiency or lower skill levels.
While retrenched manufacturing employees may take longer on average to find re‐
employment than employees retrenched from other industries, within a year about two‐
thirds are likely to be re‐employed on a full, part‐time or casual basis. 63
The Commission goes on to consider how best to respond to labour market adjustment pressures. Importantly, it
does not advocate defence capital equipment projects as a economically efficient method for addressing regional
employment problems (especially when price premiums must be paid to support domestic production), preferring
instead more targeted intervention measures where the costs of intervention exceed the benefits:
Adjustment pressures [from automobile manufacturing plant closures] are likely to be
concentrated within particular regions, such as North Adelaide, parts of Melbourne and
Geelong. Some affected regions already have relatively high rates of unemployment and
social disadvantage.
Governments should ensure the appropriate resourcing of the delivery of generally
available welfare, training and employment services for all clients in regions placed under
pressure by automotive manufacturing retrenchments.
Providing adjustment assistance to retrenched automotive manufacturing employees at a
level that exceeds the assistance generally available to other jobseekers raises efficiency
and equity issues.
Governments should consider ways to better target assistance to retrenched employees
who are likely to encounter the greatest difficulties finding re‐employment.
Regional adjustment funds, infrastructure and defence spending and industry support
programs are costly an ineffective ways to facilitate workforce adjustment.”64
63 Productivity Commission, Australia’s Automotive Manufacturing Industry, op. cit., p. 2. 64 Ibid.
Building Submarines in Australia – Aspects of Economic Impact ‐ May 2015 88 ______________________________________________________________________________________________
UNCLASSIFIED
88
Attachment D
Tax Effects
A great deal has been written in recent years about the difference between tax revenue generated from a domestic
submarine build and tax revenue generated from an overseas build. The claim often made is that if submarines
were built offshore the tax revenue the Australian Government would receive would be far lower. Such claims are
linked in part to the often unstated assumption that those who would have worked on submarines for an in‐country
build would remain unemployed should the vessels be built overseas.65
In particular, discussions of the tax issue often draw on work from the Royal United Services Institute in the United
Kingdom which has argued that any differences in tax revenue between a domestically built and overseas built item
of defence capital equipment can have important ramifications especially when Government budgets are under
pressure.
The approach taken by RUSI looked at the tax issue in the context of an individual contract. That is, for a single
contract it looked at how much tax revenue ‐ from tax instruments of all kinds ‐ would go to Government if the
equipment covered was built in country. The assumption made was that none of this revenue would flow to
Government if the item was produced overseas. The tax take for a domestic build was estimated at around 36
percent of the overall value of the contract.
However, as the authors emphasised, no attempt was made to “assess any wider economic consequences from a
contract, which would include multiplier effects.” More particularly, the study remarked:
“So far the numbers presented have been those of an accountant dealing with one actual,
labour‐intensive project, rather than the calculations of an economist seeking to capture the
impact of wider dynamics. We have deliberately ignored any estimate of the ‘multiplier
effects’ of defence spending within the UK in terms of the revenues and profits of businesses
(and tax payments) benefiting from the spending of defence industry employees in specific
areas.
Clearly, however, it must be recognised that, if a UK company loses defence work because a
contract has been placed with a foreign supplier, it may be able to find alternative sources of
revenue and profit. Also, UK defence workers who have been laid off might be able to find
other sources of work that will involve them paying a comparable amount in taxation. If so,
the tax revenue effects that we have discussed will be moderated or even offset by wider
dynamism in the economy.
However, the UK economy in 2011 was struggling to grow at all and thus any assumption
that tax revenues lost from defence contracts placed overseas would be made up from other
sources should be treated as optimistic. It might be thought that the burden of proof should
lie with those who prefer to live with the argument that alternative sources of tax income
65 See Taylor T. and Louth J., The Destinations of the Defence Pound, op. cit..
Building Submarines in Australia – Aspects of Economic Impact ‐ May 2015 89 ______________________________________________________________________________________________
UNCLASSIFIED
89
will be generated. It is beyond dispute that a contract placed overseas generates tax income
for another government.66
This paper by DMO looks more carefully at RUSI’s later comments by examining tax effects in a CGE modelling
environment in relation to a submarine build project with relatively long time horizons in the context of an economy
with generally high levels of employment.
In Australia there are four main federal and state taxes. In terms of revenue, the largest is income tax imposed on
personal income and company profits. The second largest is the Goods and Services tax (GST), which can be thought
of as a tax primarily on final household consumption. Then come state payroll and property taxes. Payroll tax is
imposed on company labour payments, while property tax consists mainly of stamp duty and land tax. In the
absence of changes in rates, thresholds, exemptions and other factors, the revenues collected from these taxes
move in line with changes in their underlying bases.
In the VUMRF modelling, each of the main taxes are modelled explicitly. In approximate terms, changes in income
tax reflect changes in nominal GDP, changes in GST‐collection reflect changes in nominal private consumption, and
changes in payroll and property tax revenues reflect changes in labour costs and building activity.
The CGE model used to generate the economic impact results presented in this report assumes that the cost of a
submarine is met through an appropriate, non‐distortionary tax. That is, it assumes a tax that has no excess burden.
The assumption that the tax is non‐distortionary means that the model’s results are likely to understate the true
economic cost of the project.
In its approach to cost‐benefit analysis, the Department of Finance notes the following in relation to the treatment
of tax distortion effects when gauging the economic impact of a major public infrastructure project like submarines:
The marginal excess burden of a tax is the additional value forgone when a tax rate is
increased to fund certain government spending (Figure 3.6(c)). It represents the change in
deadweight loss as a result of the change in tax. Similarly, a reduction in taxation will
involve a marginal reduction in excess burden – that is, a welfare gain. Campbell (1997)
estimates the marginal excess tax burden for general taxation in Australia to be around 25
per cent of revenue raised.
The excess burden of taxation means the supply cost of public investment or services is
greater than the actual amount of funds used. Consequently, it is appropriate to make an
upward adjustment to financial costs in cost‐benefit analysis to ensure the calculated net
present value is unbiased. This is, however, only where there is a significant net cost to the
budget. 67
66 Ibid, pp. 6‐7. 67 Commonwealth Department of Finance, Handbook of Cost‐Benefit Analysis, Canberra, January 2006, pp. 37‐38.
Building Submarines in Australia – Aspects of Economic Impact ‐ May 2015 90 ______________________________________________________________________________________________
UNCLASSIFIED
90
Attachment E
Aspects of Real Consumption
If submarine construction increases real GDP, then it increases overall real production. From that production is
generated income ‐ wages and profits ‐ which accrue to domestic agents and to foreigners. That portion which is
consumed by domestic agents, or saved for later domestic consumption, establishes the level of society’s economic
welfare. The higher is the level of real consumption, now and in the future, the higher is the country’s overall level of
economic wellbeing.
From this, the change in real consumption which arises when a submarine is purchased is reflected in the change in
real GDP the project generates less two factors: the reduction in consumption necessary to fund the project; and the
increase in net real income to foreigners.
When a submarine is built, taxes must be raised to pay for the project and real consumption declines as result. In
this case, the reduction in real consumption does not mean that the submarine construction reduces economic
welfare. Some fall in real consumption is necessary to obtain the submarines and secure the defence of the nation.
This fall does not represent a reduction in national wellbeing.
However, a decline in real consumption beyond this point will result in a welfare loss. This might occur when the fall
in consumption associated with one option for the supply of the submarines ‐ say an overseas build ‐ is greater
than the fall associated with a competing option ‐ say a domestic build. In this case, greater losses in consumption
associated with one option relative to another can be interpreted as reductions in welfare. Conversely, lower losses
in consumption associated with the same option relative to the other can be interpreted as a welfare gain.
Building the submarines in Australia at a price premium to an equivalent submarine purchased from overseas, all
else equal, leads to a larger loss in consumption. The extent to which the loss is greater represents a reduction in
economic welfare. As a reasonable approximation, the welfare loss is equal to the implicit subsidy that the
government must pay; the subsidy that exactly matches the higher cost of the domestic alternative.
Building Submarines in Australia – Aspects of Economic Impact ‐ May 2015 91 ______________________________________________________________________________________________
UNCLASSIFIED
91
Attachment F
Setting Price Premium and Australian Content Scenarios
Price Premiums
Although it is possible that an Australian built submarine might be cheaper than an overseas competitor, most public
attention has focussed on Australian built submarines being more expensive. In the absence of any firm data on the
extent of a price premium, the economic impact modelling undertaken for this report explores four options: a 0
percent price premium (i.e. the price of both Australian built and overseas built vessels are the same); a 10 percent
price premium (i.e. the price of an overseas built submarine is 10 percent below that of an overseas built vessel); a
20 percent price premium; and, a 30 percent price premium.
These scenarios have been selected principally to illustrate the sensitivity of modelling results to the price issue.
However, the range of 0 percent to 30 percent has been a feature of recent public debate on the issue. Since mid
2014 at least, consideration media attention has been directed to the possibility that a new submarine built
overseas for around $20 billion might be substantially cheaper than an Australian built vessel estimated to cost in
the order of $30 billion. At the same time, some supporters of a domestic submarine have been vociferous in their
claims that any Australian build would be fully price competitive. This paper makes no comment on the validity of
either position. Instead, the paper draws on public discourse simply to set a notional ‘left and right of arc’ in relation
to price premiums for modelling a number of hypothetical scenarios.
Australian Content on Overseas Builds
One of the more complex and important aspects of modelling the economic impact of building a new class of
submarines in Australia using the Collins experience as an exemplar is determining what roles Australian industry
would perform in the (purely hypothetical) scenario of the vessels being built overseas rather than in Australia. The
issue is complex in the sense that deciding what can and cannot be done in Australia rests on a mix of security as
well as economic considerations.
The issue is important in an economic modelling context for two reasons. The first is that there is a natural
assumption among public commentators on submarine issues that if Australia can boost its input to a submarine
built overseas, this might partly ‘compensate’ Australian industry in a situation where it was unable to build the
vessels itself.
The second is that overseas suppliers might differ substantially in their willingness or capacity to engage Australian
industry should they be offered a build contract. Some overseas suppliers might see substantial scope for
engagement. Others might consider the opportunities for Australian industry participation to be more limited. With
this in mind, having some knowledge of what levels of this kind of participation might be feasible and how economic
impact varies with changes in participation rates, might assist in better understanding the relative merits of
proposals put forward by overseas bidders.
If a submarine is built overseas, it is likely that at least a small proportion of the value of the vessel will be Australian‐
made. This occurs for a number of reasons:
Building Submarines in Australia – Aspects of Economic Impact ‐ May 2015 92 ______________________________________________________________________________________________
UNCLASSIFIED
92
national sovereignty ‐ there are technologies which are so sensitive they must be either produced in
Australia, integrated into a submarine in Australia or packaged securely in Australia and then shipped
overseas for incorporation into the vessels in a way which does not reveal their
composition/functionality/capabilities;
natural protection ‐ there are tasks which can only be performed in Australia, primarily because they rely
on local environmental conditions or because Australia would need to be involved in their production in
order to gain the understanding necessary for their sustainment; and
comparative advantage ‐ Australian producers may be so well versed in the production of certain goods or
services that it is likely to be uneconomic to try and duplicate these capabilities overseas, noting that many
systems on submarines are highly integrated which suggests that little room may exist for Australian entry
into some overseas supply chains.
However, in theory at least, there are an enormous number of combinations and permutations in Australian content
that might apply in the event of a (hypothetical) overseas build of a Collins equivalent submarine starting now. This
paper makes no attempt to canvass them all but does provide the following guidance.
These comments are offered against the background of the systems on submarines being so tightly integrated that it
can be unusually difficult to divide up the work on a submarine between an overseas builder and Australian industry
to achieve some kind of equity objective without adding substantially to both the build’s overall technical and
financial risk. Three Australian industry participation scenarios were developed to hypothetically test the likely
impact of varying levels of industry participation on the modelling outcomes:
Lower Content Scenario ‐ operational test and evaluation of the vessels with a focus on weapons
calibration and signature measurement in Australian waters (but not testing which then requires that the
builder alter vessel structure which might best be undertaken in close proximity to the original construction
facility), testing of the combat system to verify aspects of system functionality and ensure the system is
working to plan, and the provision of specialised components which only Australia can produce for security
reasons (most notably anechoic tiles or ‘cladding’);
Medium Content Scenario ‐ the same as for the Lower Cost Scenario but with the addition of combat
system installation, the production of a Combat System Desk Module which brings together combat system
data for use by operators, and a small number of addition components which in the past have proven to be
economical to produce in Australia such as batteries and pumps; and
Higher Content Scenario ‐ the same as for the Medium Cost Scenario with the addition of a number of
activities relating to the hull (consolidation and fit‐out, the production of cabling and piping and platform
system test and evaluation), a number of activities relating to the combat system (production of sensors,
production of cabinet and console hardware and cabling) and a number of activities in relation to weapons
(installation, test and evaluation).68
68 The three scenarios discussed above were quantified from detailed submarine cost data held by DMO. The first scenario was scoped from
discussions with relevant DMO subject matter experts. The second and third scenarios were scoped with reference to Raytheon Australia, Sea 1000 ‐ A Hybrid Build Precis, op. cit., Sections 4.5, 6.5 and 7.0. However, DMO does not endorse the scenarios presented by Raytheon Australia. These scenarios are adopted purely for the purposes of hypothetical statistical testing.
Building Submarines in Australia – Aspects of Economic Impact ‐ May 2015 93 ______________________________________________________________________________________________
UNCLASSIFIED
93
The Collins database held by DMO allows each of these scenarios to be examined with reference to actual cost data
in terms of dollar values, timing, geographic location and predominant type of work. Although it is unusually difficult
to determine from this information the exact proportion of the cost of these submarines attributable to each
scenario, the data should allow for some very broad parameters to be set ‐ with the principal objective of testing
for the sensitivity of economic impact to a shift in content levels.
On this basis, the proportion of the total cost of the Collins submarines made up of Australian content under the
Lower Content Scenario described above is estimated to be in the order of 5 percent. The proportions of the total
cost of the Collins submarines made up of Australian content under the Medium Content and Higher Content
Scenarios are estimated to be in the order of 15 percent and 21 percent, respectively. For logistical reasons, only the
Low and High scenarios are tested as part of the modelling strategy.
The scenarios described above cover activities which are technically possible to carry out in Australia. However, this
does not necessarily mean that all of the tasks covered are necessarily economic to perform domestically, especially
the tasks in the Medium and High Content categories. That is, while domestic production might be possible from an
engineering perspective, some activities may push up the price of an overseas produced submarine.
It is not possible at this stage to determine how large these price increases might be. However, recognising that the
Australian content associated with an overseas submarine build and the price of that build might not be completely
independent of each other, it is possible to model the economic impact of an overseas build under a range of both
Australian content and price premium scenarios.
The modelling strategy in relation to an overseas submarine build has therefore been structured to test Low and
High Content scenarios under four hypothetical levels of price premium ‐ 0 percent, 10 percent, 20 percent and 30
percent. In this case, a 0 percent premium represents a situation in which the level of Australian industry
participation in a submarine built for the most part offshore is fully price competitive. The 10 percent, 20 percent
and 30 percent price premiums represent a situation in which the same levels of Australian industry participation
might contribute, along with the intrinsic competitiveness of Australia’s submarine build capacity more generally, to
Defence paying a higher price for a domestically built vessel than one produced overseas.
Building Submarines in Australia – Aspects of Economic Impact ‐ May 2015 94 ______________________________________________________________________________________________
UNCLASSIFIED
94
Attachment G
The Cost of Collins
Build Process
Building the Collins class submarines commenced in 1987 and had largely finished in 2003 by which time six vessels
had been delivered. The overall build process commenced with initial design work ‐ much of which was conducted
overseas ‐ before progressing to the mainly domestic tasks of constructing docks and other support facilities,
fabricating hull sections, developing the combat system and sensor equipment, bringing together other major inputs
such as the propulsion unit and armaments, integrating the myriad of systems on‐board, fitting out the vessels in
their final form and then preparing them for operational use through an extensive series of tests and evaluations.
The submarines currently in service are a product of a design phase, initial construction, rectification work to deliver
the vessels to their required specification and a series of separate investments subsequently made by Government
to enhance performance and bring the vessels to their current level of capability. These three core tasks were
managed by Defence through five separate procurement projects ‐ some with multiple phases ‐ to make up what
is, for the purpose of this report, the Collins ‘build’ project.
From a cost break‐down perspective, five features of the Collins build stand out: the costs of initial construction far
outweighed the cost of subsequent rectification and enhancement; two constituent parts to the submarines
dominated the vessels’ overall costs, namely the hull and the combat system ‐ which absorbed Defence
expenditure in roughly equal proportions; constructing the submarines was labour intensive, with the majority of
labour costs being associated with ‘white collar’ rather than ‘blue collar’ skills; the majority of overall costs, including
those relating to white collar labour, were fixed rather than variable which means that they had to be incurred
largely irrespective of how many submarines were produced; and, it was not until the third of the six vessels was
completed that scale and related efficiencies were able to be substantially realised and the unit costs of the
submarines potentially minimised (though unit costs increased again as the project approached its end).
The submarines had a high level of Australian content. While certain critical inputs ‐ such as design expertise,
propulsion units, weapons and eventually most of the combat system ‐ were imported, the majority of remaining
labour and material inputs appear to have been sourced from, or at least through, Australian‐based providers.
Attachment I profiles some of the labour skills involved.
A relatively high labour content was driven in part by the large amounts of computer software driving the onboard
systems and submarine construction not lending itself to the kinds of automated approaches to production
characteristic of large scale manufacture. Indeed, even in an area as specialised as advanced weapons systems
including naval surface combatants, the Collins submarine stood out as a bespoke product.
Construction of the submarines drew on an extended in‐country supply chain consisting of hundreds of individual
firms. Nonetheless, much of the work conducted on the vessels within Australia appears to have been concentrated
in just a few companies ‐ and conducted at a small number of geographic locations.
Indeed, fully half of the work undertaken on the submarines in Australia is estimated to have been retained by the
prime‐contractor, the Australian Submarine Corporation (ASC) in Adelaide. And the largest 10 Australian‐based
Building Submarines in Australia – Aspects of Economic Impact ‐ May 2015 95 ______________________________________________________________________________________________
UNCLASSIFIED
95
suppliers to the largest phase of the Collins project covering initial construction absorbed, and were seemingly able
to retain, nearly 90 percent of all domestic project expenditure. South Australia and New South Wales attracted the
lion’s share of in‐country industry activity.
Finally, the Collins submarine is by most measures one of Australia’s single largest public infrastructure projects. A
Future Submarine might be even bigger. Compared to most major public infrastructure projects in the transport,
energy and communications sectors, building the Collins submarines ranks historically as a large and complex
investment.
Build and Related Data
The aggregate costs of the Collins submarine build are well defined in Defence contracting and financial data.
Although a good deal of care is required to ensure that all aspects of the build are taken into account ‐ including
initial design, the buildings, structures, plant and machinery used in their construction and the effort devoted to
bringing the vessels from dockyard completion to operational readiness ‐ sufficient data are available to derive a
reliable aggregate cost figure.
For modelling purposes, the way in which aggregate costs were distributed ‐ from both engineering and geographic
perspectives ‐ was ascertained from extensive financial records held within Defence. These records detailed the
value and timing of Departmental expenditure on the various elements which make up the submarines, to a high
level of granularity.
The records held by Defence also identified with less precision, but still with reasonable clarity, whether these
elements were drawn from Australian or overseas sources. For modelling purposes, the origins of the items were
determined primarily on the basis of the different currencies in which individual financial transactions were specified
‐ with appropriate adjustments made for the fact that, in a relatively small number of cases, the currency used for
contractual purposes differed from the country in which work on the submarines actually took place.
This approach to measurement is likely to overstate Australian content, as that content is ascribed to the products of
firms which may have been Australian‐based but imported some of their inputs ‐ and bias economic impact figures
upwards.
The records also revealed in some detail where in Australia work occurred, after adjusting for the fact that the
location of a company’s headquarters receiving payment for its involvement with the Collins build project may not
necessarily have been the location of the company’s production facilities.
Some of the outlays required to bring the Collins submarines to their current level of capability were managed
directly through contracts between Defence and suppliers other than the prime builder, ASC. Given the amounts
involved and the fact that the type of build activities covered by these outlays differ in their economic characteristics
from the other inputs to a submarine build, the amounts should be considered when estimating economic impact.
The relevant data were drawn from Defence’s own records.
The distribution over time of the Collins cost data was influenced by the fact that the contract for initial construction
was ‘front‐loaded’. That is, payments were made to the submarine builder and some of its suppliers before
corresponding work took place. This applied even after allowing for a practice, common in large infrastructure
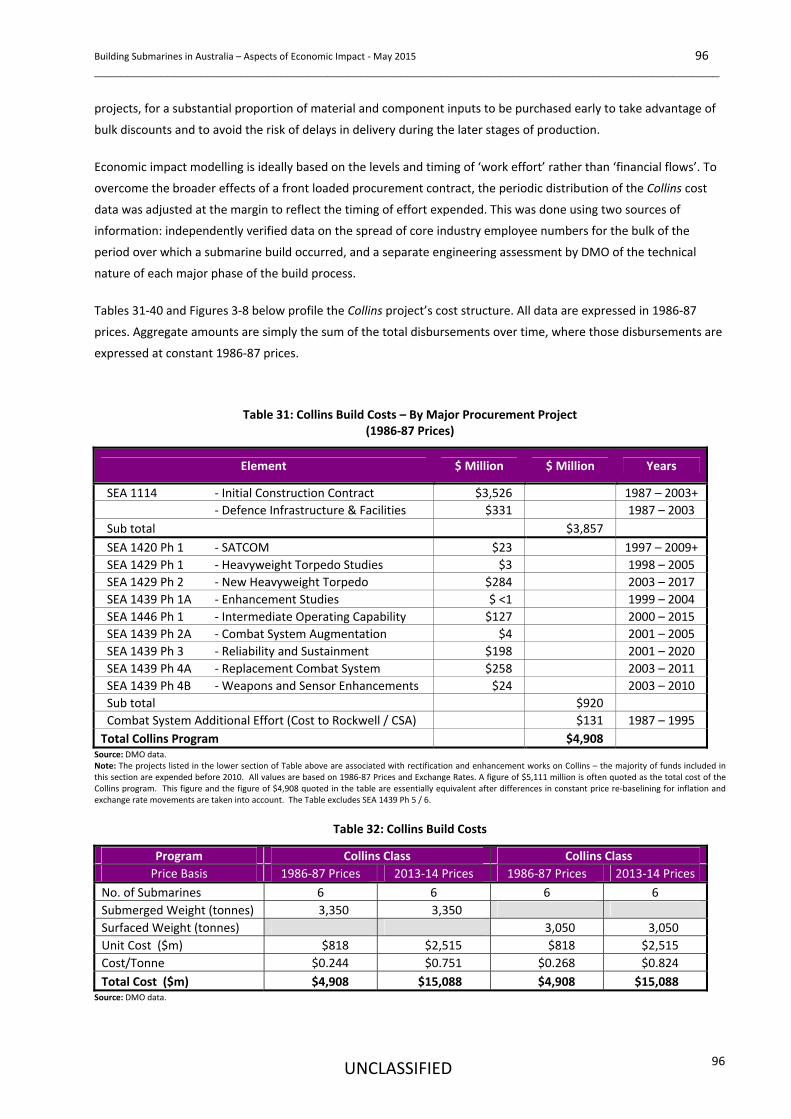
Building Submarines in Australia – Aspects of Economic Impact ‐ May 2015 96 ______________________________________________________________________________________________
UNCLASSIFIED
96
projects, for a substantial proportion of material and component inputs to be purchased early to take advantage of
bulk discounts and to avoid the risk of delays in delivery during the later stages of production.
Economic impact modelling is ideally based on the levels and timing of ‘work effort’ rather than ‘financial flows’. To
overcome the broader effects of a front loaded procurement contract, the periodic distribution of the Collins cost
data was adjusted at the margin to reflect the timing of effort expended. This was done using two sources of
information: independently verified data on the spread of core industry employee numbers for the bulk of the
period over which a submarine build occurred, and a separate engineering assessment by DMO of the technical
nature of each major phase of the build process.
Tables 31‐40 and Figures 3‐8 below profile the Collins project’s cost structure. All data are expressed in 1986‐87
prices. Aggregate amounts are simply the sum of the total disbursements over time, where those disbursements are
expressed at constant 1986‐87 prices.
Table 31: Collins Build Costs – By Major Procurement Project (1986‐87 Prices)
Element $ Million $ Million Years
SEA 1114 ‐ Initial Construction Contract $3,526 1987 – 2003+
‐ Defence Infrastructure & Facilities $331 1987 – 2003
Sub total $3,857
SEA 1420 Ph 1 ‐ SATCOM $23 1997 – 2009+
SEA 1429 Ph 1 ‐ Heavyweight Torpedo Studies $3 1998 – 2005
SEA 1429 Ph 2 ‐ New Heavyweight Torpedo $284 2003 – 2017
SEA 1439 Ph 1A ‐ Enhancement Studies $ <1 1999 – 2004
SEA 1446 Ph 1 ‐ Intermediate Operating Capability $127 2000 – 2015
SEA 1439 Ph 2A ‐ Combat System Augmentation $4 2001 – 2005
SEA 1439 Ph 3 ‐ Reliability and Sustainment $198 2001 – 2020
SEA 1439 Ph 4A ‐ Replacement Combat System $258 2003 – 2011
SEA 1439 Ph 4B ‐ Weapons and Sensor Enhancements $24 2003 – 2010
Sub total $920
Combat System Additional Effort (Cost to Rockwell / CSA) $131 1987 – 1995
Total Collins Program $4,908 Source: DMO data. Note: The projects listed in the lower section of Table above are associated with rectification and enhancement works on Collins – the majority of funds included in this section are expended before 2010. All values are based on 1986‐87 Prices and Exchange Rates. A figure of $5,111 million is often quoted as the total cost of the Collins program. This figure and the figure of $4,908 quoted in the table are essentially equivalent after differences in constant price re‐baselining for inflation and exchange rate movements are taken into account. The Table excludes SEA 1439 Ph 5 / 6.
Table 32: Collins Build Costs
Program Collins Class Collins Class
Price Basis 1986‐87 Prices 2013‐14 Prices 1986‐87 Prices 2013‐14 Prices
No. of Submarines 6 6 6 6
Submerged Weight (tonnes) 3,350 3,350
Surfaced Weight (tonnes) 3,050 3,050
Unit Cost ($m) $818 $2,515 $818 $2,515
Cost/Tonne $0.244 $0.751 $0.268 $0.824
Total Cost ($m) $4,908 $15,088 $4,908 $15,088 Source: DMO data.
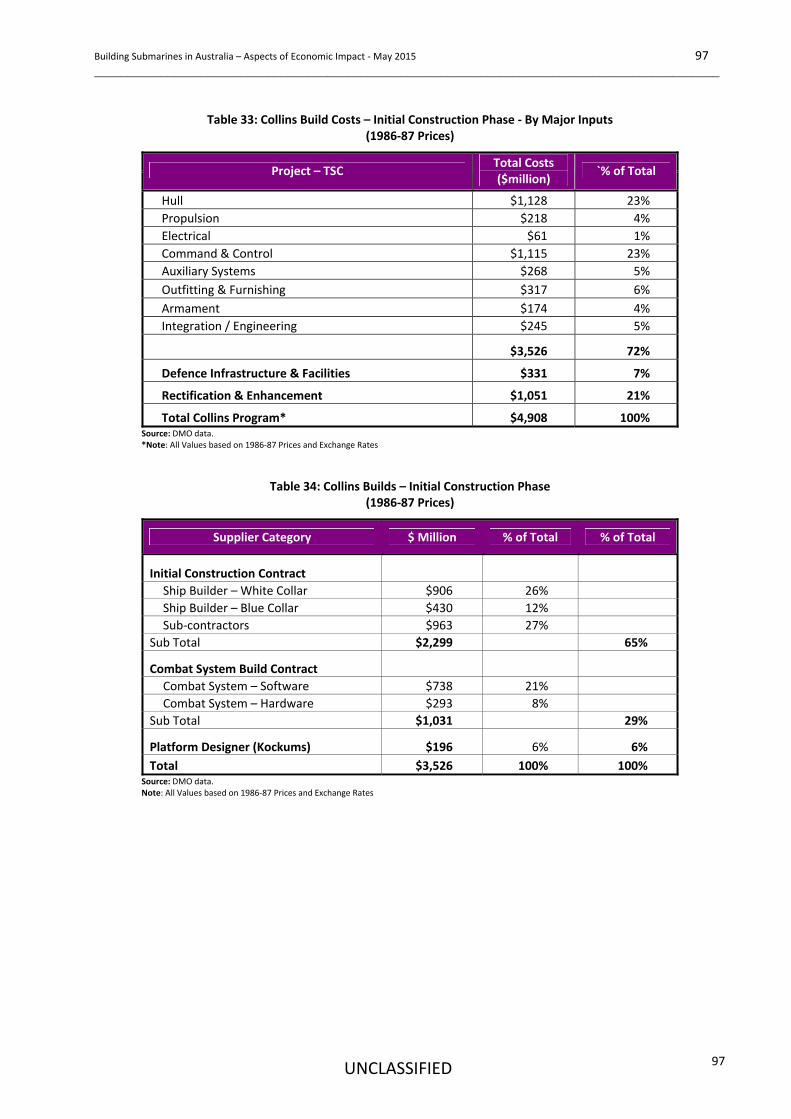
Building Submarines in Australia – Aspects of Economic Impact ‐ May 2015 97 ______________________________________________________________________________________________
UNCLASSIFIED
97
Table 33: Collins Build Costs – Initial Construction Phase ‐ By Major Inputs
(1986‐87 Prices)
Project – TSC Total Costs ($million)
`% of Total
Hull $1,128 23%
Propulsion $218 4%
Electrical $61 1%
Command & Control $1,115 23%
Auxiliary Systems $268 5%
Outfitting & Furnishing $317 6%
Armament $174 4%
Integration / Engineering $245 5%
$3,526 72%
Defence Infrastructure & Facilities $331 7%
Rectification & Enhancement $1,051 21%
Total Collins Program* $4,908 100% Source: DMO data. *Note: All Values based on 1986‐87 Prices and Exchange Rates
Table 34: Collins Builds – Initial Construction Phase
(1986‐87 Prices)
Supplier Category $ Million % of Total % of Total
Initial Construction Contract
Ship Builder – White Collar $906 26%
Ship Builder – Blue Collar $430 12%
Sub‐contractors $963 27%
Sub Total $2,299 65%
Combat System Build Contract
Combat System – Software $738 21%
Combat System – Hardware $293 8%
Sub Total $1,031 29%
Platform Designer (Kockums) $196 6% 6%
Total $3,526 100% 100% Source: DMO data. Note: All Values based on 1986‐87 Prices and Exchange Rates
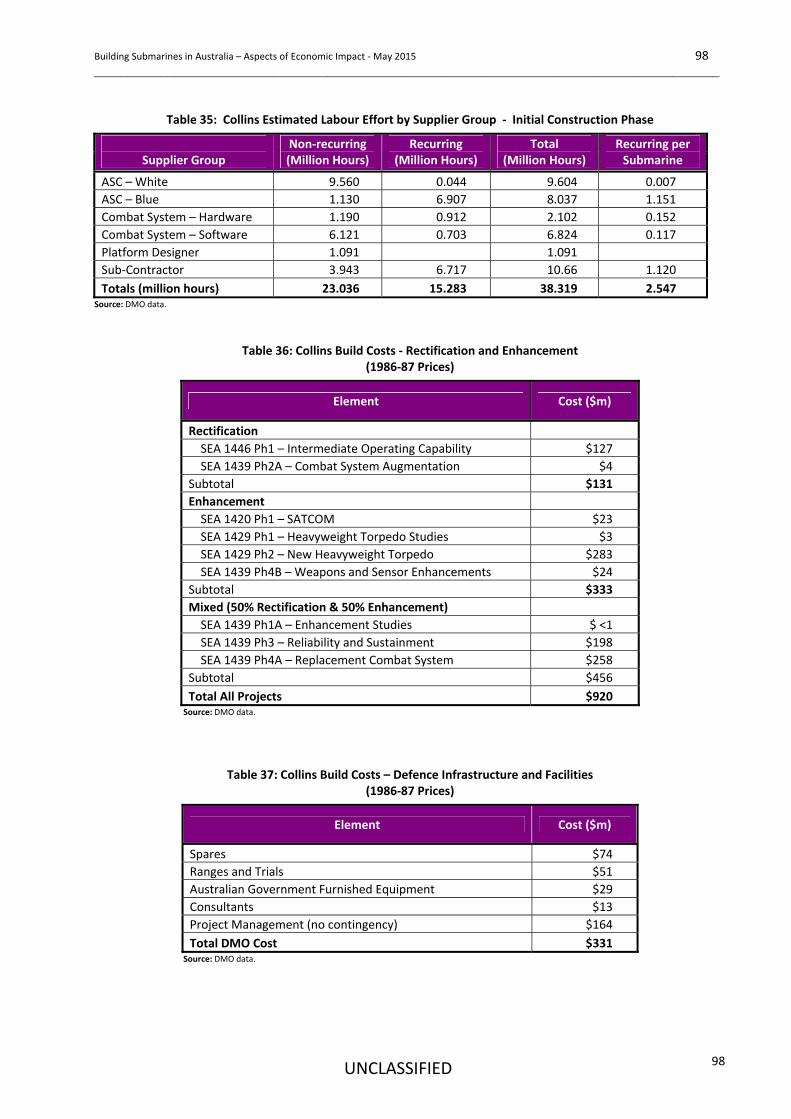
Building Submarines in Australia – Aspects of Economic Impact ‐ May 2015 98 ______________________________________________________________________________________________
UNCLASSIFIED
98
Table 35: Collins Estimated Labour Effort by Supplier Group ‐ Initial Construction Phase
Supplier Group
Non‐recurring (Million Hours)
Recurring (Million Hours)
Total (Million Hours)
Recurring per Submarine
ASC – White 9.560 0.044 9.604 0.007
ASC – Blue 1.130 6.907 8.037 1.151
Combat System – Hardware 1.190 0.912 2.102 0.152
Combat System – Software 6.121 0.703 6.824 0.117
Platform Designer 1.091 1.091
Sub‐Contractor 3.943 6.717 10.66 1.120
Totals (million hours) 23.036 15.283 38.319 2.547 Source: DMO data.
Table 36: Collins Build Costs ‐ Rectification and Enhancement (1986‐87 Prices)
Element Cost ($m)
Rectification
SEA 1446 Ph1 – Intermediate Operating Capability $127
SEA 1439 Ph2A – Combat System Augmentation $4
Subtotal $131
Enhancement
SEA 1420 Ph1 – SATCOM $23
SEA 1429 Ph1 – Heavyweight Torpedo Studies $3
SEA 1429 Ph2 – New Heavyweight Torpedo $283
SEA 1439 Ph4B – Weapons and Sensor Enhancements $24
Subtotal $333
Mixed (50% Rectification & 50% Enhancement)
SEA 1439 Ph1A – Enhancement Studies $ <1
SEA 1439 Ph3 – Reliability and Sustainment $198
SEA 1439 Ph4A – Replacement Combat System $258
Subtotal $456
Total All Projects $920 Source: DMO data.
Table 37: Collins Build Costs – Defence Infrastructure and Facilities (1986‐87 Prices)
Element Cost ($m)
Spares $74
Ranges and Trials $51
Australian Government Furnished Equipment $29
Consultants $13
Project Management (no contingency) $164
Total DMO Cost $331 Source: DMO data.
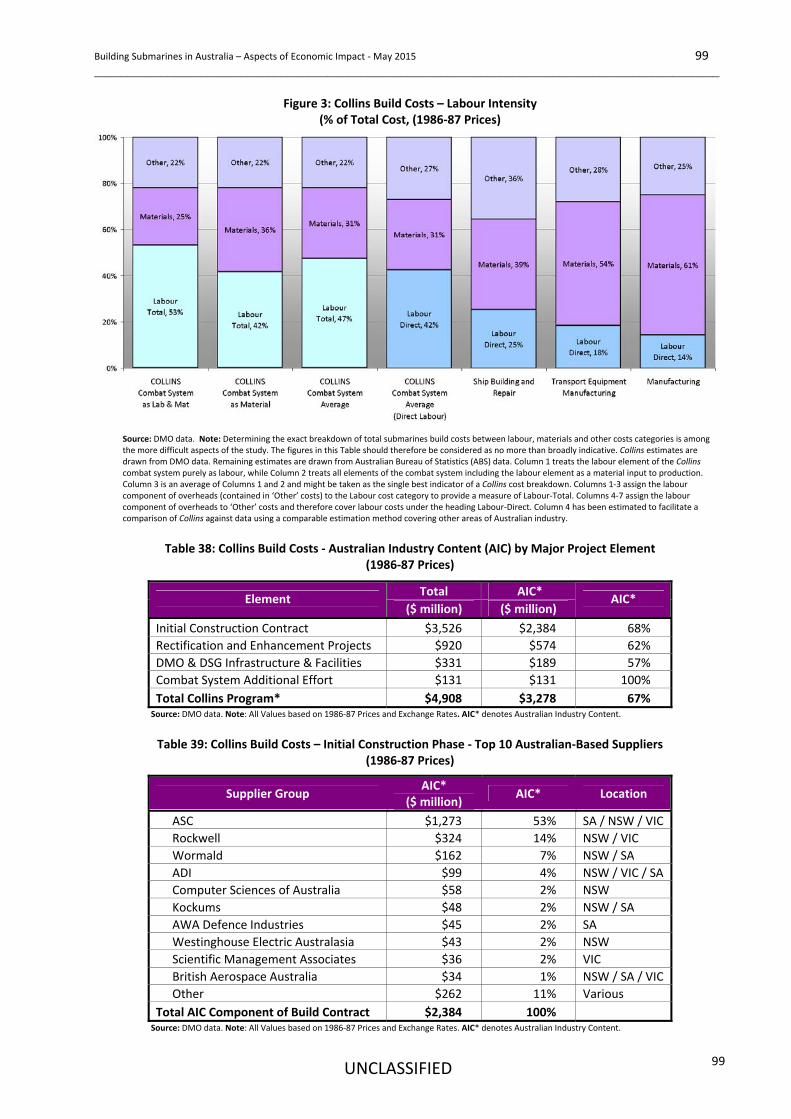
Building Submarines in Australia – Aspects of Economic Impact ‐ May 2015 99 ______________________________________________________________________________________________
UNCLASSIFIED
99
Figure 3: Collins Build Costs – Labour Intensity (% of Total Cost, (1986‐87 Prices)
Source: DMO data. Note: Determining the exact breakdown of total submarines build costs between labour, materials and other costs categories is among the more difficult aspects of the study. The figures in this Table should therefore be considered as no more than broadly indicative. Collins estimates are drawn from DMO data. Remaining estimates are drawn from Australian Bureau of Statistics (ABS) data. Column 1 treats the labour element of the Collins combat system purely as labour, while Column 2 treats all elements of the combat system including the labour element as a material input to production. Column 3 is an average of Columns 1 and 2 and might be taken as the single best indicator of a Collins cost breakdown. Columns 1‐3 assign the labour component of overheads (contained in ‘Other’ costs) to the Labour cost category to provide a measure of Labour‐Total. Columns 4‐7 assign the labour component of overheads to ‘Other’ costs and therefore cover labour costs under the heading Labour‐Direct. Column 4 has been estimated to facilitate a comparison of Collins against data using a comparable estimation method covering other areas of Australian industry.
Table 38: Collins Build Costs ‐ Australian Industry Content (AIC) by Major Project Element
(1986‐87 Prices)
Total AIC* Element
($ million) ($ million) AIC*
Initial Construction Contract $3,526 $2,384 68%
Rectification and Enhancement Projects $920 $574 62%
DMO & DSG Infrastructure & Facilities $331 $189 57%
Combat System Additional Effort $131 $131 100%
Total Collins Program* $4,908 $3,278 67% Source: DMO data. Note: All Values based on 1986‐87 Prices and Exchange Rates. AIC* denotes Australian Industry Content.
Table 39: Collins Build Costs – Initial Construction Phase ‐ Top 10 Australian‐Based Suppliers
(1986‐87 Prices)
Supplier Group AIC*
($ million) AIC* Location
ASC $1,273 53% SA / NSW / VIC
Rockwell $324 14% NSW / VIC
Wormald $162 7% NSW / SA
ADI $99 4% NSW / VIC / SA
Computer Sciences of Australia $58 2% NSW
Kockums $48 2% NSW / SA
AWA Defence Industries $45 2% SA
Westinghouse Electric Australasia $43 2% NSW
Scientific Management Associates $36 2% VIC
British Aerospace Australia $34 1% NSW / SA / VIC
Other $262 11% Various
Total AIC Component of Build Contract $2,384 100% Source: DMO data. Note: All Values based on 1986‐87 Prices and Exchange Rates. AIC* denotes Australian Industry Content.
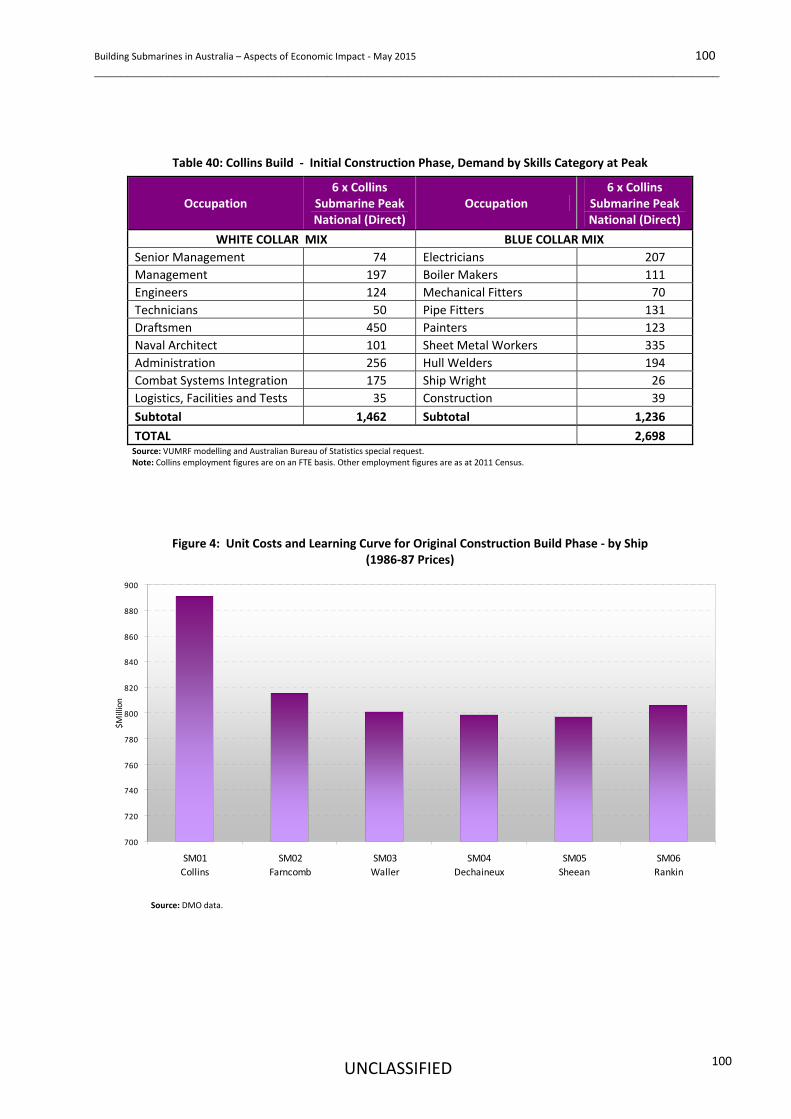
Building Submarines in Australia – Aspects of Economic Impact ‐ May 2015 100 ______________________________________________________________________________________________
UNCLASSIFIED
100
Table 40: Collins Build ‐ Initial Construction Phase, Demand by Skills Category at Peak
Occupation 6 x Collins
Submarine Peak National (Direct)
Occupation 6 x Collins
Submarine Peak National (Direct)
WHITE COLLAR MIX BLUE COLLAR MIX
Senior Management 74 Electricians 207
Management 197 Boiler Makers 111
Engineers 124 Mechanical Fitters 70
Technicians 50 Pipe Fitters 131
Draftsmen 450 Painters 123
Naval Architect 101 Sheet Metal Workers 335
Administration 256 Hull Welders 194
Combat Systems Integration 175 Ship Wright 26
Logistics, Facilities and Tests 35 Construction 39
Subtotal 1,462 Subtotal 1,236
TOTAL 2,698 Source: VUMRF modelling and Australian Bureau of Statistics special request. Note: Collins employment figures are on an FTE basis. Other employment figures are as at 2011 Census.
Figure 4: Unit Costs and Learning Curve for Original Construction Build Phase ‐ by Ship (1986‐87 Prices)
700
720
740
760
780
800
820
840
860
880
900
SM01
Collins
SM02
Farncomb
SM03
Waller
SM04
Dechaineux
SM05
Sheean
SM06
Rankin
$Million
Source: DMO data.
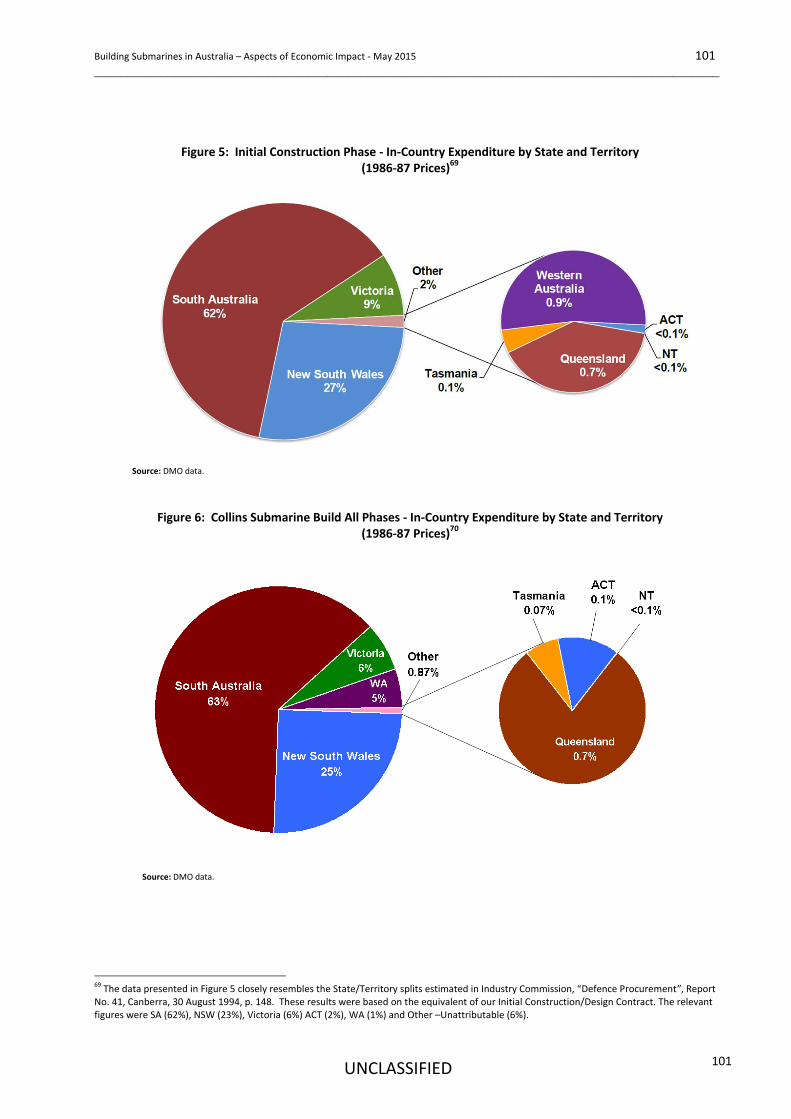
Building Submarines in Australia – Aspects of Economic Impact ‐ May 2015 101 ______________________________________________________________________________________________
UNCLASSIFIED
101
Figure 5: Initial Construction Phase ‐ In‐Country Expenditure by State and Territory (1986‐87 Prices)69
Source: DMO data.
Figure 6: Collins Submarine Build All Phases ‐ In‐Country Expenditure by State and Territory (1986‐87 Prices)70
Source: DMO data.
69 The data presented in Figure 5 closely resembles the State/Territory splits estimated in Industry Commission, “Defence Procurement”, Report
No. 41, Canberra, 30 August 1994, p. 148. These results were based on the equivalent of our Initial Construction/Design Contract. The relevant figures were SA (62%), NSW (23%), Victoria (6%) ACT (2%), WA (1%) and Other –Unattributable (6%).
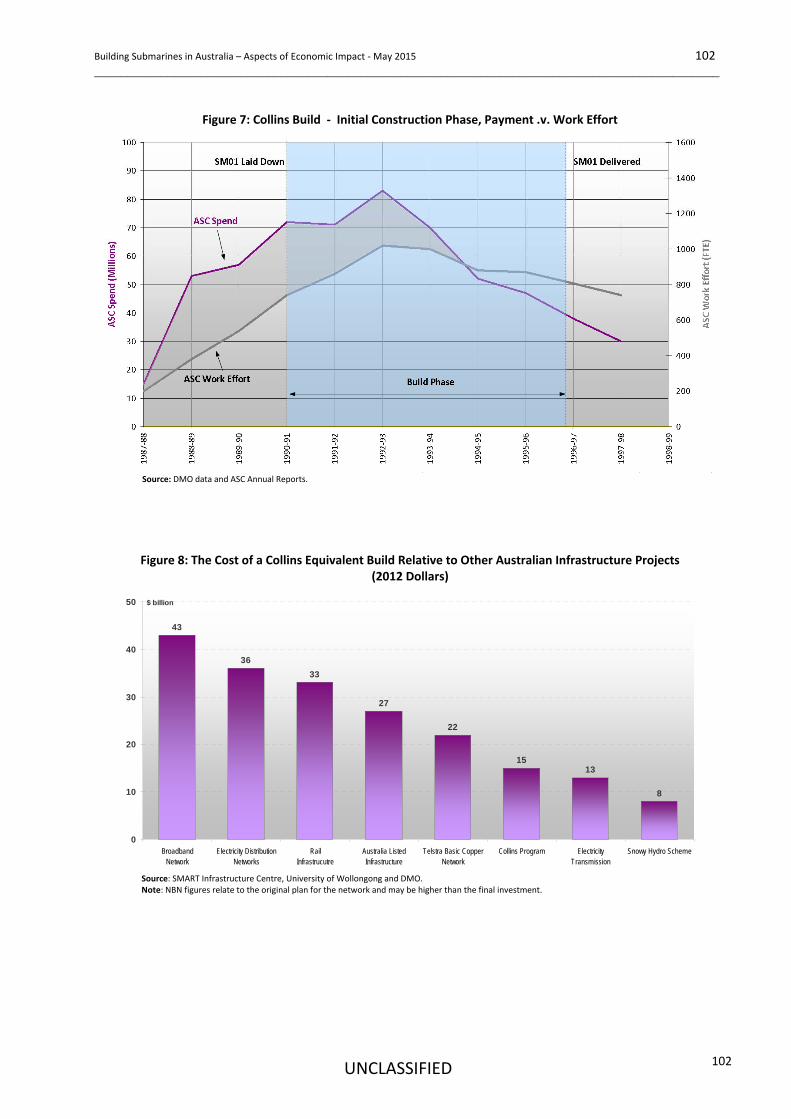
Building Submarines in Australia – Aspects of Economic Impact ‐ May 2015 102 ______________________________________________________________________________________________
UNCLASSIFIED
102
Figure 7: Collins Build ‐ Initial Construction Phase, Payment .v. Work Effort
Source: DMO data and ASC Annual Reports.
Figure 8: The Cost of a Collins Equivalent Build Relative to Other Australian Infrastructure Projects (2012 Dollars)
43
36
33
27
22
1513
8
0
10
20
30
40
50
BroadbandNetwork
Electricity DistributionNetworks
RailInfrastrucutre
Australia ListedInfrastructure
Telstra Basic CopperNetwork
Collins Program ElectricityTransmission
Snowy Hydro Scheme
$ billion
Source: SMART Infrastructure Centre, University of Wollongong and DMO. Note: NBN figures relate to the original plan for the network and may be higher than the final investment.
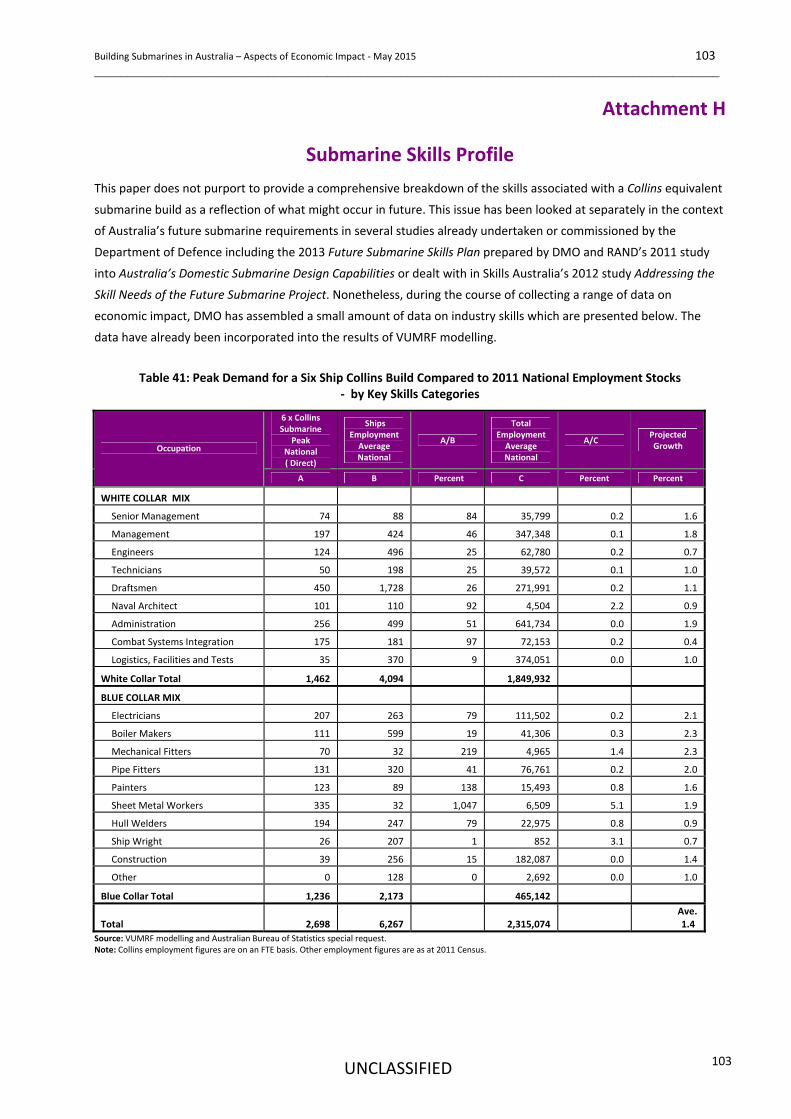
Building Submarines in Australia – Aspects of Economic Impact ‐ May 2015 103 ______________________________________________________________________________________________
UNCLASSIFIED
103
Attachment H
Submarine Skills Profile
This paper does not purport to provide a comprehensive breakdown of the skills associated with a Collins equivalent
submarine build as a reflection of what might occur in future. This issue has been looked at separately in the context
of Australia’s future submarine requirements in several studies already undertaken or commissioned by the
Department of Defence including the 2013 Future Submarine Skills Plan prepared by DMO and RAND’s 2011 study
into Australia’s Domestic Submarine Design Capabilities or dealt with in Skills Australia’s 2012 study Addressing the
Skill Needs of the Future Submarine Project. Nonetheless, during the course of collecting a range of data on
economic impact, DMO has assembled a small amount of data on industry skills which are presented below. The
data have already been incorporated into the results of VUMRF modelling.
Table 41: Peak Demand for a Six Ship Collins Build Compared to 2011 National Employment Stocks
‐ by Key Skills Categories
6 x Collins Submarine
Peak National ( Direct)
Ships Employment Average National
A/B
Total Employment Average National
A/C Projected Growth Occupation
A B Percent C Percent Percent
WHITE COLLAR MIX
Senior Management 74 88 84 35,799 0.2 1.6
Management 197 424 46 347,348 0.1 1.8
Engineers 124 496 25 62,780 0.2 0.7
Technicians 50 198 25 39,572 0.1 1.0
Draftsmen 450 1,728 26 271,991 0.2 1.1
Naval Architect 101 110 92 4,504 2.2 0.9
Administration 256 499 51 641,734 0.0 1.9
Combat Systems Integration 175 181 97 72,153 0.2 0.4
Logistics, Facilities and Tests 35 370 9 374,051 0.0 1.0
White Collar Total 1,462 4,094 1,849,932
BLUE COLLAR MIX
Electricians 207 263 79 111,502 0.2 2.1
Boiler Makers 111 599 19 41,306 0.3 2.3
Mechanical Fitters 70 32 219 4,965 1.4 2.3
Pipe Fitters 131 320 41 76,761 0.2 2.0
Painters 123 89 138 15,493 0.8 1.6
Sheet Metal Workers 335 32 1,047 6,509 5.1 1.9
Hull Welders 194 247 79 22,975 0.8 0.9
Ship Wright 26 207 1 852 3.1 0.7
Construction 39 256 15 182,087 0.0 1.4
Other 0 128 0 2,692 0.0 1.0
Blue Collar Total 1,236 2,173 465,142
Total 2,698 6,267 2,315,074 Ave. 1.4
Source: VUMRF modelling and Australian Bureau of Statistics special request. Note: Collins employment figures are on an FTE basis. Other employment figures are as at 2011 Census.
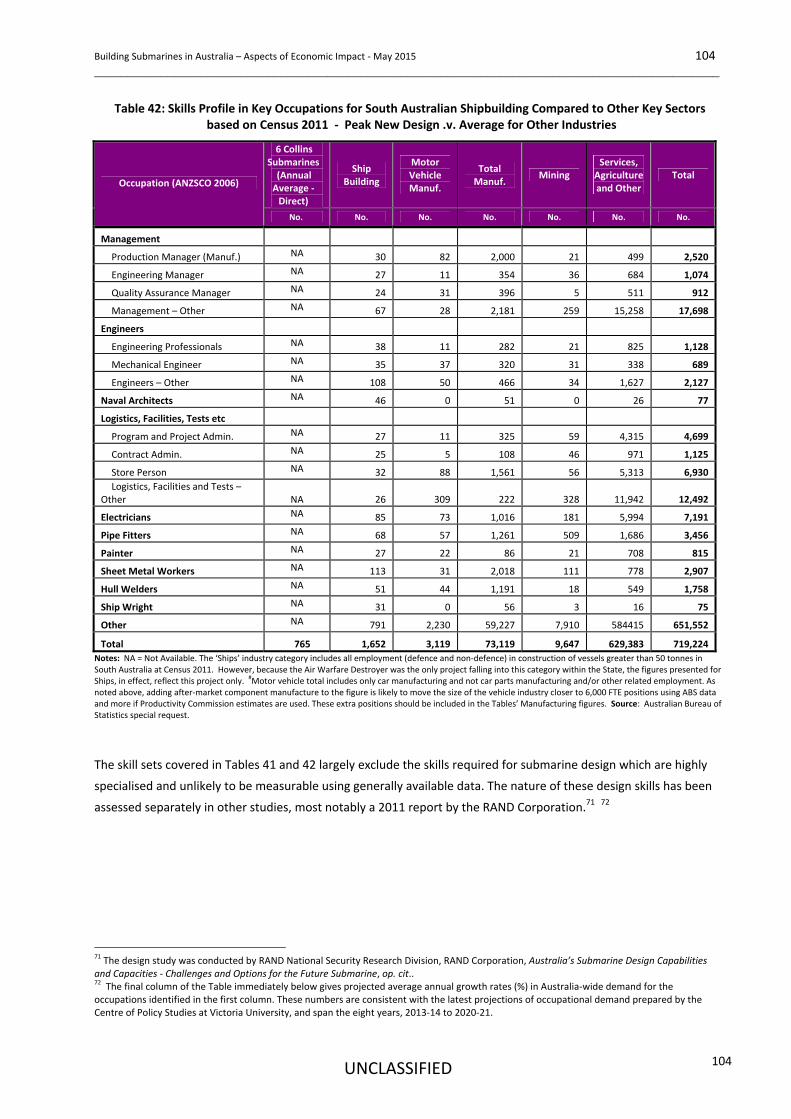
Building Submarines in Australia – Aspects of Economic Impact ‐ May 2015 104 ______________________________________________________________________________________________
UNCLASSIFIED
104
Table 42: Skills Profile in Key Occupations for South Australian Shipbuilding Compared to Other Key Sectors based on Census 2011 ‐ Peak New Design .v. Average for Other Industries
6 Collins Submarines (Annual Average ‐ Direct)
Ship Building
Motor Vehicle Manuf.
Total Manuf.
Mining Services, Agriculture and Other
Total Occupation (ANZSCO 2006)
No. No. No. No. No. No. No.
Management
Production Manager (Manuf.) NA 30 82 2,000 21 499 2,520
Engineering Manager NA 27 11 354 36 684 1,074
Quality Assurance Manager NA 24 31 396 5 511 912
Management – Other NA 67 28 2,181 259 15,258 17,698
Engineers
Engineering Professionals NA 38 11 282 21 825 1,128
Mechanical Engineer NA 35 37 320 31 338 689
Engineers – Other NA 108 50 466 34 1,627 2,127
Naval Architects NA 46 0 51 0 26 77
Logistics, Facilities, Tests etc
Program and Project Admin. NA 27 11 325 59 4,315 4,699
Contract Admin. NA 25 5 108 46 971 1,125
Store Person NA 32 88 1,561 56 5,313 6,930
Logistics, Facilities and Tests – Other
NA 26 309 222 328 11,942 12,492
Electricians NA 85 73 1,016 181 5,994 7,191
Pipe Fitters NA 68 57 1,261 509 1,686 3,456
Painter NA 27 22 86 21 708 815
Sheet Metal Workers NA 113 31 2,018 111 778 2,907
Hull Welders NA 51 44 1,191 18 549 1,758
Ship Wright NA 31 0 56 3 16 75
Other NA 791 2,230 59,227 7,910 584415 651,552
Total 765 1,652 3,119 73,119 9,647 629,383 719,224
Notes: NA = Not Available. The ‘Ships’ industry category includes all employment (defence and non‐defence) in construction of vessels greater than 50 tonnes in South Australia at Census 2011. However, because the Air Warfare Destroyer was the only project falling into this category within the State, the figures presented for Ships, in effect, reflect this project only. #Motor vehicle total includes only car manufacturing and not car parts manufacturing and/or other related employment. As noted above, adding after‐market component manufacture to the figure is likely to move the size of the vehicle industry closer to 6,000 FTE positions using ABS data and more if Productivity Commission estimates are used. These extra positions should be included in the Tables’ Manufacturing figures. Source: Australian Bureau of Statistics special request.
The skill sets covered in Tables 41 and 42 largely exclude the skills required for submarine design which are highly
specialised and unlikely to be measurable using generally available data. The nature of these design skills has been
assessed separately in other studies, most notably a 2011 report by the RAND Corporation.71 72
71 The design study was conducted by RAND National Security Research Division, RAND Corporation, Australia’s Submarine Design Capabilities
and Capacities ‐ Challenges and Options for the Future Submarine, op. cit.. 72 The final column of the Table immediately below gives projected average annual growth rates (%) in Australia‐wide demand for the
occupations identified in the first column. These numbers are consistent with the latest projections of occupational demand prepared by the Centre of Policy Studies at Victoria University, and span the eight years, 2013‐14 to 2020‐21.
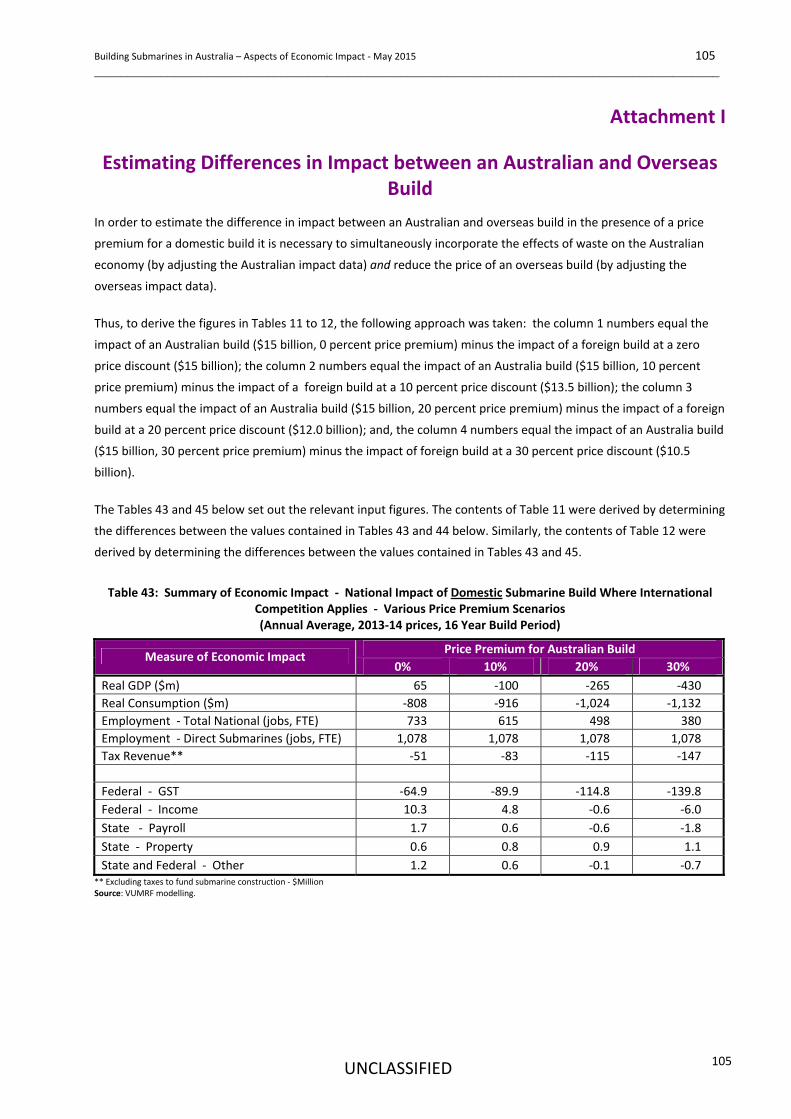
Building Submarines in Australia – Aspects of Economic Impact ‐ May 2015 105 ______________________________________________________________________________________________
UNCLASSIFIED
105
Attachment I
Estimating Differences in Impact between an Australian and Overseas Build
In order to estimate the difference in impact between an Australian and overseas build in the presence of a price
premium for a domestic build it is necessary to simultaneously incorporate the effects of waste on the Australian
economy (by adjusting the Australian impact data) and reduce the price of an overseas build (by adjusting the
overseas impact data).
Thus, to derive the figures in Tables 11 to 12, the following approach was taken: the column 1 numbers equal the
impact of an Australian build ($15 billion, 0 percent price premium) minus the impact of a foreign build at a zero
price discount ($15 billion); the column 2 numbers equal the impact of an Australia build ($15 billion, 10 percent
price premium) minus the impact of a foreign build at a 10 percent price discount ($13.5 billion); the column 3
numbers equal the impact of an Australia build ($15 billion, 20 percent price premium) minus the impact of a foreign
build at a 20 percent price discount ($12.0 billion); and, the column 4 numbers equal the impact of an Australia build
($15 billion, 30 percent price premium) minus the impact of foreign build at a 30 percent price discount ($10.5
billion).
The Tables 43 and 45 below set out the relevant input figures. The contents of Table 11 were derived by determining
the differences between the values contained in Tables 43 and 44 below. Similarly, the contents of Table 12 were
derived by determining the differences between the values contained in Tables 43 and 45.
Table 43: Summary of Economic Impact ‐ National Impact of Domestic Submarine Build Where International
Competition Applies ‐ Various Price Premium Scenarios (Annual Average, 2013‐14 prices, 16 Year Build Period)
Price Premium for Australian Build Measure of Economic Impact
0% 10% 20% 30%
Real GDP ($m) 65 ‐100 ‐265 ‐430
Real Consumption ($m) ‐808 ‐916 ‐1,024 ‐1,132
Employment ‐ Total National (jobs, FTE) 733 615 498 380
Employment ‐ Direct Submarines (jobs, FTE) 1,078 1,078 1,078 1,078
Tax Revenue** ‐51 ‐83 ‐115 ‐147
Federal ‐ GST ‐64.9 ‐89.9 ‐114.8 ‐139.8
Federal ‐ Income 10.3 4.8 ‐0.6 ‐6.0
State ‐ Payroll 1.7 0.6 ‐0.6 ‐1.8
State ‐ Property 0.6 0.8 0.9 1.1
State and Federal ‐ Other 1.2 0.6 ‐0.1 ‐0.7 ** Excluding taxes to fund submarine construction ‐ $Million Source: VUMRF modelling.
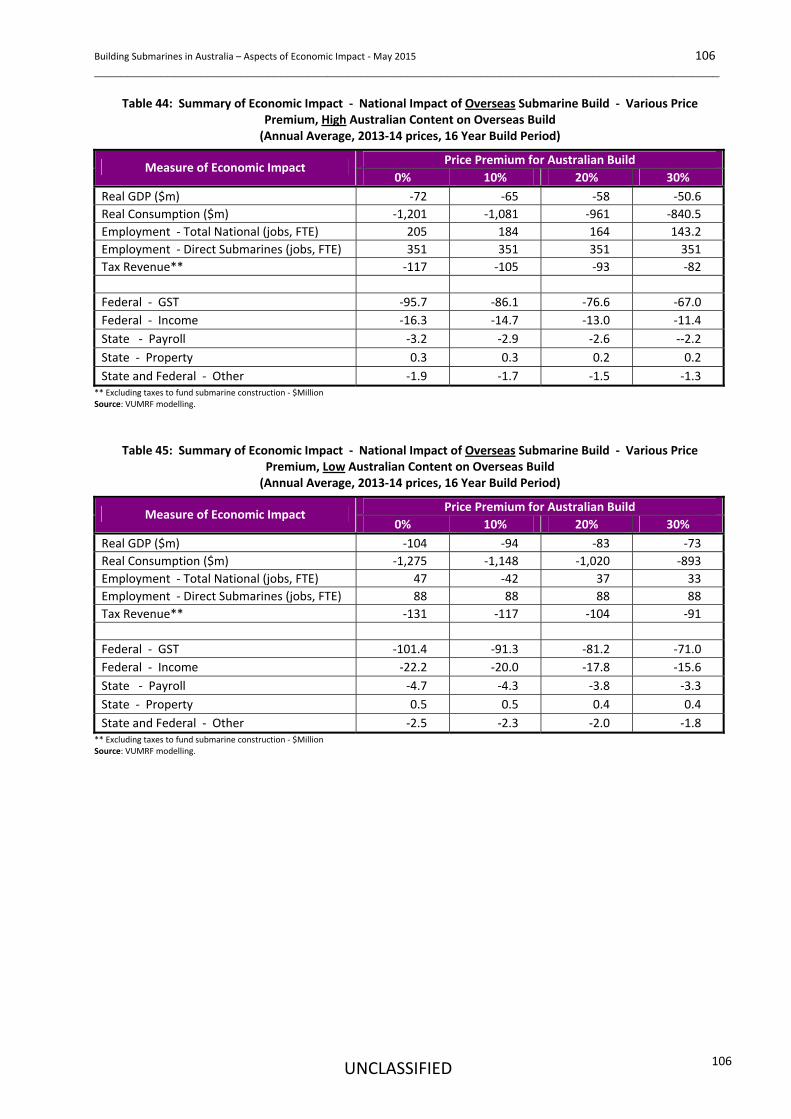
Building Submarines in Australia – Aspects of Economic Impact ‐ May 2015 106 ______________________________________________________________________________________________
UNCLASSIFIED
106
Table 44: Summary of Economic Impact ‐ National Impact of Overseas Submarine Build ‐ Various Price Premium, High Australian Content on Overseas Build (Annual Average, 2013‐14 prices, 16 Year Build Period)
Price Premium for Australian Build Measure of Economic Impact
0% 10% 20% 30%
Real GDP ($m) ‐72 ‐65 ‐58 ‐50.6
Real Consumption ($m) ‐1,201 ‐1,081 ‐961 ‐840.5
Employment ‐ Total National (jobs, FTE) 205 184 164 143.2
Employment ‐ Direct Submarines (jobs, FTE) 351 351 351 351
Tax Revenue** ‐117 ‐105 ‐93 ‐82
Federal ‐ GST ‐95.7 ‐86.1 ‐76.6 ‐67.0
Federal ‐ Income ‐16.3 ‐14.7 ‐13.0 ‐11.4
State ‐ Payroll ‐3.2 ‐2.9 ‐2.6 ‐‐2.2
State ‐ Property 0.3 0.3 0.2 0.2
State and Federal ‐ Other ‐1.9 ‐1.7 ‐1.5 ‐1.3 ** Excluding taxes to fund submarine construction ‐ $Million Source: VUMRF modelling.
Table 45: Summary of Economic Impact ‐ National Impact of Overseas Submarine Build ‐ Various Price Premium, Low Australian Content on Overseas Build (Annual Average, 2013‐14 prices, 16 Year Build Period)
Price Premium for Australian Build Measure of Economic Impact
0% 10% 20% 30%
Real GDP ($m) ‐104 ‐94 ‐83 ‐73
Real Consumption ($m) ‐1,275 ‐1,148 ‐1,020 ‐893
Employment ‐ Total National (jobs, FTE) 47 ‐42 37 33
Employment ‐ Direct Submarines (jobs, FTE) 88 88 88 88
Tax Revenue** ‐131 ‐117 ‐104 ‐91
Federal ‐ GST ‐101.4 ‐91.3 ‐81.2 ‐71.0
Federal ‐ Income ‐22.2 ‐20.0 ‐17.8 ‐15.6
State ‐ Payroll ‐4.7 ‐4.3 ‐3.8 ‐3.3
State ‐ Property 0.5 0.5 0.4 0.4
State and Federal ‐ Other ‐2.5 ‐2.3 ‐2.0 ‐1.8 ** Excluding taxes to fund submarine construction ‐ $Million Source: VUMRF modelling.
Building Submarines in Australia – Aspects of Economic Impact ‐ May 2015 107 ______________________________________________________________________________________________
UNCLASSIFIED
107
Bibliography
ACIL Allen Consulting, Naval Shipbuilding and Through Life Support ‐ Economic Value to Australia, Maintaining Capabilities and Capacity, Canberra, December 2013.
Adams P., MMRF: Monash Multi‐Regional Forecasting Model: A Dynamic Multi‐Regional Applied General Equilibrium Model of the Australian Economy, Monash University, Centre of Policy Studies, 2008.
Alexander W.R.J., “Defence Spending: Burden or Growth‐Promoting?”, Defence and Peace Economics, 1995, 6(1), pp.13‐25.
Alptekin A. and Levine P., “Military Expenditure and Economic Growth: A Meta Analysis”, European Journal of Political Economy, 2012, 28(4), pp.636‐650.
Amesse F., Cohendet P., Poirier A. and Chouinard J., “Economic Effects and Spin‐offs in a Small Space Economy: The Case of Canada”, The Journal of Technology Transfer, 2002, 27, pp.339‐348.
Anselin L., Varga A., Acs Z., "Local Geographic Spillovers between University Research and High Technology Innovations", Journal of Urban Economics, 1997, 42, pp.422‐448.
Audretsch D.B. and Feldman M.P., "R&D Spillovers and the Geography of Innovation and Production’, The American Economic Review, June 1996, 86(3), pp.630‐640.
Awaworyi S. and Yew S.L., The Effect of Military Expenditure on Growth: An Empirical Synthesis, Discussion Paper 25/14, Department of Economics, Monash University, Melbourne, 2014.
Bellais R. and Guichard R., “Defense Innovation, Technology Transfer and Public Policy”, Defence and Peace Economics, 2006, 17(3), pp.273‐286.
Birkler J., et. al, Australia’s Naval Shipbuilding Enterprise ‐ Preparing for the 21st Century, Rand Corporation, Santa Monica, 2015.
Bloom N., Schankerman M. and van Reenen, J., “Identifying Technology Spillovers and Product Market Rivalry”, Econometrica, 3 July 2013, 81(4), pp.1347‐1393.
Caballero R..J. and Jaffe A.B., "How High are the Giants' Shoulders: An Empirical Assessment of Knowledge Spillovers and Creative Destruction in a Model of Economic Growth" in Blanchard and Fischer (eds) NBER Macroeconomics Annual 1993, 8, pp.15‐86.
Claeys P., Gobbib N., Haber G., Jaenicke J., Neck R., Schoors, van Aarle B. and Weyerstrass K., "Economic Spillover and Policy Coordination in the Euro Area", Economic Papers No. 246, European Commission, March 2006.
Coe D.T. and Helpman E., "International R&D Spillovers", Working Paper No.4444, National Bureau of Economic Research, Massachusetts, August 1993.
Cohen W.M. and Levinthal D.A., "Absorptive Capacity: A New Perspective on Learning and Innovation", Administrative Science Quarterly, March 1990, 35(1), pp.128‐152.
Commonwealth Department of Finance, Handbook of Cost‐Benefit Analysis, Canberra, January 2006.
Cowan R. and Foray D., “Quandaries in the Economic of Dual Technologies and Spillovers from Military to Civilian Research and Development”, Research Policy, 1995, 24(6), pp.851‐868.
Building Submarines in Australia – Aspects of Economic Impact ‐ May 2015 108 ______________________________________________________________________________________________
UNCLASSIFIED
108
Crespo N. and Fontoura M.P., "Determinant Factors of FDI Spillovers ‐ What Do We Really Know?", World Development, March 2007, 35(3), pp.410‐425.
de Loo I. and Verspagen B., "Technology Spillovers between Sectors and over Time", Technological Forecasting and Social Change, 1999, 60, pp.215–235.
Defence SA Advisory Board, Guarding our Edge ‐ Building and Sustaining the Future Submarine in Australia, Adelaide, 2012.
Dunne P.P. and Nikolaidou E., "Defence Spending and Economic Growth in the EU15", Defence and Peace Economics, 2012, 23(6), pp.537–548.
Economic Development Board South Australia, Economic Analysis of Australia’s Future Submarine Program, Adelaide, October 2014.
Egea A.N., “Military R&D: The Economic Implications of Disarmament and Conversion”, Defence and Peace Economics, 1994, 5(2), pp.131‐151.
Eliasson G., Advanced Public Procurement as Innovation Policy ‐ The Military Industry as a Technical University, Presentation at the Australian Defence Force Academy, Canberra, 10 July 2012.
Eliasson G., Advanced Public Procurement as Industrial Policy ‐ The Aircraft Industry as a Technical University, Springer, New York, 2010.
Eliasson G., Public Procurement as Innovation Policy ‐ The Case of the Swedish Multipurpose Combat Aircraft Gripen, Paper to be presented to the 15th International Joseph A. Schumpeter Conference, Jena, Germany, July 27‐30th, 2014.
Eliasson G., The Advanced Firm as a Technical University ‐ A Pilot Study in Human Capital Creation on the Collins Submarine Project in Australia 1986‐2004, Swedish Entrepreneurship Forum Conference, 2013.
Enger S.G., Dual‐Use Technology and Defence–Civilian Spillovers: Evidence from the Norwegian Defence Industry, Masters Degree Thesis, Centre for Technology, Innovation and Culture, University of Oslo, Spring 2013.
Ergas H., “On Economics and Submarines”, The Strategist, Australian Strategic Policy Institute, Canberra, 29 October 2014.
Findlay C. and Jones R., “The Marginal Cost of Australian Income Taxation”, Economic Record, 1982, 58, pp.253‐262.
Gerace M.P,. “US Military Expenditures and Economic Growth: Some Evidence from Spectral Methods”, Defence and Peace Economics, 2002, 13(1), pp.1–11.
Gold D., “Evaluating the Trade‐off between Military Spending and Investment in the United States”, Defence and Peace Economics, 1997, 8(3), pp.251‐266.
Hall B.H., Mairesse J., and Mohnen P., "Measuring the Returns to R&D", pp. 1033‐1082 in Hall and Rosenberg (eds), 2010, Handbook of Economics and Technical Change, Elsevier, 2010.
Harrison M., Valuing the Future: The Social Discount Rate in Cost‐Benefit Analysis, Visiting Researcher Paper, Productivity Commission, Canberra, April 2010.
Huang C. and Mintz A., ‘Defence Expenditures and Economic Growth: The Externality Effect’, Defence and Peace Economics, 1991, 3(1), pp.35‐40.
Industry Assistance Commission, Research and Development, Report No. 44, Canberra, 1995.
Industry Commission, Defence Procurement, Report No. 41, Canberra, 30 August 1994.
Building Submarines in Australia – Aspects of Economic Impact ‐ May 2015 109 ______________________________________________________________________________________________
UNCLASSIFIED
109
Infrastructure Australia, Reform and Investment Framework Templates for use by Proponents, Templates for Transport Infrastructure, December 2013, pp.7‐8.
Keating, G. et. al, The Economic Consequences of Investing in Shipbuilding ‐ Case Studies in the United States and Sweden, Rand Corporation, Santa Monica, 2015.
Kelly T. and Rishi M., “An Empirical Study of the Spin‐off Effects of Military Spending”, Defence and Peace Economics, 2003, 14(1), pp.1–17.
Kloftsen M., Jones‐Evans D. and Scharberg C., “Growing the Linkoping Technopole – A Longitudinal Study of Triple Helix Development in Sweden”, Journal of Technology Transfer, 24, 1999, pp. 125‐138.
Kollias C., Mylonidis N. and Paleologou S., ‘A Panel Data Analysis of the Nexus between Defence Spending and Growth in the European Union’, Defence and Peace Economics, 2007, 18(1), pp.75–85.
Lai C., Shieh J. and Chang W., "Endogenous Growth and Defense Expenditures: A New Explanation of the Benoit Hypothesis", Defence and Peace Economics, 2002, 13(3), pp.179–186.
Lin P. and Lee C., “Military Spending, Threats and Stochastic Growth”, Bulletin of Economic Research, 2012, 64(1), pp.8‐19.
Madden G.G. and Haslehurst P.I., “Causal Analysis of Australian Economic Growth and Military Expenditure: A Note”, Defence and Peace Economics, 1995, 6(2), pp.115‐121.
Malerba F. and Montobbio F., "Exploring Factors Affecting International Technological Specialization: The Role of Knowledge Flows and the Structure of Innovative Activity", Journal of Evolutionary Economics, 2003, 13, pp.411‐434.
Monash University, Koopman R. and Rimmer M., “The MONASH Style Computable General Equilibrium Modelling: A Framework for Practical Policy Analysis” in Dixon, P. and Jorgenson, D., Handbook of Computable General Equilibrium Modelling, Elsevier, Amsterdam, 2013.
Morales‐Ramos E., “Defence R&D Expenditure: The Crowding‐out Hypothesis”, Defence and Peace Economics, 2002, 13(5), pp.365–383.
Morretti E., Steinwender C. and Van Reenan, J., The Intellectual Spoils of War? Defense R&D, Productivity and Spillovers, University of California Berkeley, July 2014.
Mylonidis N., “Revisiting the Nexus Between Military Spending and Growth in the European Union”, Defence and Peace Economics, 2008, 19(4), pp.265‐272.
Nietoa M. and Quevedo P., "Absorptive Capacity, Technological Opportunity, Knowledge Spillovers and Innovative Effort", Technovation, 2005, 25, pp.1141–1157.
Oxford Economics, The Economic Case for Investing in the UK Defence Industry, Oxford, September 2009.
Poole E. and Bernard, J‐T., “Defence Innovation Stock and Total Factor Productivity”, The Canadian Journal of Economics, 1992, 25(2), pp. 438‐452.
Productivity Commission, Australia’s Automotive Manufacturing Industry, Inquiry Report No. 70, 31 March 2014 (released publicly in August 2014).
Productivity Commission, Australia’s Automotive Manufacturing Industry ‐ Supplement to Inquiry Report, Economy‐wide Modelling of Automotive Industry Change, Canberra, April 2014.
Productivity Commission, On Input‐Output Tables: Uses and Abuses, Staff Research Note, Canberra, September 2013.
Building Submarines in Australia – Aspects of Economic Impact ‐ May 2015 110 ______________________________________________________________________________________________
UNCLASSIFIED
110
RAND Corporation, Australia’s Submarine Design Capabilities and Capacities ‐ Challenges and Options for the Future Submarine, National Security Research Division, Santa Monica, 2011.
RAND Corporation, Australia’s Naval Shipbuilding Enterprise Preparing for the 21st Century, Santa Monica, April 2015.
Raytheon Australia, Sea 1000 ‐ A Hybrid Build Precis, Canberra, September 2014.
Ruttan V.W., Military Procurement and Technology Development, Staff Paper P05‐3, University of Minnesota, March 2005.
Saal D.A., “The Impact of Procurement‐Driven Technological Change on U.S. Manufacturing Productivity Growth”, Defence and Peace Economics, 2001, 12(6), pp.537‐568.
Scott J.P., “Does UK Defence Spending Crowd‐out UK Private Sector Investment?”, Defence and Peace Economics, 2001, 12(4), pp.325‐336.
Shanks S. and Zheng S., Econometric Modelling of R&D and Australia’s Productivity, Productivity Commission Staff Working Paper, Canberra, April 2006.
Sonmez Atesoglu H., “Defense Spending and Aggregate Output in the United States”, Defence and Peace Economics, 2009, 20(1), pp.21‐26.
Stewart C., “Shipyard Closures Start with Job Losses”, The Australian, 31 December 2014.
Tasman Asia Pacific, Impact of Major Defence Projects: A Case Study of the ANZAC Ship Project ‐ Final Report, Canberra, February 2000.
Tasman Economics, Impact of Major Defence Projects: A Case Study of the Minehunter Coastal Project ‐ Final Report, Canberra, January 2002.
Taylor T. and Louth J., The Destinations of the Defence Pound, Briefing Paper, Royal United Services Institute, London, 2012.
Thompson M., The Cost of Defence ‐ ASPI Defence Budget Brief , Australian Strategic Policy Institute, Canberra, May 2013.
Wieser R., “Research and Development Productivity and Spillovers ‐ Empirical Evidence at the Firm Level”, Journal of Economic Surveys, 2005, 19(4), pp.587‐621.
Yildirim J., Ocal N., and Keskin H., Military Expenditures, Economic Growth and Spatial Spillovers: A Global Perspective, Proceedings of International Conference on Applied Economics, Perugia, 2011. pp.811‐819.
Young L., Determining the Discount Rate for Government Projects, New Zealand Treasury Working Paper 02/21, Wellington, September 2002.
Zervos V. and Swann P., “The Impact of Defence Integrators and Standards on Vertical and Horizontal Innovation in the Defence Industry”, Defence and Peace Economics, 2009, 20(1), pp.27–42.
Zycher B.M., “Economic Effects of Reductions in Defense Outlays”, Policy Analysis No. 706, Cato Institute Washington D.C., 8 August 2012.