Building performance analysis system IES VE main features overview
26
IES VE Integrated Environmental Solution <Virtual Environment> Building energy simulation tool
-
Upload
statybos-akademija -
Category
Engineering
-
view
93 -
download
3
Transcript of Building performance analysis system IES VE main features overview

IES VE
Integrated Environmental
Solution <Virtual Environment>
Building energy simulation tool

gbXML
How will we get geometry into IES?
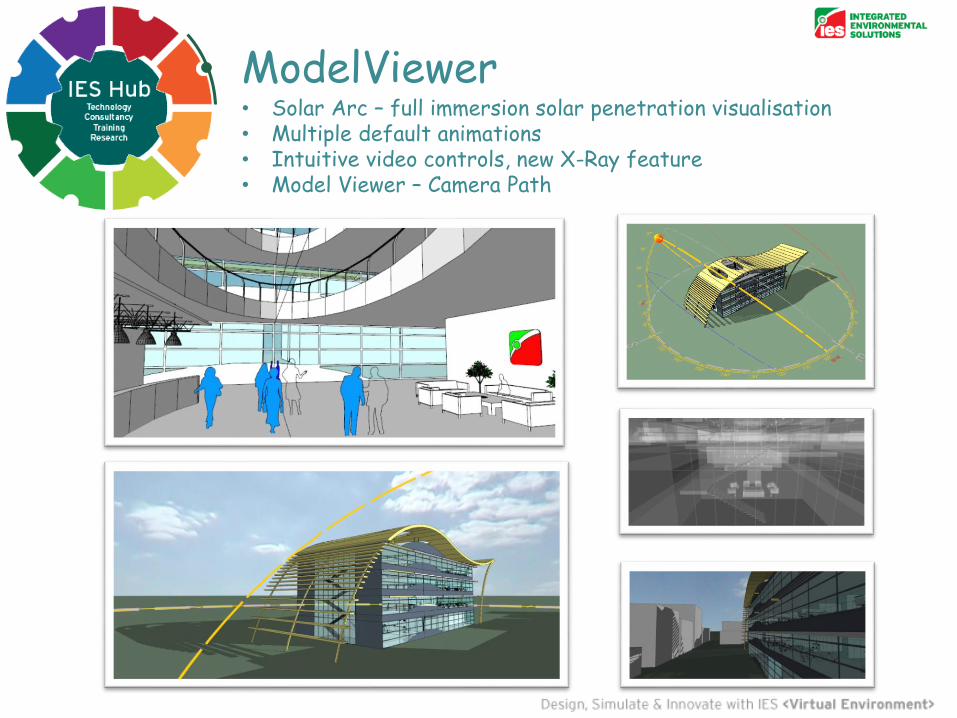
ModelViewer• Solar Arc – full immersion solar penetration visualisation• Multiple default animations • Intuitive video controls, new X-Ray feature• Model Viewer – Camera Path

ApacheSim• Tabular room edit - import and export Room Data from excel• Formulae profiles - ramp, step, multi variable control using
simulation results time steps down to 1 minute• Integrated HVAC / Natural Ventilation model - no post
processing• Near Future: Optimisation

• Heating & Cooling Load Calculations
• HVAC Plant and Control Systems
• Dynamic Thermal Simulations
• Wall/Window Make-ups &
Condensation Analysis
• Energy Analysis
• CO2 Emissions Calculations
• Natural Ventilation & Mixed Mode Systems
Thermal Analysis

Jan Feb Mar Apr May Jun Jul Aug Sep Oct Nov Dec Jan
180
160
140
120
100
80
60
40
20
0
Po
we
r (M
BH
)
Date: Wed 01/Jan to Wed 31/Dec
Boilers energy: (csi - load calculations - oa off.aps) Chillers energy: (csi - load calculations - oa off.aps)
Annual Energy Consumption
Load Summary
• What is driving the building
energy consumption over the
course of the full year?
• Are external factors (building
envelope) or internal factors
(lights, equipment, people)
responsible for the building
loads?
Detailed Energy & Load Calculations
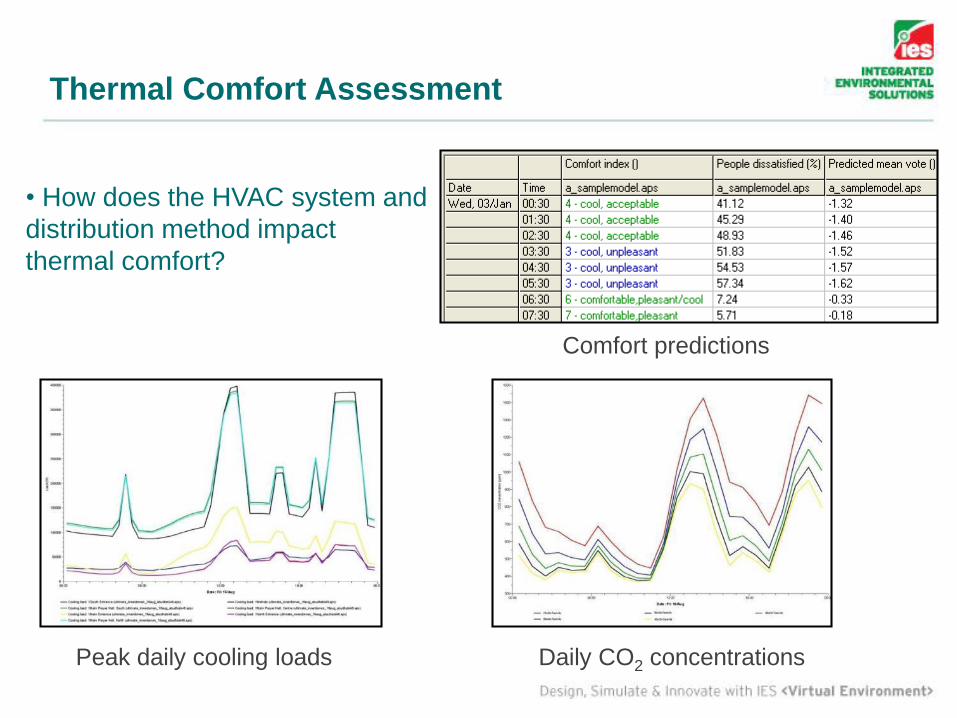
Peak daily cooling loads Daily CO2 concentrations
Comfort predictions
• How does the HVAC system and
distribution method impact
thermal comfort?
Thermal Comfort Assessment

SunCast• Full solar penetration analysis• New Feature: Solar intensity visualisation• Pre-processing simulation for Dynamic Thermal Modelling

AEC Software: MacroFlo• Calculation of infiltration based on internal /external pressure
regime + Visualisation in VistaPro• Natural ventilation assessment through windows / doors• Coupled to ApacheHVAC enables true mixed mode assessment• Utilises Performance Components: Monodraught wind-catchers

Natural Ventilation

• Predict Complex Air Flow Inside and Around Buildings
• Visual Results
• Comfort Analysis
• Ventilation Airflow Analysis
• Wind Pattern Studies
Computational Fluid Dynamics (CFD)

PMV DEFINITION
-3 COLD
-2 COOL
-1SLIGHTLY
COLD
0 NEUTRAL
+1SLIGHTLY WARM
+2 WARM
+3 HOT
Predicted Mean Vote:
An index that predicts the mean value of the votes of a group of occupants on a 7-point thermal sensation scale.
Note:
The horizontal slice shown is at a seated head-height of 4’-3.6”.
The occupied area of the laboratory is in the range of (-0.1 to -0.5).
The area in front of the fume cupboard is approximately -0.7 but this is assuming the sash is fully open and designed with a face velocity of
1.6 ft/sec.
Comfort levels: Predicted Mean Vote (PMV)

Note:
The horizontal slice shown is at a seated head-height of 5’-0”.
The occupied area of the laboratory is in the range of (11% to 7%).
The area in front of the fume cupboard is approximately 20% but this is assuming the sash is fully open and designed with a face velocity of
1.6 ft/sec.
The only other areas of high PPD are in stagnant areas of the room e.g. Corner areas.
Percentage People Dissatisfied:
An index that predicts the percentage of occupants expressing dissatisfaction with the room thermal environment.
ASHRAE 55-2004 specifies the combination of indoor space environment and personal factors that will produce thermal environment
conditions acceptable to 80% or more of the occupants within a space.
Comfort levels: Percentage People Dissatisfied (PPD)

Dry Resultant Temperature:
This is the mean temperature of the room air temperature and the mean radiant temperatures.
The upper left image shows a vertical
slice 2.8” from theexternal wall and
glazing system.
Crack flow
infiltration of cold
air shows a down-
draught falling to
the floor level.
The lower left image shows a
vertical slice 14” from the external
wall and glazing
system. Linear
slot diffusers are
supplying 80°F air
to act as a warm-
air curtain.The horizontal slice shown is at an ankle-height of 0’-3”.
The occupied area of the laboratory at this height is in the range of 64-65°F
Note:
The strategy of employing a linear slot diffuser to combat the cold air draughts of cold window surface temperature and crack flow infiltration is
not preventing cooler air temperatures at occupant’s ankles and may cause discomfort.
The crack flow of the external glazing was assumed to be a “semi-exposed wall” and was set at 12.69 cfm/ft.(in Hg) ^0.6.
Dry Resultant Temperature (DRT)

Warm convective currents from occupants rising to high level.
Fume Hood sash face velocity not to
exceed -/second.
1. A combination of cold window surface temperature and cold air infiltration cause convective currents to drop to low level.
2. The cold air accumulates and spills inwards towards the occupants.
3. The strategy of employing a linear slot diffuser to combat the cold downward draught is may cause discomfort to the occupants.
Linear slot diffusers supply velocity not to exceed -/second.
Air Velocity (m/second)

AEC Software: SimulexNEW visualisation approach

Case study: First A+ manufacture building in Lithuania

Facts about building:
Overall building area – 4674
m2
Overall volume -42000 m3
Predicted energy
consumption – 26,48 kWh/m2
of heat
By applying heat pump it
should be 5,44 kWh/m2
Targets:
• A+ energy efficiency class
• BREEAM „very good“
• Reasonable price

Geometry optimization by means ofnatural light and energy consumptiom
Initial
design:
Daylight / Energy / Cost optimized :
• Initial design had poor daylight
utilization and high artificial
lightning costs
• Reduced loads due to small
glazed area rates
• Increased glazing rates alowed to
get more daylight and reduce
artificial light consumption
• Glazing creates more solar gains,
but increases capacity
requirements
• Optimal point between glazing
and lighting consumption
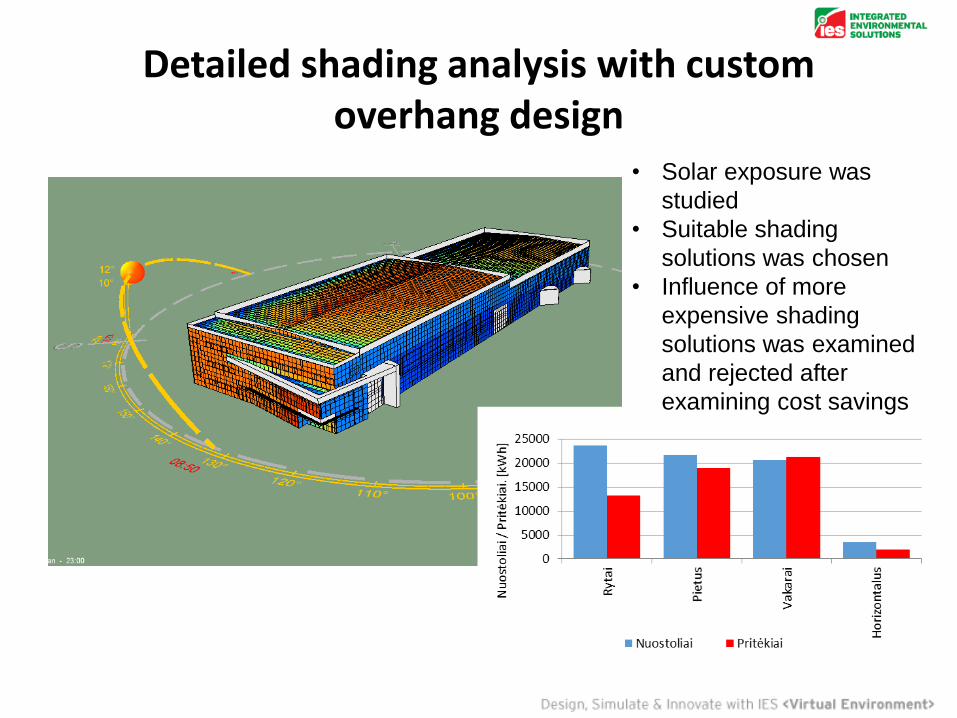
Detailed shading analysis with customoverhang design
• Solar exposure was
studied
• Suitable shading
solutions was chosen
• Influence of more
expensive shading
solutions was examined
and rejected after
examining cost savings

Envelope properties optimization bymeans of energy consumption and
investment costs
• More detailed selection of envelope properties by assessing influence to
energy consumption and initial envelope costs
• Different properties for different building spaces

Influence of air permeabilityof building envelope
• Local regulations requires – 1,0 h-1 value
at 50Pa difference
Target – go below 0,6 h-1
• Preliminar studies have shown that
infiltration air change has about 34%
influence to overall heat load
• This fact helped drawn more
attention to air tightness planning
and quality checks during
construction works

Control strategies assesment for moreaccurate heat/cooling sizing aiming at optimal cost
Ventilation strategies was
assessed:
• Flow rate reduction at low
ambient temperatures
• Flow rate adjustment according
to CO2 levels
• Time scheduled pre-cooling of
office spaces
• Summer ventilation by-pass
Influence determination for:
• Set points for heating set back
strategy
• Examination of suitable dead-bands
• Multisource (panel cooling and
fancoil) cooling strategies
examination

More accurate prediction than energy certification
Purpose of energy certification procedure are to give
label to the buildings at equal boundary condition
Dynamic simulation are free for
applying custom boundaries
more suitable for each case –
user and technology heat gains,
hot water usage and shedules,
microclimate systems control
strategies and passive demand
reduction strategies
26
19,6
0
5
10
15
20
25
30
Simulated value Energy certification

Future use of simulation model
After completing construction
works model could be used for
simulation based energy audith
and fault detection after
calibrating actual model
It is possible due to installed
sub-metering devices and data
collection systems.

IES VE
Integrated Environmental
Solution <Virtual Environment>
Building energy simulation tool