Building our brands - annualreports.co.uk · 2016, including special interim dividend of 10.0 pence...
200
Annual Report & Accounts 2016 Building our brands
Transcript of Building our brands - annualreports.co.uk · 2016, including special interim dividend of 10.0 pence...

Annual Report & Accounts 2016
Building our brands
Direct Line Insurance G
roup plc Annual Report &
Accounts 2016

Strategic report2 Group highlights4 Group at a glance6 Market overview8 Business model10 Chairman’s statement12 Chief Executive Officer’s review14 Our strategy24 Our key performance indicators26 Risk management30 Corporate social responsibility34 Operating review38 Finance review
Governance48 Chairman’s introduction50 Board of Directors52 Executive Committee53 Corporate governance report64 Committee reports82 Directors’ remuneration report110 Directors’ report
Financial statements114 Contents115 Independent Auditor’s report122 Consolidated
financial statements127 Notes to the consolidated
financial statements179 Parent Company
financial statements182 Notes to the Parent Company
financial statements
Other information187 Additional information189 Glossary and appendices195 Forward-looking
statements disclaimer196 Contact information
Contents
For all the latest news and announcements visit www.directlinegroup.com

Our mission: To make insurance much easier and better value for our customers
Our strategy supports our aspiration to be the leading personal and small business general insurer in the UK. Our customers are
at the centre of everything we do, as we remain focused on protecting an ever-changing Britain.
Building our brands
Building a culture of great service
Find out more on page 18
Building our technology and data capabilitiesFind out more on page 20
Building our brands by offering moreFind out more on page 22
www.directlinegroup.com 1

Group highlights
Providing stability for our customers and shareholders
Target
At least 15%
16y15y14y
14.2%
Return on tangible equity2
(%)
18.5
16.8
14.2
Total costs2
Ongoing operations (£m)
3,22
2.1
16y15y14y
927.
7
884.
7
923.
7
£923.7m
Dividend per share3
(pence)
24.6p16y15y14y
14.0
27.5
8.8
13.8
13.2
10.0
14.6
97.7%
Combined operating ratio2
Ongoing operations2 (%)
3,22
2.1
16y15y14y
95.0
94.0 97.7
£403.5m
Operating profit2Ongoing operations (£m)
16y15y14y
506.
0
520.
7
403.
5
Adjusted diluted earnings per share2 (pence)
21.2p16y15y14y
25.5 26.6
21.2
£3,274.1m
Gross written premium1
(£m)
16y15y14y
3,09
9.4
3,15
2.4
3,27
4.1
£353.0m
Profit before tax1
(£m)
16y15y14y
456.
8 507.
5
353.
0
Basic earnings per share1
(pence)
16y15y14y
20.4p
24.0
27.9
20.4
Notes:1. Results for the years ended 31 December 2015 and 31 December 2014 are based on continuing operations and exclude discontinued operations2. See glossary on pages 189 and 190 and Alternative performance measures (“APM”) in Appendix A on page 191 and Appendix B – Proforma results on page
194 presents the Group’s results excluding the recent impact of the Ogden discount rate reduction3. The Board is proposing a final dividend of 9.7 pence per share, making a total regular dividend for 2016 of 14.6 pence per share
Direct Line Group Annual Report & Accounts 20162
Financial highlights• Gross written premium for Ongoing operations1,2 up 3.9%
to £3,274.1m (2015: £3,152.4m), driven by growth in Motor and Home own-brand in-force policies (up 4.3%)
• 2016 results reflect the one-off impact of using the new Ogden discount rate of minus 0.75%. Operating profit from Ongoing operations of £403.5m (pre-Ogden discount rate reduction3: £578.6m; 2015: £520.7m) and profit before tax of £353.0m (pre-Ogden3: £570.3m; 2015: £507.5m). Return on tangible equity1,2 of 14.2%, (pre-Ogden3: 20.2%; 2015: 18.5%)
• Combined operating ratio1 from Ongoing operations of 97.7% (pre-Ogden3: 91.8%; 2015: 94.0%), increased as a result of the reduction in the Ogden discount rate, partially offset by improved current-year underwriting performance and favourable weather claims. Adjusted for normal weather and before the Ogden discount rate change, the combined operating ratio was 93.5%, towards the lower end of the target range of 93% to 95%
• 5.4% increase in final dividend per share to 9.7 pence per share, (2015: 9.2 pence). Total dividends per share for 2016, including special interim dividend of 10.0 pence per share paid in September 2016 following the approval of the Group’s partial internal model (“PIM”), of 24.6 pence per share (2015: 50.1 pence)
• The Group’s estimated Solvency II capital coverage ratio4 post dividend is 165%, above the middle of the Group’s risk appetite range of 140% – 180% (pre-dividend: 174%)
Strategic and operational highlights• Direct Line Motor and Home new business growth at the
highest annual level since IPO, demonstrating the success of the investment in brand, proposition and customer service
• Total costs for Ongoing operations of £923.7m broadly flat year on year before non-cash impairment charge of £39.3m, after absorbing £24.1m Flood Re levy and supporting growth in Motor and Home own brands
• Extended Home and Private Insurance partnership with RBS for a further three years, and implemented faster and easier sales journeys using cloud-based technology making connectivity and future change easier
• Invested in innovation, including partnership with PSA Peugeot Citroën for telematics extended for 4 more years, introducer role developed with Tesla, and MOVE_UK project brought into data collection stage
• Received approval from the Prudential Regulation Authority (“PRA”) to use the Group’s Solvency II PIM
We had a successful 2016, absorbing a reduction in the discount rate applicable to personal injury lump sum damages awards to minus 0.75% and the Flood Re levy, while at the same time investing in the business and making progress on implementing our strategy. Our investments in our direct brands, competitiveness on price comparison websites and partnership capabilities are bearing fruit.
Notes:1. See glossary on pages 189 and 1902. See appendix A – Alternative performance measures on page 191
for reconciliation to financial statement line items3. See appendix B – Proforma results on page 194 for the Group’s results
excluding the recent impact of the Ogden discount rate reduction 4. Estimates based on the Group’s Solvency II PIM for 31 December 2016
www.directlinegroup.com 3
Strategic reportG
overnanceFinancial statem
ents

Our brands
Group at a glance
Protecting our customers
We have multiple brands, products and distribution channels. Each enables our customers to choose the right cover to protect their cars, homes, holidays, businesses and pets.
Direct Line has maintained its brand heritage by selling products direct to customers exclusively by phone and internet. We target customers with a high affinity to the brand, and focus on providing a fast and straightforward service.
www.directline.com
NIG is our specialist commercial insurance brand. We sell our products through brokers, including an in-house intermediary that arranges RBS1 and NatWest commercial insurance.
www.nig.com
Green Flag is our roadside rescue and recovery provider. We sell it as a standalone service and an additional optional product alongside motor insurance.
www.greenflag.com
Brand Partners is the Group’s partnerships arm. We specialise in providing personal lines insurance, and roadside rescue and recovery products to some well-known brands.
Direct Line for Business is an extension of our Direct Line brand. It is our direct commercial insurance brand for small businesses that have straightforward commercial insurance requirements.
www.directlineforbusiness.co.uk
Churchill is a household name. We market our products by phone and internet, including PCWs. We target customers who have a high affinity to the brand, and who need an extra helping hand.
www.churchill.com
Privilege targets customers who mainly buy through PCWs. We focus on making sure they experience a quick service at the best price. www.privilege.com
Note:1. The Royal Bank of Scotland Group plc, including National Westminster Bank plc
Direct Line Group Annual Report & Accounts 20164

MotorWe are Britain’s leading personal motor insurer measured by in-force policies1, mainly represented through our highly recognised brands Direct Line, Churchill and Privilege, and also through our partners. We insure around one in six insured cars on the road in the UK, representing 3.9 million in-force policies.
HomeWe are Britain’s leading personal home insurer measured by in-force policies1. We reach our customers by selling home insurance products through our brands, Direct Line, Churchill and Privilege, and our partners – RBS, NatWest and Prudential.
We protect commercial businesses through our brands, NIG, Direct Line for Business and Churchill, and through our partners RBS and NatWest. NIG sells its products exclusively through brokers operating across the UK. Direct Line for Business provides business, van and landlord insurance products direct to customers. Churchill sells business, landlord and van products direct to customers and through price comparison websites (“PCWs”).
Personal lines
Commercial
£1,539.1mGross written premium
3.9mIn-force policies
106.3%Combined operating ratio
£149.1mOperating profit
£834.4mGross written premium
3.4mIn-force policies
85.0%Combined operating ratio
£166.7mOperating profit
£400.8mGross written premium
7.9mIn-force policies
93.3%Combined operating ratio
£45.9mOperating profit
Rescue and other personal linesWe are one of the leading providers of rescue and other personal lines insurance in the UK2,3 with 7.9 million in-force policies. This includes providing roadside assistance and recovery for customers through Green Flag, the UK’s third-largest roadside recovery provider2. We also offer customers protection for their pets and holidays and are the second largest travel and the third largest pet insurer respectively3.
£499.8mGross written premium
98.7%Combined operating ratio
675kIn-force policies
£41.8mOperating profit
Notes:1. Includes Direct Line, Churchill, Privilege and partner brands: RBS, Nationwide (home only), NatWest, Prudential and Sainsbury’s © GfK Financial Research Survey
six months ending November 2016, 13,665 adults interviewed for motor insurance and 12,270 for home insurance2. Mintel Vehicle Recovery – UK, September 20163. Mintel Pet Insurance – UK, August 2016 and Mintel Travel Insurance – UK, February 2016
www.directlinegroup.com 5
Strategic reportG
overnanceFinancial statem
ents

Claims and premium inflation
Rising costs for insurers and customersCustomers’ motor premiums have been rising over the past two years. Increasing claims costs have continued to push premiums higher, with increases in Insurance Premium Tax (“IPT”) also contributing. Despite sustained declines in the number of claims in recent years, average motor claim payouts rose again in 2016, with an increase of over 2.5% as personal injury claims have escalated2,3.
Digitalisation & technology
Innovative companies offer partnership possibilitiesNew technology has the power to create feature-rich insurance apps and systems that can analyse vast amounts of data. These developments support the possibility of more tailored insurance products, as underwriting techniques evolve. Such innovations are being partly driven by InsureTech and FinTech companies, who are creating opportunities for partnerships with established insurers. However, given the amount of private and confidential information being generated, cyber security remains an increasing focus for the insurance industry.
£9.5bn
Our changing environment
invested globally in FinTech companies during 20151
Market overview
We operate in a dynamic environment, and the way we interact with customers is evolving. Changes inside and outside the industry, including technology and regulation, are shaping customers’ expectations. It is vital that we continue to serve customers and manage claims to the highest standards.
Notes:1. KPMG – The Pulse of Fintech [Converted to GBP at 2015 12 month average – £1 = $1.52860]2. Association of British Insurers (“ABI”) – Key facts 20153. ABI – Key Facts 2016
Direct Line Group Annual Report & Accounts 20166

Sharing economy and car automation
Changing habits offer opportunities and challengesThe new sharing economy is changing the way we live. Insurance products must change to reflect this. For example, we will need more innovative products than traditional buildings and contents insurance, as communal living and short-term rentals grow in popularity. Change will also affect motor insurance, where increasingly autonomous cars may lead to significant reductions in severe crashes and injuries and change the profile of claims. In the long term, the industry will need to consider how best to provide cover as risk shifts from the driver to the vehicle.
Regulation and legislation
The pace of change remains rapidInsurance regulation has continued to evolve over the past year with a reduction in the personal injury discount rate, Flood Re, the Enterprise Bill, Solvency II, an Insurance Premium Tax increase and new FCA renewal legislation being implemented. The UK’s vote to leave the European Union adds significant regulatory uncertainty. The Bank of England’s decision to cut the base rate to 0.25% has reduced insurers’ investment returns with impacts on industry profitability.
Brand strength
Brand investment pays off for insurersInsurance brands that are well known and valued by customers2 are consistently amongst the most successful in the industry3. Brand strength and visibility is an important factor in consumers’ insurance acquisition process. Therefore, to generate new business, insurers must invest in their brands to stay at the front of the public’s minds. Providing quality customer service and offering something above and beyond the average insurer reaps its benefits, with the market cost of acquiring new customers up to five times the cost of retention4.
84% of consumers would use one insurer for all of their insurance needs if quality customer service and low prices were available5
1.8 million
The average bodily injury claim cost following an accident is6
connected cars in the UK in 20161
£10,955 £5.8bn one-off impact to the industry due to the personal injury discount rate reduction7
Notes:1. Statista – Number of connected cars in the United Kingdom (UK)
from 2014 to 20202. Hall & Partners3. Deloitte Household and Motor Insurance Seminars 2016
4. Digital Market Magazine – How can the insurance industry retain existing customers?
5. Consumer Intelligence – Digital Insurance World 20166. ABI – Key facts 20167. Willis Towers Watson
www.directlinegroup.com 7
Strategic reportG
overnanceFinancial statem
ents

Business model
Creating value for our customers
Read more about our brands on page 4
Read more about our key performance indicators on page 24
Read more about our risk management on page 26
Our multi-brand, multi-product and multi-distribution channel business offers different propositions to distinct customers. We believe this approach should enable us to generate value for customers and sustainable returns for our shareholders.
ProfitReinvest in the business
Dividends
Servicing
Managing risk
Our shareholders
CostsOur people
Our customers
Managing finances
Capital
Net claims
Investment and other income
Premiums
Direct Line Group Annual Report & Accounts 20168

Customers are at the centre of our business model. So our mission is clear: we want to make insurance much easier and better value for them. We aspire to give them products that best suit their needs and exceptional service throughout their relationship with us. We also strive to adapt to their changing needs. From the moment customers choose our products, to the time they claim or need to resolve an event we treat every step of the customer journey as an opportunity to provide excellent service and outcomes.
We seek to make sure our business is well governed and controlled. We manage our finances carefully and balance this with targeting a suitable and sustainable return for our shareholders.
We hold assets that exceed our expected liabilities as capital to allow us to absorb any unexpected losses that might occur. We maintain a buffer that significantly exceeds our regulatory capital requirements.
We prefer to adopt a conservative approach to claims reserving in order to hold sufficient funds to pay customer claims. This may result in subsequent releases from these reserves, which contribute to our annual profit.
We aim to make it easy for our customers to access our products, and to give them what they are looking for. We want to make sure they have appropriate cover to protect against the unexpected.
Customers can buy products online – including through PCWs – by phone, and indirectly through our partners. In our Commercial business, they can also buy our products through brokers.
Each brand provides products for one or more insurance segments: motor, home, rescue, pet, travel and commercial. By tailoring the mix of distribution channels for each product, we seek to offer customers a blend of brands, products and services that best suit their needs.
Everyone, from our front-line staff to employees in support and central functions, helps ensure we meet customers’ needs. Without our people, we could not generate value for customers and sustainable returns for our shareholders.
Our shareholders are a big part of our business model. They invest in the business wanting to achieve a good level of return. So we aim to give our shareholders value by generating sustainable business profits. We reinvest part of this profit in the business, or add to capital and, where appropriate, distribute the rest to shareholders as dividends.
We ensure our products meet regulatory standards and that customers understand what they are buying from us. We also aim to price our policies accurately and invest our assets appropriately to minimise potential losses.
We transfer insurance risk through reinsurance in our normal business activities. External experts review our insurance claims reserves regularly. We mitigate risks by implementing our Group policies and minimum standards. These are reviewed regularly to ensure we are in line with the risk appetite that the Board sets.
Our business has been in operation for over 30 years, giving us a deep insight into the risks we underwrite. This insight enables us to make our pricing more reflective of the risks we underwrite. It also allows us to invest substantially in data and increase efficiencies. Again, this means we are better able to set accurate prices for the risks we underwrite.
Customers experience the value of their cover when they come to claim. So we aim to settle claims as quickly and easily as possible by engaging closely with our customers. This helps us demonstrate why our products and services are valuable, and to manage our claims costs.
Making insurance much easier and better value for our customers
Our focused processes
Our disciplined approach
www.directlinegroup.com 9
Strategic reportG
overnanceFinancial statem
ents

Chairman’s statement
Focused on creating long-term value
Mike BiggsChairman
Returns to our shareholders remain a key focus in this
challenging market environment. Cumulative
dividends represent approximately 72% of
the share price at the initial public offering.
Dear shareholders,
In 2016, the Group delivered profit before tax of £353.0 million (2015: £507.5 million). Before the reduction in the Ogden discount rate to minus 0.75%, profit before tax was £570.3 million. We achieved this resilient result through our continued focus on the value, service and brand propositions offered to our customers, on operating efficiency and on underwriting discipline in competitive markets.
StrategyThe Group’s mission is to make insurance much easier and better value for our customers. The Board’s role is to support and challenge the Group’s management to develop and execute a strategy which is aligned with this mission, and positions the business to take advantage of changes in technology affecting vehicles, homes and how our customers communicate with us, as well as delivering operating efficiencies and targeting sustainable income streams. The effective execution of our strategy requires a substantial and continuing change agenda to improve our core systems, digital offering and the agility of the organisation.
DividendsWe aim to increase the dividend annually in real terms, under our progressive dividend policy (see page 110). This aim reflects the potential of the Company’s cash-flow generation and long-term earnings. We are recommending a final regular dividend of 9.7 pence per share. If approved, the total regular
dividend of 14.6 pence per share will represent 5.8% growth on 2015’s regular dividend (13.8 pence per share), which is consistent with this policy.
In addition, we paid a special interim dividend of 10.0 pence per share in September 2016. The Board’s ability to return a dividend to shareholders is against the backdrop of a challenging economic environment following the UK’s EU membership referendum and the recent reduction in the Ogden discount rate. Whilst the day-to-day operations remain unaffected, the Group continues to monitor the consequences of the devaluation of Sterling, inflation, uncertain financial markets and the Ogden discount rate reduction.
Linking remuneration to performanceWe remain committed to ensuring that executive pay is aligned with the Company’s strategy of delivering long-term shareholder value.
The Group achieved a return on tangible equity (“RoTE”) of 14.2% for 2016. However, a decrease of 9.4% (2015: an increase of 39.9%) in the share price over the year to 369.4 pence (2015: 407.5 pence) at 31 December 2016, together with dividend payments, provided a total shareholder return (“TSR”) of minus 1% for the year (2015: 46.9%), which is reflected in the long-term incentive plan (“LTIP”) outcome for 2016. This follows three consecutive years of outperformance versus the benchmark (FTSE 350 excluding
Direct Line Group Annual Report & Accounts 201610

LeadershipYour Board seeks to ensure that decisions are of the highest standard. It challenges strategic proposals, performance delivery and management responsibilities. See page 53.
EffectivenessThe effectiveness of your Board’s and its Committees’ performance is considered annually in an effectiveness review. See page 59.
AccountabilityYour Board provides shareholders with an assessment of the Group’s position and prospects. We monitor and review the effectiveness of the Group’s risk management and internal control systems. See pages 26 and 61.
RemunerationYour Remuneration Committee ensures a close correlation between creating value for shareholders, and remunerating Executive Directors and senior executives appropriately. See pages 63 and 82.
Relationships with shareholdersYour Board maintains strong relationships and regular interaction with our shareholders. Their continued support for our strategic aims is important. See page 63.
investment trusts) meaning that shareholders, since the initial public offering in 2012 (“IPO”), have received a TSR of 188% compared to the FTSE350 (excluding investment trusts) of 48%. Since the IPO, the Group has delivered good results each year, enabling the Board to declare cumulative dividends, including special interim dividends, equivalent to approximately 72% of the IPO share price.
The Remuneration Committee has consulted our major shareholders and other stakeholders, on our proposed Directors‘ remuneration policy on which shareholders will be given the opportunity to vote at the forthcoming AGM. More information on awards and our proposed Directors’ remuneration policy is provided in the letter from the Chair of the Remuneration Committee on page 82.
Solvency IIIn June 2016, the Group received approval from the PRA for the use of a Group PIM to calculate its solvency capital requirements (“SCR”). At 31 December 2016, the Group held a capital surplus of approximately £0.92 billion above its SCR. This was equivalent to a Solvency II capital coverage ratio of 165%, post-dividend and taking into account the impact of the new Ogden discount rate. The Board considers the appropriate Group risk appetite range to be 140% to 180% of its SCR, which should enable the Group to meet its operational, regulatory and rating agency requirements.
IT InfrastructureThe Group has been making positive changes to its IT infrastructure, including working towards the implementation and integration of major IT systems which is inherently complex and challenging. The Board’s ongoing areas of focus include developing future capability, and continuing to monitor risks associated with IT systems’ stability, cyber security, and the internal control environment.
Regulation, conduct and cultureWe maintain active relationships with our regulators through constructive two way dialogue. Your Board promotes the Group’s culture and oversees the Group’s conduct policy, which aims to ensure that we achieve good customer outcomes and that our employees behave with integrity. We also have a Code of Business Conduct which sets out standards that our employees are required to observe. We recognise that opportunities always exist to improve the services offered to our customers; and your Board has encouraged a range of customer experience initiatives which are designed to deliver increased levels of customer satisfaction.
Board and Committee membership changesSuccession planning remains a key area of focus for the Board. In January 2016, Dr Richard Ward was appointed as our Senior Independent Director. Following Priscilla Vacassin’s retirement from the Board in March 2016, a number of changes were made to the chairmanship and membership of the Board’s Committees.
On 1 February 2017, I was delighted to welcome Danuta Gray as a Non-Executive Director and Mike Holliday-Williams as an Executive Director to the Board. Danuta brings executive and non-executive experience from her previous roles in a number of sectors, including financial services. Mike’s appointment reflects the importance of the Personal Lines business to the Group. Your Board will benefit from closer interaction with the Personal Lines business and from the expertise that Mike will bring to the Board. My introduction to the Corporate Governance report and the Nomination Committee report provide further information on these changes.
I would like to thank the entire Board for their significant contribution, commitment and service; and look forward to working with them in 2017 as the Group continues to build on its strategic priorities.
EmployeesI would also like to thank our employees for their hard work, initiative and commitment to our mission. Their positive energy and dedication in supporting our customers helped our business progress in 2016, and has put us in a strong position for the future.
Michael N BiggsChairman
www.directlinegroup.com 11
Governance highlights
Strategic reportG
overnanceFinancial statem
ents

Chief Executive Officer’s review
Building on our success
Paul GeddesChief Executive Officer
The fact that our own brands have grown shows that customers like the many changes we have made
in recent years. In particular, the success of Direct Line
has encouraged us to keep innovating for our customers.
What is your view on the Group’s financial performance?It was a strong year, maintaining our record of strong financial performance and underwriting discipline since our IPO, but also with an added ingredient: growth. This is particularly gratifying because it shows that customers really like the new propositions, the great value and the excellent service that our brands are delivering, especially Direct Line.
The Group has hit nearly all its targets since its IPO four years ago. To what do you attribute this success?We found the whole IPO process actually helped us get really clear on our strategy and plans, and motivated the whole team to deliver against them. In particular, the fact that we have now given all of our colleagues three grants of free shares helps everyone to care about the Company enough to change it. We listen to colleagues’ ideas, for example, through the employee representative bodies and through our IdeasLab scheme, and continue to invest in their training and development. All this has helped us to do hard things like reducing our costs yet at the same time increase the engagement of our colleagues and improve our service to customers.
What do you believe will be the risks, opportunities and challenges in 2017?As 2016 has shown, no one can predict the future. Everything from the unpredictability of the weather, combatting new types of fraud such as cyber attacks, the uncertainties of Brexit and the change to the Ogden discount rate means we all have to remain vigilant.
However, as 2016 revealed, we can do well in uncertain times. We hold our head, know what we’re trying to achieve, and have experienced teams that are well prepared to tackle whatever the world throws at us. We also have to keep pace with what customers expect from technology. We expect profound revolution with connected cars and homes; the risks we cover; new sources of data; and new propositions for customers. That’s exciting.
In terms of regulation, we’ve actively lobbied Government to make whiplash claims more efficient for customers and ourselves. If we reduce costs, we can be in a position to pass on savings to customers, so we hope the Government consultation will produce effective reform for the industry.
How do you feel the Group is progressing towards its goal to make insurance much easier and better value for our customers?The fact our brands are growing is evidence that we’re doing the right thing. In a market that people believed was commoditised and only about cheap prices, growing the Direct Line brand is the ultimate accolade. It shows customers still value great products and service too.
Our TV advertising helps show where we believe our propositions differentiate us from our competitors. Our people have also received training on how to better understand and empathise with customers to help meet their needs appropriately.
Alongside this, we have improved both the sales and claims processes for our customers. Improving the digital journey through mobile devices, allowing customers to use their smartphones on more aspects of their claims and enabling customers to amend their policies with no additional fees are just a few ways we’re making Direct Line much easier and better value for our customers.
Direct Line Group Annual Report & Accounts 201612

This year saw many success stories. What were the highlights for you? Apart from the great success of Direct Line, we made good progress on our other brands too. Churchill equals Direct Line for customer recognition, and it has been great to see how the brand is so central to the British sense of identity. Launching a “Bring Back Lollipoppers” campaign for schools also linked the brand to improving road safety in a tangible way.
We have big ambitions for our Green Flag business, and we think technology will continue changing what it means to be good at rescue. So, we have introduced an exciting service called “Green Flag Alert Me”, which tells drivers what’s going on in their cars via an app. And alongside this, the Green Flag app enables people to easily let us know they have broken down, where they are, and track the Green Flag unit coming to help them.
Direct Line for Business has also seen strong growth, with policy numbers rising by 6.4% over the year. We have ambitions of ensuring the Company can do more for businesses in the future.
What is the Group’s opinion on driverless cars?We have an open-minded, optimistic attitude to new car technology. However, there are two dangerous attitudes that I sometimes hear in our industry. The first is that new technology will remove the need for insurance because cars won’t have accidents at all, or that drivers will not be held responsible for any accidents. I think that, for now, this remains in the realms of science fiction. It’s not the way legislation is shaped, it’s not the current reality, and it won’t be for many years ahead.
However, a second and more dangerous view I hear is that nothing will change. We believe technology will make cars much safer and improve driver experiences. Usage, ownership, prices, and how people choose to buy cars and insurance will evolve. So, while I feel the market will remain large, what it means to be an insurer can be expected to change profoundly.
I believe we are thought leaders regarding what car technology will mean. We talk to many groups, including car manufacturers and technology companies. There are also many strands to our work, such as developing the legal framework for autonomous driving, through to becoming the market leader for insuring safer cars. We are already giving customers discounts, for example, if their cars have features such as autonomous emergency braking.
Reducing accidents can only be a good thing. I lost my best friend in an accident so I’m absolutely behind it. Technology might change how our business is configured. The market may get smaller, so we’ll need to win more of it. If we have the right attitude; consider all the opportunities; and remain experts at using data, helping our customers, and finding new partners, I believe we can grow our market share.
What are your thoughts about 2016’s employee engagement survey “Dialogue”?I’m delighted that our efforts on engaging and motivating our colleagues continue to pay off. There is a risk that engagement can suffer in organisations like ours that are undergoing rapid change, seeking to improve their efficiency and lower costs.
We have seen quite the opposite, and the fact that 88% of our people complete the Dialogue survey means it represents all the various views across our business.
The Dialogue approach enables over 900 teams to discuss how they feel about the business, what’s working well and tackle what’s not quite right. ‘Say it like it is’ is a core value of ours; whether it’s through dialogue or through talking to our employee representative body and other representative groups.
This year’s survey showed that we now also have a record number of colleagues we can identify as “champions” – people who are both fully engaged and committed to the Group. They want to contribute to our success, something which I’m able to see and feel when I visit our sites and talk to individual teams. I believe it is our engaged colleagues themselves who can drive the changes and efficiency improvements in our business.
What do you feel unites and defines the Group’s people?We are unique in that we are small enough as a business that every person can make a difference, but also big enough that we can invest in our people and support their growth and progress. This investment is crucial and we have been developing our frontline teams, managers and professional technical teams to ensure that we have the best people, trained to the highest standards that can ‘Do the right thing’ for our customers, investors and other external stakeholders.
Supporting this are internal initiatives such as our diversity network alliance, external schemes such as the 2016 Women in Finance charter, and several other associations that I am proud we have joined. These are all helping us to chip away at the ‘male, pale, stale’ image of insurance.
Every day, I see evidence of people bringing all of themselves to work – I think this is because we are diverse, and value the individuality and the unique strengths of each person. This is backed up by our Dialogue results, where 90% of our colleagues say that they feel they can be themselves at work.
This is important as it ensures we have the most talented teams and truly represent the ever changing Britain we look to protect. I believe this further helps our people genuinely care about their actions, whether that’s in the way they treat our customers, or how they help other parts of the Company to be efficient and effective. Although there is even more we can do in this area, diversity is something that unites and defines us. Not only in the conventional sense, but also through striving to have a powerful combination of people, with a rich diversity of experience and thinking.
My thanks go to our people for their hard work and support throughout the year. I am excited by their passion and by how they work tirelessly to make insurance much easier and better value for our customers.
Paul GeddesChief Executive Officer
www.directlinegroup.com 13
Strategic reportG
overnanceFinancial statem
ents

Our strategy
Focusing strategy to deliver now and build for the futureOur mission is to make insurance much easier and better value for our customers. Our strategy to achieve this is based on three strategic pillars: great retailer, smart & efficient manufacturer and lead & disrupt the market.
We continue to invest in our key enablers to help grow and strengthen these pillars, which we believe will help us with our ambitions of growing sustainably and delivering at least a 15% RoTE.
Direct Line Group Annual Report & Accounts 201614
Great retailer
Smart & efficient manufacturer
Lead & disrupt the market
Make insurance much easier and better value for our customers
Data & technology
Culture & capability
Capital & risk management
Our mission
Our strategic pillars
Long-term ambition: Sustainable growth and at least 15% RoTE
Our key enablers

Great retailer
Smart & efficient manufacturer
Compelling brands, propositions and customer experience to meet diverse and long-term customer needsWe aim to make it easy for our customers to access our products and services at every stage of their journey. This includes increasing online servicing for customer policies and claims, and evolving telephone sales and servicing by investing in next-generation customer systems. We focus on training our contact centre employees to understand and respond better to our customer needs.
How we performed in 2016The differentiation of our brands remained a key focus in 2016. For Direct Line we have built strong foundations since our ‘reboot’ of the brand just over two years ago, introducing a succession of effectively marketed product enhancements. This year we added a three-hour emergency plumbing service for our Home Plus customers. Our strong marketing and branding is key to clearly articulating these enhancements to our customers so they want to come directly to us. The success of our marketing to drive Direct Line growth was recognised when we won the Gold Institute of Practitioners in Advertising award for marketing effectiveness.
The strength of our Direct Line brand is not limited to the personal lines sector, with more small businesses looking for reliable and easy to use direct insurance, Direct Line for Business continued to grow strongly in the year, highlighting the value of this brand asset.
Our effectiveness on PCWs via the Churchill and Privilege brands has also increased, particularly in Home as we improved the customer journey. This contributed to strong new sales growth through this channel.
Our Churchill brand was strengthened with the launch of our ‘Lollipoppers’ campaign and we have recruited new Lollipop men and women nationwide. We also relaunched our Churchill Motor free rescue campaign, differentiating this brand and leveraging our Rescue capabilities at the same time.
Our Green Flag brand continued to perform well. Green Flag’s app was enhanced with Green Flag ‘Alert Me’ and ‘Rescue Me’, providing the capability for rescue customers to monitor the health of their car and to improve their rescue experience.
Our objectives for 2017Continue to build the Direct Line brand presence, offering a differentiated and valued service and proposition not available on PCWs. Further leverage our ‘Direct’ capabilities with our small to medium-sized enterprise (“SME”) commercial customers and maintain our competitiveness on PCWs.
Efficiency and flexibility to deliver better claims and customer service at lower costWe aim to improve efficiency and effectiveness across the organisation everyday. While we re-established our traditional partnership capabilities, we intend to establish ourselves as the UK insurance partner of choice for less traditional partners.
How we performed in 2016Our underlying costs (excluding higher non-cash impairments to intangible assets than in recent years) were stable compared to 2015, having absorbed the £24m Flood Re levy and still supporting 4.3% in-force policy growth in our Motor and Home own brands. Excluding the impairment, H2 2016 costs were lower than H2 2015, primarily due to lower claims handling expenses.
In our Partnerships, we extended our Home and Private Insurance arrangement with RBS for a further three years and our Travel insurance contract with Nationwide Building Society until the end of 2018.
We agreed an extension of our Home and Motor insurance partnership with Prudential for a further two years. As part of this, we will renew policies under the Prudential brand until 2019. We’ve also launched our first Affinity Partnership scheme to offer access to Churchill-branded Home and Motor policies to Prudential Group customers who do not currently have such insurance with us. This partnership demonstrates our ability to deliver tailored propositions to meet the needs of our partners and their customers.
The Group increased the number of accident repair centres it owns to 18 in 2016 strengthening its ability to control indemnity spend and improve customer experience.
Our objectives for 2017While we made good progress in establishing new partners in 2016, we continue to be on the lookout for more opportunities where our flexibility and expertise can benefit all stakeholders.
We maintain a firm focus on improving the efficiency of the business through cost efficiency programmes, while investing in systems and capabilities to increase customer self-service.
We are investing to further strengthen our application and claims fraud capabilities.
www.directlinegroup.com 15
Strategic reportG
overnanceFinancial statem
ents

Our strategy continued
Lead & disrupt the market
Data & technology
Maximise existing growth opportunities while creating and driving future areas of valueWe aim to remain a leading competitor in our chosen markets by providing quality propositions and value for money. Where there are opportunities, we will look to launch new and exciting products and services. These will aim to put us at the forefront of disruptive market changes.
How we performed in 2016We continued to build on our strong market position by identifying and investing in market developments we believe can contribute to future growth.
We have extended our partnership with PSA Finance UK (part of Peugeot Citroën) for a further four years. The partnership has found success by packaging insurance with car finance to create innovative mobility solutions for consumers, particularly young or inexperienced drivers through the use of telematics in the Peugeot Just Add Fuel and Citroen SimplyDrive offers. Extending the partnership allows us to create propositions based on the technology being fitted to the car.
We are working with Tesla to understand the role advanced technology and driving aids can play in enhancing road safety and therefore insurance. In 2017, Tesla became an introducer appointed representative to be able to refer customers to Direct Line to insure their Tesla.
In 2016, we formed a partnership called MOVE_UK with the UK government, technology providers and car manufacturers to accelerate the development, market readiness and deployment of Automated Driving Systems (“ADS”). With ADS systems observing and recording in the background while MOVE_UK vehicles are driven normally, this is a unique opportunity to learn how ADS technology would respond in real life situations.
In Commercial, we continued to be recognised for our leading capabilities in eTrade and direct Commercial insurance, both of which are expected to continue to grow.
Our objectives for 2017New car technology centred on improving safety is emerging at a fast pace and the Group aims to take a lead by becoming the insurer of choice for the owners of the cars equipped with such technology. We continue to look for new partners and ways to help our customers benefit from these new technologies.
In Commercial, we are looking to further leverage our strong Direct Line brand and direct marketing capabilities to disrupt the small commercial customer segment.
Harness the power of technology and the scale of our data
We aim to harness the power of technology to make things easier for our customers and our people. By implementing integrated systems that are flexible and efficient, over time we aim to reduce costs while improving customer interactions such as self-service. We also enjoy a wealth of data from being a major insurer for a number of years, which we can use to make our business better for our customers.
How we performed in 2016The ongoing areas of focus include developing future capability, and managing risks associated with IT systems’ stability and cyber security. Technology remains at the heart of our operations and the focus is on upgrading our IT systems and capabilities, aimed at improving the digital offering, customer experience and operational efficiency. While progress has been made in each of these three areas, implementation and integration of a range of new IT systems is inherently complex and challenging. We remained focused on adopting the right capabilities and will take the time necessary to do so.
We have made progress improving the performance of the core infrastructure during the year, supporting our people in performing their roles more effectively.
Our objectives for 2017We will continue to look to improve the performance and cost effectiveness of our existing IT systems and work on developing and building new IT systems.
Direct Line Group Annual Report & Accounts 201616

Culture & capability
Capital & risk management
Build on our people’s potential
We are continuing to invest in our employees’ skills. This will help us to improve effectiveness and customer experiences. We aim to create excellent Group-wide employee engagement by focusing on leadership and people management at all levels. This has helped improve our employee engagement metrics year on year.
How we performed in 2016During the year we continued to invest in employees’ skills to improve effectiveness and customer experience. We are committed to broadening the diversity of our talent pool and this year signed up to the Women in Finance Charter, seeking to increase the number of women in senior roles in the organisation.
In addition, we launched a new graduate scheme and apprentice recruitment drive to build a stronger organic talent pool.
We also launched a major new training programme for our people, designed to help flex their approaches to improve engagement with customers. Not only has this strengthened our front office staff skills, as they handle customers in often difficult situations, but it has also strengthened the way our people interact with one another.
This has in turn helped the engagement rate to continue to improve through the year from an already improved level in 2015.
Our objectives for 2017We have a range of new initiatives to build on our people strategy focused on developing a high performance culture based on diversity, continuous training and a focus on the customer.
Our foundation of capital and risk management
Our risk and capital management policy seeks to maintain an appropriate level of capital and solvency for the risk appetite agreed by the Board to support our business, while aiming to grow dividends annually in real terms.
How we performed in 2016During 2016, we received approval from the PRA to use the Group’s PIM, successfully concluding a multi-year project. We have embedded this model at the centre of the risk management framework and now use it to report our Solvency II capital coverage.
We have used the PIM to establish a clear capital target range which provides additional security over the regulatory SCR.
We were well prepared for the UK’s referendum on leaving the European Union (“EU”) and have actively managed the impacts from the subsequent volatile financial markets. We are a UK-based business underwriting risk within the UK, and the day-to-day operations remain largely unaffected. We continue to monitor the consequences of the devaluation of Sterling and uncertain financial markets.
Our objectives for 2017We aim to further embed the use of our internal model within the business and operational decision making. We recognise the strategic value and competitive advantage strong risk management can provide and continue to work to drive ownership of risk management across the Group.
www.directlinegroup.com 17
Strategic reportG
overnanceFinancial statem
ents

Building a culture of great service In order to constantly improve our customer experience we are investing in training and development for our people.
4,000+colleagues trained in “Connect” since its launch in 2015
Providing the tools for success The Connect programme was designed to challenge the mindset of our organisation and help our people with the skills they need to have real conversations with customers. The aim was to connect them to the vital role they play in supporting people through what can be difficult times.
Direct Line Group Annual Report & Accounts 201618

Committed supportBecause our people are our biggest asset and have the biggest impact on our customers, we wanted this cultural change to touch every customer facing area of our business. This includes contact centres, accident repair centres, offshore partners and suppliers. This contributes to our aim of creating an effortless journey for our customers.
www.directlinegroup.com 19

Preparing for the roads of the futureThis year we kicked off a partnership called MOVE_UK with Government, technology providers, and car manufacturers to accelerate the development, market readiness and deployment of Automated Driving Systems (ADS). Planning for the future of our business is vital so that we continue to provide customers with a service that fits their needs.
Testing tomorrow’s cars The three-year project is one of the first of its kind in the UK and aims to develop a new method for validating ADS and a data resource that will help us analyse and prepare for the impact of ADS on three-year vehicle insurance.
Direct Line Group Annual Report & Accounts 201620

Building our technology and data capabilitiesFurther advances of in-car technology and driverless cars are set to change British roads. As a leading insurer we have a key role to play in the development and, in particular, the adoption of this technology which has the potential to improve road safety significantly.
250+data points monitored in each car
Embracing new technologyWith ADS observing and recording in the background while MOVE_UK vehicles are driven normally, it’s a unique opportunity to learn how ADS technology would respond in real life situations.
www.directlinegroup.com 21

Building our brands by offering more We take pride in investing in our brand propositions to give customers increased certainty around the service they can expect from their insurance.
Direct Line committing to providing a plumber within
3 hoursday or night was an industry first
Support around the clock We identified escape of water as a costly problem for both homeowners and insurers and one that requires a quick remedy – a burst pipe can result in 30 gallons of water escaping in as little as two minutes.To tackle this, in 2016 we introduced our commitment to providing an emergency plumber within three hours of reporting an uncontrollable leak for all Direct Line Home Insurance Plus policyholders and those who add ‘Home Emergency’ to their standard Direct Line Home policy.
Direct Line Group Annual Report & Accounts 201622

Available when our customers need us The commitment to a plumber arriving in such a short time frame is a first for the insurance industry.For water leaks that can be contained by turning off the water supply, Direct Line will still ensure an emergency plumber is sent to the property at a time convenient for the householder.
www.directlinegroup.com 23

Our key performance indicators
Defining and measuring our performance
Read more about our rewards for performance on page 82. For definitions, see the glossary on pages 189 and 190
DefinitionThe return generated on the capital that shareholders have in the business. This is calculated by dividing adjusted earnings by average tangible equity.
The amount of cash paid to shareholders from the Group’s profit.
This is calculated by dividing the earnings attributable to shareholders by the weighted average number of Ordinary Shares in issue.
A measure of financial year underwriting profitability. It is the sum of the net claims, commissions and expenses divided by net earned premium. This excludes instalment and other operating income, and investment return. A combined operating ratio (“COR”) of less than 100% indicates profitable underwriting.
AimWe aim to achieve at least a 15% RoTE.
We have a progressive dividend policy and aim to increase the dividend in real terms each year. Additionally, we look to return surplus capital to shareholders when appropriate.
We have not set a target. However, growing earnings per share is considered an indicator of a healthy business.
We aim to make an underwriting profit. For 2017, we expect to achieve a COR in the range of 93% to 95% for Ongoing operations, assuming a normal level of claims from major weather events and no further change to the Ogden discount rate.
PerformanceSee Finance review page 42 See Finance review page 42 See Finance review page 42 See Finance review page 39
Link to Directors’ remunerationWe base the Long-Term Incentive Plan (“LTIP”) awards partly on RoTE over a three-year performance period.
We base LTIP awards partly on relative TSR performance, which includes dividends. Directors also receive dividends on their beneficial shareholdings and accrue these on unvested LTIP awards.
This is a broad measure of earnings and reflects the results of the Group after tax. We base part of the Annual Incentive Plan (“AIP”) awards on profit before tax and earnings per share is closely linked to this.
We base part of the AIP awards on profit before tax. COR is closely linked to this.
Notes:1. See glossary on pages 189 and 190 and APM in appendix A on page 1912. See note 3 on page 2
These key performance indicators assess our performance against our strategy.
16y15y14y
Return on tangible equity1
(%)
16.8
18.5
14.2
Target
At least 15%
14.2%
Dividend per share2
(pence)
16y15y14y
8.8
27.5
14.0
13.2
10.0
13.8
14.6
24.6p
Basic earnings per share(pence)
16y15y14y
24.0
27.9
20.4
20.4p
Combined operating ratio(%)
16y15y14y
95.0
94.0 97
.7
97.7%
Direct Line Group Annual Report & Accounts 201624

DefinitionThe cost of doing business, including paying our people, marketing expenses, and spending on infrastructure and IT. This includes the costs we incur handling claims, but excludes any commissions we pay to brokers or partners, and restructuring and other one-off costs.
A measure to show the level of capital held compared to the level that is required, accounting for the risks we face.
Net Promoter Score (“NPS”) is an index that measures the willingness of customers to recommend products or services to others. It is used to gauge customers’ overall experience with a product or service, and the customer’s loyalty to a brand.
The number of complaints we received during the year as a proportion of the average number of in-force policies.
AimWe aim to reduce our expense ratio during 2017, absorbing our investment in future capability. We also aim to deliver a lower commission ratio in 2017, normalised for major weather events.
We target capital coverage to the Board’s risk appetite range of 140% to 180% of our SCR. We also aim to maintain a rating in the ‘A’ range from our credit rating agencies.
We aim to improve this to achieve strong levels of customer loyalty and retention rates.
This measure indicates the level of customer service we provide. We aim to improve this over time.
PerformanceSee Finance review page 40 See Finance review pages 45 and 46 Customer claims experience
programmes and improved propositions have contributed to an increase in our overall brand score.
While the proportion of complaints received improved on 2015, we recognise we have more to do to reduce these.
Link to Directors’ remunerationCosts are considered and form part of the gateway measures for the AIP awards.
Risk management within risk appetite, which includes an assessment of capital strength, and acts as a gateway for the AIP awards and underpin for LTIP awards.
The AIP awards include a weighting to a balance of customer metrics, including NPS.
The AIP awards include a weighting to a balance of customer metrics, including complaints.
Notes:1. Estimates based on the Group’s Solvency II partial internal model for 31 December 2016 and 30 June 2016. Solvency II capital coverage based on standard
formula for 31 December 20152. On an aggregated 12-months rolling basis, with 2013 rebased to 1003. For the Group’s principal underwriter, U K Insurance Limited; it excludes discontinued operations
Total costs
(£m)
16y15y14y
927.
7
884.
7
923.
7
£923.7m
Capital coverage1
Total Group (%)
16y16H115y
147.
4
184.
0
165.
0
165.0%
Net Promoter Score2
Direct Line brand (points)
16y15y14y
110.
8
118.
3 129.
1
129.1points
Complaints
Principal underwriter3 (%)
16y15y14y
0.35
0.33
0.26
0.26%
www.directlinegroup.com 25
Strategic reportG
overnanceFinancial statem
ents

Risk management
Managing our risks
Managing risk in line with our strategyManagement, and ultimately the Board, are responsible for developing our strategy. Our strategic planning process aims to ensure we have developed clear objectives and targets, and identified the actions needed to deliver them, including the management of risks. These clear objectives are consistent with our overall long-term ambition of sustainable growth and at least a 15% RoTE delivered within our risk appetite. To find out more about our strategy, see page 14.
Our risk governance structureThe Board sets and monitors adherence to the risk strategy, risk appetite, and risk framework. It has established a risk management model that separates responsibilities into ‘Three Lines of Defence’.
Our First Line of Defence is responsible for owning and managing risks to achieve our business objectives on a day-to-day basis. The Second Line of Defence is responsible for providing proportionate oversight, and challenging risks, events and management actions. Group Audit is the Third Line
of Defence, providing an independent and objective view of the adequacy and effectiveness of the Group’s risk management, governance and internal control framework.
The Group’s governance structure is set out in more detail in the corporate governance section.
Risk appetiteOur risk appetite statements define the opportunities and associated risks we are prepared to accept to achieve our business objectives. The Group has recalibrated its risk appetite range relating to the Solvency II internal model – see the table below. To monitor whether the business remains within risk appetite, we use key risk indicators (“KRIs”). We derive the KRIs from the risk appetite statements which are used to drive and monitor risk-aware decision-making.
These KRIs are qualitative and quantitative, and forward and backward looking. We review our risk appetite statements and KRIs annually, using outputs from the Internal Economic Capital Model (“IECM”).
Our risk objectives and appetite
Our business is risk. So to ensure our strategy’s success, we must manage risk effectively and efficiently.
Direct Line Group Annual Report & Accounts 201626
Risk objective Risk appetite statement
Overarching risk objective The Group recognises that its long-term sustainability depends on having sufficient economic capital to meet its liabilities as they fall due, thus protecting its reputation and the integrity of its relationship with policyholders and other stakeholders.
As part of this, the Group’s appetite is for general insurance risk, focusing on personal lines retail and SME insurance in the UK. The Group has appetite for non-insurance risks, as appropriate, to enable and assist it to undertake its primary activity of insurance.
1. Maintain capital adequacy The Group seeks to hold own funds in the range of 140% to 180% of the internal model SCR. The Group also seeks to maintain sufficient economic capital consistent with its strategic aim of achieving a standalone credit rating in the ‘A’ range.
2. Stable and efficient access to funding and liquidity
The Group aims to meet planned and unexpected cash outflow requirements, including those requirements that arise following a one-in-200 years insurance, market or credit risk event.
3. Maintain stakeholder confidence
The Group has no appetite for material risks resulting in reputational damage, regulatory or legal censure, fines or prosecutions, and other types of non-budgeted operational risk losses associated with Group conduct and activities. The Group will maintain a robust and proportionate internal control environment.

Our Enterprise Risk Management Strategy and FrameworkThis section sets out, at a high level, our approach to setting risk strategy and the Enterprise Risk Management Framework (“ERMF”) for managing risks. It documents the high-level principles and practices to achieve appropriate risk management standards and demonstrates the inter-relationships between components of the ERMF – see diagram.
The ERMF enables us to run the business with the necessary understanding of our risks and controls, as well as having appropriate oversight to manage risks proactively. The ERMF is aligned to the Three Lines of Defence model, and intends to provide a coherent, robust, fit-for-purpose, end-to-end approach for managing all material risks. Our policy framework is a central part of the ERMF, and includes policies and minimum standards. These inform the business about how it needs to conduct activities to remain within its risk appetite.
The Board approves our strategy, risk appetite and policies, and the Board Risk Committee (“BRC”) approves the ERMF.
Our risk cultureOur risk culture underpins our business and decision-making, and helps us embed a robust approach to managing risk. Our risk culture is demonstrated in the understanding and business-wide use of the risk management systems and processes and through risk-aware decision-making. The Board is committed to promoting a culture of high standards of corporate governance, business integrity, ethics, and professionalism in all our activities. An annual assessment of risk behaviours and attitudes (“ARBA”) is undertaken jointly by the Risk function and Group Audit and considers a range of factors influencing risk culture.
Risk profile
Reporting & monitoring
Group strategy
Risk appetite
Policy framework
Principal risks
Identify
Assess
Manage
Monitor
Report
Risk management
Principal risks and uncertaintiesWe assess robustly the principal risks facing us. Principal risks are defined as having a residual risk impact of £40 million or more on profit before tax or net asset value on a one-in-200 years basis, accounting for customer, financial and reputational impacts. We believe our risk profile remained broadly unchanged over the last year.
Principal risks Owner Management and mitigation examples
Insurance risk
• Underwriting• Reserve• Distribution• Pricing
• Reinsurance
The risk of loss due to fluctuations in the timings, amount, frequency and severity of an insured event relative to the expectations at the time of underwriting. See pages 136 to 139.
Chief Financial Officer, Managing Directors of Personal Lines and Commercial
• We estimate technical reserves using various actuarial and statistical techniques. Management’s best estimate of total reserves is set at not less than the actuarial best estimate
• Third parties review our reserves• Underwriting guidelines are set for all transacted business,
and pricing refined by analysing comprehensive data• Catastrophe and motor excess of loss reinsurance limits our
exposure to events and large losses• We invest in enhanced external data to analyse and
mitigate exposures• We have set reserves using the latest data and trends. In
particular, the recent decision to reduce the Ogden discount rate has been reflected in the estimate of reserves
www.directlinegroup.com 27
Strategic reportG
overnanceFinancial statem
ents

Risk management continued
Principal risks Owner Management and mitigation examples
Market risk
• Spread• Interest rate
• Property
The risk of loss resulting from fluctuations in the level and volatility of market prices of assets, liabilities and financial instruments. See pages 139 to 141.
Chief Financial Officer
• We manage and control the risks in our investment portfolio through:
− an investment strategy approved by the Board;
− diversifying the types of assets; limits on the amount of illiquid investments; tightly controlling individual credit exposures; and risk-reduction techniques, such as hedging foreign currency exposures with forward contracts, and hedging exposure to US interest rates with swap contracts
Credit risk
• Concentration
• Counterparty default
The risk of loss resulting from fluctuations in the credit standing of issuers of securities, counterparties and any debtors to which we are exposed. See pages 141 to 146.
Chief Financial Officer
• Credit limits are set for each counterparty and we actively monitor credit exposures
• We only purchase reinsurance from reinsurers with at least an ‘A–’ rating
Operational risk
• Information security• IT and business continuity• Outsourcing• Financial reporting• Model• Partnership contractual obligations• Change
• Technology and infrastructure
The risk of loss due to inadequate or failed internal processes, people, systems, or from external events.
Specific members of the Executive
• We have appropriate operational processes and systems, including detection systems for fraudulent claims
• We are working to improve the performance of our IT systems while focusing on developing future systems capability. With significant change underway, we are continuing to monitor risks associated with our IT systems’ stability, cyber security, and the internal control environment
• Our risk management system is designed to enable us to capture risk information in a robust and consistent way
• We monitor the performance of outsourced and offshored activities
Regulatory and conduct risk
• Compliance
• Conduct
The risks leading to reputational damage, regulatory or legal censure, fines or prosecutions, and other types of non-budgeted operational risk losses associated with our conduct and activities.
Chief Risk Officer and Managing Director, Personal Lines
• We maintain a constructive and open relationship with our regulators
• We use specific risk management tools and resources to help manage our exposure to regulatory risk
• Our risk-based monitoring is designed to ensure we use our resources effectively
• We have a strong culture of considering customers’ perspectives; delivering the right outcomes for our customers is central to how we operate
• Our robust customer conduct risk management is designed to minimise our risk exposure
Direct Line Group Annual Report & Accounts 201628

Emerging risksOur definition of emerging risks is newly developing or changing risks that are often difficult to quantify, but may materially affect our business. We have further defined emerging risks as highly uncertain risks that are external to our business. We record emerging risks within an Emerging Risk Register. We report these to the Risk Management Committee and BRC for them to review, challenge, approve and feed into the Board’s strategic planning process. Our emerging risks processes aim to:
• achieve ‘first mover advantage’ by recognising risks and associated opportunities early;
• reduce the uncertainty and volatility of our business’ results; and
• manage emerging risks proactively.
We consider our main emerging risks to be as follows:
Technological change in driving habits reduces consumer need for motor insuranceNew car technologies, such as crash-prevention technologies and driverless cars, could significantly affect the size and nature of the insurance market, and the role of insurers. In addition to our partnership with the Government on Automated Driving Systems – MOVE_UK, the Group continues to consider new motor technologies as part of its pricing and underwriting approach.
Changes to traditional insurance business modelsNew market entrants and changes in consumer expectations could result in significant changes to the structure of the general insurance market, and require us to update our business model. Our strategy, aligned to our mission to make insurance much easier and better value for our customers, is positioned to take advantage of changes in technology and customer behaviours.
UK economyThe UK could enter a prolonged period of reduced growth following its referendum vote on EU membership, potentially reducing insurance sales and the value of our investment portfolio. Equally, the uncertainty surrounding the nature and outcome of the Article 50 negotiations could have various implications. In addition, whilst our operations are based mainly in the UK, we have monitored and will continue to monitor actual and potential implications including: changes to the value of Sterling which impact claims and non-claims supplier costs; volatility in currency exposures and hedging costs; inflation; recruitment and retention of people; potential changes to direct and indirect tax; and the impact on our capital position.
Climate changeClimate change could increase the frequency of severe weather events in the UK, and particularly flooding claims costs. We continue to monitor changes in claims experience and consider weather trends as part of our pricing and underwriting processes.
Potential future changes to the Ogden discount rateThe Ogden discount rate has recently been reduced to minus 0.75%, with an imminent consultation announced to consider the methodology for setting this discount rate and therefore potentially leading to further changes to the rate itself. We are monitoring the development of the consultation and analysing the implications on claims costs and the solvency capital requirement.
Principal risks Owner Management and mitigation examples
Strategic risk
• Strategy implementation
• Strategy formulation
The risk of direct or indirect adverse impact on the earnings, capital, or value of our business, resulting from the strategies not being optimally chosen, implemented or adapted to changing conditions.
Chief Executive Officer
• We agree, monitor and manage performance against the plan and targets
• We run an annual strategy and 5-year planning process which considers our performance, competitor positioning and strategic opportunities
• We identify and manage emerging risks using established governance processes and forums
We consider brand, reputational and political risk within the drivers of other risk types, such as regulatory and conduct, operational and strategic risks.
www.directlinegroup.com 29
Strategic reportG
overnanceFinancial statem
ents

Corporate social responsibility
Safer young drivers
Approach Our Corporate Social Responsibility (“CSR”) strategy helps us put society’s interests at the heart of our business. The strategy has four strands. As shown in the graphic, they are ‘Helping to make our society safer’, ‘Proud to be here’, ‘Recognised as part of our communities’ and ‘Reduce, Reuse and Recycle’.
We manage our strategy through our CSR Advisory Group, which comprises senior managers from across the business. Our sustainability team supports the Advisory Group. Individual members of our Executive Committee are accountable for each strand of the strategy. The CSR Committee’s role is to oversee our approach. See page 72.
To help us understand, prioritise, and respond to the sometimes competing needs of our different stakeholders across society, we partner with several leading CSR organisations.
You can find more details of our approach on the Group’s website at www.directlinegroup.com, including our CSR Charter, policy framework, performance against last year’s targets, and targets for 2017.
Helping to make our society safer
We recognise that our products, services and operations affect our many stakeholders so we seek to make our society safer for everyone. Our current focus is on road safety. We believe we can responsibly use our expertise and experience to reduce deaths and life changing injuries on Britain’s roads.
Safer young driversIn December last year we launched Shotgun, a free smartphone app that aims to reduce road deaths among new young drivers.
In the UK, around half a million 17 to 25 year olds pass their driving test each year. It is a significant rite of passage for many young people, but it is also a time when young drivers are at their most vulnerable. Our data shows that accident rates among young drivers are, perhaps not surprisingly, enormously higher during the first year of driving, with one in five young drivers having some form of accident during this time. Young drivers are also hugely over-represented in the most serious accidents.
There are various reasons why young drivers crash; these include over-confidence, a natural human urge to test personal boundaries and take risks, and little experience of recognising hidden hazards. Using road-safety data and our knowledge of driver behaviour, we identified contextual speed (speed relative to other safe road users) as a significant cause of fatal and serious crashes involving young drivers. In particular, the first 1,000 miles for a new driver are critical; this is when the gap between perceived and actual driving competence drives much higher risk.
In response, we have set ourselves the ambitious goal of cutting deaths in the first 1,000 miles to zero across the UK. We will, of course, need to work with many other stakeholders to achieve this goal.
To find out more about our CSR Committee, see page 72
While progressing our broad Corporate Social Responsibility strategy, we have increased our focus on road safety as the area where we have some of the clearest and strongest expertise in the UK. We are using our position as Britain’s leading car insurer to try to inspire a generation of safer young drivers and make a radical and measurable change to the level of young driver deaths.
Proud to be here
Direct Line Group Annual Report & Accounts 201630

The biggest barrier to addressing this issue is that young drivers often feel immune to the risks. Our goal of inspiring a generation of safe and careful drivers sits at odds with many of the motivations of new drivers. Young drivers, especially young men, can be pro-risk and competitive. From our surveys, we found that many believe that ‘most people drive faster than the speed limit’ and that ‘good driving means travelling as fast as you can’. To change behaviour, we must change this perspective.
Shotgun acts as the wingman for newly qualified drivers and was developed with their direct input. Through GPS technology on a user’s smartphone, Shotgun uses the best of our telematics capability to assess driving performance, evaluating smoothness, contextual speed and a number of other factors to generate a score for each journey taken. Each user builds up a personal score which is a core indicator of accident risk. In turn, this score earns app users a place on the Shotgun leaderboard, gamifying the experience and allowing users to compete with their peers. Shotgun re-frames what it takes to be a good driver, and explodes the myth that everybody else is driving fast. The app also gives users detailed feedback, highlighting what they have done well, and how they could improve their driving score next time. When users hit pre-determined point thresholds, they unlock rewards. This encourages drivers to use the app through 1,000 miles and to improve their performance still further to earn ever more valuable rewards.
We are working with various reward partners, including Boost and Virgin Experience. Shotgun offers rewards which are attractive to a 17 to 25 year old demographic. Our research showed we needed a range of reward options that appealed to different tastes and to both urban and more rural users.
To launch the app we used the same leading-edge thinking that won Direct Line a coveted Institute of Practitioners in Advertising Gold award for Effectiveness. The Shotgun launch represented a departure from traditional advertising, in a bid to engage the target audience using channels that are relevant. This moves the topic of road safety into a more social space, with a particular focus on personal platforms like Instagram, You Tube and Snapchat. The strategy was to create content in a range of formats, based on creative ideas that resonate with the audience. These were seeded with carefully chosen partners to build saliency and drive momentum. They are also quite a bit edgier than our traditional marketing messages.
We put in place a communication plan for a diverse range of audiences – young drivers, of course, were central but also their parents as well as our own employees. Making sure we capture all of these groups is critical. For our staff, our approach has been to create awareness, build understanding and drive engagement across the business. We want our people to be proud of our shared belief that the know-how and power of Direct Line can be a real force for good in the UK. We also want our employees to become active advocates for this initiative in their local communities right across the country.
From our research and testing, we know we can engage with this vulnerable audience and change both their attitudes to driving and materially improve their driving behaviour, making a real change in their chances of being killed or injured on the roads.
During 2017, we are focusing on delivering against this objective. We will run a series of attitudinal research studies to track our users’ attitude to driving. In addition, the Shotgun app will give us a rich source of data allowing us to measure improvements to driving performance over time.
Road safety partnersDuring 2016, we worked with various partners to highlight a range of road safety issues.
PACTSIn November, we launched our third Road Safety Dashboard with the Parliamentary Advisory Council for Transport Safety (“PACTS”). This pioneering tool uses Department for Transport statistics to produce an index that ranks the road safety record of individual parliamentary constituencies. MPs tell us they find the tool valuable. In July, we also ran an event in Parliament at which 33 parliamentarians signed up to our pledge to improve road safety awareness. We also sponsored the PACTS Annual Westminster Transport Safety Lecture in the House of Commons where policymakers and campaigners come together to share ideas and best practice.
Department for TransportWe continue to engage proactively with the Department for Transport on various topics, including telematics technology, driverless cars and road safety policy.
BrakeWe maintained our partnership with road safety charity, Brake, to produce a series of survey reports on driver behaviour and attitudes. We released the results to the media to raise awareness of road safety issues and educate the public. This year’s reports have covered ‘drink driving’, ‘eating and drinking at the wheel’, ’texting while driving’, ‘winter driving’ and ‘speed awareness in urban areas’. Brake uses this research for its wider campaigning, education, community and professional engagement activities. We also sponsored Brake’s Parliamentarian of the Year Awards, which recognise Members of Parliament who have campaigned on road safety issues.
www.directlinegroup.com 31
Strategic reportG
overnanceFinancial statem
ents

Corporate social responsibility continued
Note:1. This excludes discontinued operations, the Group’s former International division. Total Group emissions for 2014 and 2015 were 28,759 and 23,143, respectively
14.6%
Greenhouse gas emissions1 (tonnes)
3,22
2.1
16y15y14y
27,3
08
22,6
11
19,3
15
Reduce, Reuse and RecycleWe aim to manage our operations sustainably and have progressed well in reducing our impact on the environment.
EmissionsYou can find information on Group-wide greenhouse gas (“GHG”) emissions in the chart below – and more details of our emissions in the Directors’ report on page 112.
Energy use is the main cause of our emissions. In absolute terms, we have reduced our emissions significantly after rationalising and implementing an energy-savings plan across our estate. This covered location management, air-conditioning, heating and lighting, for instance. We are targeting a 30% like-for-like reduction in the Group’s energy use by 2020 against a 2013 baseline.
We communicate the details of a carbon management programme through the Carbon Disclosure Project. Throughout 2016, 100% of the Group’s electricity was purchased on a green tariff.
WasteWe have further improved our systems for managing waste and increased the percentage of waste we recycle at our UK Accident Repair Centres to 61% from 54% in 2015 and at our office sites to 42% from 40% in 2015. These figures exclude paper waste which is 100% recycled. Including paper, we recycled 80% of waste at our UK Accident Repair Centres and 78% at our offices in 2016. All of our office waste is diverted from landfill, including recycling.
SuppliersOur Ethical Code for Suppliers sets out our approach to managing CSR related matters across our supply chain. We support the aims of the Modern Slavery Act 2015 and are committed to ensuring that modern slavery is not present in our supply chain. We have extended our Ethical Code to expressly cover this commitment. In accordance with the Act, we publish an annual statement on slavery and human trafficking on the Group website at www.directlinegroup.com.
Proud to be hereOur people strategy supports our business strategy, ensuring we have capable, skilled and engaged people that can help make insurance easier and better value for our customers.
We continue to focus on building pride in Direct Line Group, encouraging and celebrating the strength of our workforce. Various volunteer groups, such as our Employee Representative Bodies and Local Co-ordination Teams, increase our employees’ voice. Last year we invited employees to participate in research to help shape their future way of working. The research considered how the future working environment, technology and culture could give our people the tools they need to live and work at their best.
We also invested significantly in a new Graduate Programme. The Programme offers opportunities equally to existing employees and new applicants and will help further drive the pipeline of qualified, bright young people coming into our business.
Employee feedback remains an important gauge of how our initiatives affect change. In 2016 our people managers created over 900 action plans to improve their teams’ experience. Again this played a major part in significantly improving our engagement score from 60% in 2015 to 73%. The percentage of our employees who are proud to work for the Group also increased from 80% in 2015 to 87%, while 81% tell others that the Group is a great place to work (70% in 2015).
Diversity, inclusion and human rightsWe continue to work towards an environment based on meritocracy and inclusion, where every employee can achieve their full potential, whatever their background or situation.
Our diversity and inclusion practices are in line with the Universal Declaration of Human Rights. Our Ethical Code for Suppliers requires that all our suppliers adhere to the core International Labour Organisation standards.
Direct Line Group Annual Report & Accounts 201632

Examples of activities include:
• 780 employees manning our call centres to take pledges for appeals such as Stand Up to Cancer, Comic Relief and Children in Need;
• supporting national appeals such as the World’s Biggest Coffee Morning in aid of Macmillan and raising funds during Movember for various men’s health charities; and
• organising quiz nights, fun runs, masquerade balls, festivals, cake sales, sky dives, charity football matches and much more to raise thousands of pounds for local causes.
We encourage all employees to volunteer individually or as a team through our ‘One Day’ initiative.
Our Employee Opinion Survey revealed that 33% of staff volunteered or fundraised in company time last year. Our target for 2017 is to at least maintain this high level of engagement.
Matched giving and grantsIn 2016, our employees donated £149,000 through our payroll giving scheme and we donated a further £100,000 in matched giving. We also provided £68,250 in grants to organisations for which our employees fundraise or volunteer.
Male 5,768
Female 5,209
Gender diversity of all employees
Male 7
Female 3
Gender diversity of Board of Directors
Male 112
Female 32
Gender diversity of senior managers
In 2016, the Group signed up to the Women in Finance Charter. The Charter is a commitment by HM Treasury and signatory firms to work together to build a more balanced and fairer industry. Our pledge to the Charter reinforces our other initiatives such as our Diversity Network Alliance in promoting diversity and inclusion in our business. The Group committed to increase female representation in senior management to 30% by the end of 2019.
You can find the ratio of female-to-male employees at 31 December 2016 in the charts below.
In 2016, the Group was proud to be named in the OUTstanding Power Lists. We started working with OUTstanding, a professional network of executives committed to diversity, alongside other partner organisations to help shape our plans and bring new ideas and thinking on diversity and inclusion.
Living wageWe comply with the principles of the Living Wage Foundation, relating to our employees.
Recognised as part of our communitiesWe believe that our people’s feelings about working for the Group are linked to our reputation in the community and we therefore try to align our approach to giving more generally with their interests.
Volunteering and fundraising We know that participating in fundraising and volunteering is linked to higher engagement levels amongst our people. In order to encourage our people to participate, therefore, we run a network of Community and Social Committees which are made up of local volunteers. These receive central funding and support from the Group to support Group-wide national appeals and create a programme of events and activities based on the interests of employees at their sites.
www.directlinegroup.com 33
Strategic reportG
overnanceFinancial statem
ents

Operating review
34 Direct Line Group Annual Report & Accounts 2016
Motor Highlights Britain’s leading personal motor insurer measured by
in-force policies
In-force policies increased by 4.5% with growth in own brands in-force policies in each quarter
Gross written premium increased by 9.4% with own brands increasing by 9.3%
COR increased by 13.9 percentage points to 106.3% primarily reflecting the increase in reserves following the reduction in the Ogden discount rate
Operating profit reduced to £149.1 million due to higher non-cash intangible asset impairments and the reduction in the Ogden discount rate
Performance highlights 2016 2015
In-force policies (thousands) 3,873 3,707
Gross written premium £1,539.1m £1,406.7m
Loss ratio 74.9% 63.6%
Commission ratio 3.2% 2.6%
Expense ratio 28.2% 26.2%
Combined operating ratio 106.3% 92.4%
Operating profit £149.1m £338.0m
Performance Motor in-force policies increased by 4.5% during 2016, driven primarily by own brands. Overall, Motor gross written premium increased by 9.4% in comparison to 2015.
The market experienced high levels of shopping during 2016. The Direct Line brand was able to use this environment to continue to improve its competitive position, resulting in strong new business growth. The comparatively high level of persistency and attractive customer base allowed the Group to reinvest some of that value back into propositions and price competitiveness.
Motor average written premiums1 increased by 6.3% in 2016 compared with an average increase of 5.2% in 2015. As demonstrated by the improving current-year loss ratio, the Group was able to continue to write business at attractive margins, as a result of successful pricing and a slightly improved risk mix. Claims inflation remained at the top of the Group’s long-term expectation of 3%-5%, driven by higher damage costs.
The COR for the Motor division was 106.3% (2015: 92.4%), including an 11.2 percentage points one-off increase due to the recent reduction in the Ogden discount rate. Prior-year reserve releases were significantly lower at £123.5 million (2015: £266.8 million), including a £139.8 million charge in respect of the recent Ogden discount rate change.
The expense ratio increased due to higher non-cash intangible asset impairments of £39.3 million. The commission ratio remained broadly stable compared to 2015.
The current-year attritional loss ratio improved by 0.9 percentage points to 84.1% (2015: 85.0%). Excluding the impact of the recent reduction in the Ogden discount rate, the current-year attritional loss ratio for Motor was 83.3% an improvement of 1.7 percentage points compared to 2015. Growth in average premiums, coupled with improving claims trends in large bodily injury, were partially offset by higher than expected damage inflation and the Group’s investment in new business growth.
Operating profit was £149.1 million, lower than 2015 primarily as a result of a one-off charge due to the reduction in the Ogden discount rate of £150.3 million and higher intangible asset impairments of £39.3 million.
Regulatory On 27 February 2017, the Lord Chancellor announced a reduction in the Ogden discount rate to minus 0.75% with effect from 20 March 2017, which has led to an increase in the amount of claims reserves necessary to be held by the Group, specifically those that are settled as lump sums by the Courts. This follows a consultation process instigated by the Ministry of Justice some years ago in connection with the rate to be applied to personal injury lump sum damages awards in settling such claims. The Group is committed to ensuring claimants receive appropriate compensation and has made appropriate provision in its claims reserves for the ruling, which will apply to all open unsettled claims. The Lord Chancellor’s announcement referred to a consultation to consider options for reform concerning the discount rate and accordingly has left open the possibility of further changes to the process by which the rate is set, and therefore to the rate itself. The Group welcomes the consultation to consider options for reform, with a view to achieving a better and fairer framework for claimants and defendants.
On 23 February 2017, the Government announced measures to reduce the volume and cost of soft tissue damage ‘whiplash’ claims and stated its expectation that this will see a reduction in motor insurance premiums by £40 on average. The measures include a fixed tariff for payment of injuries up to 24 months in duration. Further measures detailed in the paper are still being considered. The Government is keen to introduce all changes to whiplash claims as a package in late 2018. The Group has been calling for reform in this area for some time and continues to work with Government and industry bodies on how the reforms should be implemented.
Outlook The market was highly competitive and faced a number of significant government policy and regulatory changes during 2016 and 2017. In the face of these challenges, we demonstrated our resilience and appeal to customers by growing our own brand policies while maintaining overall margins, which has continued into early 2017. We do not expect any material residual impact on 2017 Motor profit as a result of adopting the reduction in the Ogden discount rate to minus 0.75%.
Note:
1. Average incepted written premiums excluding IPT for total Motor for year ended 31 December 2016
Personal Lines
Direct Line Group Annual Report & Accounts 201634

Operating review
34 Direct Line Group Annual Report & Accounts 2016
Motor Highlights Britain’s leading personal motor insurer measured by
in-force policies
In-force policies increased by 4.5% with growth in own brands in-force policies in each quarter
Gross written premium increased by 9.4% with own brands increasing by 9.3%
COR increased by 13.9 percentage points to 106.3% primarily reflecting the increase in reserves following the reduction in the Ogden discount rate
Operating profit reduced to £149.1 million due to higher non-cash intangible asset impairments and the reduction in the Ogden discount rate
Performance highlights 2016 2015
In-force policies (thousands) 3,873 3,707
Gross written premium £1,539.1m £1,406.7m
Loss ratio 74.9% 63.6%
Commission ratio 3.2% 2.6%
Expense ratio 28.2% 26.2%
Combined operating ratio 106.3% 92.4%
Operating profit £149.1m £338.0m
Performance Motor in-force policies increased by 4.5% during 2016, driven primarily by own brands. Overall, Motor gross written premium increased by 9.4% in comparison to 2015.
The market experienced high levels of shopping during 2016. The Direct Line brand was able to use this environment to continue to improve its competitive position, resulting in strong new business growth. The comparatively high level of persistency and attractive customer base allowed the Group to reinvest some of that value back into propositions and price competitiveness.
Motor average written premiums1 increased by 6.3% in 2016 compared with an average increase of 5.2% in 2015. As demonstrated by the improving current-year loss ratio, the Group was able to continue to write business at attractive margins, as a result of successful pricing and a slightly improved risk mix. Claims inflation remained at the top of the Group’s long-term expectation of 3%-5%, driven by higher damage costs.
The COR for the Motor division was 106.3% (2015: 92.4%), including an 11.2 percentage points one-off increase due to the recent reduction in the Ogden discount rate. Prior-year reserve releases were significantly lower at £123.5 million (2015: £266.8 million), including a £139.8 million charge in respect of the recent Ogden discount rate change.
The expense ratio increased due to higher non-cash intangible asset impairments of £39.3 million. The commission ratio remained broadly stable compared to 2015.
The current-year attritional loss ratio improved by 0.9 percentage points to 84.1% (2015: 85.0%). Excluding the impact of the recent reduction in the Ogden discount rate, the current-year attritional loss ratio for Motor was 83.3% an improvement of 1.7 percentage points compared to 2015. Growth in average premiums, coupled with improving claims trends in large bodily injury, were partially offset by higher than expected damage inflation and the Group’s investment in new business growth.
Operating profit was £149.1 million, lower than 2015 primarily as a result of a one-off charge due to the reduction in the Ogden discount rate of £150.3 million and higher intangible asset impairments of £39.3 million.
Regulatory On 27 February 2017, the Lord Chancellor announced a reduction in the Ogden discount rate to minus 0.75% with effect from 20 March 2017, which has led to an increase in the amount of claims reserves necessary to be held by the Group, specifically those that are settled as lump sums by the Courts. This follows a consultation process instigated by the Ministry of Justice some years ago in connection with the rate to be applied to personal injury lump sum damages awards in settling such claims. The Group is committed to ensuring claimants receive appropriate compensation and has made appropriate provision in its claims reserves for the ruling, which will apply to all open unsettled claims. The Lord Chancellor’s announcement referred to a consultation to consider options for reform concerning the discount rate and accordingly has left open the possibility of further changes to the process by which the rate is set, and therefore to the rate itself. The Group welcomes the consultation to consider options for reform, with a view to achieving a better and fairer framework for claimants and defendants.
On 23 February 2017, the Government announced measures to reduce the volume and cost of soft tissue damage ‘whiplash’ claims and stated its expectation that this will see a reduction in motor insurance premiums by £40 on average. The measures include a fixed tariff for payment of injuries up to 24 months in duration. Further measures detailed in the paper are still being considered. The Government is keen to introduce all changes to whiplash claims as a package in late 2018. The Group has been calling for reform in this area for some time and continues to work with Government and industry bodies on how the reforms should be implemented.
Outlook The market was highly competitive and faced a number of significant government policy and regulatory changes during 2016 and 2017. In the face of these challenges, we demonstrated our resilience and appeal to customers by growing our own brand policies while maintaining overall margins, which has continued into early 2017. We do not expect any material residual impact on 2017 Motor profit as a result of adopting the reduction in the Ogden discount rate to minus 0.75%.
Note:
1. Average incepted written premiums excluding IPT for total Motor for year ended 31 December 2016
www.directlinegroup.com 35
Home Highlights Britain’s leading personal home insurer measured by
in-force policies
Own brands in-force policies increased by 2.3%; overall reduction in in-force policies of 1.2% primarily due to partnerships
Gross written premium was 3.7% lower primarily due to partnerships, while own brands reduced by 0.9%
COR improved by 7.2 percentage points to 85.0%
Operating profit improved by 51.7 percentage points to £166.7 million reflecting lower claims from major weather events
Performance highlights 2016 2015
In-force policies (thousands) 3,378 3,418
Gross written premium £834.4m £866.3m
Loss ratio 40.7% 51.5%
Commission ratio 22.6% 20.9%
Expense ratio 21.7% 19.8%
Combined operating ratio 85.0% 92.2%
Operating profit £166.7m £109.9m
Performance In-force policies for Home own brands increased by 2.3% to 1.8 million over 2016, while partner in-force policies reduced by 4.7%. Gross written premium was 3.7% lower than for 2015 primarily due to partnerships which were 6.2% lower, while own brands experienced a smaller reduction of 0.9%.
Following a prolonged period of significant deflation, the home market showed signs of some stability during the second half of 2016. Home‘s average written premium1 decreased by 3.9% in 2016 compared with 3.6% in 2015, primarily due to changes to tenure and distribution channel mix including higher sales through the PCW channel. Home market new business premiums improved during the year after years of premium deflation. New business pricing for the Group’s Home own brands was sufficiently competitive to allow the Home division to continue to grow own brands through web and aggregator channels.
In Home, the COR improved by 7.2 percentage points primarily as a result of a lower loss ratio, which was 10.8 percentage points lower than 2015. The impact of major weather events in 2016 was approximately £18 million (2015: £90 million) and was lower than the normal annual level of claims costs expected from major weather events of approximately £70 million. Prior-year reserve releases, which included some favourable development from the storms in late 2015, were higher than last year at £75.9 million (2015: £41.9 million).
The current-year attritional loss ratio, excluding claims costs from major weather events, was 2.0 percentage points higher than 2015. This was predominantly driven by a greater proportion of new business sales compared to 2015 and an increase in claims inflation.
The expense ratio at 21.7% was 1.9 percentage points higher than in 2015 primarily due to the Flood Re levy. The commission ratio at 22.6% was 1.7 percentage points higher than in 2015 as profit share due to partners was higher as a result of the improved loss ratio performance.
Operating profit of £166.7 million improved by 51.7 percentage points benefitting from lower claims costs from major weather events and higher than expected prior-year reserve releases.
The Group‘s partnership with Nationwide Building Society was due to terminate in June 2017. These plans are currently being reviewed which may result in the migration moving to the second half of 2017, whilst the Group works with Nationwide to ensure a smooth transition for customers. If this is the case, the Group will continue to earn premiums written in the second half of 2017 through to the second half of 2018.
The Group continued with its planned digital and proposition investment in the successful RBS Home and Private Insurance relationship. This will enable the Group to offer RBS customers tailored products consistent across distribution channels.
The Group agreed an extension of its Home and Motor insurance partnership with Prudential for a further two years. As part of this, policies will be renewed under the Prudential brand until 2019. The Group also launched its first affinity partnership scheme to offer access to Churchill-branded Home and Motor policies for Prudential Group customers who do not currently have such insurance with the Group. This partnership demonstrates the Group’s ability to deliver tailored propositions to meet the needs of partners and their customers.
Flood Re From 1 April 2016, Flood Re, the Government and industry-backed scheme to provide affordable home insurance to households at high risk of flooding, became operational. The Group has supported Flood Re’s formation and was ready to cede chosen risks to Flood Re on its inception.
Outlook The market remained competitive in 2016, although with some signs of premium inflation on new business, following several years of significant deflation.
There is evidence that claims inflation has been increasing and has continued to run ahead of premium inflation. The focus remains on balancing margin and volume with a view to delivering sustainable long term value.
Note:
1. Average incepted written premiums excluding IPT for Home own brands for year ended 31 December 2016
www.directlinegroup.com 35
Strategic reportG
overnanceFinancial statem
ents

Operating review continued
36 Direct Line Group Annual Report & Accounts 2016
Rescue and other personal lines Highlights In-force policies for Rescue reduced by 7.3% primarily
as a result of lower partner volumes
Gross written premium for Rescue and other personal lines increased by 1.7% to £400.8 million primarily due to Travel partnerships pricing
COR increased by 2.1 percentage points to 93.3%
Operating profit reduced by 11.7% to £45.9m
Performance highlights 2016 2015
In-force policies (thousands)
Rescue1 3,646 3,932
Other personal lines 4,234 4,356
Total in-force policies 7,880 8,288
Gross written premium £400.8m £394.1m
Loss ratio 61.6% 59.9%
Commission ratio 7.2% 6.4%
Expense ratio 24.5% 24.9%
Combined operating ratio 93.3% 91.2%
Operating profit £45.9m £52.0m
Performance In-force policies for Rescue reduced by 7.3% to 3.6 million in comparison to the prior year through lower partner volumes. The reduction in in-force policies for other personal lines of 2.8% across 2016 primarily reflected lower packaged bank account volumes.
Gross written premium for Rescue and other personal lines grew by 1.7% compared with 2015. Rescue gross written premium remained broadly stable compared with 2015. Green Flag performed well supported by competitive propositions. Gross written premium for other personal lines grew by 3.0% compared to 2015.
The COR for Rescue and other personal lines was 2.1 percentage points higher than 2015 at 93.3% (2015: 91.2%). The Rescue COR was 83.4% (2015: 82.3%) with a higher loss ratio reflecting changes in business mix and investment in the network. The commission ratio of 7.2% was 0.8 percentage points higher than 2015, reflecting higher partner profit share, while the expense ratio was stable compared to 2015.
Operating profit reduced by 11.7% to £45.9 million. Within Rescue and other personal lines, Rescue operating profit was similar to the prior year at £42.8 million (2015: £42.2 million).
The Group continues to support RBS with rescue and travel products sold to packaged account customers. The provision of these services beyond the current contract term is subject to a market review, in which the Group is participating.
Outlook Rescue continued to build its underlying capability to provide an excellent customer experience. During 2016 strong improvements in NPS underlined the progress being made and Green Flag has a strong focus for 2017 to seek to further enhance customer experience. The Group also continues to roll-out improvements in Pet and Travel to enhance our service while updating our customer propositions.
Note:
1. Rescue in-force policies have been revised to exclude partner post-accident vehicle recoveries
Direct Line Group Annual Report & Accounts 201636

Operating review continued
36 Direct Line Group Annual Report & Accounts 2016
Rescue and other personal lines Highlights In-force policies for Rescue reduced by 7.3% primarily
as a result of lower partner volumes
Gross written premium for Rescue and other personal lines increased by 1.7% to £400.8 million primarily due to Travel partnerships pricing
COR increased by 2.1 percentage points to 93.3%
Operating profit reduced by 11.7% to £45.9m
Performance highlights 2016 2015
In-force policies (thousands)
Rescue1 3,646 3,932
Other personal lines 4,234 4,356
Total in-force policies 7,880 8,288
Gross written premium £400.8m £394.1m
Loss ratio 61.6% 59.9%
Commission ratio 7.2% 6.4%
Expense ratio 24.5% 24.9%
Combined operating ratio 93.3% 91.2%
Operating profit £45.9m £52.0m
Performance In-force policies for Rescue reduced by 7.3% to 3.6 million in comparison to the prior year through lower partner volumes. The reduction in in-force policies for other personal lines of 2.8% across 2016 primarily reflected lower packaged bank account volumes.
Gross written premium for Rescue and other personal lines grew by 1.7% compared with 2015. Rescue gross written premium remained broadly stable compared with 2015. Green Flag performed well supported by competitive propositions. Gross written premium for other personal lines grew by 3.0% compared to 2015.
The COR for Rescue and other personal lines was 2.1 percentage points higher than 2015 at 93.3% (2015: 91.2%). The Rescue COR was 83.4% (2015: 82.3%) with a higher loss ratio reflecting changes in business mix and investment in the network. The commission ratio of 7.2% was 0.8 percentage points higher than 2015, reflecting higher partner profit share, while the expense ratio was stable compared to 2015.
Operating profit reduced by 11.7% to £45.9 million. Within Rescue and other personal lines, Rescue operating profit was similar to the prior year at £42.8 million (2015: £42.2 million).
The Group continues to support RBS with rescue and travel products sold to packaged account customers. The provision of these services beyond the current contract term is subject to a market review, in which the Group is participating.
Outlook Rescue continued to build its underlying capability to provide an excellent customer experience. During 2016 strong improvements in NPS underlined the progress being made and Green Flag has a strong focus for 2017 to seek to further enhance customer experience. The Group also continues to roll-out improvements in Pet and Travel to enhance our service while updating our customer propositions.
Note:
1. Rescue in-force policies have been revised to exclude partner post-accident vehicle recoveries
www.directlinegroup.com 37
Highlights Commercial in-force policies grew by 3.1% with Direct Line
for Business growth of 6.4%
Gross written premium increased by 3.0 percentage points to £499.8 million. Direct Line for Business gross written premium grew by 7.7 percentage points to £109.6 million
COR reduced by 5.8 percentage points and operating profit increased by £21.0 million with both benefitting from lower claims costs from major weather events
Performance highlights 2016 2015
In-force policies (thousands)
DL4B 433 407
NIG and other 242 248
Total in-force policies 675 655
Gross written premium £499.8m £485.3m
Loss ratio 55.3% 62.7%
Commission ratio 19.5% 19.6%
Expense ratio 23.9% 22.2%
Combined operating ratio 98.7% 104.5%
Operating profit £41.8m £20.8m
Performance Commercial in-force policy growth across 2016 was achieved by increased sales through the Direct Line for Business and NIG. By 31 December 2016, there were more than 433,000 Direct Line for Business in-force policies.
Commercial gross written premium increased by 3.0% to £499.8 million compared to 2015, reflecting growth in Commercial direct, particularly landlord and van products. Gross written premium for NIG and other increased by 1.7% compared to 2015 in part reflecting premium rate increases.
The Commercial market has remained competitive during 2016, in particular in the broker channel. Overall premium rates have slightly lagged claims inflation albeit with variation by class of business and channel. Commercial continued to maintain its underwriting discipline and seek to balance the retention of customers with premium rate inflation.
The Commercial COR of 98.7% was 5.8 percentage points lower compared to 2015. This benefited from lower weather related claims costs, which were offset by the impact of the recent Ogden discount rate change.
Operating profit was therefore £41.8 million, an increase of £21.0 million compared to 2015. The reduction due to the recent change in the Ogden discount rate was £24.7 million, of which £23.1 million relates to 2015 and prior accident years. The current-year attritional loss ratio was 9.2 percentage points lower than 2015 due to lower weather-related claims costs and over 1 percentage point of underlying improvement due to better pricing and risk selection.
Regulatory The Insurance Act went live in August 2016 with changes applied to all of our product wordings across Commercial along with new processes in the claims area to ensure alignment to the principles of the Act. 2017 will bring changes from the Enterprise Act and the Commercial division is well placed to support these changes.
Outlook The Commercial division continued to develop both its direct to customer and broker led operations. Direct Line for Business continues to invest in its proposition to take advantage of the growing direct Commercial insurance market. Meanwhile, NIG is consolidating its position in the broker market with a focus on delivering effortless trading to its broker partners across both electronically and regionally traded business.
Commercial
www.directlinegroup.com 37
Strategic reportG
overnanceFinancial statem
ents
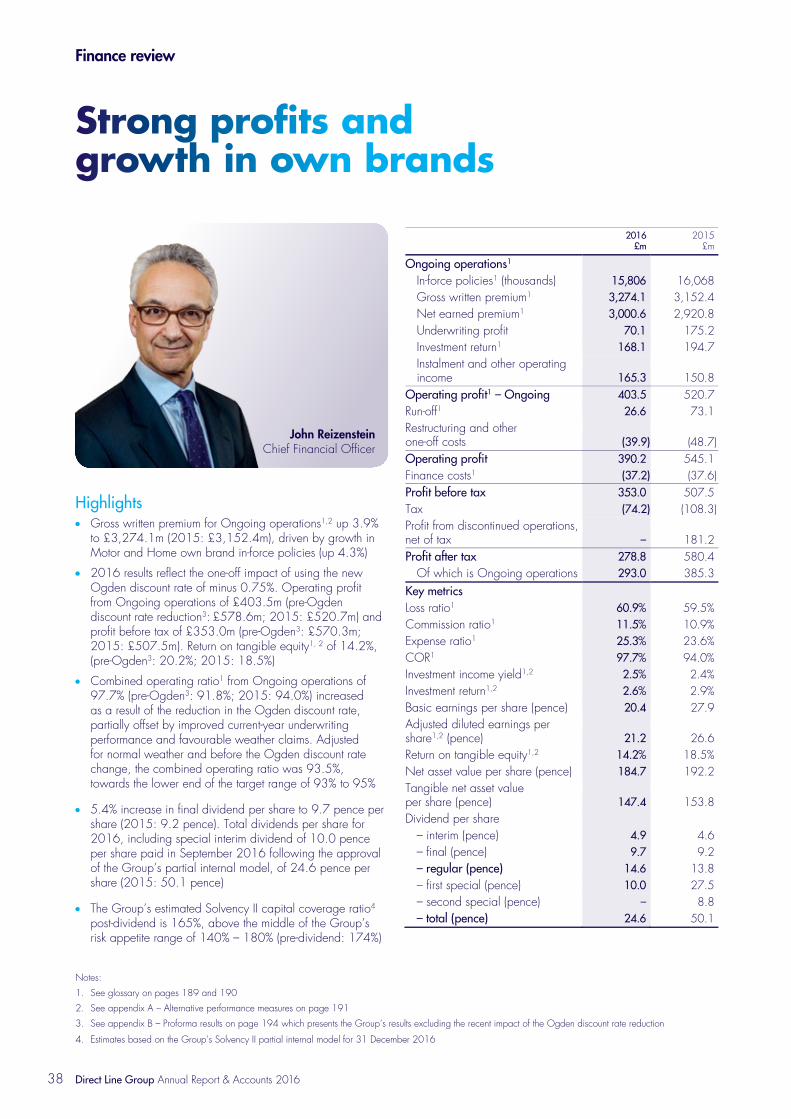
Finance review
38 Direct Line Group Annual Report & Accounts 2016
Highlights Gross written premium for Ongoing operations1,2 up 3.9%
to £3,274.1m (2015: £3,152.4m), driven by growth in Motor and Home own brand in-force policies (up 4.3%)
2016 results reflect the one-off impact of using the new Ogden discount rate of minus 0.75%. Operating profit from Ongoing operations of £403.5m (pre-Ogden discount rate reduction3: £578.6m; 2015: £520.7m) and profit before tax of £353.0m (pre-Ogden3: £570.3m; 2015: £507.5m). Return on tangible equity1, 2 of 14.2%, (pre-Ogden3: 20.2%; 2015: 18.5%)
Combined operating ratio1 from Ongoing operations of 97.7% (pre-Ogden3: 91.8%; 2015: 94.0%) increased as a result of the reduction in the Ogden discount rate, partially offset by improved current-year underwriting performance and favourable weather claims. Adjusted for normal weather and before the Ogden discount rate change, the combined operating ratio was 93.5%, towards the lower end of the target range of 93% to 95%
5.4% increase in final dividend per share to 9.7 pence per share (2015: 9.2 pence). Total dividends per share for 2016, including special interim dividend of 10.0 pence per share paid in September 2016 following the approval of the Group’s partial internal model, of 24.6 pence per share (2015: 50.1 pence)
The Group’s estimated Solvency II capital coverage ratio4 post-dividend is 165%, above the middle of the Group’s risk appetite range of 140% – 180% (pre-dividend: 174%)
2016
£m 2015
£m
Ongoing operations1 In-force policies1 (thousands) 15,806 16,068 Gross written premium1 3,274.1 3,152.4 Net earned premium1 3,000.6 2,920.8 Underwriting profit 70.1 175.2 Investment return1 168.1 194.7 Instalment and other operating income 165.3 150.8
Operating profit1 – Ongoing 403.5 520.7 Run-off1 26.6 73.1 Restructuring and other one-off costs (39.9) (48.7)Operating profit 390.2 545.1 Finance costs1 (37.2) (37.6)Profit before tax 353.0 507.5 Tax (74.2) (108.3)Profit from discontinued operations, net of tax – 181.2 Profit after tax 278.8 580.4
Of which is Ongoing operations 293.0 385.3 Key metrics Loss ratio1 60.9% 59.5%Commission ratio1 11.5% 10.9%Expense ratio1 25.3% 23.6%COR1 97.7% 94.0%Investment income yield1,2 2.5% 2.4%Investment return1,2 2.6% 2.9%Basic earnings per share (pence) 20.4 27.9 Adjusted diluted earnings per share1,2 (pence) 21.2 26.6 Return on tangible equity1,2 14.2% 18.5%Net asset value per share (pence) 184.7 192.2 Tangible net asset value per share (pence) 147.4 153.8 Dividend per share
– interim (pence) 4.9 4.6 – final (pence) 9.7 9.2 – regular (pence) 14.6 13.8 – first special (pence) 10.0 27.5– second special (pence) – 8.8 – total (pence) 24.6 50.1
Notes:
1. See glossary on pages 189 and 190
2. See appendix A – Alternative performance measures on page 191
3. See appendix B – Proforma results on page 194 which presents the Group’s results excluding the recent impact of the Ogden discount rate reduction
4. Estimates based on the Group’s Solvency II partial internal model for 31 December 2016
Strong profits and growth in own brands
Direct Line Group Annual Report & Accounts 201638
John ReizensteinChief Financial Officer

Finance review
38 Direct Line Group Annual Report & Accounts 2016
Highlights Gross written premium for Ongoing operations1,2 up 3.9%
to £3,274.1m (2015: £3,152.4m), driven by growth in Motor and Home own brand in-force policies (up 4.3%)
2016 results reflect the one-off impact of using the new Ogden discount rate of minus 0.75%. Operating profit from Ongoing operations of £403.5m (pre-Ogden discount rate reduction3: £578.6m; 2015: £520.7m) and profit before tax of £353.0m (pre-Ogden3: £570.3m; 2015: £507.5m). Return on tangible equity1, 2 of 14.2%, (pre-Ogden3: 20.2%; 2015: 18.5%)
Combined operating ratio1 from Ongoing operations of 97.7% (pre-Ogden3: 91.8%; 2015: 94.0%) increased as a result of the reduction in the Ogden discount rate, partially offset by improved current-year underwriting performance and favourable weather claims. Adjusted for normal weather and before the Ogden discount rate change, the combined operating ratio was 93.5%, towards the lower end of the target range of 93% to 95%
5.4% increase in final dividend per share to 9.7 pence per share (2015: 9.2 pence). Total dividends per share for 2016, including special interim dividend of 10.0 pence per share paid in September 2016 following the approval of the Group’s partial internal model, of 24.6 pence per share (2015: 50.1 pence)
The Group’s estimated Solvency II capital coverage ratio4 post-dividend is 165%, above the middle of the Group’s risk appetite range of 140% – 180% (pre-dividend: 174%)
2016
£m 2015
£m
Ongoing operations1 In-force policies1 (thousands) 15,806 16,068 Gross written premium1 3,274.1 3,152.4 Net earned premium1 3,000.6 2,920.8 Underwriting profit 70.1 175.2 Investment return1 168.1 194.7 Instalment and other operating income 165.3 150.8
Operating profit1 – Ongoing 403.5 520.7 Run-off1 26.6 73.1 Restructuring and other one-off costs (39.9) (48.7)Operating profit 390.2 545.1 Finance costs1 (37.2) (37.6)Profit before tax 353.0 507.5 Tax (74.2) (108.3)Profit from discontinued operations, net of tax – 181.2 Profit after tax 278.8 580.4
Of which is Ongoing operations 293.0 385.3 Key metrics Loss ratio1 60.9% 59.5%Commission ratio1 11.5% 10.9%Expense ratio1 25.3% 23.6%COR1 97.7% 94.0%Investment income yield1,2 2.5% 2.4%Investment return1,2 2.6% 2.9%Basic earnings per share (pence) 20.4 27.9 Adjusted diluted earnings per share1,2 (pence) 21.2 26.6 Return on tangible equity1,2 14.2% 18.5%Net asset value per share (pence) 184.7 192.2 Tangible net asset value per share (pence) 147.4 153.8 Dividend per share
– interim (pence) 4.9 4.6 – final (pence) 9.7 9.2 – regular (pence) 14.6 13.8 – first special (pence) 10.0 27.5– second special (pence) – 8.8 – total (pence) 24.6 50.1
Notes:
1. See glossary on pages 189 and 190
2. See appendix A – Alternative performance measures on page 191
3. See appendix B – Proforma results on page 194 which presents the Group’s results excluding the recent impact of the Ogden discount rate reduction
4. Estimates based on the Group’s Solvency II partial internal model for 31 December 2016
www.directlinegroup.com 39
Performance Operating profit – Ongoing operations
2016
£m 2015
£m
Underwriting profit 70.1 175.2Investment return 168.1 194.7Instalment and other operating income 165.3 150.8Operating profit 403.5 520.7
In 2016, operating profit from Ongoing operations was £403.5 million (pre-Ogden: £578.6 million; 2015: £520.7 million) primarily due to a lower underwriting result as the Group has reflected an increase in its claims reserves for the recent reduction in the Ogden discount rate, and lower investment returns. The underwriting profit was £70.1 million, (2015: £175.2 million), principally due to the recent reduction in the Ogden discount rate, which led to lower prior-year reserve releases from Ongoing operations of £266.7 million (2015: £378.9 million). This was partially offset by lower claims costs from major weather events. Expenses include higher non-cash impairments than in previous years of £39.3 million and the Flood Re levy of £24.1 million. Investment return was lower primarily due to a reduction in unrealised property gains.
In-force policies – Ongoing operations (thousands) At 31 December 2016 2015
Own brands 3,642 3,459Partnerships 231 248Motor total 3,873 3,707
Own brands 1,759 1,719Partnerships 1,619 1,699Home total 3,378 3,418
Of which Nationwide and Sainsbury’s 719 719
Rescue 3,646 3,932Other personal lines 4,234 4,356Rescue and other personal lines 7,880 8,288Direct Line for Business 433 407NIG and other 242 248Commercial 675 655Total ongoing 15,806 16,068
Total in-force policies for Ongoing operations during 2016 reduced by 1.6% to 15.8 million (31 December 2015: 16.1 million). The fall primarily related to partner volumes in Home and Rescue and other personal lines. Motor in-force policies grew by 4.5% and Commercial by 3.1% across the period. Own brands in-force policies during 2016 grew by 4.3% including a 5.3% increase in Motor.
Gross written premium – Ongoing operations
2016
£m 2015
£m
Own brands 1,428.7 1,307.5Partnerships 110.4 99.2Motor total 1,539.1 1,406.7Own brands 404.7 408.4Partnerships 429.7 457.9
Home total 834.4 866.3Of which Nationwide and Sainsbury’s 215.5 221.2
Rescue 163.1 163.3Other personal lines 237.7 230.8Rescue and other personal lines 400.8 394.1Direct Line for Business 109.6 101.8NIG and other 390.2 383.5Commercial 499.8 485.3Total Ongoing 3,274.1 3,152.4
Gross written premium of £3,274.1 million increased by 3.9% compared with 2015 (£3,152.4 million) primarily relating to an increase in Motor own brands.
Underwriting profit – Ongoing operations 2016 2015
Underwriting profit (£ million) 70.1 175.2Loss ratio 60.9% 59.5%Commission ratio 11.5% 10.9%Expense ratio 25.3% 23.6%COR 97.7% 94.0%
The COR for Ongoing operations of 97.7% (2015: 94.0%), was 3.7 percentage points higher year on year primarily as a result of the recent Ogden discount rate reduction, partially offset by lower weather losses. The loss ratio was 60.9% (pre-Ogden: 55.0%; 2015: 59.5%) which was higher by 1.4 percentage points compared to 2015. The commission ratio increased by 0.6 percentage points and the expense ratio by 1.7 percentage points. Excluding the impact of the recent reduction in the Ogden discount rate, the COR for Ongoing operations improved to 91.8% in 2016.
At the start of the year, the Group set 2016 COR guidance for Ongoing operations in the range of 93% to 95%. This assumed a normal level of claims from major weather events. On this basis and excluding the recent Ogden discount rate reduction, the Group achieved a normalised COR of 93.5% which is towards the lower end of the Group’s target range. This also includes a non-cash intangible asset impairment charge of £39.3 million.
Within the loss ratio, the current-year attritional loss ratio improved by 0.2 percentage points to 69.2% (pre-Ogden: 68.8%; 2015: 69.4%) with improvements in Motor and Commercial offset by a deterioration in Home and Rescue and other personal lines.
Notes:
1. Home claims from major weather events, including inland and coastal flooding, and storms
2. See definition in glossary on pages 189 and 190
www.directlinegroup.com 39
Strategic reportG
overnanceFinancial statem
ents

Finance review continued
40 Direct Line Group Annual Report & Accounts 2016
The increase in the commission ratio of 0.6 percentage points to 11.5% primarily reflected higher payments to partners, particularly in Home, following lower claims costs as a result of prior-year reserve releases and major weather events.
The Group’s expense ratio increased to 25.3%, predominantly due to higher intangible asset impairments of £39.3 million and the Flood Re levy of £24.1 million. Excluding the impairment charge and Flood Re levy, the expense ratio would have been 23.2%.
Loss ratio analysis by division – Ongoing
Notes Motor HomeRescue and other
personal lines Commercial1 Total
Ongoing
For the year ended 31 December 2016 Net insurance claims 4 1,001.7 332.0 243.0 250.5 1,827.2Prior-year reserve releases 32 123.5 75.9 17.5 49.8 266.7Major weather events n/a (18.0) n/a n/a (18.0)Attritional net insurance claims 1,125.2 389.9 260.5 300.3 2,075.9Net earned premium 4 1,337.1 816.3 394.4 452.8 3,000.6Loss ratio current-year attritional 84.1% 47.8% 66.0% 66.3% 69.2%Loss ratio – prior-year reserve releases (9.2%) (9.3%) (4.4%) (11.0%) (8.9%)Loss ratio – major weather events – Home2 n/a 2.2% n/a n/a 0.6%Loss ratio – reported 4 74.9% 40.7% 61.6% 55.3% 60.9%Commission ratio 4 3.2% 22.6% 7.2% 19.5% 11.5%Expense ratio 4 28.2% 21.7% 24.5% 23.9% 25.3%Combined operating ratio 4 106.3% 85.0% 93.3% 98.7% 97.7%For the year ended 31 December 2015 Net insurance claims 4 794.8 435.1 231.6 275.8 1,737.3Prior-year reserve releases 32 266.8 41.9 13.6 56.6 378.9Major weather events n/a (90.0) n/a n/a (90.0)Attritional net insurance claims 1,061.6 387.0 245.2 332.4 2,026.2Net earned premium 4 1,249.3 845.0 386.4 440.1 2,920.8Loss ratio current-year attritional 85.0% 45.8% 63.5% 75.5% 69.4%Loss ratio – prior-year reserve releases (21.4%) (5.0%) (3.6%) (12.8%) (13.0%)Loss ratio – major weather events – Home2 n/a 10.7% n/a n/a 3.1%Loss ratio – reported 4 63.6% 51.5% 59.9% 62.7% 59.5%Commission ratio 4 2.6% 20.9% 6.4% 19.6% 10.9%Expense ratio 4 26.2% 19.8% 24.9% 22.2% 23.6%Combined operating ratio 4 92.4% 92.2% 91.2% 104.5% 94.0%
The movement in the current-year attritional loss ratio is a key indicator of underlying accident year performance as it excludes prior-year reserve movements and claims from major weather events. The Group’s current-year attritional loss ratio improved by 0.2 percentage points to 69.2% in 2016 (2015: 69.4%) with improvements in Motor and Commercial partially offset by a deterioration in Home and Rescue and other personal lines. Excluding the impact of the recent reduction in the Ogden discount rate, the current-year attritional loss ratio for Ongoing operations improved to 68.8% in 2016. By division, the COR improved in Home and Commercial, mainly as a result of benign weather compared to 2015. The COR deteriorated in Motor due to the recent Ogden discount rate change and an intangible asset impairment charge of £39.3 million. Prior-year reserve releases for Motor were significantly lower at £123.5 million (2015: £266.8 million), including a £139.8 million charge in respect of the recent Ogden discount rate change. Home prior-year reserve releases increased to £75.9 million (2015: £41.9 million) due to some favourable development from the storms in late 2015.
Total costs
Notes 2016
£m 2015
£m
Staff costs 406.5 407.5Other operating expenses 277.8 261.3Marketing 112.6 117.8Amortisation and impairment of other intangible assets
96.7 67.4
Depreciation 30.1 30.7Total costs 923.7 884.7Operating expenses 11 759.3 689.1Claims handling expenses 9 164.4 195.6Total costs 923.7 884.7
Total costs for Ongoing operations were £923.7 million for 2016, after non-cash intangible asset impairments of £39.3 million and the Flood Re levy of £24.1 million (2015: £884.7 million). The non-cash impairment charge is in respect of intangible assets previously capitalised on the balance sheet and primarily relates to ongoing IT projects which aim to enhance the Group’s digital offering, customer experience and operational efficiency. Notes:
1. Commercial attritional loss ratio includes weather costs
2. Home claims for major weather events, including inland and coastal flooding and storms
Direct Line Group Annual Report & Accounts 201640

Finance review continued
40 Direct Line Group Annual Report & Accounts 2016
The increase in the commission ratio of 0.6 percentage points to 11.5% primarily reflected higher payments to partners, particularly in Home, following lower claims costs as a result of prior-year reserve releases and major weather events.
The Group’s expense ratio increased to 25.3%, predominantly due to higher intangible asset impairments of £39.3 million and the Flood Re levy of £24.1 million. Excluding the impairment charge and Flood Re levy, the expense ratio would have been 23.2%.
Loss ratio analysis by division – Ongoing
Notes Motor HomeRescue and other
personal lines Commercial1 Total
Ongoing
For the year ended 31 December 2016 Net insurance claims 4 1,001.7 332.0 243.0 250.5 1,827.2Prior-year reserve releases 32 123.5 75.9 17.5 49.8 266.7Major weather events n/a (18.0) n/a n/a (18.0)Attritional net insurance claims 1,125.2 389.9 260.5 300.3 2,075.9Net earned premium 4 1,337.1 816.3 394.4 452.8 3,000.6Loss ratio current-year attritional 84.1% 47.8% 66.0% 66.3% 69.2%Loss ratio – prior-year reserve releases (9.2%) (9.3%) (4.4%) (11.0%) (8.9%)Loss ratio – major weather events – Home2 n/a 2.2% n/a n/a 0.6%Loss ratio – reported 4 74.9% 40.7% 61.6% 55.3% 60.9%Commission ratio 4 3.2% 22.6% 7.2% 19.5% 11.5%Expense ratio 4 28.2% 21.7% 24.5% 23.9% 25.3%Combined operating ratio 4 106.3% 85.0% 93.3% 98.7% 97.7%For the year ended 31 December 2015 Net insurance claims 4 794.8 435.1 231.6 275.8 1,737.3Prior-year reserve releases 32 266.8 41.9 13.6 56.6 378.9Major weather events n/a (90.0) n/a n/a (90.0)Attritional net insurance claims 1,061.6 387.0 245.2 332.4 2,026.2Net earned premium 4 1,249.3 845.0 386.4 440.1 2,920.8Loss ratio current-year attritional 85.0% 45.8% 63.5% 75.5% 69.4%Loss ratio – prior-year reserve releases (21.4%) (5.0%) (3.6%) (12.8%) (13.0%)Loss ratio – major weather events – Home2 n/a 10.7% n/a n/a 3.1%Loss ratio – reported 4 63.6% 51.5% 59.9% 62.7% 59.5%Commission ratio 4 2.6% 20.9% 6.4% 19.6% 10.9%Expense ratio 4 26.2% 19.8% 24.9% 22.2% 23.6%Combined operating ratio 4 92.4% 92.2% 91.2% 104.5% 94.0%
The movement in the current-year attritional loss ratio is a key indicator of underlying accident year performance as it excludes prior-year reserve movements and claims from major weather events. The Group’s current-year attritional loss ratio improved by 0.2 percentage points to 69.2% in 2016 (2015: 69.4%) with improvements in Motor and Commercial partially offset by a deterioration in Home and Rescue and other personal lines. Excluding the impact of the recent reduction in the Ogden discount rate, the current-year attritional loss ratio for Ongoing operations improved to 68.8% in 2016. By division, the COR improved in Home and Commercial, mainly as a result of benign weather compared to 2015. The COR deteriorated in Motor due to the recent Ogden discount rate change and an intangible asset impairment charge of £39.3 million. Prior-year reserve releases for Motor were significantly lower at £123.5 million (2015: £266.8 million), including a £139.8 million charge in respect of the recent Ogden discount rate change. Home prior-year reserve releases increased to £75.9 million (2015: £41.9 million) due to some favourable development from the storms in late 2015.
Total costs
Notes 2016
£m 2015
£m
Staff costs 406.5 407.5Other operating expenses 277.8 261.3Marketing 112.6 117.8Amortisation and impairment of other intangible assets
96.7 67.4
Depreciation 30.1 30.7Total costs 923.7 884.7Operating expenses 11 759.3 689.1Claims handling expenses 9 164.4 195.6Total costs 923.7 884.7
Total costs for Ongoing operations were £923.7 million for 2016, after non-cash intangible asset impairments of £39.3 million and the Flood Re levy of £24.1 million (2015: £884.7 million). The non-cash impairment charge is in respect of intangible assets previously capitalised on the balance sheet and primarily relates to ongoing IT projects which aim to enhance the Group’s digital offering, customer experience and operational efficiency. Notes:
1. Commercial attritional loss ratio includes weather costs
2. Home claims for major weather events, including inland and coastal flooding and storms
www.directlinegroup.com 41
Consequently, the Group’s expense ratio increased to 25.3% (2015: 23.6%). Excluding the impairment charge and Flood Re levy the expense ratio would have been 23.2%. The reduction in claims handling expenses was largely due to lower staff costs and other operating costs being allocated to claims and a reduction in claims handling provision.
On 16 January 2017 the Financial Services Compensation Scheme announced that it would raise a supplementary levy of £63 million on general insurers to compensate policyholders of the Enterprise and Gable insurance companies. The Group’s share of the levy, approximately £5 million for 2017, will be charged to operating expenses in Q1 2017.
Instalment and other operating income – Ongoing operations
2016
£m 2015
£m
Instalment income 107.1 100.1Other operating income: Vehicle replacement referral income 14.1 12.5Revenue from vehicle recovery and repair services1 19.3 15.5Other income 24.8 22.7Other operating income 58.2 50.7Total Ongoing 165.3 150.8
Instalment and other operating income from Ongoing operations of £165.3 million increased 9.6% on the prior year (2015: £150.8 million). Instalment income increased by £7.0 million compared to 2015, primarily as a result of higher Motor volumes. Other operating income increased by £7.5 million in 2016 to £58.2 million (2015: £50.7 million).
Investment return – Ongoing operations
2016
£m 2015
£m
Investment income 164.5 165.6Net realised and unrealised gains 3.6 29.1Investment return – Ongoing 168.1 194.7
The total investment return for Ongoing operations decreased to £168.1 million compared to £194.7 million in 2015. The decrease is primarily as a result of lower net realised and unrealised gains. Investment income remained broadly stable, at £164.5 million compared with 2015, despite lower average assets under management (“AUM”) of £6,581.0 million (2015: £6,818.7 million) and a reduction of 25 basis points by the Bank of England in the UK base rate during the year. These downward factors were partially offset by portfolio actions.
Net realised and unrealised gains for Ongoing operations of £3.6 million were significantly lower than the comparative period (2015: £29.1 million) primarily due to lower unrealised property gains, which were £4.1 million for the year (2015: £24.2 million).
Investment yields 2016 2015
Investment income yield2 2.5% 2.4%Investment return2 2.6% 2.9%
The investment income yield in 2016 was 2.5%, an increase on the yield achieved in 2015. Actions to diversify the portfolio including investment in commercial real estate loans, subordinated financial debt and global credit, have helped offset yield pressure from low UK interest rates. The Group currently forecasts an investment income yield of 2.4% for 2017 on the basis of current market conditions given the continuing low interest rate environment.
Operating profit – Ongoing operations
2016
£m 2015
£m
Motor 149.1 338.0Home 166.7 109.9Rescue and other personal lines 45.9 52.0Commercial 41.8 20.8Total Ongoing 403.5 520.7
All divisions were profitable in 2016, with Home and Commercial reporting significant improvements in operating profit compared to 2015. This was partially offset by a decrease in Motor, due to the recent reduction in the Ogden discount rate and a higher level of intangible asset impairments, and in Rescue and other personal lines.
Reconciliation of operating profit
2016
£m 2015
£m
Operating profit – Ongoing operations 403.5 520.7Run-off 26.6 73.1Restructuring and other one-off costs (39.9) (48.7)Operating profit 390.2 545.1Finance costs (37.2) (37.6)Profit before tax 353.0 507.5Tax (74.2) (108.3)Profit from discontinued operations, net of tax – 181.2Profit after tax 278.8 580.4
Run-off The Run-off segment generated a profit of £26.6 million in 2016 (pre-Ogden: £68.8 million; 2015: £73.1 million). The reduction in the result followed lower prior-year reserve releases from large bodily injury claims in comparison to the previous year, primarily as a result of the recent reduction in the Ogden discount rate.
Notes:
1. Vehicle recovery includes post-accident and pay-on-use recovery. Repair services constitute the provision of non-insurance related repairs services
2. See glossary on pages 189 and 190
www.directlinegroup.com 41
Strategic reportG
overnanceFinancial statem
ents
Finance review continued
42 Direct Line Group Annual Report & Accounts 2016
Restructuring and other one-off costs Restructuring and other one-off costs for 2016 of £39.9 million (2015: £48.7 million) primarily reflected the costs associated with the exit of the Group’s Bristol property and relocating to a smaller site. Over the four-year period 2015 to 2018, the Group expects cumulative restructuring and other one-off costs to be substantially offset by the operating profit from the Run-off segment.
Finance costs Finance costs remained stable at £37.2 million (2015: £37.6 million).
Taxation The effective tax rate in 2016 was 21.0% (2015: 21.3%), which was higher than the standard UK corporation tax rate of 20.0% (2015: 20.25%), primarily due to disallowable expenses. Based on current information, the Group expects the effective tax rate to be broadly in line with the UK standard tax rate.
Discontinued operations On 29 May 2015, the Group completed the sale of its International division, which comprised its Italian and German operations, to Mapfre, S.A. Accordingly, this division is treated as discontinued operations. The gain on disposal of £167.1 million is included in profit from discontinued operations of £181.2 million in 2015. Operating profit for 2015 includes £29.9 million of realised net gains on divisional available-for-sale (“AFS”) investments reclassified through the income statement on disposal. Further details on discontinued operations are presented in note 5 to the consolidated financial statements, see page 152.
Profit for the year and return on tangible equity Profit for the year amounted to £278.8 million (pre-Ogden £452.6 million; 2015: £580.4 million), following the one-off gain on disposal of the Group’s International division in 2015 and lower underwriting profit as a result of the recent reduction in the Ogden discount rate, partially offset by an improvement in the underlying underwriting performance in 2016.
RoTE was 14.2% due to lower profit after tax as a result of the reduction in the Ogden discount rate (pre-Ogden: 20.2%; 2015: 18.5%).
The Group reiterates its ongoing target of achieving at least a 15% RoTE. Following a review of the approach to the Group’s Directors’ remuneration policy, the Remuneration Committee is proposing that the level of RoTE required for the March 2017 long-term incentive plan awards to vest be increased from the current range of 14.5% to 17.5% to a range of 15.0% to 18.0%. This will ensure that awards will only vest in full if significant value has been delivered to shareholders.
Earnings per share Basic earnings per share was 20.4 pence (2015: 27.9 pence) reflecting the decrease in profit after tax.
Adjusted diluted earnings per share1 from Ongoing operations were 21.2 pence (2015: 26.6 pence) reflecting the decrease in operating profit.
Dividends The Board is proposing a final dividend of 9.7 pence per share making a total regular dividend for 2016 of 14.6 pence per share. This represents 5.8% growth over the 2015 regular dividend and is in line with the Group’s aim to grow the regular dividend annually in real terms, see page 110 for the Group’s dividend policy. The final dividend will be paid on 18 May 2017 to shareholders on the register on 17 March 2017. The ex-dividend date will be 16 March 2017.
Cash flow Net cash generated from operating activities before investment of insurance assets totalled £35.0 million (2015: £42.1 million). This reflected a decrease in cash generated from operations to £117.1 million (2015: £149.3 million), offset by lower taxes paid.
The net cash used by investing activities of £125.6 million (2015: £190.8 million generated from investing activities) the movement primarily reflects the proceeds on sale of discontinued operations in 2015.
Dividends paid amounted to £450.6 million (2015: £666.0 million) resulting in net cash used by financing activities of £528.4 million (2015: £722.0 million).
Overall, cash and cash equivalents increased by £208.4 million (2015: £14.0 million increase) across the year to £1,110.8 million (31 December 2015: £902.4 million).
Net asset value
At 31 December 2016
£m 2015
£m
Net assets 2,521.5 2,630.0Goodwill and intangible assets (508.9) (524.8)Tangible net assets 2,012.6 2,105.2Closing number of shares 1,365.1 1,368.7Net asset value per share (pence) 184.7 192.2Tangible net asset value per share (pence) 147.4 153.8
The net asset value at 31 December 2016 was £2,521.5 million (31 December 2015: £2,630.0 million) with a tangible net asset value of £2,012.6 million (31 December 2015: £2,105.2 million). The decrease since the beginning of the year reflected the payment of dividends, offset by the profit in 2016 and an increase in AFS investment reserve.
Financial management Accessing sufficient funding as liabilities fall due is central to the Group’s long-term sustainability. The Group’s integrity and brand reputation for customers and other stakeholders relies on this sustainability. The Group’s key financial management risks are reserving for insurance liabilities, and market risk connected to the investment portfolio.
Reserving Financial management includes the central aspect of estimating claims reserves. Uncertainty is an inherent part of insurance, and requires judgement when assessing claims liabilities.
Note:
1. See glossary on page 189 and 190 and appendix A on page 191
Direct Line Group Annual Report & Accounts 201642

Finance review continued
42 Direct Line Group Annual Report & Accounts 2016
Restructuring and other one-off costs Restructuring and other one-off costs for 2016 of £39.9 million (2015: £48.7 million) primarily reflected the costs associated with the exit of the Group’s Bristol property and relocating to a smaller site. Over the four-year period 2015 to 2018, the Group expects cumulative restructuring and other one-off costs to be substantially offset by the operating profit from the Run-off segment.
Finance costs Finance costs remained stable at £37.2 million (2015: £37.6 million).
Taxation The effective tax rate in 2016 was 21.0% (2015: 21.3%), which was higher than the standard UK corporation tax rate of 20.0% (2015: 20.25%), primarily due to disallowable expenses. Based on current information, the Group expects the effective tax rate to be broadly in line with the UK standard tax rate.
Discontinued operations On 29 May 2015, the Group completed the sale of its International division, which comprised its Italian and German operations, to Mapfre, S.A. Accordingly, this division is treated as discontinued operations. The gain on disposal of £167.1 million is included in profit from discontinued operations of £181.2 million in 2015. Operating profit for 2015 includes £29.9 million of realised net gains on divisional available-for-sale (“AFS”) investments reclassified through the income statement on disposal. Further details on discontinued operations are presented in note 5 to the consolidated financial statements, see page 152.
Profit for the year and return on tangible equity Profit for the year amounted to £278.8 million (pre-Ogden £452.6 million; 2015: £580.4 million), following the one-off gain on disposal of the Group’s International division in 2015 and lower underwriting profit as a result of the recent reduction in the Ogden discount rate, partially offset by an improvement in the underlying underwriting performance in 2016.
RoTE was 14.2% due to lower profit after tax as a result of the reduction in the Ogden discount rate (pre-Ogden: 20.2%; 2015: 18.5%).
The Group reiterates its ongoing target of achieving at least a 15% RoTE. Following a review of the approach to the Group’s Directors’ remuneration policy, the Remuneration Committee is proposing that the level of RoTE required for the March 2017 long-term incentive plan awards to vest be increased from the current range of 14.5% to 17.5% to a range of 15.0% to 18.0%. This will ensure that awards will only vest in full if significant value has been delivered to shareholders.
Earnings per share Basic earnings per share was 20.4 pence (2015: 27.9 pence) reflecting the decrease in profit after tax.
Adjusted diluted earnings per share1 from Ongoing operations were 21.2 pence (2015: 26.6 pence) reflecting the decrease in operating profit.
Dividends The Board is proposing a final dividend of 9.7 pence per share making a total regular dividend for 2016 of 14.6 pence per share. This represents 5.8% growth over the 2015 regular dividend and is in line with the Group’s aim to grow the regular dividend annually in real terms, see page 110 for the Group’s dividend policy. The final dividend will be paid on 18 May 2017 to shareholders on the register on 17 March 2017. The ex-dividend date will be 16 March 2017.
Cash flow Net cash generated from operating activities before investment of insurance assets totalled £35.0 million (2015: £42.1 million). This reflected a decrease in cash generated from operations to £117.1 million (2015: £149.3 million), offset by lower taxes paid.
The net cash used by investing activities of £125.6 million (2015: £190.8 million generated from investing activities) the movement primarily reflects the proceeds on sale of discontinued operations in 2015.
Dividends paid amounted to £450.6 million (2015: £666.0 million) resulting in net cash used by financing activities of £528.4 million (2015: £722.0 million).
Overall, cash and cash equivalents increased by £208.4 million (2015: £14.0 million increase) across the year to £1,110.8 million (31 December 2015: £902.4 million).
Net asset value
At 31 December 2016
£m 2015
£m
Net assets 2,521.5 2,630.0Goodwill and intangible assets (508.9) (524.8)Tangible net assets 2,012.6 2,105.2Closing number of shares 1,365.1 1,368.7Net asset value per share (pence) 184.7 192.2Tangible net asset value per share (pence) 147.4 153.8
The net asset value at 31 December 2016 was £2,521.5 million (31 December 2015: £2,630.0 million) with a tangible net asset value of £2,012.6 million (31 December 2015: £2,105.2 million). The decrease since the beginning of the year reflected the payment of dividends, offset by the profit in 2016 and an increase in AFS investment reserve.
Financial management Accessing sufficient funding as liabilities fall due is central to the Group’s long-term sustainability. The Group’s integrity and brand reputation for customers and other stakeholders relies on this sustainability. The Group’s key financial management risks are reserving for insurance liabilities, and market risk connected to the investment portfolio.
Reserving Financial management includes the central aspect of estimating claims reserves. Uncertainty is an inherent part of insurance, and requires judgement when assessing claims liabilities.
Note:
1. See glossary on page 189 and 190 and appendix A on page 191
www.directlinegroup.com 43
The Group considers the class of business, the length of time to notify a claim, the validity of the claim against a policy, and the claim value. Claims reserves could settle at a range of outcomes, and settlement certainty increases over time. However, for bodily injury claims, the uncertainty is greater due to the length of time taken to settle these claims. Annuity payments for injured parties also increase this uncertainty.
The Group seeks to adopt a conservative approach to assessing liabilities, as evidenced by the favourable development of historical claims reserves. Reserves are based on management’s best estimate, which includes a prudent margin that exceeds the internal actuarial best estimate. This margin is made in reference to various actuarial scenario assessments and reserve distribution percentiles, and considers other short and long-term risks not reflected in the actuarial inputs, as well as management’s view on the risks and improvements in relation to the actuarial best estimate.
Following the Lord Chancellor’s announcement on 27 February 2017 of a reduction in the Ogden discount rate to minus 0.75%, the Group has assessed its liabilities in light of the reduction in the rate. The Ogden discount rate primarily affects the value of large bodily injury claims in the Motor, Commercial and Run-off divisions, and as a result also impacts reinsurance recoveries and the propensity for claims to settle as periodic payment orders (“PPO”). As a result, the Group has made provision within its claims reserves for a reduction in the Ogden discount rate to minus 0.75%. The impact of this on the income statement for the year ended 31 December 2016 is shown in Appendix B on page 194 and has reduced operating profit from Ongoing operations by £175.1 million and profit before tax by £217.3 million.
The Group’s prior-year reserves releases were £290.1 million (2015: £449.3 million) after £205.2 million of strengthening due to the recent reduction in the Ogden discount rate. Excluding the change in the Ogden discount rate, the releases have arisen as a result of good experience in large bodily injury claims and PPOs. Home prior-year reserve releases increased to £75.9 million (2015: £41.9 million) with the increase coming mainly from favourable development on the December 2015 weather events.
Prior to the recent reduction in the Ogden discount rate, the Group established claims reserves at an assumed Ogden discount rate of 1.5%, compared with the rate then in force of 2.5%. This differential resulted in lower current-year profits, with a small and diminishing prior-year reserve release in the Group’s reported profits as claims settled. The Group will now hold claims reserves at the new Ogden discount rate pending the outcome of the consultation and so the timing difference between current and prior-year profit recognition will no longer exist. The net impact of this change in approach on current-year profit is expected to be small.
Following the Group’s normal actuarial review process, the Group reduced its margin during 2016 due to improved claims experience, particularly in large bodily injury claims, not yet recognised in the actuarial best estimate. The Group continues to hold a significant margin above the actuarial best estimate and its overall reserving strength has been maintained following the recent reduction in the Ogden discount rate.
Looking forward, the Group expects to continue to set its initial management best estimate for future accident years conservatively. Over time, the proportion of the Group’s underwriting profit attributable to current year is expected to increase, including due to targeted improvements in the expense and commission ratio. Assuming current claims trends continue, the contribution from prior-year reserve releases is expected to remain significant, albeit it is expected to reduce over time.
Claims reserves net of reinsurance
At 31 December 2016
£m 2015
£m
Motor 2,084.2 2,125.9Home 298.1 387.7Rescue and other personal lines 72.8 79.3Commercial 607.0 627.3Total Ongoing 3,062.1 3,220.2Run-off 326.2 382.4Total Group 3,388.3 3,602.6
For details relating to the sensitivity for changes in the assumed Ogden discount rate and the discount rate used in relation to periodical payment orders see note 3.3.1 of the consolidated financial statements.
Reinsurance The objectives of the Group’s reinsurance strategy are to reduce the volatility of earnings, facilitate effective capital management, and transfer risk outside the Group’s risk appetite. This is achieved by transferring risk exposure through various reinsurance programmes:
Catastrophe reinsurance to protect against an accumulation of claims arising from a natural peril event. The retained deductible is at £150 million, and cover is purchased annually on 1 July, up to a modelled one-in-200 year loss event of £1,250 million (2015: £1,350 million).
Motor reinsurance to protect against a single or an accumulation of large claims which renews on 1 January. The retained deductible is at an indexed level of £1 million per claim, providing a substantial level of protection against large motor bodily injury claims.
Commercial property risk reinsurance to protect against large individual claims with a retained deductible of £4 million which renews annually on 1 October.
Taxation The Board recognises that the Group has an important responsibility to its stakeholders to manage its tax position effectively. The Board has delegated day-to-day management of taxes to the Chief Financial Officer. The Audit Committee provides oversight.
These arrangements are intended to ensure that the Group complies with applicable laws and regulations, and meets its obligations as a contributor of taxes and a collector of taxes on behalf of the tax authorities; and manages its tax affairs efficiently, claiming reliefs and other incentives, where appropriate.
www.directlinegroup.com 43
Strategic reportG
overnanceFinancial statem
ents

Finance review continued
44 Direct Line Group Annual Report & Accounts 2016
Investment portfolio The investment strategy is designed to deliver several objectives, which are summarised below:
To ensure there is sufficient liquidity available within the investment portfolio to meet stressed liquidity scenarios determined by the Risk function
To match PPO and non-PPO liabilities in an optimal manner
To deliver a suitable risk-adjusted investment return commensurate with the Group’s risk appetite
Asset and liability management The following table summarises the Group’s high level approach to asset and liability management.
Liabilities Assets Characteristics
More than 10 years, for example PPOs
Property and infrastructure debt
Inflation linked or floating
Short and medium term all other claims
Investment-grade credit, short-term high yield and subordinated financial debt
Key rate duration matched
Tier 2 sub-debt (swapped fixed to floating)
Commercial real estate loans and cash
Floating
Surplus tangible equity
Investment-grade credit, cash and government debt securities
Fixed or floating
Asset allocation and benchmarks The current strategic asset benchmarks for the Group are detailed in the following table:
At 31 December
Benchmark holding 2016
Actual holding 2016
Benchmark holding 2015
Actual holding 2015
Investment-grade credit
58.0% 59.1% 54.0% 59.5%
High yield 6.0% 6.2% 6.0% 4.8%Investment-grade private placements
4.0% 1.3% 4.0% 0.2%
Credit 68.0% 66.6% 64.0% 64.5%Securitised credit − − 5.0% 5.2%Sovereign 8.0% 5.2% 9.0% 6.5%Total debt securities 76.0% 71.8% 78.0% 76.2%Infrastructure debt 6.0% 5.1% 6.0% 4.8%Commercial real estate loans
3.0% 1.2% 3.0% −
Cash and cash equivalents
9.0% 16.9% 7.0% 13.9%
Investment property 6.0% 5.0% 6.0% 5.1%Total 100.0% 100.0% 100.0% 100.0%
At 31 December 2016, total investment holdings of £6,581.0 million were 3.5% lower than at 31 December 2015, reflecting dividends paid offset by operating cash flows. Total debt securities were £4,724.5 million (31 December 2015: £5,194.4 million), of which 6.1% were rated as ‘AAA’ and a further 63.8% were rated as ‘AA’ or ‘A’. The average duration at 31 December 2016 of total debt securities was 2.3 years (31 December 2015: 2.3 years).
At 31 December 2016, total unrealised gains, net of tax, on AFS investments were £92.1 million (31 December 2015: £5.4 million).
Decisions were taken to exit securitised credit during Q3 2016. In addition the Group sold two investment properties in 2016.
In 2016, the Group delivered a robust investment result against a background of increased financial market uncertainties and further yield compression for much of the year. Investment in three new mandates commenced, with two fully funded to benchmark holdings (subordinated financial debt and global credit). The commercial real estate loans mandate is expected to be fully funded to its benchmark holding by the end of 2017.
Investment risk is, in part, mitigated by the following characteristics of the investment portfolio:
All holdings within the short duration US Dollar high-yield portfolio have a credit rating of BB or B. The Group’s strategy does not generally permit any debt securities to be held below B–.
The infrastructure debt portfolio is made up of UK assets only, which are purchased via the secondary market post the construction phase of the project concerned. The portfolio is weighted heavily towards social infrastructure with 89% of the year-end portfolio invested in projects across this sector (36% in healthcare, 48% in education and 5% in other).
The investment property portfolio consists presently of 24 UK-based properties. The Group’s strategy does not permit any overseas holdings. The portfolio is predominantly based in the South East and invested mainly in the prime (rather than secondary) sector of the market.
Derivatives are permitted only for risk mitigation and efficient portfolio management within the investment portfolio. Derivatives used include interest rate swaps, for example to hedge exposure to US Dollar interest rate movements, and forward currency contracts to hedge assets denominated in foreign currency back to Sterling. Separately, interest rate swaps have also been used to change the interest rate liability on the Group’s debt issuance to a floating rate basis.
Direct Line Group Annual Report & Accounts 201644

Finance review continued
44 Direct Line Group Annual Report & Accounts 2016
Investment portfolio The investment strategy is designed to deliver several objectives, which are summarised below:
To ensure there is sufficient liquidity available within the investment portfolio to meet stressed liquidity scenarios determined by the Risk function
To match PPO and non-PPO liabilities in an optimal manner
To deliver a suitable risk-adjusted investment return commensurate with the Group’s risk appetite
Asset and liability management The following table summarises the Group’s high level approach to asset and liability management.
Liabilities Assets Characteristics
More than 10 years, for example PPOs
Property and infrastructure debt
Inflation linked or floating
Short and medium term all other claims
Investment-grade credit, short-term high yield and subordinated financial debt
Key rate duration matched
Tier 2 sub-debt (swapped fixed to floating)
Commercial real estate loans and cash
Floating
Surplus tangible equity
Investment-grade credit, cash and government debt securities
Fixed or floating
Asset allocation and benchmarks The current strategic asset benchmarks for the Group are detailed in the following table:
At 31 December
Benchmark holding 2016
Actual holding 2016
Benchmark holding 2015
Actual holding 2015
Investment-grade credit
58.0% 59.1% 54.0% 59.5%
High yield 6.0% 6.2% 6.0% 4.8%Investment-grade private placements
4.0% 1.3% 4.0% 0.2%
Credit 68.0% 66.6% 64.0% 64.5%Securitised credit − − 5.0% 5.2%Sovereign 8.0% 5.2% 9.0% 6.5%Total debt securities 76.0% 71.8% 78.0% 76.2%Infrastructure debt 6.0% 5.1% 6.0% 4.8%Commercial real estate loans
3.0% 1.2% 3.0% −
Cash and cash equivalents
9.0% 16.9% 7.0% 13.9%
Investment property 6.0% 5.0% 6.0% 5.1%Total 100.0% 100.0% 100.0% 100.0%
At 31 December 2016, total investment holdings of £6,581.0 million were 3.5% lower than at 31 December 2015, reflecting dividends paid offset by operating cash flows. Total debt securities were £4,724.5 million (31 December 2015: £5,194.4 million), of which 6.1% were rated as ‘AAA’ and a further 63.8% were rated as ‘AA’ or ‘A’. The average duration at 31 December 2016 of total debt securities was 2.3 years (31 December 2015: 2.3 years).
At 31 December 2016, total unrealised gains, net of tax, on AFS investments were £92.1 million (31 December 2015: £5.4 million).
Decisions were taken to exit securitised credit during Q3 2016. In addition the Group sold two investment properties in 2016.
In 2016, the Group delivered a robust investment result against a background of increased financial market uncertainties and further yield compression for much of the year. Investment in three new mandates commenced, with two fully funded to benchmark holdings (subordinated financial debt and global credit). The commercial real estate loans mandate is expected to be fully funded to its benchmark holding by the end of 2017.
Investment risk is, in part, mitigated by the following characteristics of the investment portfolio:
All holdings within the short duration US Dollar high-yield portfolio have a credit rating of BB or B. The Group’s strategy does not generally permit any debt securities to be held below B–.
The infrastructure debt portfolio is made up of UK assets only, which are purchased via the secondary market post the construction phase of the project concerned. The portfolio is weighted heavily towards social infrastructure with 89% of the year-end portfolio invested in projects across this sector (36% in healthcare, 48% in education and 5% in other).
The investment property portfolio consists presently of 24 UK-based properties. The Group’s strategy does not permit any overseas holdings. The portfolio is predominantly based in the South East and invested mainly in the prime (rather than secondary) sector of the market.
Derivatives are permitted only for risk mitigation and efficient portfolio management within the investment portfolio. Derivatives used include interest rate swaps, for example to hedge exposure to US Dollar interest rate movements, and forward currency contracts to hedge assets denominated in foreign currency back to Sterling. Separately, interest rate swaps have also been used to change the interest rate liability on the Group’s debt issuance to a floating rate basis.
www.directlinegroup.com 45
Investment holdings and yields – total Group 2016 2015
£m Allocation Income Yield Allocation Income1 Yield
Investment-grade credit2 3,888.3 104.9 2.6% 4,060.0 108.7 2.7%High yield 409.9 17.8 4.8% 327.4 12.6 4.0%Private placements 85.1 1.4 2.9% 13.5 0.1 2.0%Credit 4,383.3 124.1 2.8% 4,400.9 121.4 2.8%Securitised credit2,3 – 3.5 2.0% 350.8 6.0 1.6%Sovereign2 341.2 8.9 2.3% 442.7 12.7 1.8%Total debt securities 4,724.5 136.5 2.8% 5,194.4 140.1 2.6%Infrastructure 337.0 7.8 2.4% 329.6 4.4 2.2%Commercial real estate loans 79.7 1.0 2.6% – – –Cash4 1,110.8 4.2 0.4% 947.3 6.7 0.8%Investment property 329.0 18.4 5.1% 347.4 17.9 5.4%Total Group 6,581.0 167.9 2.5% 6,818.7 169.1 2.4%
Capital management Capital management policy The Group seeks to manage its capital efficiently, maintaining an appropriate level of capitalisation and solvency, while aiming to grow its regular dividend annually in real terms.
As has been its practice, where the Board believes the Group has capital which is expected to be surplus to the Group’s requirements for a prolonged period, it would intend to return the excess to shareholders.
In future, the Board has decided that in the normal course of events it will consider whether or not it is appropriate to pay a special dividend only once a year, alongside the full year results. In doing this, the Group will harmonise its major capital management decisions with its planning process and its full-year earnings.
Solvency II Solvency II is the new solvency framework implemented on 1 January 2016 as the capital adequacy regime for the European insurance industry. It established a set of EU-wide capital requirements and risk management standards with the aim of increasing protection for policyholders. The Group is regulated by the PRA on both a Group basis and, for the Group’s principal underwriter, U K Insurance Limited (“UKI”), on a solo basis.
At 1 January 2016, the Group (including UKI) assessed its capital requirements using the standard formula. UKI had its IECM approved for use by the PRA in June 2016, and this now forms part of a Group-wide PIM, which has been in use from the same date.
The Board has considered the risk appetite range of the Group under its Solvency II PIM and considers that the appropriate range, which should enable it to meet its operational, regulatory and rating agency requirements, is 140% to 180% of its SCR.
In its results, the Group has estimated its Solvency II own funds, SCR and Solvency II capital coverage ratio as at 31 December 2016. The Group will formally submit its final Solvency II Solvency Financial Condition Report (“SFCR”) in May 2017 to the PRA, and expects to continue to update the assumptions and implement model changes until then. Therefore, the final estimates may differ from those presented in this report.
Solvency ratio sensitivity analysis The following table shows the Group’s solvency ratio sensitivities estimated based on assessed impact of scenarios as at 31 December 2016.
Scenario Impact on
solvency ratio
Motor premium rate reduction of 10% (14 pts)One-off catastrophe loss equivalent to the 1990 storm (9 pts)One-off catastrophe loss based on extensive flooding of the River Thames (9 pts)100bps increase in credit spreads (8 pts)100bps decrease in interest rates (7 pts)
Notes:
1. Investment income for the year ended 31 December 2015 relates to continuing operations
2. Asset allocation at 31 December 2016 includes investment portfolio derivatives, which have been netted and have a mark-to-market liability value of £5.8 million included in investment grade credit (31 December 2015: mark-to-market liability value of £45.7 million of which £40.4 million included in investment grade credit and £5.3 million in securitised credit). This excludes derivatives that have been used to hedge interest on subordinated debt and operational cash flows
3. Securitised credit was disposed of during 2016
4. Net of bank overdrafts, includes cash at bank and in hand and money market funds with no notice period for withdrawal (31 December 2015: also included money market funds with maturities greater than three months
www.directlinegroup.com 45
Strategic reportG
overnanceFinancial statem
ents

Finance review continued
46 Direct Line Group Annual Report & Accounts 2016
Capital position At 31 December 2016, the Group held a Solvency II capital surplus of approximately £0.92 billion above its regulatory capital requirements. This was equivalent to an estimated capital coverage ratio of 165%, post-dividend. Excluding the impact of the recent reduction in the Ogden discount rate to minus 0.75%, the capital coverage ratio would have been approximately 189% post-dividend. Other than the effects of the Ogden discount rate change, which increased the SCR by £0.08 billion, the SCR remained largely stable in the second half of 2016, since the Group was approved to use its PIM. In the first half of 2016, the Group’s SCR fell from £1.68 billion to £1.37 billion, largely as a result of the transition from the standard formula to the PIM. The SCR calculation fully recognises the new Ogden discount rate of minus 0.75%, but does not take into account any implications of uncertainty around the future rate. The Group’s capital coverage is as follows:
At 31 December
2016 30 June
2016
Solvency capital requirement (£ billion) 1.42 1.37Capital surplus above solvency capital requirement (£ billion) 0.92 1.14Capital coverage ratio post- dividend 165% 184%
The following table splits the Group’s own funds by tier on a Solvency II basis.
At
31 December 2016
£bn
30 June 2016
£bn
Tier 1 capital before foreseeable dividends 1.81 2.04Foreseeable dividends (0.13) (0.20)Tier 1 capital 1.68 1.84Tier 2 capital 0.62 0.60Tier 3 capital 0.04 0.07Own funds 2.34 2.51
Tier 1 capital after foreseeable dividends represents approximately 72% of own funds and 118% of the Group’s estimated SCR. Tier 2 capital relates solely to the Group’s subordinated debt issued in 2012, which has a market value of £0.62 billion. The Group also recognises a deferred tax asset of £0.04 billion as Tier 3 capital. Therefore, the Group’s Tier 2 and 3 capital is within the limits established by Solvency II of up to 50% of the SCR in Tier 2 and 3 combined, and 15% for Tier 3 alone.
Reconciliation of IFRS shareholders’ equity to Solvency II own funds
At
31 December 2016
£bn
30 June2016
£bn
Shareholders’ equity 2.52 2.67Goodwill and intangible assets (0.51) (0.54)Change in valuation of technical provisions (0.04) 0.11Other asset and liability adjustments (0.16) (0.20)Foreseeable dividends (0.13) (0.20)Tier 1 capital 1.68 1.84Tier 2 capital 0.62 0.60Tier 3 capital 0.04 0.07Own funds 2.34 2.51
Movement in own funds
2016 £bn
Own funds as at 1 January 2016 2.47Change in risk margin from Group standard formula basis to Group PIM at 1 January 2016 (0.09)Ogden discount rate impact (0.19)Mark to market movement 0.12Capital generation 0.49Capital expenditure (0.12)Capital distribution (0.34)Own funds as at 31 December 2016 2.34
During 2016, the Group’s own funds reduced from £2.47 billion to £2.34 billion. The Group generated £0.49 billion of Solvency II capital, excluding the effects of the Ogden discount rate change, offset by £0.12 billion of capital expenditure and capital distribution of £0.34 billion, including the 2016 interim and final ordinary dividends and special interim dividends. Mark to market gains, as lower interest rates and credit spread tightening increased the value of the bond portfolio, were offset by a change in the basis of the risk margin calculation following approval of the Group’s PIM.
Leverage
At 31 December 2016
£m 2015
£m
Shareholders’ equity 2,521.5 2,630.0Financial debt subordinated guaranteed dated notes 539.6 521.1Total capital employed 3,061.1 3,151.1Financial-leverage ratio1 17.6% 16.5%
The Group’s leverage continues to be conservative. During 2016, the leverage increased from 16.5% to 17.6% due primarily to the increase in value of the subordinated guaranteed dated notes and a reduction in shareholders’ equity, following the reduction in the Ogden discount rate.
Note:
1. Total financial debt as a percentage of total capital employed
Direct Line Group Annual Report & Accounts 201646

www.directlinegroup.com 47
Credit ratings Standard & Poor’s and Moody’s Investors Service provide insurance financial-strength ratings for UKI. UKI is currently rated ‘A’ (strong) with a stable outlook by Standard & Poor’s, and ‘A2’ (good) with a stable outlook by Moody’s.
Outlook The Group’s markets were highly competitive and faced a number of significant government policy and regulatory changes during 2016 and in early 2017. In the face of these challenges, the Group demonstrated both its resilience and its appeal to customers by growing its own brands policies while maintaining overall margins, which has continued into early 2017. The Group does not expect any material residual impact on 2017 profit as a result of adopting the reduction in the Ogden discount rate to minus 0.75%.
The Group aims to reduce its expense ratio during 2017, absorbing its investment in future capability. The Group also aims to deliver a lower commission ratio during 2017, normalised for major weather events: this will in part reflect changes in its distribution channel mix. Over the longer term, the Group aims to achieve further reductions in both the expense and commission ratios.
For 2017, the Group targets achieving a COR in the range of 93% to 95% for Ongoing operations, assuming a normal annual level of claims from major weather events and no further change to the Ogden discount rate. In addition, the Group reiterates its ongoing target of achieving at least a 15% RoTE.
0BStatement of the Directors in respect of the Strategic report The Board reviewed and approved the Strategic report on pages 1 to 47 on 6 March 2017.
By order of the Board
Paul Geddes John Reizenstein Chief Executive Officer Chief Financial Officer 6 March 2017 6 March 2017
www.directlinegroup.com 47
Strategic reportG
overnanceFinancial statem
ents

Chairman’s introduction
48 Direct Line Group Annual Report & Accounts 2016
The Board recognises the importance of succession planning and understands the need to have leaders who reflect the Group’s
culture and values.
Dear shareholders and other stakeholders
Our commitment to good corporate governance On behalf of the Board, I am pleased to present the Corporate Governance report for the year ended 31 December 2016. A major focus of the Board and mine as Chairman continues to be on maintaining high standards of corporate governance, which we seek to achieve through the Group’s robust governance arrangements.
The Corporate Governance report sets out the Direct Line Group framework, which we believe enables effective decision making and management of the risks in the markets in which we operate. Matters Reserved for the Board and the role of the Board’s Committees are core elements of this framework. The Corporate Governance and Committee reports highlight the areas of focus, challenge and supervision for the Board and its Committees during 2016.
Succession planning and Board changes Succession planning has been an area of focus for the Board in 2016. The Board recognises the importance of succession planning and understands the need to have leaders who reflect the Group’s culture and values. Gender diversity is also
considered an important matter by the Board and its Nomination Committee. The Board has female representation of 30% and the Board remains committed to improving this position when the appropriate opportunity arises.
During 2016, the Nomination Committee reviewed the Board’s expertise and experience and engaged an external consultant in the search for new candidates. The Board’s Nomination Committee oversaw the selection and appointment of Richard Ward as Senior Independent Director. Following Priscilla Vacassin’s retirement from the Board in March 2016, a number of changes were made to the chairmanship and membership of the Board’s Committees. I am pleased to report that Danuta Gray was appointed as a Non-Executive Director and Mike Holliday-Williams was appointed as an Executive Director on 1 February 2017. Having previously held executive and non-executive roles in a number of sectors, including financial services, Danuta brings vast experience to the Board whilst Mike’s appointment reflects the importance of the Personal Lines business to the Group. The Nomination Committee report on page 76 contains further information on the Board’s approach to succession planning and Board and Committee changes.
Effectiveness and Evaluation As Chairman, my objective is to develop and lead an effective Board for the benefit of our shareholders. In 2014 and 2015, we evaluated the performance of the Board and its
Our Code of Business Conduct
Business practices We shall engage in honest, professional and ethical conduct and maintain effective procedures to prevent confidential information being misused.
Dealing with customers We shall treat customers fairly, openly and honestly, and operate an effective complaints process to address any perceived departure from these standards.
Dealing with shareholders and other stakeholders We shall seek to maximise shareholder value over time, recognising that wealth generated also benefits customers, employees and the communities where we operate.
Dealing with employees We shall maintain a working environment that attracts, motivates and retains employees, and is intolerant of any type of discrimination, harassment or victimisation.
Corporate Governance
Direct Line Group Annual Report & Accounts 201648
Mike BiggsChairman

www.directlinegroup.com 49
Committees internally. During 2016, our Board evaluation was externally facilitated by Professor Rob Goffee of London Business School. The review focused on the Board’s role and composition; the relevance, flow and quality of information, and the Non-Executive Directors’ balance of knowledge, skills and expertise. The findings have equipped us to continue to improve the leadership of the Group. You can find further details on page 59.
Executive Remuneration The debate in the UK over Executive remuneration remains a valid topic for discussion and continuous evaluation. The Group’s remuneration policy remains aligned with our strategic priorities and the interests of our shareholders. As required by legislation, the policy will be put forward for adoption by shareholders at our forthcoming AGM. Details of the consultation process undertaken by the Remuneration Committee can be reviewed on page 80 and the revised remuneration policy proposed is detailed on pages 100 to 109.
UK Corporate Governance Code The Board is committed to the principles of the UK Corporate Governance Code issued by the Financial Reporting Council (the “Code”). I am pleased to report that we have complied with all of the principles of the 2014 edition of the Code which applied to the financial year under review. You can find further explanation and details on pages 53 to 63.
Culture and values The Board is responsible for securing the long-term success of the Group. The Board aims to deliver this success by creating an open culture that encourages the Group to make decisions that are best for our stakeholders. I believe that the values and the Code of Business Conduct set by the Board are central to the Group’s culture. Our Code of Business Conduct governs the way we treat our stakeholders, and our values determine our behaviours. Together, these elements reflect the way we do business with the objectives of delivering long-term sustainable shareholder value and of ensuring our Group’s long-term success.
Our shareholders Communication with shareholders is extremely important to us. By maintaining dialogue with you, we aim to ensure that your concerns are met and our objectives are understood. I would like to thank you for your support and look forward to discussing the Group’s progress with you at our forthcoming AGM on 11 May 2017.
Yours sincerely
Michael N Biggs Chairman
Our values
Do the right thing For our people, our customers, our shareholders and our wider stakeholders; make decisions based on what is right, not what is easy; demonstrate personal and professional integrity; do what’s right for the long-term sustainability of our business.
Aim higher Strive to be the best in every area of the business; be ambitious, courageous and innovative; relentlessly challenge and improve; seek and embrace change; learn from our mistakes; persevere, always deliver our promises and don’t settle for second best.
Work togetherCollaborate across all levels and functions; leverage the skills, knowledge and experience, irrespective of hierarchy, to deliver the best possible results; develop relationships based on trusting each other, partnerships and win-wins; recognise and celebrate success.
Take ownership Treat it like it’s OUR business; take the initiative, if you can see a better way, go and make a difference; take decisions, be accountable for your actions in whatever role you perform; take responsibility for your personal development and performance.
Say it like it is Be real, authentic and true to yourself; have adult-to-adult conversations with all audiences; listen, seek to understand and respect diversity of views; be open, call out issues we see; share information and keep things as simple as possible.
Bring all of yourself to work Be the best you can be, the real and whole you; celebrate our diversity of skills, experiences and personalities; be a role model to others, demonstrate a ‘can do’ spirit, have fun and make this a great place to be; be excited about our Company and our future; believe in yourself, feel confident and empowered.
Dealing with suppliers of goods and services and business partnerships We shall maintain the highest possible standards of integrity in business relationships with suppliers and partners by treating them honestly and with respect, and avoiding compromising offers of gifts and hospitality.
Dealing with communities and the environment We shall contribute to the social and economic well-being of those communities where we are an employer, and encourage employees to participate in projects and initiatives to strengthen those communities.
Dealing with competitors We will compete fairly and honestly and in accordance with all applicable competition laws.
Dealing with regulators We shall maintain a constructive and open relationship with our regulators to foster mutual trust, respect and understanding, and will not offer anything to officials in return for favourable treatment.
www.directlinegroup.com 49
Strategic reportG
overnanceFinancial statem
ents

Board of Directors
50 Direct Line Group Annual Report & Accounts 2016
Key for Committee membership:
Audit Committee
Board Risk Committee
CSR Committee
Investment Committee
Nomination Committee
Remuneration Committee
Mike Biggs, Chairman of the Board (appointed April 2012)
Biography Mike is also Chair of the Nomination Committee. He has over 40 years’ experience of the UK and international financial services sector. He is a respected figure in the insurance industry and well regarded by City investors.
Mike was previously Chairman of Resolution, then a FTSE 100 UK life assurance business, and has acted as Chief Executive Officer and Group Finance Director of Resolution plc. He was previously Group Finance Director of Aviva plc. He is an Associate of the Institute of Chartered Accountants in England and Wales.
External appointments None.
Paul Geddes, Chief Executive Officer (appointed August 2009)
Biography Paul is Chief Executive Officer. He led one of the UK’s largest retail banking businesses during a challenging period, improving its customer and financial performance against peers. In 2009, this experience singled him out as a Chief Executive who could turn around Direct Line Group and lead its divestment from RBS Group.
After joining RBS Group in 2004 as Managing Director responsible for products and marketing, he became the Chief Executive Officer of RBS Group’s mainland UK retail banking business. Before joining RBS Group, Paul held various senior multi-channel retailing roles in the GUS and Kingfisher groups. Paul started his career in marketing, with UK and European roles at Procter & Gamble.
External appointments Paul is the Deputy Chairman of the Association of British Insurers Board and a Non-Executive Director of Channel Four Television Corporation.
Danuta Gray, Independent NED (appointed February 2017)
Biography Danuta was Chairman of Telefónica O2 in Ireland until December 2012, having previously been its Chief Executive from 2001 to 2010. During her nine year tenure as Chief Executive, she increased the customer base from just under 1 million to over 1.7 million. Prior to Telefónica O2, Danuta held various senior positions within BT Group from 1984 to 2001.
External appointments Danuta is interim Chairman of Aldermore Group plc, a Non-Executive Director and Chairman of the Remuneration Committee of PageGroup plc, a Non-Executive Director and Chairman of the Remuneration Committee of Old Mutual plc, a Non-Executive Director of PaddyPower Betfair plc and a Non-Executive Member of the Defence Board of the UK Ministry of Defence.
Jane Hanson, Independent NED (appointed December 2011)
Biography Jane is Chair of the Board Risk Committee. She has extensive experience of risk management, corporate governance and internal control. She also has wide experience in developing and monitoring customer and conduct risk frameworks.
She spent her early career with KPMG, working in the financial sector, later becoming responsible for delivering corporate governance, internal audit and risk-management services in the north of England. Jane has also held a number of executive roles, including Director of Audit, and Risk and Governance Director at Aviva’s UK Life business. She is a Fellow of the Institute of Chartered Accountants in England and Wales.
External appointments Jane is Chair of Reclaim Fund Ltd and an Independent Member of the Fairness Committee at ReAssure Ltd. She has her own financial sector consulting business and is also a magistrate.
Mike Holliday-Williams,Managing Director, Personal Lines (appointed February 2017)
Experience and qualifications Mike is Managing Director, Personal Lines. He joined Direct Line in 2014 and has over 10 years’ insurance industry experience. He was previously Chief Executive Officer of RSA Group’s Scandinavian businesses, Codan A/S and Trygg-Hansa, and before that UK Managing Director of Personal Lines at RSA, responsible for the MORETH>N, Partnerships and the Broker businesses. Before joining RSA, Mike had many general management, marketing and customer growth roles across several industries including the energy, telecoms and retail sectors. He started his career at WHSmith plc, before moving to various Centrica-owned businesses, including British Gas and Onetel.
External appointments Mike is a member of the Association of British Insurers General Insurance Council.
Direct Line Group Annual Report & Accounts 201650
N R
C
A B C I
R
A
B
C
I
N
R

www.directlinegroup.com 51
Sebastian James, Independent NED (appointed August 2014)
Biography Sebastian is Chair of the Corporate Social Responsibility Committee. He has extensive experience in retail and consumer practice at large groups; and has a detailed understanding of the UK consumer markets, products and brands. Sebastian was previously Chief Executive Officer of Synergy Insurance Services Limited and subsequently gained wide retail experience as Strategy Director responsible for developing and implementing the turnaround strategy at Mothercare.
External appointments Sebastian is Group Chief Executive of Dixons Carphone plc and is also a trustee of the charities Save the Children and The DSG International Foundation.
Andrew Palmer, Independent NED (appointed March 2011)
Biography Andrew is Chair of the Audit Committee and Investment Committee and was Senior Independent Director until 18 January 2016. He has performed various senior roles in the financial services and insurance industries. Additionally, he has insight into corporate governance developments and best practice in financial reporting. In 2009, Andrew retired from Legal & General Group plc, where he was the Group Finance Director. He is a Fellow of the Institute of Chartered Accountants in England and Wales.
External appointments Andrew is a Non-Executive Director of Royal London Mutual Insurance Society Limited and Royal London Asset Management Limited. He is also a member of the Financial Reporting Review Panel of the Financial Reporting Council, a Trustee of the Royal School of Needlework and a Trustee and Treasurer of Cancer Research UK.
John Reizenstein, Chief Financial Officer (appointed December 2010)
Biography John is Chief Financial Officer. He has extensive City and financial services experience, spending more than 20 years in investment banking with UBS and Goldman Sachs.
John was previously an Executive Director at the Co-operative Insurance Society, CIS General Insurance and The Co-operative Bank. He was Chief Financial Officer of these organisations between 2003 and 2007, and subsequently Managing Director, Corporate and Markets.
External appointments John is a Trustee and Director of Farm Africa. He is also an alternate representative of the Association of British Insurers on the Panel on Takeovers and Mergers.
Clare Thompson, Independent NED (appointed September 2012)
Biography Clare is Chair of the Remuneration Committee. She has extensive experience and knowledge of people and remuneration gained from her roles at PwC. These included People Partner for Assurance which focused on talent management and career development planning, as well as involvement in the design and operation of remuneration structures across PwC UK. She also has significant financial and audit experience.
Clare was a partner at PwC from 1988 to 2011. During her 23 years as a partner, she held several senior and high-profile roles, particularly in the insurance sector. She is a Fellow of the Institute of Chartered Accountants in England and Wales.
External appointments Clare is a Non-Executive Director of British United Provident Association (Bupa) and Retail Charity Bonds plc. She is also a Non-Executive member of the partnership board of Miller Insurance Services LLP, and Treasurer of the Disasters Emergency Committee.
Dr Richard Ward, Independent NED and SID (appointed January 2016)
Biography Dr Richard Ward is Senior Independent Director. He was Chief Executive of Lloyd’s of London, from 2006 to 2013. Richard previously worked for over ten years at the London-based International Petroleum Exchange, the second largest energy trading exchange, re-branded ICE Futures, as both Chief Executive Officer and Vice-Chairman. He has extensive insurance industry experience and insight into prudential regulation.
Prior to the International Petroleum Exchange, Richard held a range of senior positions at British Petroleum and was Head of Marketing & Business Development for energy derivatives worldwide at Tradition Financial Services.
External appointments Richard is Executive Chairman of Cunningham Lindsey and Non-Executive Chairman of Brit Syndicates Ltd. He also serves as a member of the PRA Practitioner Panel, Bank of England.
www.directlinegroup.com 51
Strategic reportG
overnanceFinancial statem
ents
Male 7
Female 3
Gender diversity of Board of Directors
C R A R
A B I N R
B N

Executive Committee
52 Direct Line Group Annual Report & Accounts 2016 V9.2
Paul Geddes chairs the Executive Committee. In addition to Paul Geddes, Mike Holliday-Williams and John Reizenstein, the committee comprises the following:
Jonathan Greenwood, Managing Director of Commercial (joined 2000)
Humphrey Tomlinson,General Counsel (joined 2011)
Experience and qualifications Jonathan has previously held roles at HBOS, MBNA and Pinnacle and has over 30 years’ insurance and financial services industry experience. He joined the Group as Product and Pricing Director for UK partnerships. After the Group acquired Churchill, Jonathan became Commercial Director and then Managing Director of the Group’s household and life businesses. Jonathan was appointed Managing Director of Commercial in 2009.
Experience and qualifications Humphrey was previously Group Legal Director at RSA and is a solicitor with over 25 years’ experience. His experience includes advising on corporate and commercial matters, steering corporate transactions in the UK and internationally, managing legal risk, and dealing with corporate governance issues. Before joining RSA, he worked at the City law firm, Ashurst Morris Crisp. He is a graduate of the University of Oxford.
Simon Linares, Group Human Resources Director (joined 2014)
José Vazquez, Chief Risk Officer (joined 2012)
Experience and qualifications Simon was previously Group HR Director for O2, and responsible for all of Telefonica global digital businesses. Before this, he held various senior global HR roles at Diageo, including responsibility for Spain, Africa and several UK-based leadership positions. Before moving into HR, Simon held several commercial business roles in the fast-moving consumer goods and financial services sectors.
Experience and qualifications José was previously Global Chief Risk Officer and Group Chief Actuary at HSBC Insurance. Before joining HSBC, José worked for Zurich Insurance, first in its London Market Operations, then as Chief Actuary International Business Division (Asia, Latin America and Africa) and lastly as Chief Actuary in the UK. José is a Mathematics graduate from Brunel University and a Fellow of the Institute of Actuaries.
Steve Maddock, Chief Operating Officer (joined 2010)
Experience and qualifications Steve was previously Director of Strategic and Technical Claims at RSA. He has over 20 years’ insurance industry experience, including roles as Director of Claims and Customer Service at Capita, and as Director of Operations at AMP. He became Chief Operating Officer in 2016, having previously been the Managing Director of Claims, Business Services and Technology Services. Steve holds an MBA from the University of Reading, and is Chairman of the Motor Insurers’ Bureau and Insurance Database Services Limited.
Direct Line Group Annual Report & Accounts 201652
C

Corporate governance report
www.directlinegroup.com 53
This report explains the Board’s role and activities, and how corporate governance operates throughout the Group.
The UK Corporate Governance Code Direct Line Insurance Group plc (the “Company”) has complied with all of the principles and provisions of the 2014 UK Corporate Governance Code (the “Code”) throughout the financial year.
The only exception is the recommendation contained in Provision E.1.1 of the Code that the Senior Independent Director (”SID”) should attend sufficient meetings with major shareholders to listen to their views. Throughout 2016, the Board received regular updates from the Company’s corporate brokers on the views of its institutional shareholders and, in addition, the Investor Relations team provided regular updates to the Board. The Chairman, Chief Executive Officer (“CEO”) and the Chief Financial Officer (“CFO”) met with key shareholders following announcements of results and reported shareholders’ views back to the Board. On this basis the Board is satisfied that it understands the views of shareholders, and major shareholders have been invited to meet with the SID should they wish to do so. It is open to all shareholders to raise any issues they wish with the Chairman, the SID and the Chair of the Remuneration Committee. The Board has therefore concluded that it has complied with the main and supporting principles under section E.1 of the Code regarding dialogue with shareholders.
Further details of how the Company applied the Code’s principles and complied with its provisions can be found on the following pages of this report and the Directors’ remuneration report:
Leadership – page 53
Effectiveness – page 56
Accountability – page 61
Remuneration – page 63
Relations with shareholders – page 63
For more information about the Code, visit the Financial Reporting Council’s website at www.frc.org.uk
Leadership The Board The Board has a collective objective of promoting the long-term success of the Company for its shareholders and provides leadership of the Company. The main role of the Board is to organise and direct the Group’s affairs in a way that is most likely to help it succeed in the long-term for the benefit of shareholders as a whole. The Board supervises the Group’s operations, with the objectives of ensuring that they are effectively managed, that prudent controls are in place, and that risks are assessed and managed appropriately. In addition, it also sets the Group’s strategy, and monitors management’s performance and progress against the strategic aims and objectives. The Board also develops and promotes the collective vision of the Group’s purpose, culture, values and behaviours.
Board composition As at the date of this report, the Board comprised the Chairman, who was independent when appointed to the Board; the CEO; CFO; the Managing Director of Personal Lines; and six independent Non-Executive Directors (“NEDs”), including the SID. The current Directors served throughout all of 2016, except for Richard Ward, who was appointed on 18 January 2016 and Danuta Gray and Mike Holliday-Williams who were appointed on 1 February 2017. Priscilla Vacassin retired from the Board on 1 March 2016.
You can find the names of the current Directors of the Company as at the date of this report and their biographical information on pages 50 and 51.
Meetings The Board held nine scheduled meetings in 2016. The Company Secretary attended all Board meetings. At its discretion, the Board invited senior executives and external advisers to attend Board meetings, and to present on business developments and governance matters.
The table below sets out attendance at the scheduled meetings in 2016:
Scheduled meetings1
Percentage attendance
Chairman Mike Biggs 9 of 9 100%Senior Independent Director Richard Ward 9 of 9 100%Non-Executive Directors Jane Hanson 9 of 9 100%Sebastian James 9 of 9 100%Andrew Palmer 9 of 9 100%Clare Thompson 9 of 9 100%Priscilla Vacassin1 2 of 2 100%Executive Directors Paul Geddes 9 of 9 100%John Reizenstein 9 of 9 100%
Note:
1. Attendance is expressed as the number of scheduled meetings attended out of the number of such meetings possible or applicable for the Director to attend
The Board also held seven additional meetings. The additional meetings were ad hoc or Board sub-committee meetings, including meetings to receive recommendations from the Nomination Committee on Board and Committee changes, and strategic matters. The Board also held an annual strategy day in June 2016.
Structure of the Board The diagrams on the following page summarise the responsibilities of the Chairman, the CEO, the Board and the Board Committees. The Board has established six Committees to help discharge its responsibilities. Each Committee plays a vital role in helping to ensure the Board operates efficiently and considers matters appropriately. Further details on the roles and responsibilities of the Board Committees, along with the activities undertaken during the period, are contained in the Committee reports on pages 64 to 81.
www.directlinegroup.com 53
Strategic reportG
overnanceFinancial statem
ents

Corporate governance report continued
54 Direct Line Group Annual Report & Accounts 2016
The diagram below outlines the executive management structure.
Biographical details of the Executive Directors and Executive Committee members are shown on pages 50 to 52.
Board Mike Biggs, Chairman Organises and directs the Group’s affairs in a way that is believed most likely to help it succeed in the long-term for the benefit of shareholders as a whole.
Supervises the Group’s operations, helping to ensure it is effectively managed, that prudent controls are in place, and that risks are assessed and managed appropriately.
Sets the Group’s strategy, and monitors management’s performance and progress against the strategic aims and objectives.
Approves the terms of reference for the Board Committees and, where appropriate, reviews and agrees their recommendations.
Executive Committee Paul Geddes, Chief Executive Officer Sets performance targets.
Implements the Board-determined Group strategy and direction.
Monitors key objectives and commercial plans to help achieve the Group’s targets.
Evaluates new business initiatives and opportunities.
Considers reports on operational matters that are material to the Group or have cross business implications.
Audit Committee Andrew Palmer, Chair Maintains the
integrity of the Group’s financial statements.
Oversees and challenges the effectiveness of the Group’s systems of financial and other controls.
Monitors the work and effectiveness of the Group’s internal and external auditors and actuaries.
Board Risk Committee Jane Hanson, Chair Oversees and
advises the Board on the Group’s current and potential future risk exposures, and its strategic approach to managing risk.
Recommends risk appetite and tolerance levels to the Board and supports the Board in promoting a risk-aware culture across the Group.
CSR Committee Sebastian James, Chair Provides oversight
and advice on how the Group conducts its business responsibly, including matters relating to environmental, employee engagement and wellbeing, community involvement, and ethics.
Investment Committee Andrew Palmer, Chair Provides oversight
of how the Group develops its investment strategy.
Oversees the management and performance of the Group’s investment portfolio.
Nomination Committee Mike Biggs, Chair Reviews the Board’s
structure, size, composition, and balance of skills, experience, independence and expertise.
Leads the process for Board appointments and makes recommendations to the Board.
Provides guidance to management on executive succession planning.
Remuneration Committee Clare Thompson, Chair Sets and oversees
how the Group implements its remuneration policy.
Oversees the level and structure of remuneration arrangements for senior executives, approves share incentive plans, and recommends them to the Board and shareholders.
More details can be found on pages 64 to 67.
More details can be found on pages 68 to 71.
More details can be found on pages 72 to 73.
More details can be found on pages 74 to 75.
More details can be found on pages 76 to 78.
More details can be found on pages 79 to 81.
Managing Director Commercial
Jon Greenwood Managing
Director Personal Lines
Mike Holliday-Williams
Chief Operating
Officer Steve Maddock
Chief Risk Officer Jose Vazquez
Chief Financial Officer John Reizenstein
General Counsel Humphrey Tomlinson
Group Human Resources Director
Simon Linares
Direct Line Group Annual Report & Accounts 201654

www.directlinegroup.com 55
The Chief Executive Officer The Board is ultimately responsible for the Company’s success. The Board has, however, authorised Paul Geddes, the CEO, to manage the Group’s day-to-day operations and deliver its strategic objectives.
In turn, Paul Geddes has delegated certain elements of his authority to Executive Committee members. This helps ensure that senior executives are accountable and responsible for managing their businesses and functions. Such delegation also involves ensuring the senior executives have the appropriate financial and other authorities needed to manage those business areas.
Executive Committee The Executive Committee is the principal management committee that helps the CEO manage the Group’s operations. It helps him: set performance targets; implement the Board-determined Group strategy and direction; and monitor key objectives and commercial plans to help achieve the Group’s targets. It also helps him evaluate new business initiatives and opportunities, and considers reports on operational matters that are material to the Group or have cross business implications.
Non-Executive Directors Each Director brings different skills, experience and knowledge to the Company, with the NEDs bringing additional independent thought and judgement. All NEDs must be able to spend sufficient time in their roles to discharge their duties and responsibilities effectively. The letters of appointment for the Chairman and NEDs set out the time the Group anticipates that they will commit to their roles. This is at least three days a week for the Chairman and an average of three days a month for the other NEDs depending on business needs. The Nomination Committee reviews this time commitment, and each NED’s other commitments, annually.
An overview of the role and responsibilities of the Chairman, CEO, SID and the NEDs is set out in the table below:
Role Responsibilities
Chairman: Responsible for maintaining, developing and leading an effective Board. Planning and managing the Board’s business, presiding at Board meetings and acting as figurehead for the Board. } The Board has agreed individual role
profiles for the Chairman, Mike Biggs, and the CEO, Paul Geddes. These clearly define their roles and responsibilities. This is to ensure no one person has unlimited powers of decision making.
Chief Executive Officer:
Responsible for managing the Group, and delivering the Group’s strategy and financial results. Certain elements of his authority have been delegated to Executive Committee members to help ensure that senior executives are accountable and responsible for managing their businesses and functions.
Senior Independent Director:
Acts as a sounding board for the Chairman and an intermediary for the other Directors when necessary. Available to shareholders if they have any concerns they cannot resolve through normal channels. Leads the Chairman’s performance evaluation annually.
Non-Executive Directors:
Responsible for objectively and constructively challenging management. Use their wider business experience to help develop the Group’s strategy. NEDs are initially appointed for a term of three years. The Nomination Committee recommends potential new NEDs to the Board for appointment. The Board then considers and approves each appointment. All Directors are subject to election or re-election annually at the Company’s AGM. You can find the standard terms and conditions of the NED appointments at www.directlinegroup.com. Further details of NEDs letters of appointment are on page 108 of the Directors’ remuneration report.
Information and support All Directors can access assistance and advice from the Company Secretary. The Board is satisfied that it receives information of appropriate quality and in a timely manner, to enable the Directors to discharge their duties. Directors may seek external independent professional advice at the Company’s expense, if they need it to discharge their duties. The Company Secretary attends all Board meetings and he or his nominated deputy attends all Board Committee meetings.
www.directlinegroup.com 55
Strategic reportG
overnanceFinancial statem
ents

Corporate governance report continued
56 Direct Line Group Annual Report & Accounts 2016
Effectiveness Matters Reserved for the Board The Board recognises that to ensure the long-term success of the Company, certain specific matters should be reserved for the consideration and decision of the Board either alone or following review and recommendation by its Committees. Other matters are delegated by the Board to its Committees and to the Executive Directors. In addition to the Schedule of Matters Reserved, each Board Committee has written terms of reference defining its role and the authority delegated to it by the Board. The decisions specifically reserved for approval by the Board are set out in the Schedule of Matters Reserved for the Board, and are summarised in the diagram below.
Communication Ensuring satisfactory dialogue with
shareholders.
Arrangements for Annual and other General Meetings.
Strategy and management Overall leadership of the Group and
setting the Company’s values and standards.
Oversight of the Group’s operations.
The Group’s strategic aims and objectives.
Annual operating and capital expenditure budgets.
Material extension of the Group’s activities into new business or geographical areas.
Decisions to cease operation of any material part of the Group’s business.
Structure and capital Changes to the Company’s capital
structure and debt securities structure.
Major changes to the Group’s corporate structure, including material acquisitions and disposals of shares.
Changes to the Company’s listing or plc status.
Corporate governance matters The Group’s corporate governance
and regulatory compliance frameworks.
Matters Reserved for the Board Contracts
Major capital projects, investments and contracts that are either materially strategic or above the CEO’s delegated authority.
Delegation of authority Division of responsibilities between
the Chairman and Chief Executive.
Delegated levels of authority to Executive Directors.
Establishment of Board Committees.
Board membership and other appointments Appointment and removal of Directors,
SID, CEO, Company Secretary and Chief Risk Officer.
Selection of the Chairman.
Succession planning for the Board and senior executives.
Internal controls & risk management The internal controls and risk
management system, including the Group’s Risk Appetite Statements.
Remuneration Chairman and NED remuneration.
Remuneration policy.
Introduction of new share incentive plans or major changes to existing plans, for approval by shareholders.
Financial reporting and controls Results announcements.
Dividend policy.
Accounting policies.
Reserving position.
Direct Line Group Annual Report & Accounts 201656

www.directlinegroup.com 57
Board activities during 2016 The activities undertaken by the Board in 2016 to promote the long-term success of the Company are focused on its role as the leadership and decision forum for the Group.
Scheduled Board meeting discussions are focused on four main themes:
Strategy & execution, including: setting the Group’s key strategic targets and monitoring the Group’s performance against those targets; reviewing customer experience and monitoring the Group performance against external brand metrics; reviewing and approving key projects aimed at developing the business or rationalising costs; reviewing the approach to mergers and acquisitions; and reviewing the individual strategy of key business lines.
Financial performance and investor relations, including: setting financial plans, annual budgets and key performance indicators (“KPIs”), and monitoring the Group’s results against them; considering the Group’s reserving position; approving financial results for publication; agreeing the Group’s dividend policy; and reviewing broker reports on the Group alongside feedback from investor meetings.
Risk management, regulatory and other related governance, including: reviewing and agreeing the Group’s Policies; setting risk appetites; approving the Own Risk & Solvency Assessment (“ORSA”); approving major changes to the Group’s internal model and seeking to ensure that the Group complies with all regulatory requirements.
Board & Board Committee governance, including: receiving reports from the Board’s Committees; updating terms of references for the Committees; and implementing an annual review of Board and Committees’ effectiveness.
The co-ordination of the Board meeting content is managed by the Chairman, supported by the CEO and Company Secretary, primarily using a forward agenda planner.
In addition to routine business the Board considers and discusses key issues that impact on the business as they arise.
The chart below details some of the specific topics discussed during 2016:
The CEO and CFO spend a considerable amount of time with the different business units ensuring that the Board’s aims are being correctly disseminated throughout the Group, and that colleagues’ views and opinions are reported back to the Board. In addition the NEDs meet with key management outside of the Board and Committee fora to get a wider view of the Group’s activities.
January Review of Group’s
response to recent flooding
Consideration of results of employee opinion survey
2015 Board Effectiveness Review
February Review of Group
strategy
Review of year-end reserves
ORSA
Dividend policy
March Review of Motor
strategy
Reviewed progress of IMAP application
Discussed talent management and succession planning
April Review of
Commercial strategy
Approval of catastrophe reinsurance arrangements
Update on Group’s investment portfolio
June Outputs from Board
strategy day
Review of Solvency II Risk Appetite
Investor Relations update
July Compliance with
Market Abuse Regulation
People strategy update
Solvency II capital generation
Half Year report
September Update on
implementation of the next generation of customer systems
Update on CSR initiative regarding young drivers (Shotgun)
Modern Slavery Act
November Preliminary financial
plan 2016-2020
December Personal Lines
strategy update
Approval of Strategic Plan
Motor reinsurance renewal
www.directlinegroup.com 57
Strategic reportG
overnanceFinancial statem
ents

Corporate governance report continued
58 Direct Line Group Annual Report & Accounts 2016
Board induction, resources and training The Board is committed to training and developing all Directors and employees. The Company Secretary is responsible for helping the Chairman regularly review and organise training for the Directors. The Company Secretary also maintains an annual training agenda for the Board and its Committees.
In order for our Directors, particularly the NEDs, to discharge their responsibilities, it is essential that they understand our business. The diagram below illustrates the various ways in which the Directors’ understanding and knowledge of the business and the regulatory environment in which it operates is enhanced.
Richard Ward undertook a tailored induction programme during 2016 which was disclosed in the 2015 Annual Report and Accounts.
A tailored induction programme has been prepared for Danuta Gray, a recently appointed NED. The programme will focus on the Group’s businesses, strategic and transformational priorities, regulatory and governance frameworks, capital and financial management, and risk framework.
A similar programme has been put together for Mike Holliday-Williams, MD Personal Lines, who has recently been appointed as an Executive Director. This programme will focus on his duties and responsibilities as a Director of the Company and corporate governance matters.
The main Board training and development activities in the year under review included:
Training on topics including: Solvency II matters; the Group’s investment risk appetite; cyber risk and security; PPOs, complaints handling; and marketing and branding.
NED visits to operational business units to meet the management teams and better understand how the business operates. These included visits to Claims, Fraud and Legal Services teams in Leeds and Bromley, the Group’s UK Assistance Accident and Repair Centres in Manchester, to the offices of The Floow in Sheffield and the offices of EXL (the Group’s principal offshore business processing services provider).
Internal training workshops on: the Senior Insurance Managers Regime; anti-bribery and corruption and competition law; the Group’s IECM; and the application of the pricing actuarial basis for Personal Lines Motor.
Regular updates from the Company Secretary on corporate governance.
Quarterly industry and market updates from the Group’s brokers and financial advisers.
Regular reports from the Investor Relations team regarding institutional investors and analysts.
Direct Line Group Annual Report & Accounts 201658
Tailored induction
Deep dive sessions and management presentations
Divisional and functional
reviews
Investor roadshow feedback
Regular briefings on governance,
legal and regulatory
matters
Strategy days
Board and Committee
meetings
Site visits
Meeting our people
Getting to know
the business

www.directlinegroup.com 59
Board effectiveness review In accordance with the principles and provisions of the Code, the Board’s intended practice is to conduct a thorough review of the effectiveness of the performance of the Directors, the Board as a whole and its Committees on an annual basis, with the input of an external facilitator at least once every three years. The 2016 Board effectiveness review was facilitated by an external consultant, Professor Rob Goffee of London Business School, who is independent and has no other connection with the Company.
The 2016 process commenced with the Nomination Committee planning the scope of the evaluation. The Committee considered a shortlist of external evaluators for approval by the Board. The selected evaluator discussed the process with the Chairman and the Company Secretary and agreed the questions to be put to Board members and a number of executives who regularly attend Board and/or Committee meetings.
All of the Company’s Executive and Non-Executive Directors, the Company Secretary and the other respondents completed a questionnaire and then held one-to-one interviews with the facilitator. Professor Goffee discussed his report initially with the Chairman and Company Secretary and presented it to the Board in January 2017.
The review focused on:
Role & organisation The role of the Board, including Board and Committee structure and composition; the number and frequency of meetings; and Directors’ responsibilities.
Agenda The relevance of agenda items; Directors’ ability to influence agenda content; and how much time is allocated to strategic issues and corporate performance.
Corporate Governance Corporate governance matters relating to: Director appointments; the operation of the Board; and the guidance provided to Directors.
Non-Executive & Executive Directors
Directors’ expertise and experience; training; the behaviour of, and interaction between, the Non-Executive and Executive Directors; Non-Executive Directors’ time commitment; and access to key executives below Board level.
Information The flow of information, including: the quality and sufficiency of reports; access to external advice; induction and understanding of the Group’s businesses; and volume and timeliness of paper submission.
Group performance The Board’s contribution to the Group’s strategic direction; and the procedures for approving, and monitoring the Group’s performance against, the approved strategic objectives.
Leadership & culture The Board’s environment and culture, including: working relationships; succession planning; and leadership of the Board, including Board meeting management.
The findings of the effectiveness review were discussed by the Board as a whole in January 2017.
Based on the responses to the questionnaire and resulting reports, the Directors are satisfied that the Board and its Committees operated effectively in 2016. The Directors are also satisfied that they made significant progress in areas for potential improvement identified in 2015.
Whilst the findings of Professor Goffee’s report were positive, the Board will focus during 2017 on a number of areas with the objective of improving its, and its Committees’, effectiveness. These include: making better use of Non-Executive Directors’ expertise in the strategic planning cycle; refreshing the Board’s skills and experience through Board succession planning; and enhancing the Board’s approach to monitoring major business initiatives.
www.directlinegroup.com 59
Strategic reportG
overnanceFinancial statem
ents

Corporate governance report continued
60 Direct Line Group Annual Report & Accounts 2016
Governance framework and structure The Board is responsible for ensuring there is an appropriate system of governance in operation throughout the Group. This includes a robust system of internal controls and a sound risk management framework. The Board has established a risk management model that separates the Group’s risk management responsibilities into three lines of defence.
The Group’s governance framework is detailed in the High Level Control and System of Governance Framework document. The Board reviews this document annually. The core elements of the Governance Framework are the:
Matters Reserved for the Board and the Board Committees’ Terms of Reference.
Regulatory Governance Map.
Risk Appetite Statements.
Enterprise Risk Management Strategy and Framework. This sets out the Group’s approach to setting risk strategy and for managing risks to the strategic objectives and day-to-day operations of the business.
Executive Governance Framework, which outlines how each business function is governed and details the authority delegated to Executive Committee members.
Group Policies.
Minimum Standards, which interpret the Group Policies into a set of operational requirements that can be implemented throughout the Group.
The diagram below summarises the split of responsibilities for the different parts of the Group’s governance framework.
Board approves High level governance framework, Risk Appetite, Group Policies and Regulatory Governance Map are set by the Board, following review by the Board Risk Committee.
Board Risk Committee approves Enterprise Risk Management Strategy and Framework is approved by the Board Risk Committee, following review by the Risk Management Committee (a committee comprised of Executives).
Business unit and operational area implementation
High Level Control and System of Governance document
Executive Governance Framework
Risk Appetite Regulatory Governance Map
ERM Strategy and Framework
Risk Management Committee approves The Executive Governance Framework is developed by Executives and approved by the Risk Management Committee. Policy owner approves Minimum standards are approved by policy owners subject to non-objection from the Risk Management Committee.
Group Policies and certain Minimum
Standards
Minimum Standards
Matters Reserved forthe Board and Board
Committees’ Terms of Reference
Direct Line Group Annual Report & Accounts 201660

www.directlinegroup.com 61
Conflicts of interest The Company’s Articles of Association allow the Board to authorise matters where there is, or may be, a conflict between the Group’s interests and the direct or indirect interests of a Director, or between a Director’s duties to the Group and another person. This is in accordance with the Companies Act 2006.
Each Director has a duty to avoid conflicts of interest. They must declare any conflict of interest that could interfere with their ability to act in the Group’s best interests.
The Board has authorised certain potential conflicts of interest in this way. However, the Board still ensures that it will appropriately deal with any actual conflict of interest or duty that might arise. This usually would involve making sure a Director does not participate in a relevant Board or Committee discussion or decision.
To do this, the Company Secretary maintains a register of conflicts, and any conflicts that the Board has authorised. The Board reviews this register at each scheduled Board meeting.
Approach to diversity The Board carefully considers the diversity of its members from various perspectives. It also seeks to ensure that Directors have the relevant knowledge, skills, experience and, where necessary, independence to help the Group deliver its strategy.
The Company believes in the benefits of diversity. At the date of this report, of the Board’s ten members, three are women. However, while the Board will strive to consider diversity when choosing new members, it is committed to appointing the most appropriate candidates.
The Nomination Committee’s terms of reference state that it should duly regard the benefits of diversity, including gender diversity, when choosing Board candidates. You can find more information about the Board’s diversity policy in the Nomination Committee report on page 78.
The CSR Committee considers diversity as part of its ‘Proud to be here’ work stream. This is to ensure the Group’s talent pipeline remains diverse to meet future requirements. The Group provides mentoring schemes and associated training and development programmes for high-potential candidates. You can find numerical data relating to the gender diversity of the Board, senior managers and employees in the CSR report on page 33.
During the year, the Group signed up to the Women in Finance Charter. This Charter reflects the Government’s, as well as the Group’s aspiration, to see gender balance at all levels across financial services firms.
Nomination Committee On behalf of the Board, the Nomination Committee assesses the NEDs’ independence, skills, knowledge and experience as part of its annual review of each Director’s performance. The Board concluded that every current NED was independent, continued to contribute effectively, and demonstrated they were committed to the role. Andrew Palmer has served on the Board since March 2011. At the Chairman’s request, he has agreed to continue to serve as a Director and a resolution for his re-election as a Director will be proposed to the 2017 AGM. In accordance with the Code, the extension of Mr Palmer’s term of appointment beyond six years has been the subject of a particularly rigorous review. The Board is satisfied that he remains independent, that he continues to make a significant contribution to the proceedings of the Board and its Committees and that the extension of his term of appointment will provide valuable continuity as work on refreshing the Board progresses.
The Nomination Committee’s work during the year led to the appointment of Danuta Gray as an additional NED, and Mike Holliday Williams, MD Personal Lines, as an Executive Director, both with effect from 1 February 2017. You can find out more about these activities and the Nomination Committee’s work during the year on pages 76 to 78.
Accountability An explanation of how the Board meets its responsibilities under the Code is set out below, except for the following matters, which are covered elsewhere in the Annual Report & Accounts:
How the Company seeks to generate value over the long-term is explained in the business model on pages 8 and 9, and the strategy for delivering Company objectives is on pages 14 to 17.
How the Board has assessed the Group’s longer-term viability and the adoption of the going concern basis in the financial statements is set out in the Directors’ report on pages 112 and 113.
The Board has delegated responsibility to the Audit Committee to oversee the management of the relationship with the Company’s External Auditor. You can find details of the Audit Committee’s role, activities and relationship with the External Auditor in the Committee report on pages 64 to 67.
Responsibility for preparing the Annual Report & Accounts The Board is responsible for giving shareholders a fair, balanced and understandable assessment of the Company’s position and prospects. The Board is also responsible for maintaining adequate accounting records and ensuring compliance with statutory and regulatory obligations.
You can find an explanation from the Directors about their responsibility for preparing the financial statements in the Statement of Directors’ responsibilities on page 113. The Company’s External Auditor explains its responsibilities on page 121.
www.directlinegroup.com 61
Strategic reportG
overnanceFinancial statem
ents

Corporate governance report continued
62 Direct Line Group Annual Report & Accounts 2016
The Directors confirm that they consider that the Annual Report & Accounts, taken as a whole, is fair, balanced and understandable, and provides the information that shareholders and stakeholders need to assess the Group’s position and performance, business model and strategy. In arriving at this conclusion, the Board was supported by a number of processes, including the following:
Management drafted the Annual Report & Accounts to ensure consistency across sections, and a steering group comprising a team of cross-functional senior management provided overall governance and co-ordination.
A verification process, to ensure the content was factually accurate.
Members of the Executive Committee reviewed drafts of the Annual Report & Accounts.
The Company’s Disclosure Committee reviewed an advanced draft of the Annual Report & Accounts.
The Audit Committee reviewed the substantially final draft of the Annual Report & Accounts, before consideration by the Board.
Risk management and internal control systems The Board is responsible for the Group’s risk management and internal control systems. It has complied with the Code by establishing a continuous process for identifying, evaluating and managing the principal risks the Group faces.
The Board has established a management structure with defined lines of responsibility and clear delegation of authority. This control framework cascades through the divisions and central functions, detailing clear responsibilities to ensure the Group’s operations have appropriate controls. This includes controls relating to the financial reporting process.
The Group operates a Three Lines of Defence model. You can find out more about this in the Risk management section on pages 26 to 29.
The Board, with the assistance of the BRC and the Audit Committee as appropriate, monitored the Company’s risk management and internal control systems that have been in place throughout the year under review, and reviewed their effectiveness. The monitoring and review covered all material controls, including financial, operational and compliance controls. The Board and its Committees are overseeing the ongoing work intended to improve the performance across the board of the Group’s IT systems, including focusing on risks relating to IT systems’ stability, cyber security and the internal control environment.
The Board was also supported in its review of the annual Control Environment Certification process. As part of this, each directorate self-assessed its risks and whether its key controls were adequate and effective. The Risk and Group Audit functions reviewed and challenged these findings. The Group then combined the overall findings into a Group-level assessment, which the CEO approved. The system reported on the controls’ nature and effectiveness, and other management processes that manage these risks.
The BRC regularly reviews significant risks and how they might affect the Group’s financial position; comparisons to agreed risk appetites; and what the Group does to manage risks outside its appetite.
The Group Audit function supports the Board by providing an independent and objective assurance of the adequacy and effectiveness of the Group’s controls. It brings a systematic and disciplined approach to evaluating and improving the effectiveness of its risk management, control and governance frameworks, and processes.
The Directors acknowledge that any internal control system can manage, but not eliminate, the risk of not achieving business objectives. It can only provide reasonable, not absolute, assurance against material misstatement or financial loss.
On behalf of the Board, the Audit Committee regularly reviews the effectiveness of the Group’s internal control systems. Its monitoring covers all material controls. Principally, it reviews and challenges reports from management, the Group Audit function and the External Auditor. This enables it to consider how to manage or mitigate risk in line with the Group’s risk strategy.
Assessing principal risks The Board is responsible for determining the nature and extent of the risks that it is willing to take to achieve its strategic objectives. The Directors confirm that they robustly assessed the principal risks facing the Company, including risks that would threaten its business model, future performance, solvency or liquidity. You can find a description of these risks, and their management or mitigation, on pages 27 to 29.
This confirmation is based on the Directors’ twice-yearly review and challenge of the Group’s Material Risk Assessment (“MRA”), and their review and approval of the Group’s risk appetite statements. The MRA identifies risks quantified as having a residual risk impact of £40 million or more based on a 1-in-200-years likelihood period. The quantifications are produced through stress and scenario analysis, and the IECM. Each directorate’s bottom-up risk identification and assessment supplements the MRA. The MRA also plays a key role in developing the ORSA and assessing the Group’s strategic plan.
Direct Line Group Annual Report & Accounts 201662

www.directlinegroup.com 63
Remuneration The Board has delegated responsibility to the Remuneration Committee for the remuneration arrangements of the Group’s Executive Directors and Chairman. It recommends and monitors the remuneration level and structure for senior executives. You can find out more about this in the Directors’ remuneration report starting on page 82.
Relations with shareholders Engagement with shareholders The Board believes that engaging regularly with the Company’s shareholders is vital to the Group’s business. Communicating and engaging with investors means the Board can stay up to date on opinions. It also gives the Company the opportunity to answer questions and concerns.
During 2016, the Board received regular updates from the Company’s corporate brokers on the views of its institutional shareholders and, in addition, the Investor Relations team provided regular updates to the Board. During the reporting period, the Company Secretary wrote to the Company’s major shareholders, to offer them opportunity to meet with the Chairman and/or the SID.
As part of the development of a revised remuneration policy for Executive Directors, to be put before shareholders at the forthcoming AGM, the Chair of the Remuneration Committee led a wide ranging consultation with key stakeholders. Further details of this process can be reviewed on page 80 of this document and the resultant remuneration policy proposed is detailed on pages 100 to 109.
The Executive Directors meet frequently with investors and inform the Board about shareholder views. This gives Directors the opportunity to discuss governance and strategy with shareholders. The Chairman, SID and NEDs are available to attend meetings with major shareholders at their request.
The Investor Relations team helps Directors continue communicating with institutional investors, fund managers and analysts. The Board receives regular updates on investor relations, including feedback from analysts. The Company’s corporate brokers also regularly attend Board meetings to inform the Board of shareholder views.
Annual General Meeting The Board sees the Company’s AGM as a good opportunity for private shareholders to talk directly with the Board. All shareholders can attend the AGM if they wish. All Directors attended the AGM in 2016.
At the AGM, the CEO presents the Group’s financial results. The Chairman then invites shareholders to ask questions about the meeting’s business, before proposing the AGM’s formal business. All Directors will be put forward for re-election at the AGM. The Chairman, the Committee Chairs and the remaining Directors and members of the Executive Committee are also available to talk with shareholders at the end of the meeting.
The outcome of the resolutions put to the AGM, including poll results detailing votes for, against and withheld, are published on the Company’s website once the AGM has concluded.
www.directlinegroup.com 63
Strategic reportG
overnanceFinancial statem
ents

Committee reports
64 Direct Line Group Annual Report & Accounts 2016
Audit Committee report
Areas of focus in the reporting period
The Committee reviews and monitors the reserving process. The Committee challenged the key reserving assumptions and judgements, emerging trends, movements, and analysis of uncertainties underlying the Actuarial Best Estimate (“ABE”) and Management Best Estimate (“MBE”) of technical provisions.
The Committee provides oversight of the accounting estimates and judgements used in the preparation of the financial statements. A particular area of focus for 2016 was the level of change and the impact on intangible asset carrying values. Following the annual review of the intangible assets, which was considered and challenged by the Committee, an impairment of intangible assets of £39.3 million was agreed.
As part of the Committee’s review of the Financial Reporting Control Framework (“FRCF”) it looked at the processes which are used to produce financial asset valuations. In 2016 the Committee asked for details of the processes that were followed to give it assurance that the valuations were appropriate.
The PRA approved the Group to use its PIM in June 2016. Following approval, the Group published its Solvency II own funds assessment. In addition, under Solvency II the Group is required to submit Quantitative Reporting Templates to the PRA. The Solvency II related information has been incorporated into the Group’s FRCF and the Committee monitors the integrity of the information.
During the year the Ministry of Justice published a consultation regarding the assessment of soft tissue injury for bodily injury claims. The Committee reviewed and challenged management’s assessment of the impact of the proposed new process on both claims experience and operating costs.
In relation to Group Audit, members of the Committee requested a presentation to explore, and provide an opportunity to challenge, how the function is developing its use of data analytics. In the light of a significant level of change within the Group Audit plans, the Committee also requested and received additional analysis to evidence that an appropriate breadth and depth of internal audit coverage was being maintained across the Group.
Responsibilities of the Audit Committee The Committee is responsible for overseeing and challenging the effectiveness of the Group’s systems of financial and other controls. The Committee monitors the work and effectiveness of the Group’s internal and external auditors and actuaries.
The Committee’s main responsibilities are to:
monitor the integrity of the Group’s financial statements and any other formal announcement relating to its financial performance.
review and monitor the reserving process and recommend the reserves to the Board.
continually review the adequacy and effectiveness of the Group’s internal financial controls and internal control systems, and the monitoring procedures.
monitor and evaluate the Group Audit function’s performance.
monitor and manage the relationship with the External Auditor, including agreeing the external audit fee, assessing its effectiveness, independence and managing any tender process for the audit services contract.
The Audit Committee’s main role and responsibilities are set out in written terms of reference and are available at www.directlinegroup.co.uk/termsofreference
Committee composition, skills and experience and meetings in the year The Committee comprises three independent NEDs: Andrew Palmer, Jane Hanson and Clare Thompson. You can find their biographical information on pages 50 and 51. In line with the 2016 amendments to the Code, the Audit Committee as a whole is deemed to have competence relevant to the insurance and financial services sectors in which the Group operates.
All Committee members are members of the Institute of Chartered Accountants in England and Wales. They also have recent and relevant financial experience, enabling them to contribute diverse expertise to the Committee’s proceedings. To keep their skills current and relevant, in addition to Board training, members of the Committee have received training during the period on matters including PPOs, reserving processes and the Solvency II balance sheet.
The Audit Committee held five scheduled meetings in 2016. Two sub-committee meetings were also held to approve the Group’s trading updates for the first and third quarters of 2016. Three additional meetings were held to review drafts of the Solvency II narrative reports and to review the Group’s Solvency II balance sheet following receipt of internal model approval.
The table below shows attendance at the scheduled meetings:
Scheduled meetings
Percentage attendance
Andrew Palmer (Chair) 5 of 5 100%Jane Hanson 5 of 5 100%Clare Thompson 5 of 5 100%
The Chair reports on matters dealt with at each scheduled Committee meeting to the subsequent scheduled Board meeting.
Direct Line Group Annual Report & Accounts 201664
Andrew PalmerChair of the
Audit Committee

Committee reports
64 Direct Line Group Annual Report & Accounts 2016
Audit Committee report
Areas of focus in the reporting period
The Committee reviews and monitors the reserving process. The Committee challenged the key reserving assumptions and judgements, emerging trends, movements, and analysis of uncertainties underlying the Actuarial Best Estimate (“ABE”) and Management Best Estimate (“MBE”) of technical provisions.
The Committee provides oversight of the accounting estimates and judgements used in the preparation of the financial statements. A particular area of focus for 2016 was the level of change and the impact on intangible asset carrying values. Following the annual review of the intangible assets, which was considered and challenged by the Committee, an impairment of intangible assets of £39.3 million was agreed.
As part of the Committee’s review of the Financial Reporting Control Framework (“FRCF”) it looked at the processes which are used to produce financial asset valuations. In 2016 the Committee asked for details of the processes that were followed to give it assurance that the valuations were appropriate.
The PRA approved the Group to use its PIM in June 2016. Following approval, the Group published its Solvency II own funds assessment. In addition, under Solvency II the Group is required to submit Quantitative Reporting Templates to the PRA. The Solvency II related information has been incorporated into the Group’s FRCF and the Committee monitors the integrity of the information.
During the year the Ministry of Justice published a consultation regarding the assessment of soft tissue injury for bodily injury claims. The Committee reviewed and challenged management’s assessment of the impact of the proposed new process on both claims experience and operating costs.
In relation to Group Audit, members of the Committee requested a presentation to explore, and provide an opportunity to challenge, how the function is developing its use of data analytics. In the light of a significant level of change within the Group Audit plans, the Committee also requested and received additional analysis to evidence that an appropriate breadth and depth of internal audit coverage was being maintained across the Group.
Responsibilities of the Audit Committee The Committee is responsible for overseeing and challenging the effectiveness of the Group’s systems of financial and other controls. The Committee monitors the work and effectiveness of the Group’s internal and external auditors and actuaries.
The Committee’s main responsibilities are to:
monitor the integrity of the Group’s financial statements and any other formal announcement relating to its financial performance.
review and monitor the reserving process and recommend the reserves to the Board.
continually review the adequacy and effectiveness of the Group’s internal financial controls and internal control systems, and the monitoring procedures.
monitor and evaluate the Group Audit function’s performance.
monitor and manage the relationship with the External Auditor, including agreeing the external audit fee, assessing its effectiveness, independence and managing any tender process for the audit services contract.
The Audit Committee’s main role and responsibilities are set out in written terms of reference and are available at www.directlinegroup.co.uk/termsofreference
Committee composition, skills and experience and meetings in the year The Committee comprises three independent NEDs: Andrew Palmer, Jane Hanson and Clare Thompson. You can find their biographical information on pages 50 and 51. In line with the 2016 amendments to the Code, the Audit Committee as a whole is deemed to have competence relevant to the insurance and financial services sectors in which the Group operates.
All Committee members are members of the Institute of Chartered Accountants in England and Wales. They also have recent and relevant financial experience, enabling them to contribute diverse expertise to the Committee’s proceedings. To keep their skills current and relevant, in addition to Board training, members of the Committee have received training during the period on matters including PPOs, reserving processes and the Solvency II balance sheet.
The Audit Committee held five scheduled meetings in 2016. Two sub-committee meetings were also held to approve the Group’s trading updates for the first and third quarters of 2016. Three additional meetings were held to review drafts of the Solvency II narrative reports and to review the Group’s Solvency II balance sheet following receipt of internal model approval.
The table below shows attendance at the scheduled meetings:
Scheduled meetings
Percentage attendance
Andrew Palmer (Chair) 5 of 5 100%Jane Hanson 5 of 5 100%Clare Thompson 5 of 5 100%
The Chair reports on matters dealt with at each scheduled Committee meeting to the subsequent scheduled Board meeting.
www.directlinegroup.com 65
Case study: Periodic Payment Orders
The Committee requested an in depth review of PPO reserving methodology and in September 2016 the Committee met to discuss a report by management. The topics covered were: emerging experience; key judgements and assumptions; industry benchmarking; regulation and standards; and long-term financial projections. The Committee focused its efforts on the recommendations of the Group’s Chief Actuary in the ABE and in related reserve margins proposed by the CFO.
The Committee reviewed trends in the claims experience versus industry experience to assess the Group’s performance in these complex cases. It concluded that the Group’s experience was broadly consistent with the market and that its claims handling approach to settling PPOs was appropriately reflected in reserving. It challenged, and was satisfied with, the data collection process and methods for ensuring accuracy.
Recognising the need for significant expert judgement in such long-term cash flow projections the Committee challenged the assumptions, specifically: life expectations; inflation assumptions; discounting; and reinsurance. It discussed the sensitivities to alternative values and approaches, and considered the long-term economic assumptions including past data and the compatibility of assumptions for International Financial Reporting Standards (“IFRS”) and Solvency II.
It discussed the strength of the underlying assumptions with the Group’s External Auditor and independent external actuaries and concluded that, whilst the ABE appeared robust in the face of significant uncertainties about the long-term future, they were appropriate. It was satisfied that reserve margins held specifically for PPOs were proportionate and justified because not all risks could be captured in the actuarial analysis. The members sought and were given assurance that the additional costs of current and future PPOs from existing business cohorts were being recognised.
The Committee requested a long-term projection of the Group’s balance sheet under different assumed reinsurance arrangements. This was presented by management and showed how liabilities to PPOs would gradually accumulate over time as expected and more slowly under lower retention levels. The Committee was satisfied that the long-term trend in the Group’s balance sheet was reasonable and within risk appetite and that exposure to reinsurance bad debts was being appropriately captured.
Main activities during the year At every scheduled Committee meeting, the Committee receives reports on financial reporting, reserves, internal controls and Group Audit. You can find out more about this in the following sections.
Financial reporting The Committee monitors the integrity of the financial statements of the Group, and any other formal announcement relating to its financial performance. Solvency II related information has been incorporated into the Group’s financial reporting processes.
During the year, the Committee reviewed the preliminary announcement of the Group’s 2015 financial results, the 2015 Annual Report & Accounts, and the 2016 Half Year Report. The Committee then recommended them to the Board for approval.
The review process focused on critical accounting policies and practices, emphasising those requiring a major element of judgement. The review also considered the going concern assumptions and viability statement, valuation of assets and impairment reviews, reserving provisions, unusual transactions, clarity of disclosures and significant audit adjustments. This included the Solvency II balance sheet and certain Quantitative Reporting Templates.
The Committee also advised the Board whether the financial statements, taken as a whole, were fair, balanced and understandable and provided sufficient information to enable the reader to assess the Group’s position and performance, business model and strategy.
When considering the Annual Report & Accounts for 2016, the Committee focused on the significant risks and judgements which could be material to the financial statements. These included:
Reserve valuation – The Committee reviewed the actuarial best estimates of the level of reserves, including the impact of the reduction in the Ogden discount rate from 2.5% to minus 0.75% following the Lord Chancellor’s review of the discount rate for personal injury claims. External consultants participate independently in the annual review. Further information on reserves is provided in this report.
Valuation of investments not held at fair value – The Committee considered reports on the judgements applied to the carrying value of the Group’s investments and the basis for the valuation.
Change and IT – The Committee considered major change projects and IT controls.
The Committee considered reports prepared by management on the significant estimates and judgements that were material to the financial statements and challenged the judgements being made, in particular in relation to the non-cash intangible asset impairment of £39.3 million. This relates to capitalised software development costs for ongoing IT projects primarily relating to the development of new systems. The Committee also discussed these matters with the External Auditor.
www.directlinegroup.com 65
Strategic reportG
overnanceFinancial statem
ents

Committee reports continued
66 Direct Line Group Annual Report & Accounts 2016
Reserves The Committee reviews and challenges the key assumptions and judgements, emerging trends, movements, and analysis of uncertainties underlying the ABE of technical provisions. At the same time, the Committee considers and challenges the appropriateness of the CFO’s proposals for management’s best estimate of reserves. These are informed by actuarial analysis, wider commercial and risk management insights, and principles of consistency from period to period.
The Committee approves annual plans for reviews of reserves, informed by emerging internal and external issues.
It also considers an appropriate balance between internal and external actuarial review. Consultants appointed to provide actuarial reviews of reserves are subject to approval by the Committee. The external actuarial review of reserves requiring most judgement was carried out by PricewaterhouseCoopers LLP for the Directors of the Company and its relevant affiliates1.
After reviewing the actuarial best estimate and management’s best estimate of reserves, the Committee recommends them to the Board.
Internal control and Group Audit During the year, the Audit Committee reviewed the adequacy and effectiveness of the Group’s internal control systems.
The Group’s FRCF is part of its wider internal controls system. It addresses financial reporting risks. The Board delegates supervision of the FRCF to the Audit Committee. The CFO is responsible for the FRCF on a day-to-day basis.
During 2016, the Committee received regular reports on the FRCF and the testing of it. Part of those reports focused on control deficiencies and the mitigating actions taken.
The Committee considered the Group’s internal controls and processes for identifying and responding to risks.
The Committee provides oversight of Group Audit’s work and seeks to ensure it adopts industry best practice appropriately. The Group Head of Audit’s primary reporting line is to the Chair of the Committee. The secondary reporting line, for day-to-day administration, is to the CFO. Group Audit provides the Committee with independent and objective reports on the adequacy and effectiveness of the Group’s governance, risk management and internal controls. The Committee approves Group Audit’s annual plan and receives quarterly reports detailing internal audit activity, key findings, management responses, and proposed action plans. Group Audit also monitors that these actions are completed. The Committee also approves the Group Audit Charter.
During the year, the Committee assessed whether the Group Audit function was effective and concluded that it was. This included the Committee satisfying itself that the Group Audit function has the appropriate resources.
Additional information The Committee has unrestricted access to management and external advisers to help discharge its duties. It is satisfied that in 2016 it received sufficient, reliable and timely information to perform its responsibilities effectively.
The CEO, CFO, Chief Risk Officer (“CRO”), Group Financial Controller and Head of External Reporting are invited to attend Audit Committee meetings. The Actuarial Director, external actuarial advisers, External Auditor and Group Head of Audit are also invited to attend meetings and meet privately with the Audit Committee, in the absence of management. The Chief Operating Officer is also invited to attend appropriate sections of Audit Committee meetings.
External audit The Committee is responsible for overseeing the External Auditor and agreeing the audit fee. This also involves approving the scope of the External Auditor’s annual plan.
During the year, the Committee discussed the position on its external audit services contract and examined a number of options regarding the timing of tendering for the external audit, including the mandatory rotation of the Group’s audit firm, taking into account the Code and the reforms of the audit market by the Competition and Markets Authority and the EU. This included whether it was appropriate to tender the external audit contract for the year ending 31 December 2018. The Company has complied with the provisions of The Statutory Audit Services for Large Companies Market Investigation (Mandatory Use of Competitive Tender Processes and Audit Committee Responsibilities) Order 2014.
A number of factors were taken into account, including anticipated business changes, regulatory developments such as the implementation of Solvency II and the approval of the Group’s use of its own Internal Model, the expected new insurance accounting standard for implementation in 2021 and the appointment of a new audit partner by Deloitte LLP (“Deloitte”) during 2016, following the normal audit partner rotation process. The Committee concluded that it was not appropriate to tender the external audit contract for the 2018 year end and, subject to continued effective performance by Deloitte, would review the position again early in 2017. At that point a decision will be made whether to tender the external audit contract for the year ended 31 December 2019 or defer until a later date. The current audit partner is Colin Rawlings who was appointed in advance of the 2016 audit. Colin has had no interaction with the Financial Reporting Council’s Corporate Reporting Review team.
There are no contractual obligations restricting the Company’s choice of external auditor and no auditor liability agreement has been entered into. Equally, any recommendation to reappoint Deloitte as auditor of the Company depends on continued satisfactory performance.
Note:
1. The relevant affiliates are U K Insurance Limited and Churchill Insurance Company Limited
Direct Line Group Annual Report & Accounts 201666
Committee reports continued
66 Direct Line Group Annual Report & Accounts 2016
Reserves The Committee reviews and challenges the key assumptions and judgements, emerging trends, movements, and analysis of uncertainties underlying the ABE of technical provisions. At the same time, the Committee considers and challenges the appropriateness of the CFO’s proposals for management’s best estimate of reserves. These are informed by actuarial analysis, wider commercial and risk management insights, and principles of consistency from period to period.
The Committee approves annual plans for reviews of reserves, informed by emerging internal and external issues.
It also considers an appropriate balance between internal and external actuarial review. Consultants appointed to provide actuarial reviews of reserves are subject to approval by the Committee. The external actuarial review of reserves requiring most judgement was carried out by PricewaterhouseCoopers LLP for the Directors of the Company and its relevant affiliates1.
After reviewing the actuarial best estimate and management’s best estimate of reserves, the Committee recommends them to the Board.
Internal control and Group Audit During the year, the Audit Committee reviewed the adequacy and effectiveness of the Group’s internal control systems.
The Group’s FRCF is part of its wider internal controls system. It addresses financial reporting risks. The Board delegates supervision of the FRCF to the Audit Committee. The CFO is responsible for the FRCF on a day-to-day basis.
During 2016, the Committee received regular reports on the FRCF and the testing of it. Part of those reports focused on control deficiencies and the mitigating actions taken.
The Committee considered the Group’s internal controls and processes for identifying and responding to risks.
The Committee provides oversight of Group Audit’s work and seeks to ensure it adopts industry best practice appropriately. The Group Head of Audit’s primary reporting line is to the Chair of the Committee. The secondary reporting line, for day-to-day administration, is to the CFO. Group Audit provides the Committee with independent and objective reports on the adequacy and effectiveness of the Group’s governance, risk management and internal controls. The Committee approves Group Audit’s annual plan and receives quarterly reports detailing internal audit activity, key findings, management responses, and proposed action plans. Group Audit also monitors that these actions are completed. The Committee also approves the Group Audit Charter.
During the year, the Committee assessed whether the Group Audit function was effective and concluded that it was. This included the Committee satisfying itself that the Group Audit function has the appropriate resources.
Additional information The Committee has unrestricted access to management and external advisers to help discharge its duties. It is satisfied that in 2016 it received sufficient, reliable and timely information to perform its responsibilities effectively.
The CEO, CFO, Chief Risk Officer (“CRO”), Group Financial Controller and Head of External Reporting are invited to attend Audit Committee meetings. The Actuarial Director, external actuarial advisers, External Auditor and Group Head of Audit are also invited to attend meetings and meet privately with the Audit Committee, in the absence of management. The Chief Operating Officer is also invited to attend appropriate sections of Audit Committee meetings.
External audit The Committee is responsible for overseeing the External Auditor and agreeing the audit fee. This also involves approving the scope of the External Auditor’s annual plan.
During the year, the Committee discussed the position on its external audit services contract and examined a number of options regarding the timing of tendering for the external audit, including the mandatory rotation of the Group’s audit firm, taking into account the Code and the reforms of the audit market by the Competition and Markets Authority and the EU. This included whether it was appropriate to tender the external audit contract for the year ending 31 December 2018. The Company has complied with the provisions of The Statutory Audit Services for Large Companies Market Investigation (Mandatory Use of Competitive Tender Processes and Audit Committee Responsibilities) Order 2014.
A number of factors were taken into account, including anticipated business changes, regulatory developments such as the implementation of Solvency II and the approval of the Group’s use of its own Internal Model, the expected new insurance accounting standard for implementation in 2021 and the appointment of a new audit partner by Deloitte LLP (“Deloitte”) during 2016, following the normal audit partner rotation process. The Committee concluded that it was not appropriate to tender the external audit contract for the 2018 year end and, subject to continued effective performance by Deloitte, would review the position again early in 2017. At that point a decision will be made whether to tender the external audit contract for the year ended 31 December 2019 or defer until a later date. The current audit partner is Colin Rawlings who was appointed in advance of the 2016 audit. Colin has had no interaction with the Financial Reporting Council’s Corporate Reporting Review team.
There are no contractual obligations restricting the Company’s choice of external auditor and no auditor liability agreement has been entered into. Equally, any recommendation to reappoint Deloitte as auditor of the Company depends on continued satisfactory performance.
Note:
1. The relevant affiliates are U K Insurance Limited and Churchill Insurance Company Limited
www.directlinegroup.com 67
Auditor independence and non-audit services policy The Group has an Independence of External Audit Minimum Standard. This establishes parameters for preventing or mitigating anything that compromises the External Auditor’s independence or objectivity, by virtue of it providing the Group with non-audit services. The Committee reviews and refreshes the standard annually to make sure it remains appropriate. The standard is compliant with the FRCs implementation of the EU Audit Regulation and Directive in adopting the list of prohibited non-audit services which cannot be provided to the Group.
Before each financial year, the Committee formally approves a list of audit and non-audit services that the External Auditor will provide. This is in accordance with the Minimum Standard.
The Group has delegated authority to the Audit Committee’s Chair to approve any non-audit services costing up to £100,000. Non-audit services costing over £100,000 require the Committee’s approval. At least twice a year, the Committee receives and reviews a report on all consultancy spending, including non-audit services.
During the year, the Committee approved fees of £0.4 million to Deloitte for services unrelated to audit work. The following is a breakdown of fees paid to Deloitte for the year ended 31 December 2016.
Fees £m Proportion
Audit fees1 1.8 81.8%Non-audit fees 0.4 18.2%Total fees for audit and other services 2.2
The non-audit fee of £0.4 million related to audit assurance services and services provided in reviewing the Company’s remuneration policy, tax advisory services and an IT project.
The Committee reviewed how the Group applied its Minimum Standard on audit and non-audit services in 2016. It is satisfied that the Group has adequate procedures to ensure that the External Auditors are independent and objective.
Effectiveness of the external audit process and reappointing Deloitte as External Auditors In 2016, the Committee assessed the External Auditor’s effectiveness. This was in addition to regularly questioning the External Auditor during its meetings. The Committee assessed the External Auditor through: a detailed questionnaire completed by key stakeholders; discussing matters with the CFO; formally reviewing Deloitte’s independence; and assessing whether it fulfilled the agreed audit plan.
The Committee, after taking into account all of the information available, concluded that Deloitte had performed its obligations effectively and appropriately as External Auditor to the Group.
The Committee subsequently recommended to the Board that the Group reappoint Deloitte as External Auditor. The Group will put a resolution regarding this to shareholders at the 2017 AGM.
The Audit Committee’s effectiveness A formal and rigorous annual evaluation of the Committee’s performance and effectiveness was undertaken during the year. Professor Rob Goffee of London Business School facilitated this effectiveness review, and prepared a report based on responses from Committee members and other stakeholders to a questionnaire and interview. After reviewing and discussing the report, the Committee concluded that it was operating effectively and has access to sufficient resources to perform its duties.
The Board reviewed and approved this report on 6 March 2017.
Andrew Palmer Chair of the Audit Committee
Note:
1. You can find further information in note 11 to the consolidated financial statements.
www.directlinegroup.com 67
Strategic reportG
overnanceFinancial statem
ents

Committee reports continued
68 Direct Line Group Annual Report & Accounts 2016
Board Risk Committee report
Areas of focus in the reporting period
The Group received approval from the PRA for the use of its Group PIM in June 2016, successfully concluding a multi-year project. The case study on page 69 details how the Committee provided oversight to enable the Group to meet the challenges of complying with Solvency II and obtain internal model approval.
The Committee reviewed an assessment of risk behaviours and attitudes undertaken jointly by the Risk function and Group Audit, which covered areas including: tone from the top; decision making; and risk management. The Committee challenged the outputs of the assessment and ensured the appropriateness of the actions identified. The Committee commended the progress made to embed and to demonstrate positive culture and behaviours in risk management.
With cyber security becoming an increasingly important area of focus for companies, the Committee closely monitored and challenged activities in relation to IT risks, controls and resilience. The Committee reviewed the outputs from system penetration testing and reviews of risk management and information security, and challenged the first and second lines of defence on the adequacy of the remediation planning and the assessment of the materiality of the issues raised. The Committee was satisfied with progress made in the continuing development of the IT control environment and with the oversight of the IT risks and controls by the second line of defence.
The Committee scrutinised the Pricing Control Framework, and challenged the Group’s risk appetite for pricing events. The Committee reviewed the outputs of reviews undertaken by Group Audit and an external consultancy firm regarding the effectiveness and sustainability of controls within the Pricing function. The Committee ensured that management undertook sufficient root cause analysis and read across of the pricing events. The small number of pricing issues were non-material and not systemic and the Committee was satisfied with the robustness of the control environment within the Pricing function and the level of management focus.
Responsibilities of the Board Risk Committee The Committee is responsible for oversight and challenge of the Group’s current and potential future risk exposures, and its strategic approach to managing risk. The Committee recommends risk appetite and tolerance levels to the Board, and supports the Board in promoting a risk-aware culture across the Group.
The Committee’s main responsibilities are to:
consider and recommend the Group’s risk appetite, framework and tolerance to the Board for its approval.
review and approve the design and implementation of the ERMF, and the procedures for monitoring its adequacy and effectiveness.
consider the Group’s risk profile relative to current and future Group strategy, and to risk appetite.
approve the Risk and Compliance function operational plans and adequacy of resourcing.
review the governance of, and methodology and assumptions used in, the Group’s Internal Economic Capital Model, approve changes to the model and validation thereof.
review and recommend the ORSA process and report to the Board.
review the Group’s procedure for detecting internal and external fraud.
The main role and responsibilities of the BRC are set out in written terms of reference and are available at www.directlinegroup.co.uk/termsofreference
Committee composition, skills and experience and meetings in the year The Committee comprises three independent NEDs: Jane Hanson, Andrew Palmer and Richard Ward. You can find their biographical information on pages 50 and 51.
The BRC held six scheduled meetings in 2016. Two additional meetings were held to consider IT controls and cyber risk; and a review of the Conduct Risk Management Framework. Additionally, the Committee held a strategy day which considered the Group’s approach to the management of risk, the risk oversight model and the operation of the Three Lines of Defence model. The table below shows attendance at the scheduled meetings:
Scheduled meetings
Percentage attendance
Jane Hanson (Chair) 6 of 6 100%Andrew Palmer 6 of 6 100%Richard Ward1,2 3 of 4 75%Clare Thompson1 1 of 1 100%Priscilla Vacassin1 1 of 1 100%Notes:
1. Attendance is expressed as the number of scheduled meetings attended out of the number of such meetings possible or applicable to attend
2. Dr. Ward was unable to attend one meeting due to an overseas business commitment that he had agreed before joining the Board
Direct Line Group Annual Report & Accounts 201668
Jane HansonChair of the Board
Risk Committee

Committee reports continued
68 Direct Line Group Annual Report & Accounts 2016
Board Risk Committee report
Areas of focus in the reporting period
The Group received approval from the PRA for the use of its Group PIM in June 2016, successfully concluding a multi-year project. The case study on page 69 details how the Committee provided oversight to enable the Group to meet the challenges of complying with Solvency II and obtain internal model approval.
The Committee reviewed an assessment of risk behaviours and attitudes undertaken jointly by the Risk function and Group Audit, which covered areas including: tone from the top; decision making; and risk management. The Committee challenged the outputs of the assessment and ensured the appropriateness of the actions identified. The Committee commended the progress made to embed and to demonstrate positive culture and behaviours in risk management.
With cyber security becoming an increasingly important area of focus for companies, the Committee closely monitored and challenged activities in relation to IT risks, controls and resilience. The Committee reviewed the outputs from system penetration testing and reviews of risk management and information security, and challenged the first and second lines of defence on the adequacy of the remediation planning and the assessment of the materiality of the issues raised. The Committee was satisfied with progress made in the continuing development of the IT control environment and with the oversight of the IT risks and controls by the second line of defence.
The Committee scrutinised the Pricing Control Framework, and challenged the Group’s risk appetite for pricing events. The Committee reviewed the outputs of reviews undertaken by Group Audit and an external consultancy firm regarding the effectiveness and sustainability of controls within the Pricing function. The Committee ensured that management undertook sufficient root cause analysis and read across of the pricing events. The small number of pricing issues were non-material and not systemic and the Committee was satisfied with the robustness of the control environment within the Pricing function and the level of management focus.
Responsibilities of the Board Risk Committee The Committee is responsible for oversight and challenge of the Group’s current and potential future risk exposures, and its strategic approach to managing risk. The Committee recommends risk appetite and tolerance levels to the Board, and supports the Board in promoting a risk-aware culture across the Group.
The Committee’s main responsibilities are to:
consider and recommend the Group’s risk appetite, framework and tolerance to the Board for its approval.
review and approve the design and implementation of the ERMF, and the procedures for monitoring its adequacy and effectiveness.
consider the Group’s risk profile relative to current and future Group strategy, and to risk appetite.
approve the Risk and Compliance function operational plans and adequacy of resourcing.
review the governance of, and methodology and assumptions used in, the Group’s Internal Economic Capital Model, approve changes to the model and validation thereof.
review and recommend the ORSA process and report to the Board.
review the Group’s procedure for detecting internal and external fraud.
The main role and responsibilities of the BRC are set out in written terms of reference and are available at www.directlinegroup.co.uk/termsofreference
Committee composition, skills and experience and meetings in the year The Committee comprises three independent NEDs: Jane Hanson, Andrew Palmer and Richard Ward. You can find their biographical information on pages 50 and 51.
The BRC held six scheduled meetings in 2016. Two additional meetings were held to consider IT controls and cyber risk; and a review of the Conduct Risk Management Framework. Additionally, the Committee held a strategy day which considered the Group’s approach to the management of risk, the risk oversight model and the operation of the Three Lines of Defence model. The table below shows attendance at the scheduled meetings:
Scheduled meetings
Percentage attendance
Jane Hanson (Chair) 6 of 6 100%Andrew Palmer 6 of 6 100%Richard Ward1,2 3 of 4 75%Clare Thompson1 1 of 1 100%Priscilla Vacassin1 1 of 1 100%Notes:
1. Attendance is expressed as the number of scheduled meetings attended out of the number of such meetings possible or applicable to attend
2. Dr. Ward was unable to attend one meeting due to an overseas business commitment that he had agreed before joining the Board
www.directlinegroup.com 69
Case study: Solvency II
Having spent 2015 preparing for the implementation of Solvency II, the Committee’s focus in 2016 was on providing oversight of the process leading up to the Group’s approval from the PRA for the use of its PIM and on the calculation of the SCR using the Group’s IECM. During the year, the Committee received detailed presentations from management on the underlying assumptions around the IECM and reviewed how the model had been constructed. The Committee challenged both the Group’s Solvency II and IECM submission, including:
IECM uses, particularly in relation to investment matters and the setting of the Group’s capital risk appetite under Solvency II.
The IECM change process and framework, particularly in relation to the aggregation of model changes.
The IECM validation framework, scope and process, including satisfying itself that independent validation was focused on the most appropriate areas and there was sufficient coverage in specific areas.
The Group’s SCR, including the key assumptions and dependencies within the calculation methodology such as diversification, expert judgements, parameterisation, sensitivity testing and the selection of the catastrophe model used in the IECM.
The method and governance for calculating the Standard Formula, and the justification of this capital requirement including a comparison to the IECM SCR.
The ongoing application of, and controls over, the IECM including the annual exercise to compare the IECM to the Material Risk Register.
Main activities during the year Risk monitoring At each scheduled meeting, the Committee received a report from the CRO detailing the outputs of regular risk monitoring and providing details of specific issues to the Committee. The report was enhanced during the year to set out more clearly the Group’s current risk profile, the areas of management focus and the key activities being undertaken by the second line of defence to drive forward the embedding of risk management across the Group.
The Committee received regular reports regarding the three strategic risk appetite statements: maintain capital adequacy; stable and efficient access to funding and liquidity; and maintain stakeholder confidence. The Committee monitored the Group’s exposure against these appetites and the lower level risk appetite statements, and assessed the drivers that affect its risk appetite status. The Committee reviewed and questioned the justification regarding the assessment of certain risks and the robustness of management action plans to address areas close to or outside tolerance. Having regard to the extent of change being executed by management, the Committee closely monitored change risk.
The Committee monitored the Group’s risk management and internal control systems, and reviewed their effectiveness. This covered all material risks, including financial, operational and compliance; reviewing the net risk position after the operation of controls; and considered the effectiveness of any associated mitigating actions and compensating controls.
The Committee assessed the principal risks facing the Group, which you can find listed on pages 27 to 29. The Committee achieved this by reviewing and challenging the Group’s Material Risk Register in the context of the Group’s risk appetite and through consideration of the risk assessment contained in the CRO’s report that was discussed at each scheduled meeting.
On behalf of the Board, the Committee also monitored the Group’s risk management systems, and reviewed their effectiveness. The monitoring and review involved examining an assessment of the control environment and material controls at Group level, based on directorate-level risk and control self-assessments. These assessments were subject to challenge by the Risk and Group Audit functions.
Additionally, the Committee considered other subjects in more detail at each scheduled meeting. These related to: compliance and regulatory risk including oversight of the Group’s regulatory relationships; operational risk; financial risk, Solvency II and IECM; emerging risks and risk governance.
www.directlinegroup.com 69
Strategic reportG
overnanceFinancial statem
ents

Committee reports continued
70 Direct Line Group Annual Report & Accounts 2016
Customer The Group puts the customer at the heart of its business, by endeavouring to deliver on its commitments and ensure that fairness is a natural outcome of what the Group does. The Committee reviewed and challenged reports relating to the Group’s conduct towards its customers, to try to ensure appropriate customer outcomes, the meeting of reasonable customer expectations and to determine that the Group was operating within its defined conduct risk appetite, as set by the Board.
Conduct and regulatory risk During the year, the Committee considered the Group’s compliance with regulatory requirements including conduct and financial crime. In particular, the Committee reviewed and challenged the effectiveness and level of embedding of the Group’s Conduct Risk Management Framework and the Group’s approach to complaints reporting under the Financial Conduct Authority’s (“FCA”) new definitions. The Committee also reviewed the Group’s Regulatory Governance Map and received updates on regulatory interactions, particularly with the FCA and the PRA.
The Committee monitored and challenged the outputs from reviews of the effectiveness and level of embeddedness of the Group’s Conduct Risk Management Framework, in particular the findings of the reviews undertaken by the Risk function, Group Audit and an external consultancy firm. Challenges from the Committee included a need for more emphasis on fostering good customer outcomes and greater ownership of risk management by the first line of defence. The Committee probed management on the activities undertaken and planned in relation to culture, and commended the activity being undertaken by the Customer Conduct Committee, which included a rolling regular monthly assessment against each of the FCA’s themes on culture. The Committee was satisfied that the Group’s Conduct Risk Management Framework was appropriate to enable the identification and escalation of conduct risks facing the Group, and to subsequently manage and mitigate those risks.
Additionally, the Committee reviewed and challenged the outputs from conduct and compliance assurance reviews. Following feedback from the Committee, the assurance plan was revised to comprise a monitoring plan and a separate thematic assurance plan. The Committee also requested that the documentation underpinning the assurance reviews be sufficiently robust from a governance and regulatory perspective.
The Committee received regular reports on the Group’s actions to prevent financial crime, including reviewing of the Annual Financial Crime Report and the Annual Anti-Bribery and Corruption Report.
Operational risk The Committee continues to oversee the development of IT controls, including risks relating to IT systems’ stability, cyber security and the internal control environment. The Committee assessed the level of prevention, protection and detection in relation to cyber risk and the residual risk for each of the IT control areas, taking into account any compensating controls and/or mitigating actions. The Committee questioned the impact of system stability issues in relation to customer and conduct metrics, including call abandonment rates. The Committee also reviewed the proposed IT risk appetite statements.
The Committee received regular updates on the Group’s major change programmes, including the next generation of customer systems for Personal Lines and Commercial. The Committee monitored and examined the oversight and challenge of major change initiatives by the Risk function and reviewed the outputs of the assurance work undertaken by the Risk function and Group Audit.
The Committee considered the Group’s broader operational risk control environment and commissioned reviews by the Risk function on controls relating to major third party suppliers and the execution of pricing changes. The Committee reviewed the issues encountered with the Group’s third party suppliers, and challenged the depth and coverage of the assurance approach and whether the monitoring was appropriately robust in relation to the suppliers.
Financial risk At each meeting, the Committee monitored the Group’s performance against capital risk appetite through the CRO’s report. Committee members considered risks in the strategic plan against risk appetite. During the year Committee members also reviewed and challenged the ORSA report and subsequently recommended the report for approval to the Board. Questions on the ORSA included those in relation to stress testing of the strategic plan, distribution risk, internal model validation activity and contingent management actions.
The Committee reviewed and challenged the stress and scenario testing plan, and examined the outputs of the reverse stress tests undertaken in relation to climate change and change risk.
Risk governance Every year, the Committee reviews and approves the ERMF, which includes the Group’s Policies and Minimum Standards, and the Regulatory Governance Map as part of the Group’s Solvency II requirements. The Committee reviewed and challenged each Group Policy and the Regulatory Governance Map and recommended them for approval by the Board. The Committee also considered the results from the annual Group assessment of the effectiveness of the internal control environment undertaken by each business directorate, as well as monitoring controls on an ongoing basis.
Direct Line Group Annual Report & Accounts 201670

Committee reports continued
70 Direct Line Group Annual Report & Accounts 2016
Customer The Group puts the customer at the heart of its business, by endeavouring to deliver on its commitments and ensure that fairness is a natural outcome of what the Group does. The Committee reviewed and challenged reports relating to the Group’s conduct towards its customers, to try to ensure appropriate customer outcomes, the meeting of reasonable customer expectations and to determine that the Group was operating within its defined conduct risk appetite, as set by the Board.
Conduct and regulatory risk During the year, the Committee considered the Group’s compliance with regulatory requirements including conduct and financial crime. In particular, the Committee reviewed and challenged the effectiveness and level of embedding of the Group’s Conduct Risk Management Framework and the Group’s approach to complaints reporting under the Financial Conduct Authority’s (“FCA”) new definitions. The Committee also reviewed the Group’s Regulatory Governance Map and received updates on regulatory interactions, particularly with the FCA and the PRA.
The Committee monitored and challenged the outputs from reviews of the effectiveness and level of embeddedness of the Group’s Conduct Risk Management Framework, in particular the findings of the reviews undertaken by the Risk function, Group Audit and an external consultancy firm. Challenges from the Committee included a need for more emphasis on fostering good customer outcomes and greater ownership of risk management by the first line of defence. The Committee probed management on the activities undertaken and planned in relation to culture, and commended the activity being undertaken by the Customer Conduct Committee, which included a rolling regular monthly assessment against each of the FCA’s themes on culture. The Committee was satisfied that the Group’s Conduct Risk Management Framework was appropriate to enable the identification and escalation of conduct risks facing the Group, and to subsequently manage and mitigate those risks.
Additionally, the Committee reviewed and challenged the outputs from conduct and compliance assurance reviews. Following feedback from the Committee, the assurance plan was revised to comprise a monitoring plan and a separate thematic assurance plan. The Committee also requested that the documentation underpinning the assurance reviews be sufficiently robust from a governance and regulatory perspective.
The Committee received regular reports on the Group’s actions to prevent financial crime, including reviewing of the Annual Financial Crime Report and the Annual Anti-Bribery and Corruption Report.
Operational risk The Committee continues to oversee the development of IT controls, including risks relating to IT systems’ stability, cyber security and the internal control environment. The Committee assessed the level of prevention, protection and detection in relation to cyber risk and the residual risk for each of the IT control areas, taking into account any compensating controls and/or mitigating actions. The Committee questioned the impact of system stability issues in relation to customer and conduct metrics, including call abandonment rates. The Committee also reviewed the proposed IT risk appetite statements.
The Committee received regular updates on the Group’s major change programmes, including the next generation of customer systems for Personal Lines and Commercial. The Committee monitored and examined the oversight and challenge of major change initiatives by the Risk function and reviewed the outputs of the assurance work undertaken by the Risk function and Group Audit.
The Committee considered the Group’s broader operational risk control environment and commissioned reviews by the Risk function on controls relating to major third party suppliers and the execution of pricing changes. The Committee reviewed the issues encountered with the Group’s third party suppliers, and challenged the depth and coverage of the assurance approach and whether the monitoring was appropriately robust in relation to the suppliers.
Financial risk At each meeting, the Committee monitored the Group’s performance against capital risk appetite through the CRO’s report. Committee members considered risks in the strategic plan against risk appetite. During the year Committee members also reviewed and challenged the ORSA report and subsequently recommended the report for approval to the Board. Questions on the ORSA included those in relation to stress testing of the strategic plan, distribution risk, internal model validation activity and contingent management actions.
The Committee reviewed and challenged the stress and scenario testing plan, and examined the outputs of the reverse stress tests undertaken in relation to climate change and change risk.
Risk governance Every year, the Committee reviews and approves the ERMF, which includes the Group’s Policies and Minimum Standards, and the Regulatory Governance Map as part of the Group’s Solvency II requirements. The Committee reviewed and challenged each Group Policy and the Regulatory Governance Map and recommended them for approval by the Board. The Committee also considered the results from the annual Group assessment of the effectiveness of the internal control environment undertaken by each business directorate, as well as monitoring controls on an ongoing basis.
www.directlinegroup.com 71
The Committee considered, challenged and approved the Annual Risk and Compliance operational plan. It also reviewed the outputs of the assessment of risk behaviours and attitudes across the Group, which is part of an ongoing process to drive continued improvement in risk behaviours and attitudes by providing feedback on current state, highlighting areas of good practice and areas for focus.
Whistleblowing The Committee reviews arrangements by which employees may, in confidence, raise concerns about possible improprieties in matters of financial reporting or other matters (“Whistleblowing”). The Committee also reviews reports relating to Whistleblowing to ensure arrangements are in place for the proportionate and independent investigation of such matters and for appropriate follow-up action. Group Audit undertook an audit in the first quarter of 2016 which concluded that the Whistleblowing process was adequately designed, operating effectively and met the new regulatory requirements.
Remuneration During the year, the Committee and the Remuneration Committee held a joint meeting. This was to ensure the Group’s remuneration arrangements were still appropriate in the light of regulatory developments and did not encourage excessive risk-taking. As part of this review, the joint Committee also considered the Group’s preparedness for Solvency II regulations regarding remuneration. This followed published requirements, including how the Group would assess the performance of individuals in control functions.
Additional information To help discharge its duties, the Committee has unrestricted access to management and external advisers. It is satisfied that during 2016 it received sufficient, reliable and timely information to perform its responsibilities effectively.
The CEO, CFO, CRO, Group Head of Audit, General Counsel and a representative from the External Auditor are invited to attend Committee meetings. In addition to regular one-to-one meetings with the Chair, the CRO also met privately with the Committee without management being present.
The Committee also invites the Director of Group Regulatory Risk and Compliance, Director of Financial Risk and Enterprise Risk Director to appropriate sections of its meetings.
The Chair reports on matters dealt with at each Committee meeting to the subsequent scheduled Board meeting.
The Board Risk Committee’s effectiveness A formal and rigorous annual evaluation of the Committee’s performance and effectiveness was undertaken during the year. Professor Rob Goffee of London Business School facilitated this effectiveness review, and prepared a report based on responses from Committee members and other stakeholders to a questionnaire and interview. After reviewing and discussing the report, the Committee concluded that it was operating effectively and has access to sufficient resources to perform its duties.
The Board reviewed and approved this report on 6 March 2017.
Jane Hanson Chair of the Board Risk Committee
www.directlinegroup.com 71
Strategic reportG
overnanceFinancial statem
ents

Committee reports continued
72 Direct Line Group Annual Report & Accounts 2016
Corporate Social Responsibility Committee report
Areas of focus in the reporting period
Overall, the Committee was keen this year to ensure that the Group’s CSR activity was as tightly focused as possible on those areas where the Group could be a real force for good, bring high levels of specific expertise and have an authentic voice.
As a result, the Committee’s principal focus was on “Shotgun”, the CSR initiative designed with the ambitious goal of reducing young driver deaths in their first 1,000 miles of driving to zero. The case study on page 73 shows the scrutiny and interest of the Committee in this initiative.
At the Committee’s request, the Group’s CSR Manager and Head of Investments met with a number of the Group’s external asset managers to understand their attitudes towards responsible investment. All were able to demonstrate clear evidence of their own CSR credentials as well as their approach to incorporating environmental, social and governance factors into their investment processes.
The Committee reviewed the Group’s response to the 2015 Modern Slavery Act and signed off the Group policy and approach to this issue both within the Company and with respect to outside suppliers. The Committee agreed with management’s assessment that the Group’s risk exposure to the requirements of the Modern Slavery Act was currently considered to be low but should be monitored on an ongoing basis. The Committee noted management’s procedures to mitigate the risk of a breach in the Group’s supply line.
The Committee was delighted to note the continued strong performance in raising employee engagement scores across the Group as measured by the annual employee survey and continues to push for initiatives to further increase engagement.
Responsibilities of the CSR Committee The CSR Committee oversees and advises on how the Group conducts its business responsibly. This includes matters relating to environmental, social, governance and ethics.
The Committee also considers: diversity and inclusion in the workplace; employee engagement and wellbeing; community engagement activities; and environmental matters.
The Committee’s main responsibilities are:
approving the Group’s CSR strategy and reviewing performance against the strategy.
reviewing the Group’s performance relating to CSR matters.
assessing the Group’s role in society and the Group’s external positioning on CSR matters.
Committee composition, skills and experience and meetings in the year Sebastian James was appointed Chair of the CSR Committee as of 1 March 2016. This appointment was part of the changes to the Committees that were announced on 16 February 2016.
The Committee comprised two independent NEDs, Sebastian James and Jane Hanson, Paul Geddes, CEO, and Simon Linares, Group Human Resources Director. You can find their biographical information on pages 50 to 52.
The CSR Committee held three scheduled meetings in 2016. This table shows attendance at the scheduled meetings:
Scheduled meetings
Percentage attendance
Sebastian James (Chair) 3 of 3 100%Paul Geddes 3 of 3 100%Jane Hanson 3 of 3 100%Simon Linares12 2 of 2 100%Angela Morrison12 1 of 1 100%Notes:
1. Attendance is expressed as the number of scheduled meetings attended out of the number of such meetings possible or applicable to attend
2. Angela Morrison stepped down from the Committee prior to the meeting on 28 July 2016. Simon Linares was appointed to the Committee at the start of the same meeting
The Head of Public Affairs and Sustainability, and CSR Manager are invited to attend CSR Committee meetings. As executive sponsors of the strands of the CSR strategy, the Managing Director of Personal Lines, the Chief Operating Officer and the Managing Director of Commercial attend appropriate sections of Committee meetings.
The Chair reports on matters dealt with at each Committee meeting to the subsequent scheduled Board meeting.
Main activities during the year The Committee monitors the implementation of the CSR strategy through regular updates on the different focus areas and challenges the robustness of and progress against the targets relating to each strand of the CSR strategy. The Committee also receives a report on CSR developments at each of its meetings.
Direct Line Group Annual Report & Accounts 201672
Sebastian JamesChair of the Corporate Social
Responsibility Committee

Committee reports continued
72 Direct Line Group Annual Report & Accounts 2016
Corporate Social Responsibility Committee report
Areas of focus in the reporting period
Overall, the Committee was keen this year to ensure that the Group’s CSR activity was as tightly focused as possible on those areas where the Group could be a real force for good, bring high levels of specific expertise and have an authentic voice.
As a result, the Committee’s principal focus was on “Shotgun”, the CSR initiative designed with the ambitious goal of reducing young driver deaths in their first 1,000 miles of driving to zero. The case study on page 73 shows the scrutiny and interest of the Committee in this initiative.
At the Committee’s request, the Group’s CSR Manager and Head of Investments met with a number of the Group’s external asset managers to understand their attitudes towards responsible investment. All were able to demonstrate clear evidence of their own CSR credentials as well as their approach to incorporating environmental, social and governance factors into their investment processes.
The Committee reviewed the Group’s response to the 2015 Modern Slavery Act and signed off the Group policy and approach to this issue both within the Company and with respect to outside suppliers. The Committee agreed with management’s assessment that the Group’s risk exposure to the requirements of the Modern Slavery Act was currently considered to be low but should be monitored on an ongoing basis. The Committee noted management’s procedures to mitigate the risk of a breach in the Group’s supply line.
The Committee was delighted to note the continued strong performance in raising employee engagement scores across the Group as measured by the annual employee survey and continues to push for initiatives to further increase engagement.
Responsibilities of the CSR Committee The CSR Committee oversees and advises on how the Group conducts its business responsibly. This includes matters relating to environmental, social, governance and ethics.
The Committee also considers: diversity and inclusion in the workplace; employee engagement and wellbeing; community engagement activities; and environmental matters.
The Committee’s main responsibilities are:
approving the Group’s CSR strategy and reviewing performance against the strategy.
reviewing the Group’s performance relating to CSR matters.
assessing the Group’s role in society and the Group’s external positioning on CSR matters.
Committee composition, skills and experience and meetings in the year Sebastian James was appointed Chair of the CSR Committee as of 1 March 2016. This appointment was part of the changes to the Committees that were announced on 16 February 2016.
The Committee comprised two independent NEDs, Sebastian James and Jane Hanson, Paul Geddes, CEO, and Simon Linares, Group Human Resources Director. You can find their biographical information on pages 50 to 52.
The CSR Committee held three scheduled meetings in 2016. This table shows attendance at the scheduled meetings:
Scheduled meetings
Percentage attendance
Sebastian James (Chair) 3 of 3 100%Paul Geddes 3 of 3 100%Jane Hanson 3 of 3 100%Simon Linares12 2 of 2 100%Angela Morrison12 1 of 1 100%Notes:
1. Attendance is expressed as the number of scheduled meetings attended out of the number of such meetings possible or applicable to attend
2. Angela Morrison stepped down from the Committee prior to the meeting on 28 July 2016. Simon Linares was appointed to the Committee at the start of the same meeting
The Head of Public Affairs and Sustainability, and CSR Manager are invited to attend CSR Committee meetings. As executive sponsors of the strands of the CSR strategy, the Managing Director of Personal Lines, the Chief Operating Officer and the Managing Director of Commercial attend appropriate sections of Committee meetings.
The Chair reports on matters dealt with at each Committee meeting to the subsequent scheduled Board meeting.
Main activities during the year The Committee monitors the implementation of the CSR strategy through regular updates on the different focus areas and challenges the robustness of and progress against the targets relating to each strand of the CSR strategy. The Committee also receives a report on CSR developments at each of its meetings.
www.directlinegroup.com 73
Case study: Shotgun
The Committee’s principal focus in the reporting period was on Shotgun, the CSR initiative developed by management with the goal of reaching ‘no young driver deaths in their first 1,000 miles of driving’. This is a goal across the UK irrespective of whether the young driver is insured with the Group or not.
The Committee scrutinised the development of the initiative, the consumer research, the reward partners, the communications campaign and the design and build of the app. The Committee questioned the rationale for the name ‘Shotgun’, and probed management on the designs and visual identity of the app. The Committee also requested that management implement controls to help ensure that the potential for negative behaviours was mitigated.
The Committee examined the communications brief, particularly the advertising and use of social media. The Committee was especially interested in maximising the reach and power of the app, and in making sure that the marketing was appropriate and powerful and made use of all appropriate channels (focused on the digital and social channels).
The Committee reviewed the evaluation framework and provided feedback on the effectiveness measures, including in relation to attitudes, behaviours and impacts. A key area of the Committee’s focus was to challenge the robustness of the development and testing to ensure the product was launched successfully and functioning as intended.
CSR strategy The Group’s CSR strategy focuses on four areas. A member of the Executive Committee sponsors each area. They are:
Helping to make our society safer (Shotgun): Mike Holliday-Williams, MD Personal Lines.
Proud to be here: Simon Linares, Group Human Resources Director.
Being recognised as part of our communities: Jon Greenwood, MD Commercial.
Reduce, Reuse and Recycle: Steve Maddock, Chief Operating Officer.
You can find out more about the Group’s CSR approach and priorities in the CSR report on pages 30 to 33.
Helping to make our society safer During the year, the Committee received progress updates at each meeting on Shotgun. The Committee also received reports on the project to sponsor lollipop people for schools (Lollipoppers). You can find further details on the Shotgun manifesto in the CSR report on page 30.
Proud to be here The primary objective of this strand was to improve employee engagement in order to support a key enabler of the Group’s 2016 strategy. The KPIs for this element are linked to the People Strategy and focus on employee engagement and wellbeing.
Being recognised as part of our communities The Committee received reports about how the Group was strengthening the level of support provided to the network of Community and Social Committees operating at the Group’s main office locations. The Committee challenged the main targets which related to volunteering, fund raising, matched payroll giving and the Community Cashback scheme.
The ‘One Day’ volunteering initiative and Community Cashback scheme continued to be considered the two areas with the greatest potential for impact. These arrangements encourage colleagues to take part and raise funds for local causes.
Reduce, Reuse and Recycle This strand of the strategy considers energy use, waste management and resource use within the Group’s operations and environmental and social matters in the Group’s supply chain. The Committee reviewed the key objectives related to reducing greenhouse gas emissions, diverting waste from landfill, and challenged the targets, including the new targets for waste recycling across the Group’s accident and repair centres. The Committee encouraged management to pursue their proposed initiative relating to the use of reconditioned automotive parts in order to reduce embedded energy usage, waste and landfill.
CSR activities The Committee was kept up to date with the Group’s external positioning, including the Group’s stakeholders and its approach to managing the external relationships, including use of the corporate website and the AGM. The Committee continues to challenge management’s approach to ensure that it is strategic and continues to focus on initiatives with the potential to add discernible value.
The Committee monitored the Group’s performance against the targets set in relation to CSR KPIs.
The Committee reviewed the CSR-related feedback received from proxy voting advisers following publication of the Company’s 2015 Annual Report & Accounts and the Notice of 2016 AGM and encouraged management to consider addressing the relevant feedback.
The CSR Committee’s effectiveness A formal and rigorous annual evaluation of the Committee’s performance and effectiveness was undertaken during the year. Professor Rob Goffee of London Business School facilitated this effectiveness review, and prepared a report based on responses from Committee members and other stakeholders to a questionnaire and interview. After reviewing and discussing the report, the Committee concluded that it was operating effectively and has access to sufficient resources to perform its duties.
The Board reviewed and approved this report on 6 March 2017.
Sebastian James Chair of the CSR Committee
www.directlinegroup.com 73
Strategic reportG
overnanceFinancial statem
ents

Committee reports continued
74 Direct Line Group Annual Report & Accounts 2016
Investment Committee report
Areas of focus in the reporting period
A slowing global economy, a “lower for longer” interest rate outlook and the EU Referendum shaped the Committee’s concerns when it met in January 2016. The case study on page 75 details how the Committee met the challenge of ensuring: the Company was prepared in advance of the EU Referendum vote; and the investment portfolio was appropriately positioned to respond to events after the vote to leave the EU.
The in-house Investment team undertook a material change of outsource arrangements during the year, moving custody, treasury banking, middle-office and collateral activities to a new provider. The Committee monitored delivery of key milestones and challenged reasons for changes to project plans. The project was executed successfully in 2016.
As part of management’s drive to deliver a cost-effective investment operating model, the Committee has scrutinised a proposal from management to bring certain UK investment grade credit assets in house. The Committee challenged whether the Investment team was in a position to manage in-house a wider range of holdings before approving this initiative.
With the compression in UK yields following the vote to leave the EU, the Committee was concerned to ensure investment discipline remained paramount within new asset classes still being invested to full allocations and investment income budgeting continued to be based on conservative assumptions. The Committee received a presentation from the external asset manager responsible for the CRE loans portfolio and reviewed the assumptions underpinning management’s projections of investment income over 2017-20. In both cases, the Committee was satisfied with responses received to questions raised at respective presentations.
Following the implementation of Solvency II, the Committee wanted to understand: (a) how well management was planning for, and resourcing, the additional reporting on assets and derivatives required under Pillar III; and (b) whether there was sufficient evidence of application of the Prudent Person Principle (“PPP”) to investment activities. Following review the Committee was satisfied that appropriate levels of delegation to management had been put in place; and that management were robustly reviewing investment and risk against the PPP guidelines.
Responsibilities of the Investment Committee The Committee is responsible for the oversight of how the Group develops its investment strategy. It also oversees the management and performance of the Group’s investment portfolio.
The Committee’s main responsibilities are to:
examine the rationale for, and the risks and financial implications of, any proposed changes to the Group’s investment strategy and, where agreed, recommend these changes to the Board.
consider and approve material changes to the risk framework that underpins investment activity, and any proposals to change the operating model. This typically relates to how outsource service providers are used.
review global financial market developments and changes to the regulatory environment, and consider the ongoing appropriateness of investment activities in light of such developments.
monitor the results from investment activities, namely adequacy of financial results delivered, compliance with agreed risk tolerances and external service provider performance. The Committee also ensures that any material breaches are reported to the BRC.
Committee composition, skills and experience and meetings in the year The Committee comprises two independent NEDs: Andrew Palmer and Jane Hanson. You can find their biographical information on pages 50 and 51.
Andrew Palmer was appointed Chair of the Committee as of 1 March 2016. This appointment was part of the changes to the Committees that were announced on 16 February 2016.
The Investment Committee held four scheduled meetings in 2016. The table below shows attendance at the scheduled meetings:
Scheduled meetings
Percentage attendance
Andrew Palmer (Chair) 4 of 4 100 %Jane Hanson 4 of 4 100 %Clare Thompson1 1 of 1 100 %Note:
1. Attendance is expressed as the number of scheduled meetings attended out of the number of such meetings possible or applicable to attend
The CEO, CFO, CRO, Director of Investment Management and Treasury, and Director of Financial Risk are invited to attend Committee meetings.
The Chair reports on matters dealt with at each Committee meeting to the subsequent scheduled Board meeting.
Direct Line Group Annual Report & Accounts 201674
Andrew PalmerChair of the
Investment Committee

Committee reports continued
74 Direct Line Group Annual Report & Accounts 2016
Investment Committee report
Areas of focus in the reporting period
A slowing global economy, a “lower for longer” interest rate outlook and the EU Referendum shaped the Committee’s concerns when it met in January 2016. The case study on page 75 details how the Committee met the challenge of ensuring: the Company was prepared in advance of the EU Referendum vote; and the investment portfolio was appropriately positioned to respond to events after the vote to leave the EU.
The in-house Investment team undertook a material change of outsource arrangements during the year, moving custody, treasury banking, middle-office and collateral activities to a new provider. The Committee monitored delivery of key milestones and challenged reasons for changes to project plans. The project was executed successfully in 2016.
As part of management’s drive to deliver a cost-effective investment operating model, the Committee has scrutinised a proposal from management to bring certain UK investment grade credit assets in house. The Committee challenged whether the Investment team was in a position to manage in-house a wider range of holdings before approving this initiative.
With the compression in UK yields following the vote to leave the EU, the Committee was concerned to ensure investment discipline remained paramount within new asset classes still being invested to full allocations and investment income budgeting continued to be based on conservative assumptions. The Committee received a presentation from the external asset manager responsible for the CRE loans portfolio and reviewed the assumptions underpinning management’s projections of investment income over 2017-20. In both cases, the Committee was satisfied with responses received to questions raised at respective presentations.
Following the implementation of Solvency II, the Committee wanted to understand: (a) how well management was planning for, and resourcing, the additional reporting on assets and derivatives required under Pillar III; and (b) whether there was sufficient evidence of application of the Prudent Person Principle (“PPP”) to investment activities. Following review the Committee was satisfied that appropriate levels of delegation to management had been put in place; and that management were robustly reviewing investment and risk against the PPP guidelines.
Responsibilities of the Investment Committee The Committee is responsible for the oversight of how the Group develops its investment strategy. It also oversees the management and performance of the Group’s investment portfolio.
The Committee’s main responsibilities are to:
examine the rationale for, and the risks and financial implications of, any proposed changes to the Group’s investment strategy and, where agreed, recommend these changes to the Board.
consider and approve material changes to the risk framework that underpins investment activity, and any proposals to change the operating model. This typically relates to how outsource service providers are used.
review global financial market developments and changes to the regulatory environment, and consider the ongoing appropriateness of investment activities in light of such developments.
monitor the results from investment activities, namely adequacy of financial results delivered, compliance with agreed risk tolerances and external service provider performance. The Committee also ensures that any material breaches are reported to the BRC.
Committee composition, skills and experience and meetings in the year The Committee comprises two independent NEDs: Andrew Palmer and Jane Hanson. You can find their biographical information on pages 50 and 51.
Andrew Palmer was appointed Chair of the Committee as of 1 March 2016. This appointment was part of the changes to the Committees that were announced on 16 February 2016.
The Investment Committee held four scheduled meetings in 2016. The table below shows attendance at the scheduled meetings:
Scheduled meetings
Percentage attendance
Andrew Palmer (Chair) 4 of 4 100 %Jane Hanson 4 of 4 100 %Clare Thompson1 1 of 1 100 %Note:
1. Attendance is expressed as the number of scheduled meetings attended out of the number of such meetings possible or applicable to attend
The CEO, CFO, CRO, Director of Investment Management and Treasury, and Director of Financial Risk are invited to attend Committee meetings.
The Chair reports on matters dealt with at each Committee meeting to the subsequent scheduled Board meeting.
www.directlinegroup.com 75
Case study: EU referendum
In preparation for the UK’s EU membership referendum, the Committee met economists from a major financial institution in April 2016 to obtain an independent third party view of the likely economic consequences of a vote to either remain in, or leave, the EU. In addition, the Committee requested an update from management regarding preparations in advance of the vote. The Committee concluded that preparations, including plans to ensure access to liquidity to meet customer payments, and to support collateral calls, were well developed. In the period following the vote, management updated both the Board and the Committee on market conditions, and in particular the impact of Sterling’s depreciation against both the US Dollar and the Euro on collateral calls for open foreign exchange forward positions.
Concerned that the leave vote could lead to a period of recession in the UK, the Committee (at its meeting in July 2016) requested management to carry out a comprehensive study of all Sterling assets held in the portfolio, in addition to considering any appropriate wider stresses on the entire portfolio, and make recommendations as necessary to position the portfolio for a recession. The Committee reviewed the study conclusions at its subsequent meeting, noting that the portfolio was very well diversified and certain illiquid asset classes had been built defensively from the outset, given the Company was a long-term investor and thus expected to be subject to periods of market turbulence from time to time. Management advised the Committee of some minor sales within the portfolio designed to provide some further defensive positioning, which was in part, the result of examining a recessionary outlook.
Main activities during the year At every scheduled meeting the Committee receives a market update from the Director of Investment Management and Treasury. This includes a report on the economic conditions in the UK, United States of America and the Eurozone; an update on commodity prices, credit markets and interest rates; and anything appropriate for the Committee to know.
Investment strategy The Investment strategy was materially changed in 2015. Because of this, the Committee spent its time reviewing and challenging the new investments. The Committee focused on the three new asset mandates; two investing in global credit and subordinated financial credit, and one investing in Sterling CRE loans which was a new asset class in the Group’s investment portfolio.
Risk framework and operating model As reported in the Annual Report & Accounts 2015, the Committee agreed to proposals to move custody and middle-office services to a new provider. The Committee ensured it received regular updates on the project, including implementation and the benefits achieved since the transfer. The final part of the transfer was completed successfully in November 2016.
Monitoring investment activity and performance The Committee monitored the performance of investments every quarter. It also received reports from the Director of Investment Management and Treasury on various matters. These included: key market developments; financial results from investment activity; investment performance versus benchmark for internally and externally managed portfolios; operational performance by the custodian and other service providers; and compliance with risk limits and internal delegated authorities. The Committee also received presentations from external asset managers on their performance against benchmark.
Solvency II The Committee examined progress on initiatives linked to preparing for Solvency II, notably:
preparing a liquidity plan and contingent management actions.
developing various asset and derivative reports to submit to the PRA and European Insurance and Occupational Pensions Authority.
restructuring the securitised credit portfolio to meet Solvency II requirements.
The Investment Committee’s effectiveness A formal and rigorous annual evaluation of the Committee’s performance and effectiveness was undertaken during the year. Professor Rob Goffee of London Business School facilitated this effectiveness review, and prepared a report based on responses from Committee members and other stakeholders to a questionnaire and interview. After reviewing and discussing the report, the Committee concluded that it was operating effectively and has access to sufficient resources to perform its duties.
The Board reviewed and approved this report on 6 March 2017.
Andrew Palmer Chair of the Investment Committee
www.directlinegroup.com 75
Strategic reportG
overnanceFinancial statem
ents

Committee reports continued
76 Direct Line Group Annual Report & Accounts 2016
Nomination Committee report
Areas of focus in the reporting period
An active Nomination Committee is vital for promoting effective Board and executive succession. During 2016, the majority of the Committee’s time was devoted to considering the composition of the Board. It ensured that the recruitment process for Non-Executive Directors identified the skills and experience that the Board needs to be able to challenge and support senior management in developing and executing the Group’s strategy. It also reviewed executive succession planning, to ensure that the Group’s future leadership will have the qualities needed for the strategic and cultural development of the business. The case study on page 77 details the activities undertaken by the Committee during 2016 on succession planning for the Board and management.
As part of its focus on executive succession planning, and to improve gender and other diversity in the Group’s senior management, the Committee encouraged management to develop its talent pipeline. This is being achieved by the systematic assessment of potential, bespoke personal coaching and development plans for high-potential employees. The Committee also encouraged the targeted recruitment of new senior executives to strengthen leadership and capability in disciplines including strategic development, change management, IT, claims management, data, finance and procurement.
During the reporting period, the Committee oversaw the appointments to the Board of: Richard Ward as Senior Independent Director; Danuta Gray as an independent Non-Executive Director; and Mike Holliday-Williams, MD Personal Lines, as an Executive Director. The Committee recommended changes to the membership of the Board’s Committees to make the best use of Directors’ experience and expertise.
The Committee agreed the choice of Egon Zehnder as search agent and the profile and criteria to be used in the search which culminated in the appointment of Danuta Gray. In view of the lead time for identifying candidates and obtaining regulatory approval in advance of their appointment, and with the aim of ensuring continuity and stability in the Board’s succession planning, the Committee has engaged Egon Zehnder in a search for further Non-Executive Director candidates.
Responsibilities of the Nomination Committee The Committee is responsible for leading the process for Board appointments and making recommendations to the Board. It keeps the Board's structure, size, composition, and balance of skills, experience, independence and expertise under review. It also provides guidance to management on executive succession planning.
The Committee’s main responsibilities are:
considering and recommending to the Board matters regarding appointment of Directors, membership and chairmanship of Board Committees.
succession planning for Directors and other senior executives, accounting for the skills and expertise the Group needs to deliver its strategy.
keeping under review the leadership needs of the Group.
reviewing the Non-Executive Directors’ continued independence.
considering and recommending to the Board the Directors’ annual re-election and reappointment at the end of their term in office.
The Nomination Committee’s main role and responsibilities are set out in written terms of reference and are available at www.directlinegroup.co.uk/termsofreference
Committee composition, skills and experience, and meetings in the year The Committee comprises the Chairman, Mike Biggs, and two independent Non-Executive Directors: Andrew Palmer and Richard Ward. You can find their biographical information on pages 50 to 51.
The Committee held three scheduled meetings in 2016. It also held eight additional meetings to consider succession planning and to deal with: the appointment of Richard Ward as Senior Independent Director; membership of the Board’s Committees; searching and appointing Danuta Gray as a Non-Executive Director; appointing Mike Holliday-Williams as an Executive Director; and appointing an external board effectiveness facilitator.
This table shows attendance at the scheduled meetings:
Scheduled meetings
Percentage attendance
Mike Biggs (Chair) 3 of 3 100%Andrew Palmer 3 of 3 100%Priscilla Vacassin1 1 of 1 100%Richard Ward1 2 of 2 100%Note:
1. Attendance is expressed as the number of scheduled meetings attended out of the number of such meetings possible or applicable to attend
The CEO and the Group Human Resources Director are invited to attend Committee meetings.
The Chair reports on matters dealt with at each Committee meeting to the subsequent scheduled Board meeting.
Direct Line Group Annual Report & Accounts 201676
Mike BiggsChair of the Nomination Committee

Committee reports continued
76 Direct Line Group Annual Report & Accounts 2016
Nomination Committee report
Areas of focus in the reporting period
An active Nomination Committee is vital for promoting effective Board and executive succession. During 2016, the majority of the Committee’s time was devoted to considering the composition of the Board. It ensured that the recruitment process for Non-Executive Directors identified the skills and experience that the Board needs to be able to challenge and support senior management in developing and executing the Group’s strategy. It also reviewed executive succession planning, to ensure that the Group’s future leadership will have the qualities needed for the strategic and cultural development of the business. The case study on page 77 details the activities undertaken by the Committee during 2016 on succession planning for the Board and management.
As part of its focus on executive succession planning, and to improve gender and other diversity in the Group’s senior management, the Committee encouraged management to develop its talent pipeline. This is being achieved by the systematic assessment of potential, bespoke personal coaching and development plans for high-potential employees. The Committee also encouraged the targeted recruitment of new senior executives to strengthen leadership and capability in disciplines including strategic development, change management, IT, claims management, data, finance and procurement.
During the reporting period, the Committee oversaw the appointments to the Board of: Richard Ward as Senior Independent Director; Danuta Gray as an independent Non-Executive Director; and Mike Holliday-Williams, MD Personal Lines, as an Executive Director. The Committee recommended changes to the membership of the Board’s Committees to make the best use of Directors’ experience and expertise.
The Committee agreed the choice of Egon Zehnder as search agent and the profile and criteria to be used in the search which culminated in the appointment of Danuta Gray. In view of the lead time for identifying candidates and obtaining regulatory approval in advance of their appointment, and with the aim of ensuring continuity and stability in the Board’s succession planning, the Committee has engaged Egon Zehnder in a search for further Non-Executive Director candidates.
Responsibilities of the Nomination Committee The Committee is responsible for leading the process for Board appointments and making recommendations to the Board. It keeps the Board's structure, size, composition, and balance of skills, experience, independence and expertise under review. It also provides guidance to management on executive succession planning.
The Committee’s main responsibilities are:
considering and recommending to the Board matters regarding appointment of Directors, membership and chairmanship of Board Committees.
succession planning for Directors and other senior executives, accounting for the skills and expertise the Group needs to deliver its strategy.
keeping under review the leadership needs of the Group.
reviewing the Non-Executive Directors’ continued independence.
considering and recommending to the Board the Directors’ annual re-election and reappointment at the end of their term in office.
The Nomination Committee’s main role and responsibilities are set out in written terms of reference and are available at www.directlinegroup.co.uk/termsofreference
Committee composition, skills and experience, and meetings in the year The Committee comprises the Chairman, Mike Biggs, and two independent Non-Executive Directors: Andrew Palmer and Richard Ward. You can find their biographical information on pages 50 to 51.
The Committee held three scheduled meetings in 2016. It also held eight additional meetings to consider succession planning and to deal with: the appointment of Richard Ward as Senior Independent Director; membership of the Board’s Committees; searching and appointing Danuta Gray as a Non-Executive Director; appointing Mike Holliday-Williams as an Executive Director; and appointing an external board effectiveness facilitator.
This table shows attendance at the scheduled meetings:
Scheduled meetings
Percentage attendance
Mike Biggs (Chair) 3 of 3 100%Andrew Palmer 3 of 3 100%Priscilla Vacassin1 1 of 1 100%Richard Ward1 2 of 2 100%Note:
1. Attendance is expressed as the number of scheduled meetings attended out of the number of such meetings possible or applicable to attend
The CEO and the Group Human Resources Director are invited to attend Committee meetings.
The Chair reports on matters dealt with at each Committee meeting to the subsequent scheduled Board meeting.
www.directlinegroup.com 77
Case study: succession planning
Your Board needs a balance of experience, expertise and diversity, to support the quality of the Board’s debate and to be able to encourage and challenge senior management to develop and execute a sustainable strategy. In addition to its three scheduled formal meetings, the Committee convened a further eight meetings throughout 2016 to pursue its succession planning agenda. The Committee oversaw the process of recruiting a new Non-Executive Director following Priscilla Vacassin’s retirement from the Board in March 2016. With the objective of staggering Non-Executive Directors’ terms of appointment to ensure continuity and stability, the Committee also launched a search for a further two Non-Executive Directors in the last quarter of the year. Since the year end, Danuta Gray has been appointed as a Non-Executive Director and Mike Holliday-Williams, MD Personal Lines, has been appointed as an Executive Director.
The Committee has actively supported the management team in generating and maintaining a pipeline of potential future leaders who reflect the Group’s diversity and cultural values and who contribute to and develop the capability to evolve the business and drive good outcomes for all our customers and stakeholders.
The Committee has encouraged management to identify and develop high potential individuals, and create a working environment in which our talented women can also rise to senior management positions. The Committee will monitor progress in achieving the targets committed to by the Group in subscribing to the Women in Finance Charter.
Main activities during the year Succession planning The Committee places great importance on Board and executive succession planning and monitors its progress as a standing agenda item at each of its scheduled meetings. The Committee guides management in executive succession planning.
Board composition During the year, the Committee: considered the Board’s skills and experience; reviewed the structure, size and composition of the Board; reviewed the membership and chairmanship of the Board’s Committees; and reviewed Non-Executive Directors’ letters of appointment, terms of appointment and time commitment.
Board changes The Company appointed Richard Ward as Senior Independent Director on 18 January 2016. Priscilla Vacassin stepped down from the Board on 1 March 2016 and the Committee recommended to the Board a number of changes to the chairmanship and membership of the Board’s Committees, which the Board subsequently approved and were announced on 16 February 2016. The Committee also recommended the appointment of Richard Ward as a member of the BRC, which the Board subsequently approved. Following a recommendation from the Committee, the Board appointed Danuta Gray as a Non-Executive Director, and Mike Holliday-Williams, Managing Director Personal Lines, as an Executive Director on 1 February 2017. Following a further recommendation from the Committee, the Board approved the appointment of Danuta Gray as a member of the Remuneration Committee on 6 March 2017.
Board appointment and reappointment process The Committee oversaw the process to appoint Danuta Gray as a Non-Executive Director. The Committee reviewed the Board members’ expertise and experience. It then produced a detailed brief and engaged external search consultants, Egon Zehnder, to find suitable candidates. Egon Zehnder is a signatory to the Voluntary Code of Conduct for executive search firms. It is not connected in any way to the Company.
Egon Zehnder prepared a long list of candidates of appropriate merit from diverse backgrounds. The Committee agreed a shortlist and interviewed candidates. It then approached the PRA and FCA for approval, and recommended appointing Danuta Gray as a Non-Executive Director to the Board. The Committee recommended the appointment of Mike Holliday-Williams to the Board in recognition of his leadership of the Personal Lines business and to leverage his expertise for the benefit of all of the Group’s businesses.
As Danuta Gray and Mike Holliday-Williams were appointed since the last AGM, they will submit themselves for election at the Company’s 2017 AGM. Danuta Gray is considered independent within the Code’s meaning.
Electing and re-electing Directors Before recommending the proposed election and re-election of Directors at the 2016 AGM, the Committee reviewed the independence of Non-Executive Directors. It concluded that Jane Hanson, Sebastian James, Andrew Palmer, Clare Thompson and Richard Ward were all independent within the Code’s meaning. Andrew Palmer has served on the Board since March 2011, and his performance and independence were subject to a particularly rigorous review by the Committee pursuant to the requirements of the Code. The Board is satisfied that he remains independent, continues to make a significant contribution to the Board and its Committees, and provides valuable continuity to the Board. Mike Biggs was independent when appointed as Chairman. The Committee recommended to the Board and shareholders to elect and re-elect all serving Directors at the Company’s 2016 AGM.
www.directlinegroup.com 77
Strategic reportG
overnanceFinancial statem
ents

Committee reports continued
78 Direct Line Group Annual Report & Accounts 2016
Diversity The Group celebrates the diversity of its workforce. It seeks to recruit the best candidates for all positions throughout the business. At the date of this report, three of the Group’s 10 Directors are women, which equates to 30% of the Board. This exceeds the target set in Lord Davies’ Women on Boards Review Five Year Summary published in October 2015, to be achieved by 2020. The Board also acknowledges the benefits of diversity.
You can find out more about the Group’s approach to diversity in the CSR report on pages 32 and 33.
Board Effectiveness Review In the three-year cycle recommended by the Code, 2016 was the year in which the Company should appoint an external facilitator to run the Board and Committee effectiveness review. The Nomination Committee scrutinised a list of potential external facilitators drawn up by the Company Secretary and recommended the appointment of Professor Rob Goffee of London Business School, whose field of expertise is organisational behaviour and leadership development. The Board subsequently approved his appointment as the external facilitator.
The Nomination Committee’s effectiveness A formal and rigorous annual evaluation of the Committee’s performance and effectiveness was undertaken during the year. Professor Rob Goffee of London Business School facilitated this effectiveness review, and prepared a report based on responses from Committee members and other stakeholders to a questionnaire and interview. After reviewing and discussing the report, the Committee concluded that it was operating effectively and has access to sufficient resources to perform its duties.
The Board reviewed and approved this report on 6 March 2017.
Michael N Biggs Chair of the Nomination Committee
Direct Line Group Annual Report & Accounts 201678

Committee reports continued
78 Direct Line Group Annual Report & Accounts 2016
Diversity The Group celebrates the diversity of its workforce. It seeks to recruit the best candidates for all positions throughout the business. At the date of this report, three of the Group’s 10 Directors are women, which equates to 30% of the Board. This exceeds the target set in Lord Davies’ Women on Boards Review Five Year Summary published in October 2015, to be achieved by 2020. The Board also acknowledges the benefits of diversity.
You can find out more about the Group’s approach to diversity in the CSR report on pages 32 and 33.
Board Effectiveness Review In the three-year cycle recommended by the Code, 2016 was the year in which the Company should appoint an external facilitator to run the Board and Committee effectiveness review. The Nomination Committee scrutinised a list of potential external facilitators drawn up by the Company Secretary and recommended the appointment of Professor Rob Goffee of London Business School, whose field of expertise is organisational behaviour and leadership development. The Board subsequently approved his appointment as the external facilitator.
The Nomination Committee’s effectiveness A formal and rigorous annual evaluation of the Committee’s performance and effectiveness was undertaken during the year. Professor Rob Goffee of London Business School facilitated this effectiveness review, and prepared a report based on responses from Committee members and other stakeholders to a questionnaire and interview. After reviewing and discussing the report, the Committee concluded that it was operating effectively and has access to sufficient resources to perform its duties.
The Board reviewed and approved this report on 6 March 2017.
Michael N Biggs Chair of the Nomination Committee
www.directlinegroup.com 79
Remuneration Committee report
Areas of focus in the reporting period
The Directors’ remuneration policy was approved at the Company’s 2014 AGM, and the Company is required to submit a new remuneration policy for shareholder approval at the 2017 AGM. The case study on page 80 explains how the Committee: reviewed the remuneration policy; challenged how Directors’ reward structures were aligned to the Group’s strategic objectives; and participated in the consultation process with major shareholders and governance agencies.
During the year the Committee agreed a customer and people measure for the 2017 AIP. The Committee considered the most appropriate mix of customer and people targets, taking into account that the Company had joined the HM Treasury initiative, Women in Finance. This initiative connected certain aspects of remuneration to appropriate targets. To ensure that the targets were challenging, a member of the Committee considered the supporting documentation and underlying processes. The Committee then discussed the targets before approving them.
Prior to any awards vesting under the LTIP and deferred AIP schemes the Committee considered whether the financial and risk underpins had been met. It received confirmation from the Chair of the BRC that there had been no material risk failings, regulatory or reputational concerns. The Chair of the Audit Committee confirmed that there had been no circumstances regarding the adequacy and effectiveness of the Group’s internal financial controls and internal control systems that would affect the vesting. The Committee approved the vesting of awards.
The Committee considered whether the performance targets of RoTE and TSR remain appropriate and in line with the Group’s strategic objectives. When considering awards under the LTIP scheme the Committee considered the appropriate targets to ensure that they remain challenging in the context of the Group’s planned performance.
The Committee reviewed the submission of the Remuneration Policy Statement to the PRA, which was a new Solvency II requirement. The statement contained details of the remuneration policy that applied throughout the Group as well as particular requirements for Solvency II identified staff.
Responsibilities of the Remuneration Committee The Committee is responsible for setting and providing oversight of how the Group implements its remuneration policy. The Committee oversees the level and structure of remuneration arrangements for senior executives. It also approves share incentive plans, and recommends them to the Board and shareholders. Where applicable, it also oversees share plan changes that need shareholder approval.
The Committee’s main responsibilities are:
setting the remuneration policy for the Executive Directors and Board Chairman and monitoring its operation.
recommending and monitoring the level and structure of remuneration for senior executives and Solvency II identified staff.
considering how the Group’s strategy or performance might affect its remuneration policy.
approving the Group’s remuneration governance framework. This includes approving the design and targets of any performance-related pay arrangements, and liaising with the Board Risk and Audit Committees where appropriate.
The Remuneration Committee’s main role and responsibilities are set out in written terms of reference and are available at www.directlinegroup.co.uk/termsofreference
Committee composition, skills and experience and meetings in the year The Committee comprised three independent NEDs in 2016: Clare Thompson, Sebastian James and Andrew Palmer, and the Chairman of the Board, Mike Biggs. Danuta Gray was appointed a member of the Committee on 6 March 2017. You can find their biographical information on pages 50 and 51.
The Remuneration Committee held five scheduled meetings in 2016. Two sub-committee meetings were also held to approve the LTIP vesting and grants. Two additional meetings were held to discuss the remuneration policy. This table shows attendance at the scheduled meetings:
Scheduled meetings
Percentage attendance
Clare Thompson1 (Chair) 3 of 3 100%Mike Biggs 5 of 5 100%Sebastian James 5 of 5 100%Andrew Palmer 5 of 5 100%Priscilla Vacassin1 2 of 2 100%
Note:
1. Attendance is expressed as the number of scheduled meetings attended out of the number of such meetings possible or applicable to attend
The CEO, Group Human Resources Director and senior representatives of the Human Resources function are invited to attend Committee meetings. FIT Remuneration Consultants LLP (“FIT”), who act as independent advisers to the Committee, also attend Committee meetings. The Chair reports on matters dealt with at each Committee meeting to the subsequent scheduled Board meeting.
www.directlinegroup.com 79
Strategic reportG
overnanceFinancial statem
ents
Clare ThompsonChair of the
Remuneration Committee

Committee reports continued
80 Direct Line Group Annual Report & Accounts 2016
Main activities during the year Review of remuneration policy As we approached the end of the first three-year cycle since the introduction of the new remuneration reporting regulations, the current Directors’ remuneration policy, that was approved at the Company’s 2014 AGM, is due for review. The new remuneration policy will be submitted to shareholders’ binding vote at the 2017 AGM and will be expected to remain in place for the next three years.
Annual incentive plan During the year, the Committee monitored the operation of the AIP. For the 2015 financial year, this involved reviewing the Group’s financial performance and assessing the Group’s performance against the targets that the Committee set at the start of the year. It also received reports from the Chairs of the Audit Committee and BRC about whether the Group had achieved the required performance within risk appetite. The Committee concluded that no clawback of awards was required in 2016.
For the 2016 financial year, the Committee approved the performance metrics and monitored performance against them. The Committee also discussed and challenged the performance metrics for the 2017 AIP and, subsequently approved the metrics. The Committee discussed proposed new customer and people measures and was satisfied that the proposed measures were sufficiently challenging. The Committee scrutinised the new approach to performance management that was introduced for 2016 and commended management on simplifying the appraisal process.
Long-term incentives During 2016, the Committee reviewed and approved the level of vesting of the 2013 awards made under the Company’s LTIP against the performance criteria. These awards had two performance metrics based on RoTE and TSR. After assessing performance against these metrics, the awards vested at a level of 96.4%. Before vesting, the Committee considered the LTIP’s financial and risk underpins. The Committee also determined the quantum of awards made in 2016 under the LTIP in view of business and individual performance.
Directors and other senior executives During the year, the Committee reviewed and approved the level and structure of the pay and incentives of the Executive Directors and other senior executives. Additionally, it reviewed remuneration for the strategic leadership team. As part of this review, the Committee considered the Share Ownership Guidelines for the Executive Directors and Executive Committee members.
Case study: Directors’ remuneration policy
Review: Initially the Committee undertook a fundamental review of remuneration arrangements for the strategic leadership team (including Executive Directors and Executive Committee members). The Committee was supported in the review by management and FIT. The structure of the review team was designed to minimise any conflicts of interest when analysing current remuneration arrangements.
The review included interviews with members of the Remuneration Committee and Executive Committee in order to capture views on the current remuneration structures, test the appropriateness of the remuneration arrangements and to consider how they furthered the Group’s strategy and long-term interests. A report was then produced by FIT on their findings for the Committee’s strategy day.
Consider: At the strategy day the Committee reviewed the current remuneration policy, and considered alternatives in the light of the Group’s objectives, regulatory and market landscape and highlighted areas in which it considered changes could be made so that formal proposals could be put forward to the Committee. The Committee also considered areas which were not currently in the remuneration policy and could be added.
The proposed changes to the Directors’ remuneration policy were then considered against: the Group’s strategic objectives; statutory and regulatory requirements; and investors published guidance. Following the review the Committee identified a number of changes to the remuneration policy and wrote to major shareholders and a number of governance agencies advising them of the proposals and asking for their views on them.
Consult: The Committee continued to consider the proposals in the light of subsequent guidance issued from August 2016 to 31 December 2016 by organisations such as the Investment Association, the Executive Remuneration Working Group, the General Counsel and Company Secretaries of FTSE 100 companies (“GC100”) and Legal & General Investment Management’s principles. The Committee concluded its consultation with major shareholders, the investor community and governance agencies in January 2017.
The proposals were generally well received and based on the responses adjustments were made to the proposed remuneration policy. You can find out more about the Directors’ remuneration policy to be voted on by shareholders at the 2017 AGM on pages 100 to 109.
Direct Line Group Annual Report & Accounts 201680

Committee reports continued
80 Direct Line Group Annual Report & Accounts 2016
Main activities during the year Review of remuneration policy As we approached the end of the first three-year cycle since the introduction of the new remuneration reporting regulations, the current Directors’ remuneration policy, that was approved at the Company’s 2014 AGM, is due for review. The new remuneration policy will be submitted to shareholders’ binding vote at the 2017 AGM and will be expected to remain in place for the next three years.
Annual incentive plan During the year, the Committee monitored the operation of the AIP. For the 2015 financial year, this involved reviewing the Group’s financial performance and assessing the Group’s performance against the targets that the Committee set at the start of the year. It also received reports from the Chairs of the Audit Committee and BRC about whether the Group had achieved the required performance within risk appetite. The Committee concluded that no clawback of awards was required in 2016.
For the 2016 financial year, the Committee approved the performance metrics and monitored performance against them. The Committee also discussed and challenged the performance metrics for the 2017 AIP and, subsequently approved the metrics. The Committee discussed proposed new customer and people measures and was satisfied that the proposed measures were sufficiently challenging. The Committee scrutinised the new approach to performance management that was introduced for 2016 and commended management on simplifying the appraisal process.
Long-term incentives During 2016, the Committee reviewed and approved the level of vesting of the 2013 awards made under the Company’s LTIP against the performance criteria. These awards had two performance metrics based on RoTE and TSR. After assessing performance against these metrics, the awards vested at a level of 96.4%. Before vesting, the Committee considered the LTIP’s financial and risk underpins. The Committee also determined the quantum of awards made in 2016 under the LTIP in view of business and individual performance.
Directors and other senior executives During the year, the Committee reviewed and approved the level and structure of the pay and incentives of the Executive Directors and other senior executives. Additionally, it reviewed remuneration for the strategic leadership team. As part of this review, the Committee considered the Share Ownership Guidelines for the Executive Directors and Executive Committee members.
Case study: Directors’ remuneration policy
Review: Initially the Committee undertook a fundamental review of remuneration arrangements for the strategic leadership team (including Executive Directors and Executive Committee members). The Committee was supported in the review by management and FIT. The structure of the review team was designed to minimise any conflicts of interest when analysing current remuneration arrangements.
The review included interviews with members of the Remuneration Committee and Executive Committee in order to capture views on the current remuneration structures, test the appropriateness of the remuneration arrangements and to consider how they furthered the Group’s strategy and long-term interests. A report was then produced by FIT on their findings for the Committee’s strategy day.
Consider: At the strategy day the Committee reviewed the current remuneration policy, and considered alternatives in the light of the Group’s objectives, regulatory and market landscape and highlighted areas in which it considered changes could be made so that formal proposals could be put forward to the Committee. The Committee also considered areas which were not currently in the remuneration policy and could be added.
The proposed changes to the Directors’ remuneration policy were then considered against: the Group’s strategic objectives; statutory and regulatory requirements; and investors published guidance. Following the review the Committee identified a number of changes to the remuneration policy and wrote to major shareholders and a number of governance agencies advising them of the proposals and asking for their views on them.
Consult: The Committee continued to consider the proposals in the light of subsequent guidance issued from August 2016 to 31 December 2016 by organisations such as the Investment Association, the Executive Remuneration Working Group, the General Counsel and Company Secretaries of FTSE 100 companies (“GC100”) and Legal & General Investment Management’s principles. The Committee concluded its consultation with major shareholders, the investor community and governance agencies in January 2017.
The proposals were generally well received and based on the responses adjustments were made to the proposed remuneration policy. You can find out more about the Directors’ remuneration policy to be voted on by shareholders at the 2017 AGM on pages 100 to 109.
www.directlinegroup.com 81
Solvency II identified staff The Committee reviewed and approved the staff who, for the purposes of Solvency II, were identified as Solvency II staff. The Committee’s remit was extended to include oversight of the remuneration of Solvency II identified staff. The Committee also reviewed and approved a remuneration policy statement for submission to the PRA. The Committee considered and examined the current remuneration structure for control functions, which are Corporate Actuarial, Compliance, Group Audit and Risk. The Committee is satisfied that the remuneration arrangements for control functions are appropriate but will continue to review developments in this area.
Remuneration strategy In addition to the scheduled Committee meetings, the Committee held an additional meeting to review the remuneration framework and ensure that it was aligned to the Group strategy, and to set future priorities.
Regulatory developments in Remuneration During the year, a joint meeting was held with the BRC to review regulatory developments in relation to remuneration and to ensure remuneration arrangements remain appropriate. The Committees also examined the assurance processes in connection with incentive arrangements. You can find out more about this in the Board Risk Committee report on pages 68 to 71.
Additional information The Committee also interacts with the Audit Committee and BRC when considering setting targets and pay-outs. As part of this, the Committee receives reports from the Chairs of those Committees at least twice a year. The Chair of the Audit Committee is a member of the Committee. The Chair of the Board Risk Committee attended Committee meetings on three occasions.
The Remuneration Committee’s effectiveness A formal and rigorous annual evaluation of the Committee’s performance and effectiveness was undertaken during the year. Professor Rob Goffee of London Business School facilitated this effectiveness review and prepared a report based on responses from Committee members and other stakeholders to a questionnaire and interview. After reviewing and discussing the report, the Committee concluded it was operating effectively and has access to sufficient resources to perform its duties.
The Board reviewed and approved this report on 6 March 2017.
Clare Thompson Chair of the Remuneration Committee
www.directlinegroup.com 81
Strategic reportG
overnanceFinancial statem
ents

Directors’ remuneration report
82 Direct Line Group Annual Report & Accounts 2016
Dear shareholders
As the Chair of the Remuneration Committee (the “Committee”), I am pleased to introduce our report on Directors’ remuneration for the 2016 financial year, including our proposed Directors’ remuneration policy.
We have set out this report in the following sections:
Section Pages
Executive remuneration snapshot – summarising the remuneration arrangements for Executive Directors 84 to 86Annual report on remuneration – detailing pay outcomes for 2016 and covering how the Group will implement its remuneration policy in 2017 87 to 99Policy report for shareholder approval 100 to 109
The Directors’ remuneration policy for shareholder approval at the 2017 AGM Our Directors’ remuneration policy was approved at the Company’s AGM on 13 May 2014 by a significant majority of shareholders (97.5% voted in favour). In accordance with the legislation, we must submit a new policy for shareholder approval at the 2017 AGM. As stated in the 2015 Directors’ remuneration report, the Committee reviewed the current policy during 2016. The Committee concluded that the policy had supported the business effectively and operated well over the last three years.
The policy provides a clear and simple framework for remunerating the Company’s Directors, and aligning the Executive Directors’ variable pay opportunity to the business strategy and the Company’s demonstrable success.
Shareholders may be aware that the design of executive pay arrangements for UK-listed companies continues to face considerable external commentary. As part of the review the Committee considered alternative approaches to remuneration arrangements, particularly those outlined in the Executive Remuneration Working Group’s final report. The Committee considers that the existing arrangements work well, and that the mix of Annual Incentive Plan (“AIP” or annual bonus) and Long-Term Incentive Plan (“LTIP”) provides a balanced way of incentivising executives to deliver for shareholders in the short and longer terms. We consider the LTIP measures of RoTE and relative TSR to be relatively simple to set, aligned with wider strategy and reward consistent delivery for shareholders. The Committee will closely monitor regulatory, market and best practice developments over the coming years, including any guidance from the PRA regarding the design of pay arrangements.
The Committee therefore intends to continue with the current policy which will remain largely unchanged. Reflecting developments in best practice, the Committee has introduced a ‘holding period’ for Executive Directors. LTIP awards granted from August 2017 onwards will be subject to an additional two-year holding period following the end of the three-year performance period.
The LTIP rules will be amended to reflect the introduction of a holding period.
Shareholder consultation The Committee consulted with our key shareholders and the major institutional voting agencies between October 2016 and January 2017. This engagement was well received and we have had good feedback on our proposal.
New Executive Director Following the year end, Mike Holliday-Williams, MD Personal Lines, joined the Board. He did not receive an increase in his salary as a result of being promoted to the Board (beyond the average salary increase for employees across the rest of the organisation explained below) and his AIP and LTIP opportunity from 2017 onwards were set at the same level as those of the CFO.
He initially joined the Group as an executive in 2014 and has participated in the Company’s remuneration arrangements on a similar basis to the Executive Directors since then. He received an award on joining to buy-out shares forfeited on leaving his previous employer with the last tranche (worth c.£107,000 at grant) vesting in May 2017. The award was not affected by his promotion to the Board.
Approach to pay in 2017 In addition to the proposed introduction of a post-vesting holding period as described above, we set out below our approach to pay for Executive Directors in 2017:
The salaries of all three Executive Directors will increase by 2% in April 2017. This is the same as the average salary increase for employees across the rest of the organisation.
No change will be made to either the weighting or the approach to assessment of the financial metric under the AIP. Consistent with regulatory best practice, we measure performance across a balanced scorecard of measures to ensure that management maintain an appropriate focus on continuing to deliver an excellent customer experience. However, given the good progress that has been made on the customer experience and the importance of the people agenda, the strategic element will now encompass both people and customer targets under the overall 25% weighting assigned to this element.
We are not proposing any changes to the performance conditions for the 2017 awards under the LTIP. However we will be increasing the level of RoTE required for the March 2017 awards to vest from the current range of 14.5% to 17.5% to a range of 15.0% to 18.0%. This will ensure that awards to Executive Directors will only vest in full if significant value has been delivered to shareholders. Due to the level of uncertainty around the Ogden discount rate review, the Remuneration Committee will further consider the RoTE target to be applied to the August 2017 grant and the outcome of the Committee’s considerations will be confirmed at grant in August 2017.
The Company continues to operate a Buy-As-You-Earn Share Incentive Plan (“SIP”) which is available to all eligible staff as a means of purchasing Company shares in an easy and tax efficient manner.
Direct Line Group Annual Report & Accounts 201682

www.directlinegroup.com 83
Pay outcomes for 2016 By focusing on the value, service and brand propositions we offer to our customers, and maintaining underwriting discipline, 2016 was another strong year for the Group. Before the reduction in the Ogden discount rate announced on 27 February 2017 (being two months following the year end), PBT was £570.3m (up 12.4% on 2015). This would have likely delivered a maximum payment of 55% of the AIP linked to this measure. This post-year-end announcement led to the Board adjusting the PBT, which reduced to £353.0m as explained in the Chairman’s introduction to this report and accounts.
In determining pay-out levels, the Committee carefully considered performance in its assessment of over or underperformance of the target. It applied overall judgement in light of the year-end corporate performance and decided an out-turn of 10% (out of the 55% available for PBT) was appropriate and should be payable under this element. The Committee concluded that given the strong profit progress absent the Ogden discount rate change, a small level of vesting recognised both the exceptional timing of this announcement and, therefore, the impossibility of management taking any mitigating steps and the need to align with the experience of shareholders.
The Committee understands that the Government is considering a further review of the approach to setting the Ogden discount rate which may or may not lead to a further change to the Ogden discount rate. In these exceptional circumstances and, given that the impact of the post-year-end announcement was to reduce this element from paying out at the likely full 55% to 10%, the Committee will keep the out-turn under the 2016 AIP assessment under review until the end of 2017. If, during 2017, in connection with the consultation the Ogden discount rate is raised from minus 0.75%, the Committee will recalculate the out-turn for this element and adjust it accordingly; the impact of such a subsequent change in the Ogden discount rate would be excluded from the 2017 AIP.
Accordingly, the incentive outcomes for our Executive Directors were as follows:
We awarded bonuses of 43% of the maximum to the Chief Executive Officer and to the Chief Financial Officer for 2016. We have detailed the bonus determination process for 2016 on pages 88 and 89.
Awards under the LTIP granted in March and August 2013 vested during 2016. They were subject to TSR performance over the three-year vesting period, and RoTE performance in 2013, 2014 and 2015. As disclosed last year, the Group achieved an average RoTE of 17.6% over the three-year performance period. This resulted in 94% of the maximum potential vesting of the RoTE element (56.4% of the total award). The TSR element comprises the other 40% of the total award. For the March 2013 and August 2013 awards, the Company’s TSR was positioned above upper quintile against its comparator group. This resulted in 100% of the maximum potential vesting under the TSR element. Overall, 96.4% of the total awards vested in March 2016 and August 2016. You can find details of this on page 90.
Awards under the LTIP granted in March and August 2014 are due to vest during 2017. This is subject to the Committee’s satisfaction that the financial and risk underpins have been met at the end of the vesting period. The RoTE performance period for these awards ended on 31 December 2016. The three-year average RoTE performance for 2014, 2015 and 2016 was 16.2% against a maximum target of 17.0%. Awards under the RoTE element are due to vest at 76% of the maximum potential, again reflecting the returns delivered to shareholders. The Committee’s practice has not been to moderate the LTIP outcome for exceptional events and, therefore, the formulaic result was approved with no adjustment. Consistent with the regulations, the TSR element of the awards due to vest during 2017 will be reported separately next year. We have included these RoTE vesting outcomes plus the TSR vestings from the 2013 awards in the single remuneration figure for the CEO and the CFO. You can find details of this on pages 87 and 90.
Voting on the annual remuneration report and the policy report We will put the policy report and annual report on remuneration to a vote of shareholders at the AGM on 11 May 2017.
I hope you will support the resolutions.
Clare Thompson Chair of the Remuneration Committee
www.directlinegroup.com 83
Strategic reportG
overnanceFinancial statem
ents
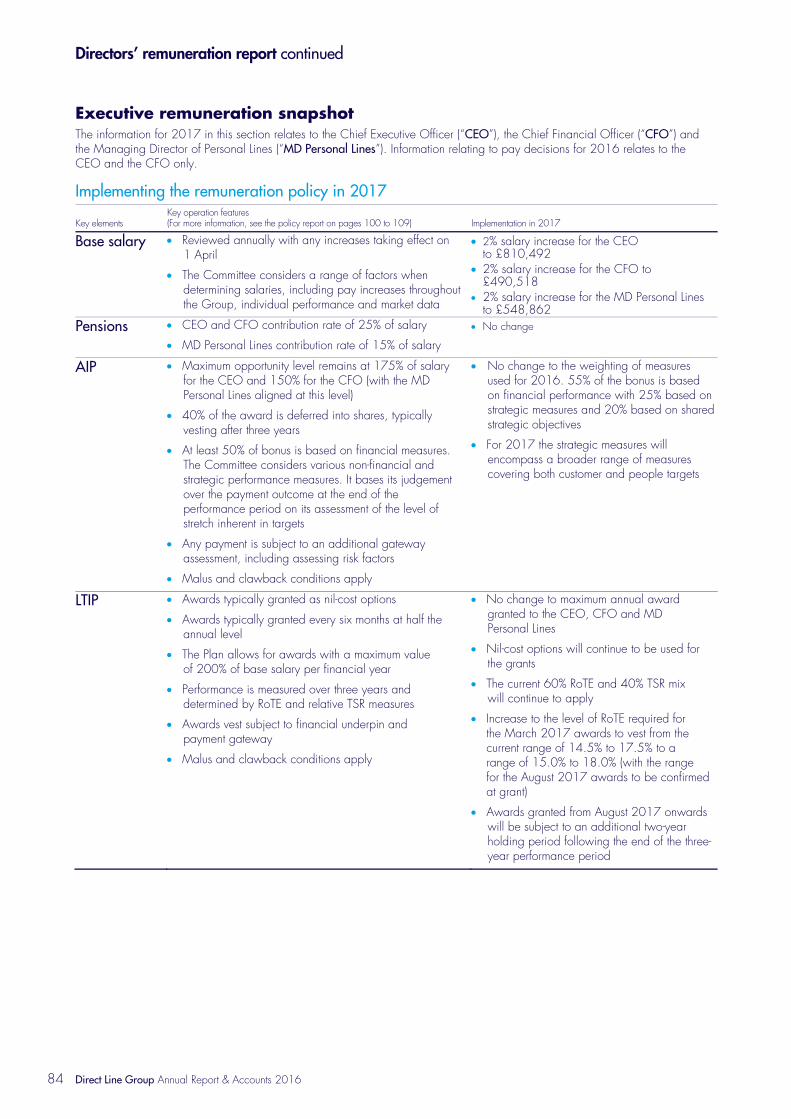
Directors’ remuneration report continued
84 Direct Line Group Annual Report & Accounts 2016
Executive remuneration snapshot The information for 2017 in this section relates to the Chief Executive Officer (“CEO”), the Chief Financial Officer (“CFO”) and the Managing Director of Personal Lines (“MD Personal Lines”). Information relating to pay decisions for 2016 relates to the CEO and the CFO only.
Implementing the remuneration policy in 2017
Key elements Key operation features (For more information, see the policy report on pages 100 to 109) Implementation in 2017
Base salary Reviewed annually with any increases taking effect on 1 April
The Committee considers a range of factors when determining salaries, including pay increases throughout the Group, individual performance and market data
2% salary increase for the CEO to £810,492
2% salary increase for the CFO to £490,518
2% salary increase for the MD Personal Lines to £548,862
Pensions CEO and CFO contribution rate of 25% of salary
MD Personal Lines contribution rate of 15% of salary
No change
AIP Maximum opportunity level remains at 175% of salary for the CEO and 150% for the CFO (with the MD Personal Lines aligned at this level)
40% of the award is deferred into shares, typically vesting after three years
At least 50% of bonus is based on financial measures. The Committee considers various non-financial and strategic performance measures. It bases its judgement over the payment outcome at the end of the performance period on its assessment of the level of stretch inherent in targets
Any payment is subject to an additional gateway assessment, including assessing risk factors
Malus and clawback conditions apply
No change to the weighting of measures used for 2016. 55% of the bonus is based on financial performance with 25% based on strategic measures and 20% based on shared strategic objectives
For 2017 the strategic measures will encompass a broader range of measures covering both customer and people targets
LTIP Awards typically granted as nil-cost options
Awards typically granted every six months at half the annual level
The Plan allows for awards with a maximum value of 200% of base salary per financial year
Performance is measured over three years and determined by RoTE and relative TSR measures
Awards vest subject to financial underpin and payment gateway
Malus and clawback conditions apply
No change to maximum annual award granted to the CEO, CFO and MD Personal Lines
Nil-cost options will continue to be used for the grants
The current 60% RoTE and 40% TSR mix will continue to apply
Increase to the level of RoTE required for the March 2017 awards to vest from the current range of 14.5% to 17.5% to a range of 15.0% to 18.0% (with the range for the August 2017 awards to be confirmed at grant)
Awards granted from August 2017 onwards will be subject to an additional two-year holding period following the end of the three-year performance period
Direct Line Group Annual Report & Accounts 201684

www.directlinegroup.com 85
2016 pay decisions reflect performance achieved during the year Aligning performance and reward The Committee has considered performance over 2016, as demonstrated by achieving key performance indicators on pages 24 and 25. As a result of this performance, the Remuneration Committee has approved the following incentive outcomes for the Executive Directors.
Achievement under the Annual Incentive Plan The actual amounts earned from the AIP this year reflect performance in 2016. 60% of this amount will be payable in March 2017 and 40% will be deferred into shares for three years and generally be contingent on continued employment.
Maximum
(% of salary)Target
(% of salary)Actual
(% of salary) Actual
(£’000)
CEO 175% 105% 75% £594CFO 150% 90% 65% £308
Further details of performance against targets set is set out on pages 88 to 89.
Release of value under the Long-Term Incentive Plan The March and August 2013 awards under the LTIP vested in March and August 2016. The total value of the awards vesting at the end of the three-year performance period in March and August 2016, including shares vesting under the RoTE and TSR elements, was £3,294,930 to the CEO and £1,994,284 to the CFO. This compares with an increase of approximately £2 billion in the Company’s value plus £1.6 billion returned to shareholders as dividends over the period of March 2013 to August 2016.
Notes:
1. The headline vesting level was 96.4% and the above chart shows the impact of both dividend roll-up and share price appreciation 2. The difference in shares held at grant reflects the impact of the share consolidation on 30 June 2015 in which 12 existing Ordinary Shares
were replaced by 11 new Ordinary Shares, meaning the aggregate number of Ordinary Shares in issue was reduced
www.directlinegroup.com 85
Strategic reportG
overnanceFinancial statem
ents
15%47% 38%
Release of value under the LTIP(£)Chief Executive Officer
Grant
Vesting
Grant
Vesting
ChiefFinancial Officer
£0m £0.5m £1.0m £1.5m £2.0m £2.5m £3.0m £3.5m
Shares under award Reinvested dividend Share price growth
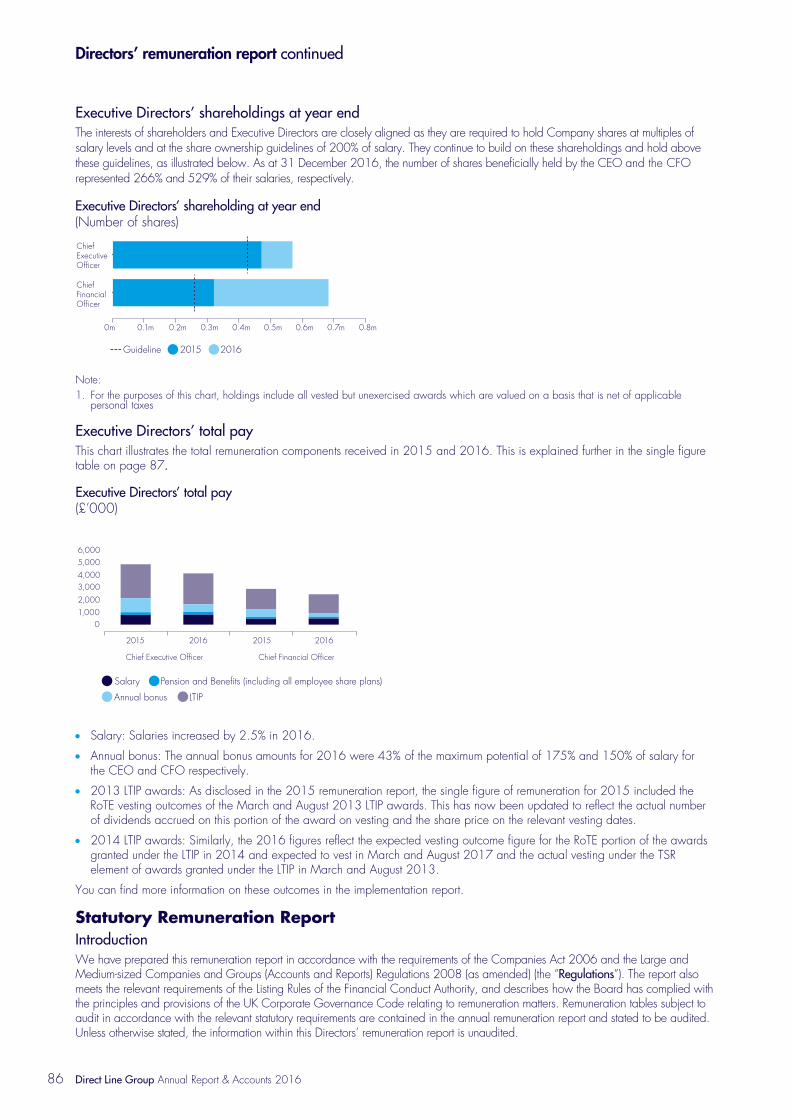
Directors’ remuneration report continued
86 Direct Line Group Annual Report & Accounts 2016
Executive Directors’ shareholdings at year end The interests of shareholders and Executive Directors are closely aligned as they are required to hold Company shares at multiples of salary levels and at the share ownership guidelines of 200% of salary. They continue to build on these shareholdings and hold above these guidelines, as illustrated below. As at 31 December 2016, the number of shares beneficially held by the CEO and the CFO represented 266% and 529% of their salaries, respectively.
Note: 1. For the purposes of this chart, holdings include all vested but unexercised awards which are valued on a basis that is net of applicable
personal taxes
Executive Directors’ total pay This chart illustrates the total remuneration components received in 2015 and 2016. This is explained further in the single figure table on page 87.
Salary: Salaries increased by 2.5% in 2016.
Annual bonus: The annual bonus amounts for 2016 were 43% of the maximum potential of 175% and 150% of salary for the CEO and CFO respectively.
2013 LTIP awards: As disclosed in the 2015 remuneration report, the single figure of remuneration for 2015 included the RoTE vesting outcomes of the March and August 2013 LTIP awards. This has now been updated to reflect the actual number of dividends accrued on this portion of the award on vesting and the share price on the relevant vesting dates.
2014 LTIP awards: Similarly, the 2016 figures reflect the expected vesting outcome figure for the RoTE portion of the awards granted under the LTIP in 2014 and expected to vest in March and August 2017 and the actual vesting under the TSR element of awards granted under the LTIP in March and August 2013.
You can find more information on these outcomes in the implementation report.
Statutory Remuneration Report Introduction We have prepared this remuneration report in accordance with the requirements of the Companies Act 2006 and the Large and Medium-sized Companies and Groups (Accounts and Reports) Regulations 2008 (as amended) (the “Regulations”). The report also meets the relevant requirements of the Listing Rules of the Financial Conduct Authority, and describes how the Board has complied with the principles and provisions of the UK Corporate Governance Code relating to remuneration matters. Remuneration tables subject to audit in accordance with the relevant statutory requirements are contained in the annual remuneration report and stated to be audited. Unless otherwise stated, the information within this Directors’ remuneration report is unaudited.
Direct Line Group Annual Report & Accounts 201686
Guideline 2015 2016
15%47%38%
Executive Directors’ shareholding at year end(Number of shares)
Chief Financial Officer
ChiefExecutive Officer
0m 0.2m0.1m 0.3m 0.4m 0.5m 0.6m 0.7m 0.8m
Salary
Annual bonus
Pension and Benefits (including all employee share plans)
LTIP
31%
Executive Directors’ total pay(£’000)
Chief Executive Officer
2015 2016
1,000
2015 2016
2,000
3,0004,000
5,0006,000
0
Chief Financial Officer

www.directlinegroup.com 87
Annual remuneration report Remuneration Committee members and governance The following list details members of the Remuneration Committee during 2016. You can find information about each member’s attendance at meetings in the Remuneration Committee report on pages 79 to 81. You can find their biographies on pages 50 and 51.
Committee Chair Clare Thompson1 Non-Executive Directors Mike Biggs Sebastian James Andrew Palmer Priscilla Vacassin2
Notes:
1. Appointed as Committee Chair with effect from 1 March 2016 having previously been a member of the Committee from September 2012 to September 2014
2. Committee Chair until she stepped down from the Board with effect from 1 March 2016
Advisers to the Committee The Committee consults with the Chief Executive Officer, the Human Resources Director, and senior representatives of the HR, Risk and Finance functions on matters relating to the appropriateness of all remuneration elements for Executive Directors and Executive Committee members. The Chairman, Chief Executive Officer and the Human Resources Director are not present when their remuneration is discussed. The Committee works closely with the Chairs of the Board Risk Committee and the Audit Committee, including receiving reports from those Chairs regarding setting targets and pay-outs under incentive plans, and whether it is appropriate to operate malus and clawback. The Chair of the Audit Committee is a member of the Remuneration Committee; and the Chair of the Board Risk Committee attended Remuneration Committee meetings on three occasions. The Remuneration and Board Risk Committees also hold a joint meeting at least annually to consider matters of common interest.
The Committee retains FIT Remuneration Consultants LLP (“FIT”) as its independent adviser. FIT is a signatory to the Remuneration Consultants Group’s Code of Conduct. The Committee appointed FIT when preparing for the IPO and after considering the firm’s experience in this sector.
During the year, FIT advised on market practice, corporate governance, incentive plan design and target setting, regulations, and other matters that the Committee was considering. FIT does not provide the Company with other services. The Committee is satisfied that the advice FIT provides is objective and independent.
FIT’s total fees for remuneration related advice in 2016 were £162,171 exclusive of VAT. FIT charged its fees based on its standard terms of business for providing advice.
Allen & Overy LLP, one of the Group’s legal advisers, also provided legal advice relating to the Group’s executive remuneration arrangements. It also provided the Group with other legal services.
Implementing policy and pay outcomes relating to 2016 performance Single figure table (Audited)
Salary1 Benefits2 Annual bonus3 Long-term
incentives4,5,6 All employee share plans7 Pension Total
£’000 2016 2015 2016 2015 2016 2015 2016 2015 2016 2015 2016 2015 2016 2015
Paul Geddes 790 771 19 18 594 1,120 2,466 2,693 197 193 4,066 4,795
John Reizenstein 478 467 10 15 308 602 1,492 1,630 1 1 119 117 2,408 2,832
Notes:
1. Salary – The Company operates a flexible benefits policy, and salary is reported before any personal elections are made
2. Benefits – Benefits include a company car or allowance; private medical and income protection insurance
3. Annual bonus – Includes amounts earned for performance during the year, but deferred for three years under the DAIP. For more information, see page 95. These deferred awards are not subject to any conditions, except continuous employment. However, awards remain available for malus and clawback
4. 2013 LTIP awards RoTE – The expected vesting outcome figures for the RoTE portion of the awards granted under the LTIP in 2013 and reported in 2015 have been updated. These updates are based on the actual vesting of the RoTE portion of the awards and a share price of £3.716 and £3.634 on 29 March 2016 and 30 August 2016 respectively, compared to the three-month average share price of £3.9728 used in reporting this figure in the 2015 remuneration report. The revised figures reflect the actual number of dividends accrued on this portion of the award at vesting. This results in an adjusted reportable decrease of approximately £19,277 for Paul Geddes and £11,670 for John Reizenstein, with a corresponding decrease of the single figure for 2015 reflected in the table above
5. 2014 LTIP awards RoTE – the expected levels of vesting are set out on page 90. The corresponding values under long-term incentives, including the estimated value of dividends accrued to 31 December 2016, are £1,098,472 for Paul Geddes and £664,864 for John Reizenstein, based on a three-month average Company share price to 31 December 2016 of £3.55686. Any shares vesting under the LTIP granted in 2014 will not be delivered until the end of the applicable vesting periods in March and August 2017
6. 2013 LTIP awards TSR – the level of vesting is set out on page 90. The corresponding values under long-term incentives, including the value of dividends on vesting, are £1,367,191 for Paul Geddes and £827,504 for John Reizenstein, using the share prices on 29 March 2016 and 30 August 2016 of £3.716 and £3.634 respectively
7. SIP – Includes the value of matching shares under the SIP
www.directlinegroup.com 87
Strategic reportG
overnanceFinancial statem
ents

Directors’ remuneration report continued
88 Direct Line Group Annual Report & Accounts 2016
Each Executive Director has confirmed they have not received any other items in the nature of remuneration, other than those already disclosed in the single figure table.
AIP outcomes for 2016 The Committee established target performance levels at the start of the year. The Committee’s approach to setting and assessing PBT targets under the AIP is to set a target level of profit performance and then, at the year end, to assess over or underperformance by judging overall corporate performance both on an absolute and relative basis. While the Committee does not set a formal threshold to maximum profit range against which performance is formulaically assessed the original intent was, following the year end, to reset an indicative range against which performance could be assessed, as occurred in 2015. However, as the potential results were then impacted by the Lord Chancellor announcing a plan to review the Ogden discount rate, the Committee felt that the position was too uncertain to set a meaningful range for modelling and therefore awaited the outcome of the Ogden review. In determining pay-out levels, the Committee carefully considered performance relative to the targets in its assessment of over or underperformance of the target. It applied overall judgement in light of the year-end corporate performance and decided an out-turn of 10% (out of the 55% available for PBT) was appropriate and should be payable under this element.
In the table below, we have disclosed the target set for PBT performance. We have expanded our description of the performance achieved against the non-financial measures to improve transparency for shareholders although some metrics remain commercially sensitive.
The bar chart illustrates the Committee’s assessment of the level of achievement under the AIP. The outcomes reflect continuing strong performance during the year as discussed in the Group highlights and Chairman’s statement on pages 2 to 3 and 10 to 11 respectively.
(Audited)
The Committee also considered performance against the “gateway” criteria outlined on page 98 and determined that it was appropriate to pay a bonus and that it was not necessary to reduce the payment in light of performance against these criteria.
Financial element (55% weighting) As discussed above, there is no pre-set scale around the PBT target for the 2016 financial year and, in accordance with the AIP terms, the Committee determined the appropriate pay-out for the performance achieved.
Throughout 2016 our PBT performance was positive, driven by our continued investment in brand differentiation, propositions and trading capabilities, and we ended the year significantly ahead of target. Motor and Home Own Brands, Green Flag and Direct Line for Business have all continued to grow within a competitive market. They are all significantly favourable to target and grew year-on-year. Overall, before the reduction in the discount rate, profit before tax would have increased £62.8m to £570.3m (2015: £507.5m) reflecting improved operating profits. This would most likely have achieved a maximum pay-out for this element. Reported PBT for 2016, including impact of the reduction in the Ogden discount rate, is £353.0m. Given the strong profit progress absent the Ogden rate change and the Group’s resilience as the Group already reserved at a more conservative discount rate of 1.5% (compared to the actual 2.5% rate), shareholders have been protected to some extent from the effects of the reduction to the Ogden discount rate. The Committee, having considered that the Group made strong profits before the reduction and had a good capital position, determined that it was fair and reasonable that 10% (out of the 55% for PBT) should be payable.
Direct Line Group Annual Report & Accounts 201688
Financial Profit before tax 55% 415.4 353.0 Below target
Strategic A basket of measures of ten key customer metrics 25% See narrative Above target
Personal Including objective shared among all Executive Committee members
Paul Geddes 20% See narrative Below target
John Reizenstein 20% See narrative Below target
MeasuresWeight
(as a % of max award)
Achievement against performance measures
Target performance
(£m)
Performance Assessment
Actual performance
(£m)
Achievement under the 2016 AIPExecutive Director
0% Vesting
Target 60%
Vesting
Maximum 100%
Vesting
92%
50%
50%
18%
Paul Geddes 43% of maximum
John Reizenstein 43% of maximum

www.directlinegroup.com 89
The Committee understands that the Lord Chancellor, while announcing a discount rate of minus 0.75%, is launching a further consultation regarding the approach to setting the Ogden discount rate which may or may not lead to a change to the Ogden discount rate. In these exceptional circumstances, and given that the impact of the post-year-end announcement was to reduce this element from paying out at the likely full 55% to 10%, the Committee will keep the out-turn under the 2016 AIP assessment under review until the end of 2017. If, during 2017, in connection with the consultation, the Ogden discount rate is raised from minus 0.75%, the Committee will recalculate the out-turn for this element and adjust it accordingly; the impact of such a subsequent change in the Ogden discount rate would be excluded from the 2017 AIP.
Strategic element (25% weighting) The Group’s strategy is to make insurance much easier and better value for our customers. It aims to deliver on its commitments in this area and ensure that fairness is a natural outcome of what the Group does. Overall, performance on the customer agenda against our ten key customer metrics remains very strong and, in 2016, we introduced new metrics to monitor and assess conduct performance and complaints.
Through the year there was a strong focus on removing the reasons for customer problems with multiple initiatives delivering tangible improvement. One such initiative was the roll-out of focused investment in customer training to our front-line staff across Home and Motor Claims which has had a positive impact on NPS and NetEase scores. Our new approach to problem handling and recording has driven an improved customer experience and reductions in reportable complaint volumes.
Persistency and retention remained strong with some of our brands consistently outperforming the market, and we have achieved a good commercial and customer experience balance. The Committee considered that the Company has made good progress over the past couple of years in improving the customer experience in the context that it is now becoming more challenging to improve on or maintain an already strong performance. Having considered performance against targets and an assessment of the quality of performance achieved, the Committee agreed that the level of out-turn of 92% under this element was appropriate in order to reflect the continued strong performance in trading and customer satisfaction despite competitive market conditions.
Personal element (20% weighting) This element relates to an objective that is shared with other Executive Committee members and set by the Committee. The Committee considers the performance against this element together with the Executive’s personal performance and leadership over the year.
The Group remains focused on improving its digital offering, customer experience and operational efficiency. A key focus of management was the level of change the Group has been making to its IT infrastructure. It remains focused on adopting the right capabilities and will take the time necessary seeking to do so. While progress has been made in each of the three areas, implementation and integration of a range of new IT systems is inherently complex and challenging. The Group has made progress improving the performance and security of the core infrastructure during the year, supporting its people in performing their roles more reliably. However, the Committee noted that there was less progress on delivering against the Group’s IT plans than had been envisaged. The team has reflected on the experience over the past year and will apply key learnings as it continues on this change journey in 2017.
Taking performance against each Executive Directors’ individual performance and the above challenges into account, the Committee determined that Paul Geddes and John Reizenstein should each receive awards of 50% respectively of the maximum available under this element.
Consequently, the annual incentive awards for Executive Directors for the financial year ended 31 December 2016 were as follows:
(Audited) Maximum
(% of salary)Target
(% of salary)Actual
(% of salary)
Actual £’000(including cash and deferred elements)
Paul Geddes, CEO 175% 105% 75% 594John Reizenstein, CFO 150% 90% 65% 308
www.directlinegroup.com 89
Strategic reportG
overnanceFinancial statem
ents
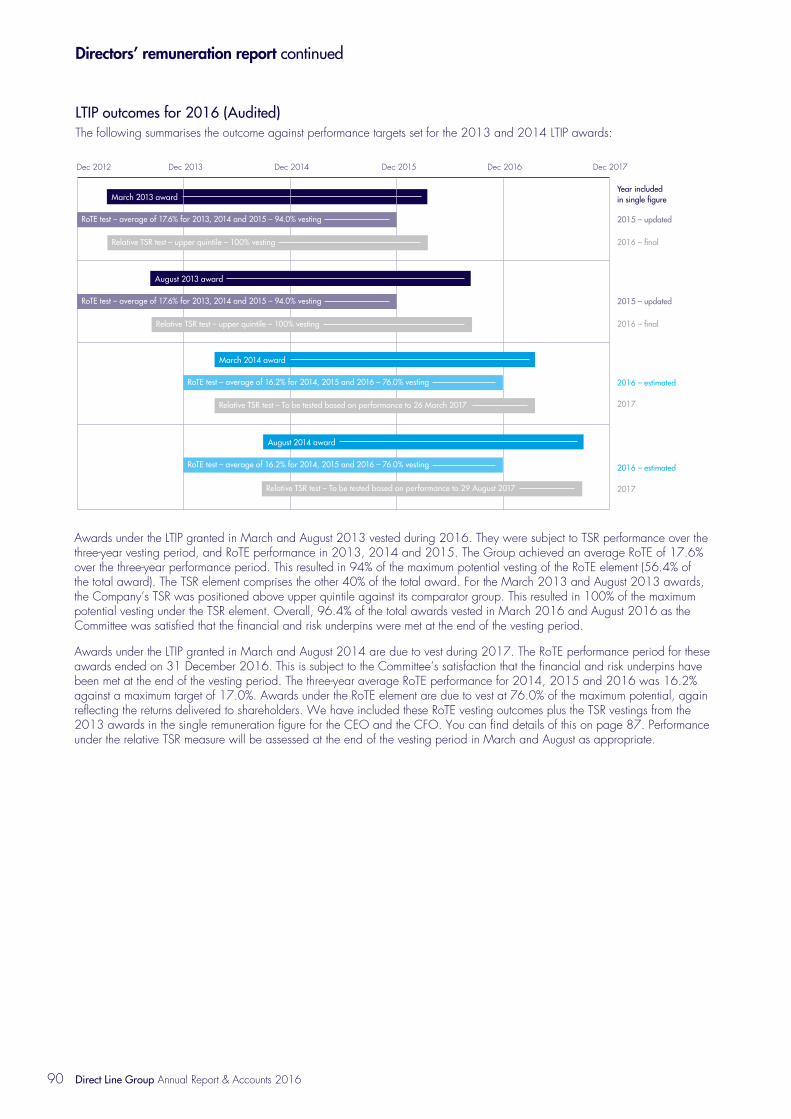
Directors’ remuneration report continued
90 Direct Line Group Annual Report & Accounts 2016
LTIP outcomes for 2016 (Audited) The following summarises the outcome against performance targets set for the 2013 and 2014 LTIP awards:
Awards under the LTIP granted in March and August 2013 vested during 2016. They were subject to TSR performance over the three-year vesting period, and RoTE performance in 2013, 2014 and 2015. The Group achieved an average RoTE of 17.6% over the three-year performance period. This resulted in 94% of the maximum potential vesting of the RoTE element (56.4% of the total award). The TSR element comprises the other 40% of the total award. For the March 2013 and August 2013 awards, the Company’s TSR was positioned above upper quintile against its comparator group. This resulted in 100% of the maximum potential vesting under the TSR element. Overall, 96.4% of the total awards vested in March 2016 and August 2016 as the Committee was satisfied that the financial and risk underpins were met at the end of the vesting period.
Awards under the LTIP granted in March and August 2014 are due to vest during 2017. The RoTE performance period for these awards ended on 31 December 2016. This is subject to the Committee’s satisfaction that the financial and risk underpins have been met at the end of the vesting period. The three-year average RoTE performance for 2014, 2015 and 2016 was 16.2% against a maximum target of 17.0%. Awards under the RoTE element are due to vest at 76.0% of the maximum potential, again reflecting the returns delivered to shareholders. We have included these RoTE vesting outcomes plus the TSR vestings from the 2013 awards in the single remuneration figure for the CEO and the CFO. You can find details of this on page 87. Performance under the relative TSR measure will be assessed at the end of the vesting period in March and August as appropriate.
Direct Line Group Annual Report & Accounts 201690
Year included in single figure
2015 – updated
2016 – final
2016 – final
Dec 2012 Dec 2013 Dec 2014 Dec 2015 Dec 2016 Dec 2017
March 2013 award
RoTE test – average of 17.6% for 2013, 2014 and 2015 – 94.0% vesting
Relative TSR test – upper quintile – 100% vesting
2015 – updated
2017
2016 – estimated
2017
2016 – estimated
August 2013 award
RoTE test – average of 17.6% for 2013, 2014 and 2015 – 94.0% vesting
Relative TSR test – upper quintile – 100% vesting
March 2014 award
August 2014 award
RoTE test – average of 16.2% for 2014, 2015 and 2016 – 76.0% vesting
RoTE test – average of 16.2% for 2014, 2015 and 2016 – 76.0% vesting
Relative TSR test – To be tested based on performance to 26 March 2017
Relative TSR test – To be tested based on performance to 29 August 2017

www.directlinegroup.com 91
Non-Executive Directors (Audited) Fees were the only remuneration paid to Non-Executive Directors in 2015 and 2016. Non-Executive Directors may also claim for reasonable travel and subsistence expenses, in accordance with the Group’s travel and expenses policy, and, where these are classified as taxable by HMRC, they are shown under ‘Benefits’ below. The Non-Executive Directors receive no other benefits.
Director 2016 Fees1
£’000 2016 Benefits2
£‘000 Total 2016
£’0002015 Fees
£‘0002015 Benefits
£‘000 Total 2015
£’000
Michael Biggs 400 3 403 400 4 404Jane Hanson 115 9 124 115 22 137Sebastian James3 89 89 85 85Andrew Palmer4 126 126 144 144Clare Thompson5 108 108 100 100Priscilla Vacassin6 20 20 113 113Richard Ward7 106 106
Notes:
1. Non-Executive Directors are not eligible to participate in any of the Group’s bonus or share incentive schemes or to join any Group pension scheme
2. The values shown under ‘Benefits’ above comprise the value of taxable travel and subsistence expenses reimbursed by the Company (including any potential gross-up for tax and National Insurance Contributions due)
3. Sebastian James was appointed as Chair of the CSR Committee from 1 March 2016
4. Andrew Palmer was appointed as Chair of the Investment Committee from 1 March 2016 and was the Senior Independent Director during 2015 and until 18 January 2016
5. Clare Thompson was appointed as Chair of the Remuneration Committee with effect from 1 March 2016, and stepped down as Chair of the CSR Committee and Investment Committee and as a member of the Board Risk Committee. She remained a member of the Audit Committee
6. Priscilla Vacassin stepped down from the Board on 1 March 2016
7. Richard Ward was appointed to the Board as the Senior Independent Director from 18 January 2016. He was appointed as a member of the Nomination Committee with effect from 25 February 2016 and was appointed to the Board Risk Committee with effect from 9 May 2016
Percentage change in Chief Executive Officer’s pay for 2015 to 2016 The table below shows the Chief Executive’s year-on-year percentage change in salary, taxable benefits and bonus, compared to the average pay for all other UK employees.
Salary1 Benefits2 Bonus (including
deferred amount)3
Chief Executive Officer 2.5% 3% (47)% All employees (average) 4.5% 3% (3)%
Notes:
1. Based on the change in average pay for UK employees employed in the year ended 31 December 2016 and the year ended 31 December 2015. Salaries are not adjusted for the number of working hours; therefore the increase partly reflects the increase in working hours for some employees during the year
2. There were no changes in benefits provision between 2015 and 2016
3. Includes average amounts earned under the AIP; and for employees other than the Chief Executive Officer, other variable incentive schemes, including monthly and quarterly incentive schemes operated in certain parts of the Group
Distribution statement This chart shows the overall pay expenditure across all Group employees compared with the total dividend value paid to shareholders for 2015 and 2016. A special dividend payment was made in 2015 in relation to the sale of the International division. The total dividend value paid to shareholders in 2015 has been calculated including and excluding this special dividend for comparison.
Note: There have been no share buy-backs since the IPO. The overall expenditure on pay has been taken from note 11 to the consolidated financial statements. Therefore, consistent with market practice, it has not been calculated in a manner consistent with the single figure in this report
www.directlinegroup.com 91
Strategic reportG
overnanceFinancial statem
ents
% change:
16y15y
408.
7
428.
2
Overall expenditure on pay (£m), excluding the International division
4.8%% change:
Dividend (£m), including 2015 special dividend
relating to the sale of the International division
-32.3%
16y15y
666.
0
450.
6
% change:
Dividend (£m), excluding 2015 special dividend
relating to the sale of the International division
77.1%
16y15y
254.
5
450.
6

Directors’ remuneration report continued
92 Direct Line Group Annual Report & Accounts 2016
Historical performance of TSR This graph shows the Company’s TSR since its shares began trading on the London Stock Exchange in October 2012, against the FTSE 350 Index (excluding investment trusts) over the same period. This peer group is the same used for measuring relative TSR under the LTIP.
The table below shows historical levels of the Chief Executive Officer’s pay between 2012 and 2016. It also shows vesting of annual and long-term incentive pay awards as a percentage of the maximum available opportunity.
Chief Executive Officer
Single figure of total remuneration
£’000
Annual bonus payout
(% of maximum)
Long-termincentive vesting (% of maximum)1
20162 4,066 43% 86%20153 4,795 83% 96%2014 5,356 75% 88%2013 2,536 63% 55%2012 1,908 65% 30%
Notes:
1. Based on actual vesting under the 2010, 2011 and 2012 RBS Group LTIP. The value included in the single figures in respect of these awards is £205,000 in 2012, £728,000 in 2013 and £2,437,428 in 2014
2. The 2016 single figure reflects the estimated vesting of the RoTE portion of the LTIP granted in March and August 2014. Any shares under the LTIP granted in 2014 will not be delivered until the end of the applicable vesting periods in March and August 2017. However they have been included in the single figure, as the performance period in respect of the RoTE portion has now been completed
3. The 2015 single figure has been revised to reflect the actual vesting of the 2013 awards under the LTIP, a decrease of £19,277
Direct Line Group Annual Report & Accounts 201692
Total Shareholder Return
16 October 2012
180
220
140
100
260
300
31 December 2012 31 December 2013 31 December 2014 31 December 2015
Direct Line Group FTSE 350 (excluding investment trusts)
31 December 2016
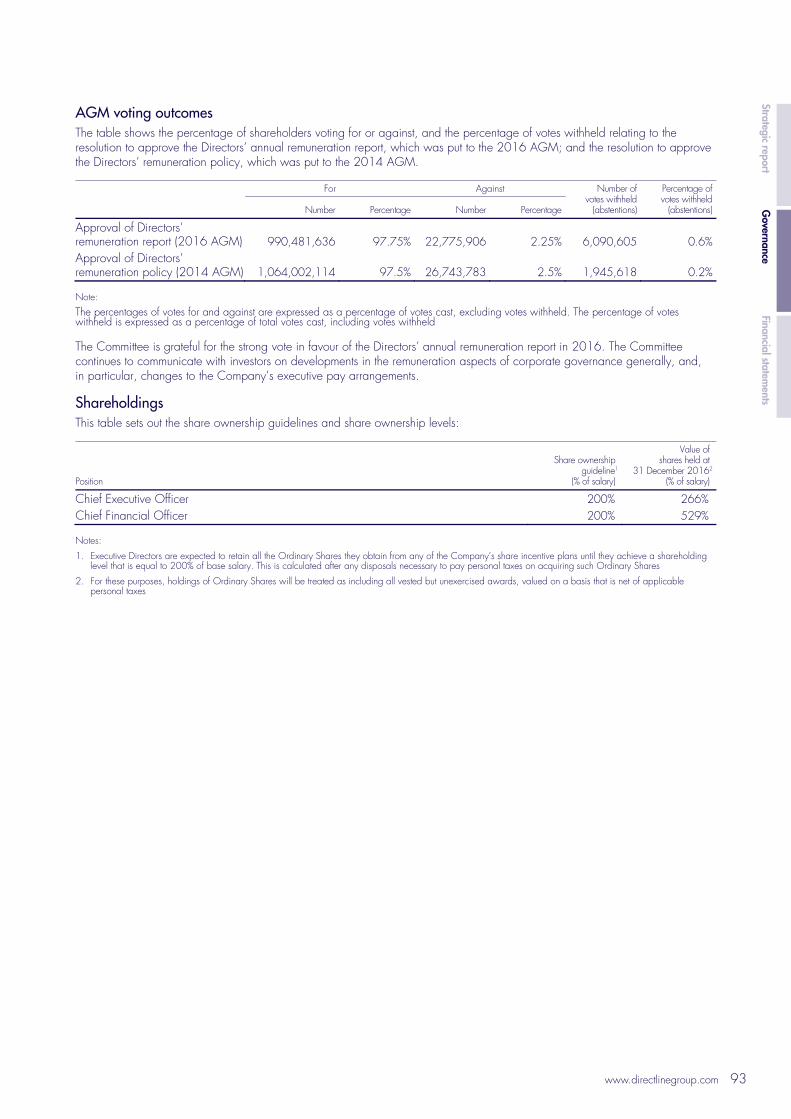
www.directlinegroup.com 93
AGM voting outcomes The table shows the percentage of shareholders voting for or against, and the percentage of votes withheld relating to the resolution to approve the Directors’ annual remuneration report, which was put to the 2016 AGM; and the resolution to approve the Directors’ remuneration policy, which was put to the 2014 AGM.
For Against Number of
votes withheld (abstentions)
Percentage of votes withheld
(abstentions)Number Percentage Number Percentage
Approval of Directors’ remuneration report (2016 AGM) 990,481,636 97.75% 22,775,906 2.25% 6,090,605 0.6%Approval of Directors’ remuneration policy (2014 AGM) 1,064,002,114 97.5% 26,743,783 2.5% 1,945,618 0.2%
Note:
The percentages of votes for and against are expressed as a percentage of votes cast, excluding votes withheld. The percentage of votes withheld is expressed as a percentage of total votes cast, including votes withheld
The Committee is grateful for the strong vote in favour of the Directors’ annual remuneration report in 2016. The Committee continues to communicate with investors on developments in the remuneration aspects of corporate governance generally, and, in particular, changes to the Company’s executive pay arrangements.
Shareholdings This table sets out the share ownership guidelines and share ownership levels:
Position
Share ownership guideline1
(% of salary)
Value of shares held at
31 December 20162
(% of salary)
Chief Executive Officer 200% 266%Chief Financial Officer 200% 529%
Notes:
1. Executive Directors are expected to retain all the Ordinary Shares they obtain from any of the Company’s share incentive plans until they achieve a shareholding level that is equal to 200% of base salary. This is calculated after any disposals necessary to pay personal taxes on acquiring such Ordinary Shares
2. For these purposes, holdings of Ordinary Shares will be treated as including all vested but unexercised awards, valued on a basis that is net of applicable personal taxes
www.directlinegroup.com 93
Strategic reportG
overnanceFinancial statem
ents

Directors’ remuneration report continued
94 Direct Line Group Annual Report & Accounts 2016
Using shares In receiving an award under the LTIP or DAIP, Executive Directors agree not to hedge their exposure to outstanding awards under these plans or in respect of shares they are reporting to the Company as within their ownership for the purposes of any Share Ownership Guidelines. They also agree not to pledge as collateral their participation under any of the plans or any shares which they are required to hold in the Company for any purposes, including for Share Ownership Guidelines.
This table shows each Executive Director’s total share interests.
Share plan awards
subject to performance
conditions1
Share plan awards not
subject to performance
conditions2
Share plan interests at 31 December 2016 Beneficial share interests
Director
Share plan interests
vested but unexercised
Share plan interests
exercised or released during
the year3
Total at 31 December
20164,5 Total at
31 December 2015
Paul Geddes 1,380,145 356,293 997 962,948 572,468 474,255John Reizenstein 835,338 184,986 929,283 0 195,602 183,496
Notes:
1. This relates to awards under the Direct Line Group LTIP. As described on page 90, 76.0% of awards made under the Direct Line Group LTIP in March and August 2014 that are subject to the RoTE performance condition measured to 31 December 2016 are expected to vest. These shares will be delivered to Executive Directors in March and August 2017
2. Includes matching shares held under the SIP which are subject to forfeiture and deferred shares under the Direct Line Group DAIP. For more information, see pages 95 and 97
3. On 30 August 2016, Paul Geddes exercised a DAIP award granted on 28 March 2013 and LTIP awards granted on 28 March 2013 and 28 August 2013. Following this exercise, 997 DAIP shares remain vested but unexercised
4. Includes holdings of connected persons, as defined in section 96B(2) of the Financial Services and Markets Act 2000, and free and partnership shares held under the SIP which are not subject to forfeiture and considered beneficially owned
5. Beneficial share interests include partnership shares John Reizenstein purchased under the SIP and free shares held by the CEO and the CFO under the SIP. At 6 March 2017, the number of shares beneficially held by John Reizenstein has increased to 195,733. There was no change to the number of shares held by Paul Geddes
The table shows the Non-Executive Directors’ beneficial interests in the Company’s shares.
Director
Shares held at 31 December
20161,2
Shares held at31 December
2015
Mike Biggs Jane Hanson 26,190 26,190Andrew Palmer 10,475 10,475Clare Thompson 38,378 35,220Priscilla Vacassin3 35,220 35,220Sebastian James Richard Ward4
Notes:
1. There were no changes to the number of shares held by Directors between the year end and the date of this report
2. Includes holdings of connected persons, as defined in section 96B(2) of the Financial Services and Markets Act 2000
3. Priscilla Vacassin stepped down from the Board on 1 March 2016 and this represents her holding at that date
4. Richard Ward was appointed to the Board as the Senior Independent Director from 18 January 2016
Direct Line Group Annual Report & Accounts 201694

www.directlinegroup.com 95
Direct Line Group share awards Direct Line Group Deferred Annual Incentive Plan (“DAIP”) awards (Audited) This table details the awards made to all Executive Directors under the Direct Line Group DAIP
Grant date
Three-day average
share price for grant of
awards £
Face value of award
£
No. of share options as at
1 January 2016
No. of share options granted
during the year1
No. of share
options vested
during the year2
No. of dividend
shares acquired at
vesting
No. of dividend
shares added post vesting
No. of share options
exercised3
No. of share options held at
31 December 2016 Vesting date
Paul Geddes
28-Mar-13 2.0157 380,004 34,562 – 34,562 13,028 1,880 48,473 997 1-Jun-13 to 28-Mar-16
26-Mar-14 2.433667 333,999 125,804 – – – – – 125,804 26-Mar-1725-Mar-15 3.3007 400,000 111,087 – – – – – 111,087 25-Mar-1829-Mar-16 3.752 447,996 – 119,402 – – – – 119,402 29-Mar-19 271,453 119,402 34,562 13,028 1,880 48,473 357,290
John Reizenstein 28-Mar-13 2.0157 137,999 62,756 – 62,756 23,657 3,415 – 89,828 28-Mar-1626-Mar-14 2.433667 166,000 62,525 – – – – – 62,525 26-Mar-1725-Mar-15 3.3007 207,200 57,542 – – – – – 57,542 25-Mar-1829-Mar-16 3.752 240,800 – 64,179 – – – – 64,179 29-Mar-19
182,823 64,179 62,756 23,657 3,415 – 247,074
Mike Holliday-Williams4 25-Mar-15 3.3007 239,997 66,651 – – – – – 66,651 25-Mar-1829-Mar-16 3.752 270,797 – 72,174 – – – – 72,174 29-Mar-19
66,651 72,174 – – – – 138,825
Notes:
1. Awards are granted as nil-cost options
2. The terms on which Paul Geddes’ 2012 bonus outcome was deferred meant that 60% of the outcome was deferred, with deferral split broadly evenly between deferral into deferred cash and deferred shares, with phased vestings of the deferred amounts over the three-year deferral period
3. Exercised on 30 August 2016 at £3.63, resulting in an aggregate gain of £175,957
4. Although not required in order to comply with statutory requirements, we have provided the detail for Mike Holliday-Williams for completeness
www.directlinegroup.com 95
Strategic reportG
overnanceFinancial statem
ents

Directors’ remuneration report continued
96 Direct Line Group Annual Report & Accounts 2016
Direct Line Group LTIP awards (Audited) This table details the Directors’ interests in the Company’s LTIP. For all LTIP awards, 20% of the awards granted would vest if the minimum performance was achieved.
Grant date
Three-day average share price for grant
of awards £
Face value of award
£
No. of options at 1 January
20161
No. of options granted during
the year2
No. of options vested during
the year3
No. of options lapsed for
performance4
No. of dividend shares acquired
at vesting
No. of dividend
shares added post vesting5
No. of options exercised
No. of options held at
31 December 2016 Vesting date
Paul Geddes
Options held arising from vesting in previous periods – – – – – – – – – – 09-Nov-15
28-Mar-13 2.0157 760,000 345,620 – 333,177 12,443 125,601 18,132 476,910 – 28-Mar-16
28-Aug-13 2.1564 759,999 323,069 – 306,728 16,341 130,837 – 437,565 – 28-Aug-16
26-Mar-14 2.433667 759,998 286,261 – – – – – 286,261 26-Mar-17
29-Aug-14 2.9020 759,999 240,064 – – – – – – 240,064 29-Aug-17
25-Mar-15 3.3007 760,000 211,066 – – – – – – 211,066 25-Mar-18
26-Aug-15 3.517 775,200 220,415 – – – – – – 220,415 26-Aug-18
29-Mar-16 3.752 775,197 – 206,609 – – – – – 206,609 29-Mar-19
30-Aug-16 3.6833 794,598 – 215,730 – – – – – 215,730 30-Aug-19
1,626,495 422,339 639,905 28,784 256,438 18,132 914,475 1,380,145
John Reizenstein
Options held arising from vesting in previous periods – – 261,941 – – – – 24,020
– 285,961 09-Nov-15
28-Mar-13 2.0157 459,999 209,190 – 201,659 7,531 76,020 10,975 – 288,654 28-Mar-16
28-Aug-13 2.1564 459,999 195,541 – 185,650 9,891 79,190 – – 264,840 28-Aug-16
26-Mar-14 2.433667 460,000 173,263 – – – – – – 173,263 26-Mar-17
29-Aug-14 2.9020 459,999 145,301 – – – – – – 145,301 29-Aug-17
25-Mar-15 3.3007 460,000 127,750 – – – – – – 127,750 25-Mar-18
26-Aug-15 3.5170 469,200 133,409 – – – – – – 133,409 26-Aug-18
29-Mar-16 3.752 469,199 – 125,053 – – – – – 125,053 29-Mar-19
30-Aug-16 3.6833 480,899 – 130,562 – – – – – 130,562 30-Aug-19
1,246,395 255,615 387,309 17,422 155,210 34,995 – 1,674,793
Mike Holliday-Williams
29-Aug-14 2.9020 787,498 248,750 – – – – – – 248,750 29-Aug-17
25-Mar-15 3.3007 393,747 109,351 – – – – – – 109,351 25-Mar-18
26-Aug-15 3.5170 393,749 111,956 – – – – – – 111,956 26-Aug-18
29-Mar-16 3.752 393,750 – 104,944 – – – – – 104,944 29-Mar-19
30-Aug-16 3.6833 403,572 – 109,568 – – – – – 109,568 30-Aug-19
470,057 214,512 – – – – – 684,569
Notes:
The Company’s share price on 31 December 2016 was £3.694, and the range of prices in the year was £3.333 to £4.096
1. These awards take the form of nil-cost options over the Company’s shares and are subject to performance conditions to be assessed by the Committee. Awards granted before 2014 accrue dividend entitlements until the date of transfer of shares. Awards granted from 2014 accrue dividend entitlement from the grant date to the date on which an award vests
2. The RoTE targets for awards granted in 2016, applying to 60% of the award, were 14.5% for 20% vesting, 15.5% for 40% vesting and 17.5% for full vesting. A straight-line interpolation occurs from threshold to target, and then from target to maximum performance. The remaining 40% of each award is based on TSR performance conditions, which are the same as noted on page 99
3. The closing market price on the dates of the vesting of the awards were £3.716 on 29 March 2016 and £3.634 on 30 August 2016
4. Awards under the LTIP vested at 96.4% of the maximum potential on 29 March 2016 and 30 August 2016
5. Dividends added post-vesting are shown to 31 December 2016, although these are not realised until exercise
6. Although not required in order to comply with statutory requirements we have provided the detail for Mike Holliday-Williams for completeness
The Company’s policy is to grant awards twice a year, after the Group announces its full and half-year results. The value of each grant of awards is set at 50% of the normal annual policy level. This means the total combined face value of awards to the CEO and CFO during the year equates to 200% of their base salary paid in the year.
Direct Line Group Annual Report & Accounts 201696

www.directlinegroup.com 97
Direct Line Group Restricted Shares Plan (“RSP”) Awards (Audited) This table details the last tranche of the award made to Mike Holliday-Williams under the Direct Line Group RSP that is due to vest this year. This award was made to the MD Personal Lines on recruitment in May 2014 as compensation for the forfeiture of legacy awards granted by his previous employer. Executive Directors do not participate in the RSP and Mike Holliday-Williams will not receive any subsequent grants under this plan.
Grant date
Three-day average share
price for grant of awards
£
Face value of award
£
No. of share options as at
1 January 2016
No. of dividend shares acquired
at vesting
No. of dividend shares added
post vesting
No. of share options
exercised
No. of share options held at
31 December 2016 Vesting date
Mike Holliday-Williams
27-May-14 2.430333 £106,667 40,231 – – – 40,231 1-May-17
Direct Line Group 2012 SIP (Audited) During 2016, all employees, including Executive Directors, were eligible to invest from £10 to £150 a month from their pre-tax pay into the SIP, and receive one matching share for every two shares they purchased. This table details the number of shares held by John Reizenstein under the SIP. Paul Geddes does not participate in the plan.
Director
Matching shares granted during
the year
Matching shares cancelled during
the year
Value of matching shares granted¹
£
Balance ofmatching shares at
31 December 2016
John Reizenstein 250 – 903 741
Note:
1. The accumulated market value of matching shares at the time of each award. Purchase of the matching shares takes place within 30 days of the contributions being deducted from salary
Executive Directors were eligible to participate in the award of £265 worth of free Company shares in March 2016. However, all Executive Directors waived their eligibility to this award.
Dilution The Company complies with the dilution levels that the Investment Association guidelines recommend. These levels are 10% in 10 years for all share plans and 5% in 10 years for discretionary plans. This is consistent with the rules of the Company’s share plans.
Statement of policy implementation in 2017 Executive Directors’ salaries in 2017 The salary increase awarded to the Executive Directors, effective 1 April 2017, reflects the average increase awarded to UK employees.
Director Position 2017 base salary
£’0002016 base salary
£’000 Annual change in base salary
Paul Geddes Chief Executive Officer 810 795 2%John Reizenstein Chief Financial Officer 491 481 2%Mike Holliday-Williams MD Personal Lines 549 538 2%
AIP 2017 The maximum annual incentive awards which may be paid to Executive Directors have not changed since the IPO.
Director Position Maximum annual incentive award for
2017 (% base salary) Deferred under the DAIP
(% bonus)
Paul Geddes Chief Executive Officer 175% 40%John Reizenstein Chief Financial Officer 150% 40%Mike Holliday-Williams MD Personal Lines 150% 40%
During 2016, the Committee reviewed the AIP performance measures’ weightings and composition. It also reviewed the overall framework’s operation to make sure it is still fit for purpose. The review concluded that the framework successfully linked Executive Directors’ variable pay with the Group’s performance and a scorecard ensured that management are incentivised both to deliver superior financial returns and excellent customer service. Therefore, the AIP continues to provide the most appropriate incentive. However, to further align the Executive Directors’ interests with those of shareholders and the objectives of the business in 2017, the Committee decided to broaden the measures under the strategic element to encompass both customer and people targets given the good progress that has been made on customer experience, the importance of the people agenda and the fact that the Company has signed up to HM Treasury’s Women in Finance Charter. The overall weighting of 25% assigned to this element has not changed. Please see pages 24 and 25 for a complete list of our key performance indicators and how these relate to Executive Directors’ remuneration.
www.directlinegroup.com 97
Strategic reportG
overnanceFinancial statem
ents

Directors’ remuneration report continued
98 Direct Line Group Annual Report & Accounts 2016
Measures Weighting for 2017 Weighting for 2016
Financial Profit before tax 55% 55%Strategic Based on a basket of customer measures only, including
Net Promoter Score and complaints 0% 25%Strategic Based on a basket of:
customer measures, including Net Promoter Score and complaints; and
people measures, including measures of gender diversity and engagement 25% 0%
Personal Objectives for each Executive Director, including shared objectives across the Executive Committee 20% 20%
Like previous years, all AIP outcomes will be determined after the Committee determines a payment gateway. To do this, the Committee must be satisfied that it is appropriate to permit a bonus award at all, or at a given level. The gateway involves some subjectivity about performance. This may result in positive or negative moderation of each AIP performance measure or the overall bonus outcome.
The list below sets out the gateway criteria for the AIP for 2017.
Gateway criteria for the AIP for 2017 – outcomes for Executive Directors Year-on-year changes in profit before tax
Quality and sustainability of earnings, referring to reserving, gross written premium, costs and loss ratio, and relevant lead indicators
Additional customer context, for example, conduct, experience, brand and franchise health
Capital strength and affordability
Risk management within risk appetite
The Group’s relative performance to that of its peers
The wider economic environment
Exceptional events, such as abnormal weather
Any regulatory breaches and/or reputational damage to the Group
Committee satisfaction that paying the bonus does not cause major reputational concerns
The Committee may also use its discretion to account for additional factors. These include the quality of financial results; the ’direction of travel’ of all measures; more widely considering reputation, risk, and audit.
In considering such factors, and whether to adjust the overall pay-outs and/or operate malus and clawback, the Committee receives appropriate input from the Audit Committee and the Board Risk Committee through receiving reports from, and discussion with, the Chairs of those Committees.
Performance conditions for LTIP awards LTIP awards to be granted in 2017 will continue to be subject to performance against these performance conditions:
60% based on RoTE over a three-year performance period (2017, 2018 and 2019)
40% based on relative TSR performance against the constituents of the FTSE 350 (excluding investment trusts) over a three-year performance period, starting on the date of grant. The starting and closing TSR will be averaged over a three-month period
For these purposes, we use the Group’s standard definition for RoTE, subject to such other adjustments as the Committee may consider appropriate. To find out more about how we calculate RoTE, see page 190.
Direct Line Group Annual Report & Accounts 201698

www.directlinegroup.com 99
The Committee reviewed the performance targets and, in line with its commitment to ensure that awards to Executive Directors would only be payable if significant value has been created for shareholders, decided to increase the RoTE target range as follows:
Performance measure
Vesting for threshold
performance
Performance required for threshold vesting Performance required for maximum vesting
Awards in March 2017
Awards in 2015 and 2016
Awards in 2014
Awards in March 2017
Awards in 2015 and 2016
Awards in 2014
RoTE 20% of this element
of the award
Average annual RoTE
performance of 15.0%
Average annualRoTE
performance of 14.5%
Average annualRoTE
performance of 14.0%
Average annualRoTE
performance of 18.0%
Average annual RoTE
performance of 17.5%
Average annualRoTE
performance of 17.0%
Relative TSR 20% of this element
of the award Median Upper quintile
For the TSR element, there is a straight-line interpolation between threshold and maximum performance on a ranked basis. For the RoTE element, 20% of the award will vest for threshold RoTE and 40% for a ROTE of 16.0% for awards to be made in March 2017. Otherwise, vesting is similar to TSR: a straight-line interpolation occurs from threshold to target, then from target to maximum performance.
The LTIP awards will also vest only to the extent that the Committee is satisfied that the outcome of the TSR and RoTE performance conditions reflects the Group’s underlying financial performance from the date of grant until vesting. When considering these matters, the Committee will also consider whether there have been any material risk failings.
Pension and benefits A pension contribution of 25% of base salary will continue to be paid to the CEO and CFO in 2017. Before his promotion to the Board the MD Personal Lines received a pension contribution of 15% of base salary and the level of contribution has not been changed following his appointment to the Board.
Benefits comprise providing a company car or car allowance, private medical insurance, life assurance, income protection and health screening. Like all employees, the Executive Directors are also eligible for certain discounted Group products.
Non-Executive Directors’ fees The current fees for the Chairman and Non-Executive Directors were set in 2012 and have not been changed since then.
Position Fees for 2017
£’000
Board Chairman fee 400Basic Non-Executive Director fee 70Additional fees Senior Independent Director fee 30Chair of Audit, Board Risk and Remuneration Committees 30Chair of CSR Committee 10Member of Board Committee (Audit, Board Risk or Remuneration) 10Member of Board Committee (CSR or Nomination) 5
No additional fees are paid for membership or chairmanship of the Investment Committee.
External directorships
Paul Geddes was appointed as a non-Executive Director for Channel 4 on 5 December 2016 for which he receives an annual fee of £22,177. Total fees received from Channel 4 in 2016 were £1,848. John Reizenstein is a trustee and Director of Farm Africa, for which he receives no fees. Otherwise, the Executive Directors do not currently hold any further external directorships.
www.directlinegroup.com 99
Strategic reportG
overnanceFinancial statem
ents

Directors’ remuneration report continued
100 Direct Line Group Annual Report & Accounts 2016
Policy report The following sets out our proposed Directors’ remuneration policy. This policy will be put forward for shareholder approval at the 2017 AGM on 11 May 2017 and, if approved, will apply to payments made from that date. Until this time, the policy approved on 13 May 2014 will continue to apply. The main changes in this policy from the 2014 policy have been summarised in the Remuneration Committee Chair’s letter above and in the notes to the policy tables.
You can find further details regarding the policy’s operation for 2017 on page 103.
Policy table Element Purpose and link to strategy Operation
Base salary
This is the core element of pay that reflects the individual’s role and position within the Group. It is payable for doing the expected day-to-day job
Staying competitive in the market allows us to attract, retain and motivate high-calibre executives with the skills to achieve our key aims while managing costs
Base salaries are typically reviewed annually and set in April of each year, although the Committee may undertake an out-of-cycle review if it determines this to be appropriate
When reviewing base salaries, the Committee typically takes the following into account: level of skill, experience and scope of responsibilities, individual and business performance,
economic climate, and market conditions; the median market pay in the context of companies of a similar size, particularly FTSE 31-100
companies, as they are considered to reflect the size and complexity of the Group; the practice of insurance peers such as Admiral Group, Aviva, esure Group, Hastings Group,
Legal & General, Old Mutual, Phoenix Group, Prudential, RSA Insurance Group, Standard Life and companies of a similar size to DLG as appropriate; and
general base salary movements across the Group The Committee does not follow market data strictly. However, it uses it as a reference point in
considering, in its judgement, the appropriate salary level, while regarding other relevant factors, including corporate and individual performance, and any changes in an individual’s role and responsibilities
The principles for setting base salary are similar to those applied to other employees in the Group. However, the specific benchmarking groups used to review external market relativities may differ across employee groups
Base salary is typically paid monthly
AIP To motivate executives and incentivise delivery of performance over a one-year operating cycle, focusing on the short to medium-term elements of our strategic aims
For Executive Directors, at least 40% of the award is deferred into shares under the Deferred Annual Incentive Plan (the “DAIP”). This typically vests three years after grant (with deferred awards also capable of being settled in cash at the discretion of the Committee, for example, when it gives rise to legal difficulties to settle in shares). The remainder of the award is paid in cash following the year end
The Committee will keep the percentage deferred and terms of deferral under review. This will ensure levels are in line with regulatory requirements and best practice and may be changed in future years but will not, in the Committee’s view, be changed to be less onerous overall
Malus and clawback provisions apply to the cash and deferred elements. These are explained in the notes to the policy table
LTIP Aligning executives’ interests with those of shareholders to motivate and incentivise delivering sustained business performance over the long term
To aid retaining key executive talent long term
Awards will typically be made in the form of nil-cost options or conditional share awards, which vest to the extent performance conditions are satisfied over a period of at least three years. Under the Plan rules, awards may also be settled in cash at the discretion of the Committee. This may be appropriate, for example, if legal difficulties arise with settling in shares
Vested options will remain exercisable for up to the tenth anniversary of grant Malus and clawback provisions apply to the LTIP. These are explained in the notes to the policy table Awards under the LTIP may be made at various times during the financial year. While the Committee
reserves the right to do otherwise, the Committee’s practice has been to make awards twice in each financial year, following the announcement of the Group’s annual and half-year results
For awards made after adopting the new policy at the 2017 AGM, Executive Directors will be subject to an additional two-year holding period following the three-year vesting period, during which time awards may not normally be exercised or released. During the additional holding period the awards will continue to accrue dividends. Following the holding period awards will cease to accrue dividends if not exercised
Direct Line Group Annual Report & Accounts 2016100

www.directlinegroup.com 101
Maximum opportunity Performance measures
When determining salary increases, the Committee will consider the factors outlined in this table under ‘Operation’. In any event, no increase will be made if it would take an Executive Director’s salary above £850,000 (the current median level of salaries for CEOs in the FTSE 100), as further increased by UK RPI from the date of approving this policy
Not applicable
Maximum and target bonus levels for Executive Directors are set by taking into account annual bonus practice throughout the organisation and referring to practice at other insurance and general market comparators
The maximum bonus opportunity under the AIP is 175% of base salary per annum. The current maximum bonus opportunity applying for each individual Executive Director is shown in the statement of implementation of policy. This is in the 2016 section of the annual remuneration report
Performance over the financial year is assessed against performance measures which the Committee considers to be appropriate
These may be financial, non-financial (Group, divisional or business line) and individual. Each year, at least 50% of the bonus is based on financial measures. The remainder of the bonus may be based on a combination of strategic, shared and individual performance measures
The Committee sets targets at the beginning of each financial year No more than 10% of the bonus is paid for threshold performance (30% of the bonus for the individual
performance element). No more than 60% of the maximum opportunity pays out for target performance. However, the Committee retains flexibility to amend the pay-out level at different levels of performance for future bonus cycles. This is based on its assessment of the level of stretch inherent in the set targets, and the Committee will disclose any such determinations appropriately
Before any payment can be made, the Committee will perform an additional gateway assessment (including in respect of any risk concerns). This will determine whether the amount of any bonus is appropriate in view of facts or circumstances which the Committee considers relevant. This assessment may result in moderating (positively or negatively) each AIP performance measure, subject to the individual maximum bonus levels
The AIP remains a discretionary arrangement. The Committee reserves discretion to adjust the out-turn (from zero to the cap), should it consider it appropriate
The maximum LTIP award in normal circumstances is 200% of salary
Awards of up to 300% of base salary are permitted in exceptional circumstances, relating to recruiting or retaining an employee, as determined by the Committee
The Committee will determine the performance conditions for each award made under the LTIP, measuring performance over a period of at least three years with no provision to retest
Performance is measured against targets set at the beginning of the performance period, which may be set by referring to the time of grant or financial year
Awards vest based on performance against financial and/or such other (including share return) measures, as set by the Committee, to be aligned with the Group’s long-term strategic objectives
For awards to be granted in 2017, vesting will continue to be determined based on two measures: RoTE and relative TSR performance against the FTSE 350 (excluding investment trusts). The Committee may apply different performance measures and targets for future awards, provided not less than 50% of the award shall be subject to one or more financial measures, and not less than 25% shall be subject to a relative TSR measure
Awards will be subject to a payment gateway, such that the Committee must be satisfied that there are no material risk failings, reputational concerns or regulatory issues
Additionally, there is a financial underpin relating to the Committee’s view of the Group’s underlying financial performance for the TSR and RoTE (and any other) elements, 20% of the award vests for threshold performance, with 100% vesting for maximum performance. The Committee reserves the right in respect of future awards to lengthen (but not reduce) any performance period and/or amend the terms of any holding period; however, there is no intention to reduce the length of the holding period
www.directlinegroup.com 101
Strategic reportG
overnanceFinancial statem
ents

Directors’ remuneration report continued
102 Direct Line Group Annual Report & Accounts 2016
Element Purpose and link to strategy Operation
Pension To remain competitive within the market place
To encourage retirement planning and retain flexibility for individuals
Pension contributions are paid only in respect of base salary Executive Directors are eligible to participate in the defined contribution pension
arrangement or alternatively they may choose to receive a cash allowance in lieu of pension
Benefits A comprehensive and flexible benefits package is offered, emphasising individuals being able to choose the combination of cash and benefits that suits them
Executive Directors receive a benefits package generally set by reference to market practice in companies of a similar size and complexity, particularly FTSE 31-100 companies. Benefits currently provided include a company car or car allowance, private medical insurance, life insurance, health screening, and income protection
The Committee may periodically amend the benefits available to some or all employees. The Executive Directors are eligible to receive such additional benefits as the Committee considers appropriate having regard to market norms
In line with our approach to all employees, certain Group products are offered to Executive Directors at a discount
Executive Directors are eligible to participate in any of the employee share plans operated by the Company, in line with HMRC guidelines (where relevant) and on the same basis as other eligible employees. Currently, this includes the Share Incentive Plan (“SIP”), which has been used to provide an award of free shares to all employees (including Executive Directors), and permit employees to purchase shares with a corresponding matching award
Where an Executive Director is required to relocate to perform their role, they may be offered appropriate relocation benefits. The level of such benefits would be determined based on the circumstances of the individual and typical market practice
Share ownership guidelines
To align the interests of Executive Directors with those of shareholders
Executive Directors are expected to retain all the ordinary shares vesting under any of the Company’s share incentive plans, after any disposals for paying applicable taxes, until they have achieved the required shareholding level; unless such earlier sale, in exceptional circumstances, is permitted by the Chairman
Notes to the policy table Malus and clawback Malus (reducing or forfeiting unvested awards) and clawback (the Company’s ability to claim repayment of paid amounts) provisions apply to the AIP (cash and deferred element) and LTIP if, in the Committee’s opinion, any of the following has occurred:
There has been a material misstatement of the Company’s financial results, which has led to an overpayment
The assessment of performance targets is based on an error, or inaccurate or misleading information or assumptions
Circumstances warranting summary dismissal in the relevant period
A material failure of risk management
An event during the relevant period which has, in the view of the Committee, sufficiently and significantly impacted the Company’s reputation as to justify such action
Amounts in respect of awards under both plans (LTIP and DAIP) may be subject to clawback for up to three years post payment or vesting (with such period lengthened if there is an investigation as to whether relevant circumstances exist) as appropriate. Consistent with developments in the market generally, the provisions clarify that any recoupment is out of the post-tax amount, except to the extent that the participant recovers tax from the relevant tax authority.
Direct Line Group Annual Report & Accounts 2016102

www.directlinegroup.com 103
Maximum opportunity Performance measures
The maximum pension contributions is set at 25% of base salary per annum
Not performance related
The costs of benefits provided may fluctuate from year to year, even if the level of provision has remained unchanged. An annual limit of 10% of base salary per Executive Director has been set for the duration of this policy (plus an additional amount of up to 100% of salary in respect of relocation expenses). The Committee will monitor the costs in practice and ensure the overall costs do not increase by more than the Committee considers to be appropriate in all the circumstances
Additionally, the limit for any employee share plans in which the Executive Directors participate will be in line with the caps permitted by HMRC from time to time
The Executive Directors may be entitled to retain fees received for any directorships held outside the Group
Similarly, while not benefits in the normal usage of that term, certain other items such as hospitality or retirement gifts may also be provided
Not performance related
200% of salary for all Executive Directors The Committee reserves the discretion to amend these levels in
future years
Not applicable
Changes from 2014 policy The main changes from the 2014 policy are summarised below. To aid the administration and clarity of its operation, other minor changes have also been made to the policy:
For LTIP awards made after adopting the new policy at the 2017 AGM, Executive Directors will be subject to an additional two-year holding period following the three-year vesting period, during which time awards may not normally be exercised or released
Consistent with GC100 guidance, the cap to base salary has been re-expressed as a fixed monetary amount. Please note that this is simply to align with reporting guidance and the cap does not represent any form of aspiration
Adding a cap on providing relocation benefits
Exercise of discretion In line with market practice, the Committee retains discretion relating to operating and administering the AIP, DAIP and LTIP. This discretion includes, but is not limited to:
the timing of awards and payments;
the size of awards, within the overall limits disclosed in the policy table;
the determination of vesting;
the treatment of awards in the case of change of control or restructuring;
the treatment of leavers within the rules of the plan, and the termination policy shown on page 107; and
adjustments needed in certain circumstances, for example, a rights issue, corporate restructuring or special interim dividend.
While performance conditions will generally remain unchanged once set, the Committee has the usual discretions to amend the measures, weightings and targets in exceptional circumstances (such as a major transaction) where the original conditions would cease to operate as intended. Any such changes would be explained in the subsequent annual remuneration report and, if appropriate, be the subject of consultation with the Company’s major shareholders. Consistent with best practice, the LTIP rules also provide that any such amendment must not make, in the view of the Committee, the amended condition materially less difficult to satisfy than the original condition was intended to be before such event occurred.
www.directlinegroup.com 103
Strategic reportG
overnanceFinancial statem
ents

Directors’ remuneration report continued
104 Direct Line Group Annual Report & Accounts 2016
Adjusting the number of shares under deferred bonus and LTIP The number of shares subject to deferred bonus and LTIP awards may be increased to reflect the value of dividends that would have been paid in respect of any dates falling between the grant of awards and the date of vesting (or, if later, the expiry of any holding period) of awards (legacy awards made before 2014 accrue dividends to exercise).
The terms of incentive plan awards may be adjusted in the event of a variation of the Company’s share capital, demerger or a similar event that materially affects the price of the shares, or otherwise in accordance with the plan rules.
Remuneration payments agreed before appointment to the Board The Committee reserves the right to make any remuneration payments and payments for loss of office (including, where relevant, exercising any discretions available to it connected with such payments) notwithstanding that they are not in line with the policy set out above where the terms of the payment were agreed (i) before 13 May 2014 (the date the original shareholder approved policy came into effect);(ii) provided the terms of the payment were consistent with any shareholder-approved Directors’ remuneration policy in force at the time they were agreed; (iii) at a time when the relevant individual was not a Director of the Direct Line Insurance Group plc and, in the opinion of the Committee, the payment was not in consideration for the individual becoming a Director of the Company. For these purposes, ‘payments’ include pension arrangements and the Committee satisfying awards of variable remuneration. Relating to an award over shares, the terms of the payment are ‘agreed’ at the time the award is granted.
Selecting performance measures Annual Incentive Plan The Committee has selected the AIP performance measures to incentivise Executive Directors to achieve financial targets for the year, and specific strategic, shared and personal objectives. These measures are aligned with the key performance indicators we use as a business to monitor performance against our strategic priorities, as shown on pages 24 and 25.
The relevant targets are set at or following the start of each year to ensure the Executive Directors focus appropriately on the key objectives for the next twelve months.
Long-Term Incentive Plan The goal of our strategy is to provide long-term sustainable returns for our shareholders. Therefore, for 2017 (as in prior years), awards under the LTIP will continue to be subject to performance against RoTE (an important KPI to the business) and relative TSR targets. The Committee believes this combination provides a balanced approach to measuring Group performance over the longer term by using a stated financial KPI that incentivises individuals to keep growing the business efficiently, and a measure based on relative shareholder return. This combination of measures appropriately balances absolute and relative returns.
As set out in the policy table, different performance measures may apply for awards granted in future years.
Differences in remuneration policy from broader employee population To ensure that the arrangements in place remain appropriate, when determining Executive Directors’ remuneration, the Committee accounts for pay throughout the Group.
The Group has one consistent reward policy for all levels of employees. Therefore, the same reward principles guide reward decisions for all Group employees, including Executive Directors. However, remuneration packages differ to account for appropriate factors in different areas of the business:
AIP – approximately 3,600 employees participate in the AIP. The corporate performance measures for all employees are consistent with those used for Executive Directors, although the weighting attributable to those factors may differ. The Group’s strategic leaders (approximately 60 employees) also receive part of their bonus in Company shares deferred for three years
Incentive awards – approximately 3,800 employees, excluding Executive Directors, participate in a function or team specific incentive plan which assesses personal performance over a monthly period. These incentive awards may pay out monthly or quarterly
LTIP – our strategic leaders participate in the LTIP, currently based on the same performance conditions as those for Executive Directors
RSP – RSP awards are used on a limited basis across the Company to help recruit and retain critical staff, and for talent management. Executive Directors do not receive grants under the RSP
All employee share plans – the Committee considers it important for all employees to have the opportunity to become shareholders in the Company. The HMRC-approved SIP has operated since 2013, and, in addition, the Company has made periodic awards of free shares. At year-end, approximately 3,000 employees throughout the Group had signed up to these schemes with 9,500 holding free shares in the Company
Pension and benefits – depending on employee grade, the Company contributes between 9-25% to the defined contribution pension scheme without any requirement for an employee contribution. Employees may also opt for a proportion or all of this to be paid as cash rather than into the pension scheme
Direct Line Group Annual Report & Accounts 2016104
www.directlinegroup.com 105
Remuneration policy for Non-Executive Directors Element Purpose and link to strategy Approach to setting fees and cap Other items
Chairman and Non-Executive Directors’ fees
To enable the Company to recruit and retain Non-Executive Directors of the highest calibre, at an appropriate cost
Non-Executive Directors are paid a basic annual fee. Additional fees may be paid to Non-Executive Directors who chair a Board Committee, sit on a Board Committee, and for the Senior Independent Director to reflect additional responsibilities, as appropriate. The level of fees for 2017 is shown in the annual remuneration section
The fees paid to the Chairman include all Board and Committee membership fees, and are determined by the Remuneration Committee
Non-Executive Directors may receive certain expenses, including the reimbursement of travel expenses and accommodation or similar which, consistent with general market practice, will be grossed-up for any tax arising on such expenses. It is the Committee’s view that expenses (which are deemed to be benefits) are covered under the aggregate cap set by the Articles of Association and that this cap is not restricted to fees only
Similarly, while not benefits in the normal usage of that term, certain other items such as hospitality or retirement gifts may also be provided
Fee levels for Non-Executive Directors are reviewed and may be increased at appropriate intervals by the Board, with affected individual Directors absenting themselves from deliberations
In setting the level of fees, the Company accounts for the role’s expected time commitment, and fees at other companies of a similar size, sector and/or complexity to the Group
Fees (including expenses which are deemed to be benefits) for Non-Executive Directors are subject to an aggregate cap in the Articles of Association (currently £2,000,000 per annum). The Company reserves the right to change how the elements and weightings within the overall fees are paid, and to pay a proportion of the fees in shares within this limit
The Non-Executive Directors are not entitled to receive any compensation for loss of office, other than fees for their notice period. They do not participate in the Group’s bonus, employee share plans or pension arrangements, and do not receive any employee benefits
Recruitment remuneration policy To strengthen the management team and secure the skills to deliver the Group’s strategic aims, the recruitment remuneration policy aims to give the Committee sufficient flexibility to secure the appointment and promotion of high-calibre executives.
Principles for recruitment remuneration 1. In terms of the principles for setting a package for a new Executive Director, the starting point for the Committee will be to
look to the policy for Executive Directors as set out in the policy table, and structure a package in accordance with that policy. Consistent with the Regulations, the caps contained in the policy table for fixed pay do not apply to new recruits, although the Committee would not envisage exceeding these caps in practice
2. The Company would normally disclose clearly the terms of any recruitment package on announcing the appointment of any new Executive Director
3. For an internal appointment, any variable pay element awarded in respect of the prior role may either continue on its original terms or be adjusted to reflect the new appointment, as appropriate
4. For external and internal appointments (including a major change in role), the Committee may agree that the Company will meet certain relocation expenses, legal and other fees involved in negotiating any recruitment, or pay expatriate benefits in line with the policy table, as appropriate
www.directlinegroup.com 105
Strategic reportG
overnanceFinancial statem
ents

Directors’ remuneration report continued
106 Direct Line Group Annual Report & Accounts 2016
Buy-out awards 5. Where it is necessary to make a recruitment-related pay award to an external candidate, the Company will not pay more than
necessary, in the view of the Committee, and will in all cases seek to deliver any such awards under the terms of the existing incentive pay structure
6. All such awards for external appointments, whether under the AIP, LTIP or otherwise, to compensate for awards forfeited on leaving their previous employer will be determined taking into account the commercial value of the amount forfeited, and the nature, time horizons and performance requirements of those awards. In particular, the Committee’s starting point will be to ensure that any awards being forfeited which remain subject to outstanding performance requirements (other than where substantially complete) are bought out with replacement requirements, and any awards with service requirements are bought out with similar terms. However, exceptionally, the Committee may relax those obligations where it considers it to be in the interests of shareholders and those factors are, in the Committee’s view, equally reflected in some other way, for example through a significant discount to the face value of the awards forfeited
The elements of any package for a new recruit, including the maximum level of variable pay, but excluding buy-outs, will be consistent with the Executive Directors’ remuneration policy described in this report, as modified by the above statement of principles where appropriate. The Committee reserves the right to avail itself of the current Listing Rule 9.4.2 (being the rule which permits exceptional recruitment awards on terms different from any shareholder approved ongoing plans) if needed to facilitate, in exceptional circumstances, recruiting an Executive Director. Awards granted under this provision will only be used for buy-out awards.
Any commitments made before promotion to the Board (except when made in connection with the appointment to the Board) can continue to be honoured under the policy, even if they are not consistent with the policy prevailing when the commitment is fulfilled.
In exceptional circumstances, the initial notice period may be longer than the Company’s 12-month policy up to a maximum of 24 months. However, this will reduce by one month for every month served, until it has reduced to 12 months in line with the Company’s policy position.
The remuneration policy for the Chairman and Non-Executive Directors as set out earlier in this report will apply relating to any recruitments to those positions.
Service contracts Subject to the discretion noted above for new recruits, it is the Company’s policy to set notice periods for Executive Directors of no more than 12 months (both by the Director or Company). The Executive Directors’ service agreements summary is as follows:
Director Effective date of contract Notice period (by Director or Company) Exit payment policy
Paul Geddes 1 September 2012 12 months Base salary only for unexpired portion of notice period to be paid in a lump sum or monthly instalments, in which case, instalments are subject to mitigation if an alternative role is found.
John Reizenstein 1 September 2012 12 months Base salary only for unexpired portion of notice period to be paid in a lump sum or monthly instalments, in which case, instalments are subject to mitigation if an alternative role is found.
Mike Holliday-Williams
30 January 2014 12 months Base salary only for unexpired portion of notice period to be paid in a lump sum or monthly instalments, in which case, instalments are subject to mitigation if an alternative role is found.
There are no further obligations which could give rise to a remuneration or loss of office payment other than those set out in the remuneration policy table and the termination policy overleaf.
Direct Line Group Annual Report & Accounts 2016106

www.directlinegroup.com 107
Termination policy It is appropriate for the Committee to retain discretion to consider the termination terms of any Executive Director, having regard to all the relevant facts and circumstances available to them at the time. A Director is deemed a ‘good leaver’ if the following circumstances are met:
AIP and LTIP – death, injury, ill-health, redundancy, retirement, the sale of the individual’s employing company or business out of the Group, or in such other circumstances as the Committee determines
DAIP – for any reason other than summary dismissal or resignation. However, the Committee may determine that, in the case of resignation only, awards may be retained
The table below sets out the general position. However, it should be noted that the Committee, consistent with most other companies, has reserved a broad discretion to determine whether an Executive Director should be categorised as a ‘good leaver’, and that discretion forms part of the approved policy.
Incentives
If a leaver is a ‘bad leaver’, for example leaving through resignation or summary dismissal
If a leaver is deemed to be a ‘good leaver’
Other events, for example, change in control of Company
Annual Incentive Plan No awards made Bonus based on performance, paid at the normal time and on a time pro-rata basis, unless the Committee determines otherwise
Bonus determined on such basis as the Committee considers appropriate and paid on a time pro-rata basis, unless the Committee determines otherwise
Deferred Annual Incentive Plan
All awards will lapse Deferred shares typically vest on the normal vesting date, although the Committee reserves discretion to accelerate vesting. In the case of the participant’s death or other exceptional circumstances, awards may vest immediately
Awards will vest in full
In the event of a demerger or similar event, the Committee may determine that awards vest on the same basis
Long-Term Incentive Plan
All unvested awards will lapse
During the holding period, awards cease to be contingent on employment and, therefore, will not lapse (except on dismissal for cause) but may be subject to malus
Awards will vest on the normal vesting date (plus any applicable holding period, unless the Committee determines otherwise) subject to performance and, unless the Committee determines otherwise, time pro-rating. In exceptional circumstances, as determined by the Committee, for example, in the case of the participant’s death, awards may vest immediately
Awards will vest subject to applying the performance conditions and, unless the Committee determines otherwise, time pro-rating. The Committee may determine that such awards shall not vest early and, instead, be rolled over into replacement awards granted on a similar basis, but over shares in the acquirer or another company or settled in cash or other securities.
In the event of a demerger or similar event, the Committee may determine that awards vest on the same basis
Service agreements for all Executive Directors provide that they are not eligible to receive any enhanced redundancy terms which may be offered by the Group from time to time. Their rights to a statutory redundancy payment are not affected.
Depending on the circumstances of departure, an Executive Director may have additional claims under relevant employment protection laws, and the Company may contribute to any legal fees involved in agreeing a termination. It may also agree to incur certain other expenses such as providing outplacement services. Any such fees would be disclosed as part of the detail of any termination arrangements. The Committee reserves the right to make any other payments connected with a Director’s cessation of office or employment, where the payments are made in good faith in discharge of an existing legal obligation (or by way of damages for breach of such an obligation) or by way of a compromise or settlement of any claim arising connected with the cessation of a Director’s office or employment.
www.directlinegroup.com 107
Strategic reportG
overnanceFinancial statem
ents

Directors’ remuneration report continued
108 Direct Line Group Annual Report & Accounts 2016
Non-Executive Director letters of appointment Non-Executive Directors are appointed for a three-year term which may be extended by mutual agreement. In common with the Executive Directors, all Non-Executives are subject to annual re-election by shareholders.
The Directors may appoint additional members to join the Board during the year. Directors appointed in this way will be subject to election by shareholders at the first AGM after their appointment. In subsequent years, the Directors must submit themselves for re-election at each AGM.
Terms and conditions of appointment of all the Directors are available for anyone to inspect at the Company’s registered office and AGM.
The Chairman and Non-Executive Directors have notice periods of three months from either party which do not apply in the case of a Director not being re-elected by shareholders or retiring from office under the Articles of Association. Other than fees for this notice period, the Chairman and Non-Executive Directors are not entitled to any compensation on exit.
External directorships The Company encourages Executive Directors to accept, subject to the Chairman’s approval, an invitation to join the board of another company outside the Group in a non-executive capacity, recognising the value of such wider experience. In these circumstances, they are permitted to retain any remuneration from the non-executive appointment. Executive Directors are generally limited to accepting one external directorship, but may accept more with the Chairman’s prior approval.
Considering employment conditions elsewhere in the Group As explained elsewhere in the Directors’ remuneration report, the Committee reviews the overall pay and bonus decisions in aggregate for the wider Group, and, therefore, takes into account pay and conditions in the wider Group in determining the Directors’ remuneration policy and the remuneration payable to Directors. Through the Chief Executive Officer, Paul Geddes, and other senior management, the Committee may receive input from employee groups in the Group, such as the Employee Representative Body, as required.
In accordance with prevailing commercial practice, the Committee did not consult with employees in preparing the Directors’ remuneration policy.
Considering shareholders’ views The Committee accounts for the approval levels of remuneration related matters at the AGM in determining whether the current Directors’ remuneration policy remains appropriate.
When setting the remuneration policy, the Committee, consistent with its approach of operating within the highest standards of corporate governance, takes significant account of guidelines issued by the leading shareholder and proxy agencies.
The Committee also seeks to build an active and productive dialogue with investors on developments in the remuneration aspects of corporate governance generally, and particularly, any changes to the Company’s executive pay arrangements.
The Committee is satisfied that no element of the Directors’ remuneration policy conflicts with the Group’s approach to environmental, social or corporate governance matters.
Direct Line Group Annual Report & Accounts 2016108

www.directlinegroup.com 109
Performance scenarios The Directors’ remuneration policy has been designed to ensure that a significant proportion of total remuneration is delivered as variable pay and, therefore, depends on performance against our strategic objectives.
The Committee has considered the level of remuneration that may be paid under different performance scenarios to ensure it would be appropriate in each situation, in the context of the performance delivered and the value created for shareholders.
The following charts show the potential remuneration which Executive Directors may earn under three performance scenarios (assuming the adoption of the proposed Policy) as set out below. These exclude share price appreciation and dividends which could have a significant impact on the final outcome.
The elements of remuneration included in each scenario are as follows:
Minimum Consists of fixed remuneration only (that is, base salary, benefits and pension): Base salary is the salary to be paid from 1 April 2017
Benefits measured as benefits paid in 2016 as set out in the single figure table on page 87, including the value of matching shares under the SIP where relevant
Pension measured as the defined contribution or cash allowance in lieu of Company contributions, as a percentage of salary (25% of base salary for the CEO and CFO, and 15% of salary for the MD Personal Lines)
On-target Based on what the Director would receive if performance was on-target (excluding share price appreciation and dividends):
Fixed remuneration as above
AIP – consists of the on-target bonus of 60% of maximum bonus opportunity
LTIP – consists of the threshold level of vesting (20% vesting)
Maximum Based on the maximum remuneration receivable (excluding share price appreciation and dividends): Fixed remuneration as above
AIP – consists of the maximum bonus (175% of base salary for the CEO and 150% for the CFO and the MD Personal Lines)
LTIP – consists of the face value of awards (200% of base salary for all Executive Directors)
The Board reviewed and approved this report on 6 March 2017.
Clare Thompson Chair of the Remuneration Committee
www.directlinegroup.com 109
Strategic reportG
overnanceFinancial statem
ents
Total fixed pay Short term Incentives Long term Incentives
15% 2,207
100% 1,032
47%
25%
38%
35% 40% 4,071
CEO – Paul Geddes (£’000)
Minimum
On-target
Maximum
£0m £1m £2m £3m £4m
Total fixed pay Short term Incentives Long term Incentives
16% 1,261
100% 624
49%
27%
35%
31% 42% 2,341
CFO – John Reizenstein (£’000)
Minimum
On-target
Maximum
£0m £1m £2m £3m £4m
Total fixed pay Short term Incentives Long term Incentives
16% 1,360
100% 647
48%
25%
36%
32% 43% 2,568
MD Personal Lines – Mike Holliday-Williams (£’000)
Minimum
On-target
Maximum
£0m £1m £2m £3m £4m

Directors’ report
110 Direct Line Group Annual Report & Accounts 2016
The Directors present their report for the financial year ended 31 December 2016.
You can find the forward-looking statements disclaimer on page 195.
Strategic report The Company’s Strategic report is on pages 1 to 47. It includes the following information that would otherwise need to be disclosed in this Directors’ report:
Subject Pages
Use of financial instruments 44 and 45Likely future developments in the business
34 to 37 and 47
Employee involvement 13, 17 and 32 to 33
Corporate governance statement The FCA’s Disclosure Guidance and Transparency Rules require a corporate governance statement in the Directors’ report to include certain information. You can find information that fulfils the corporate governance statement’s requirements in this Directors’ report; the Corporate Governance report; the Committee reports; and the Directors’ remuneration report, on pages 48 to 109. This information is incorporated in the Directors’ report by reference.
Disclosure of information under Listing Rule 9.8.4R In accordance with Listing Rule 9.8.4C, the table below sets out the location of the information required to be disclosed, where applicable.
Subject Page
Interest capitalised by the Group NoneUnaudited financial information NoneLong-term incentive plan involving one Director only
97
Directors’ waivers of emoluments 97Directors’ waivers of future emoluments Not applicableNon pro-rata allotments for cash (issuer) Not applicable Non pro-rata allotments for cash (major subsidiaries)
None
Listed company is a subsidiary of another company
Not applicable
Contracts of significance involving a director Not applicableContracts of significance involving a controlling shareholder
Not applicable
Details of shareholder dividend waivers 111Controlling shareholder agreements Not applicable
Post-balance sheet events The Group has made an adjustment to its consolidated financial statements following the announcement on 27 February 2017 by the Lord Chancellor of a reduction in the Ogden discount rate to minus 0.75%.
Dividends The Group aims to generate long-term sustainable value for shareholders, while balancing operational, regulatory,
rating agency and policyholder requirements. The Board has a progressive dividend policy for the Company. This aims to increase the dividend annually in real terms to reflect the Company’s cash-flow generation and long-term earnings potential.
The Group expects that one-third of the annual dividend will generally be paid in the third quarter as an interim dividend, and two-thirds will be paid as a final dividend in the second quarter of the following year. The Board may revise the dividend policy from time to time.
Additionally, if the Board believes the Group has capital surplus to its view of its solvency capital requirements, it is intended that such excess capital will be returned to shareholders alongside the full-year results. The Company may consider a special dividend and/or a repurchase of its own shares to distribute surplus capital to shareholders.
The Board recommends a final dividend of 9.7 pence per share to shareholders. Subject to shareholder approval at the Company’s 2017 AGM, this will become payable on 18 May 2017 to all holders of Ordinary Shares on the Register of members at close of business on 17 March 2017.
The final dividend resolution provides that the Board may cancel the dividend and, therefore, payment of the dividend at any time before payment, if it considers it necessary to do so for regulatory capital purposes. You can find detailed explanations about this in the Notice of AGM.
You can find further details regarding dividends paid during 2015 and 2016 in the Finance review on page 38 and in note 15 to the financial statements on page 159. You can also find information on dividends and capital management in the Finance review on page 45.
Directors You can find the current Directors’ biographies on pages 50 to 51. All Directors will retire and be submitted for election and re-election at the 2017 AGM. This is in accordance with the UK Corporate Governance Code and the Articles of Association of the Company, which govern appointing and replacing Directors. The Directors listed on pages 50 and 51 were the Directors of the Company throughout the year apart from Dr Richard Ward, who was appointed as a Director on 18 January 2016, Priscilla Vacassin, who resigned as a Director on 1 March 2016 and Danuta Gray and Mike Holliday-Williams who were appointed as Directors of the Company on 1 February 2017.
The Company’s Articles of Association set out the Directors’ powers. You can view these on the Company’s website at www.directlinegroup.com. The Directors’ powers are also subject to relevant legislation and, in certain circumstances, authority from the Company’s shareholders. You can find details of the Directors’ remuneration, service contracts, employment contracts and interests in the shares of the Company in the Directors’ remuneration report on pages 82 to 109.
The Articles of Association of the Company permit it to indemnify the Company’s officers, and officers of any associated company, against liabilities arising from conducting Company business, to the extent permitted by law. As such,
Direct Line Group Annual Report & Accounts 2016110

Directors’ report
110 Direct Line Group Annual Report & Accounts 2016
The Directors present their report for the financial year ended 31 December 2016.
You can find the forward-looking statements disclaimer on page 195.
Strategic report The Company’s Strategic report is on pages 1 to 47. It includes the following information that would otherwise need to be disclosed in this Directors’ report:
Subject Pages
Use of financial instruments 44 and 45Likely future developments in the business
34 to 37 and 47
Employee involvement 13, 17 and 32 to 33
Corporate governance statement The FCA’s Disclosure Guidance and Transparency Rules require a corporate governance statement in the Directors’ report to include certain information. You can find information that fulfils the corporate governance statement’s requirements in this Directors’ report; the Corporate Governance report; the Committee reports; and the Directors’ remuneration report, on pages 48 to 109. This information is incorporated in the Directors’ report by reference.
Disclosure of information under Listing Rule 9.8.4R In accordance with Listing Rule 9.8.4C, the table below sets out the location of the information required to be disclosed, where applicable.
Subject Page
Interest capitalised by the Group NoneUnaudited financial information NoneLong-term incentive plan involving one Director only
97
Directors’ waivers of emoluments 97Directors’ waivers of future emoluments Not applicableNon pro-rata allotments for cash (issuer) Not applicable Non pro-rata allotments for cash (major subsidiaries)
None
Listed company is a subsidiary of another company
Not applicable
Contracts of significance involving a director Not applicableContracts of significance involving a controlling shareholder
Not applicable
Details of shareholder dividend waivers 111Controlling shareholder agreements Not applicable
Post-balance sheet events The Group has made an adjustment to its consolidated financial statements following the announcement on 27 February 2017 by the Lord Chancellor of a reduction in the Ogden discount rate to minus 0.75%.
Dividends The Group aims to generate long-term sustainable value for shareholders, while balancing operational, regulatory,
rating agency and policyholder requirements. The Board has a progressive dividend policy for the Company. This aims to increase the dividend annually in real terms to reflect the Company’s cash-flow generation and long-term earnings potential.
The Group expects that one-third of the annual dividend will generally be paid in the third quarter as an interim dividend, and two-thirds will be paid as a final dividend in the second quarter of the following year. The Board may revise the dividend policy from time to time.
Additionally, if the Board believes the Group has capital surplus to its view of its solvency capital requirements, it is intended that such excess capital will be returned to shareholders alongside the full-year results. The Company may consider a special dividend and/or a repurchase of its own shares to distribute surplus capital to shareholders.
The Board recommends a final dividend of 9.7 pence per share to shareholders. Subject to shareholder approval at the Company’s 2017 AGM, this will become payable on 18 May 2017 to all holders of Ordinary Shares on the Register of members at close of business on 17 March 2017.
The final dividend resolution provides that the Board may cancel the dividend and, therefore, payment of the dividend at any time before payment, if it considers it necessary to do so for regulatory capital purposes. You can find detailed explanations about this in the Notice of AGM.
You can find further details regarding dividends paid during 2015 and 2016 in the Finance review on page 38 and in note 15 to the financial statements on page 159. You can also find information on dividends and capital management in the Finance review on page 45.
Directors You can find the current Directors’ biographies on pages 50 to 51. All Directors will retire and be submitted for election and re-election at the 2017 AGM. This is in accordance with the UK Corporate Governance Code and the Articles of Association of the Company, which govern appointing and replacing Directors. The Directors listed on pages 50 and 51 were the Directors of the Company throughout the year apart from Dr Richard Ward, who was appointed as a Director on 18 January 2016, Priscilla Vacassin, who resigned as a Director on 1 March 2016 and Danuta Gray and Mike Holliday-Williams who were appointed as Directors of the Company on 1 February 2017.
The Company’s Articles of Association set out the Directors’ powers. You can view these on the Company’s website at www.directlinegroup.com. The Directors’ powers are also subject to relevant legislation and, in certain circumstances, authority from the Company’s shareholders. You can find details of the Directors’ remuneration, service contracts, employment contracts and interests in the shares of the Company in the Directors’ remuneration report on pages 82 to 109.
The Articles of Association of the Company permit it to indemnify the Company’s officers, and officers of any associated company, against liabilities arising from conducting Company business, to the extent permitted by law. As such,
www.directlinegroup.com 111
the Company has executed deeds of indemnity for each Director’s benefit, regarding liabilities that may attach to them in their capacity as Directors of the Company or associated companies. These indemnities are qualifying third-party indemnities as defined by section 234 of the Companies Act 2006. No amount was paid under any of these indemnities during the year. The Company maintains directors’ and officers’ liability insurance. This provides appropriate cover for legal actions brought against its Directors. The Company has also provided the directors of DLG Pension Trustee Limited with qualifying pension scheme indemnities. This is in accordance with section 235 of the Companies Act 2006. DLG Pension Trustee Limited acts as trustee for two of the Company’s occupational pension schemes.
Secretary Roger Clifton is the Company Secretary of Direct Line Insurance Group plc. He can be contacted at the Company’s Registered Office, details of which are on page 196.
Share capital The Company has a premium listing on the London Stock Exchange. As at 31 December 2016, the Company’s share capital comprised 1,375,000,000 fully paid Ordinary Shares of 10 10/11 pence each.
At the Company’s 2016 AGM, the Directors were authorised to:
allot shares in the Company or grant rights to subscribe for, or convert, any security into shares up to an aggregate nominal amount of £50,000,000;
allot shares up to an aggregate nominal amount of £100,000,000, for the purpose of a rights issue;
allot shares having a normal amount not exceeding in aggregate £15,000,000 for cash without offering the shares first to existing shareholders in proportion to their holdings; and
make market purchases of up to 137,500,000 shares in the Company, representing 10% of the Company’s issued share capital at the time.
To date, the Directors have not used these authorities. At the 2017 AGM, shareholders will be asked to renew these authorities and vote on some additional resolutions in relation to the disapplication of pre-emption rights and the issue of Solvency II Tier 1 Instruments in line with the most recent institutional investors’ guidelines. The Company has not held any shares in treasury during the period under review. You can find out more about the Company’s share capital and shares under option at 31 December 2016 in notes 29 and 35 to the consolidated financial statements.
Under the Company’s Share Incentive Plan, Trustees hold shares on behalf of employee participants. The Trustees will only vote on those shares and receive dividends that a participant beneficially owns, in accordance with the participant’s wishes. An Employee Benefit Trust also operates. The Trustee of this has discretion to vote on any shares it holds as it sees fit, except any shares participants own beneficially; in which case, the Trustee will only vote on such shares as per the participant’s instructions.
The Trustee of this Trust has waived its right to dividends on all shares within the Trust. You can find out more about the number of shares held by the employee share plan trusts in note 29 on page 166. The Company is only aware of the dividend waivers and voting restrictions mentioned above.
Shareholder voting rights and restrictions on transfer of shares All the Company’s issued Ordinary Shares rank equally in all respects. The Company’s Articles of Association set out the rights and obligations attaching to the Company’s Ordinary Shares.
Employees in the Company and Directors must conform with the EU Market Abuse Regulation and the Company’s share dealing rules. These rules restrict particular employees’ and Directors’ ability to deal in the Company’s shares at certain times, and require the employee or Director to obtain permission to deal before doing so. Some of the Company’s employee share plans also include restrictions on transferring shares while the shares are held within the plans.
Each general meeting notice will specify the time for determining a shareholder’s entitlement to attend and vote at the meeting. This will not be more than 48 hours before the time fixed for the meeting. To be valid, all proxy appointments must be filed at least 48 hours before the time of the general meeting. In calculating this time period, no account shall be taken of any part of a day that is not a working day.
Where the Company has issued a notice under section 793 of the Companies Act 2006, which is in default for at least 14 days, the person(s) interested in those shares shall not be entitled to attend or vote at any general meeting until the default has been corrected or the shares sold.
There is no arrangement or understanding with any shareholder, customer or supplier, or any other external party, which provides the right to appoint a Director or a member of the Executive Committee, or any other special rights regarding control of the Company.
Articles of Association Unless expressly specified to the contrary in the Articles of Association, they may only be amended by a special resolution of the Company’s shareholders at a general meeting.
Significant agreements affected by a change of control A number of agreements may take effect, alter or terminate upon a change of control of the Company. None of these agreements are considered significant in terms of their impact on the Group’s business as a whole.
All the Company’s employee share incentive plans contain provisions relating to a change of control. Outstanding awards would typically vest and become exercisable. This is subject to satisfying any performance conditions, and normally with an additional time-based pro-rata reduction where performance conditions apply, and approval from the Remuneration Committee.
www.directlinegroup.com 111
Strategic reportG
overnanceFinancial statem
ents

Directors’ report continued
112 Direct Line Group Annual Report & Accounts 2016
Substantial shareholdings In accordance with the provisions of chapter 5 of the FCA’s Disclosure Guidance and Transparency Rules, the Company has been notified of the following indirect interests in the Company’s voting rights. The Company has not been notified of any direct interests. Information provided by the Company pursuant to the FCA’s Disclosure Guidance and Transparency Rules is publicly available via the regulatory information services and on the Company’s website.
31 December 2016
15 March2017
BlackRock, Inc. 5.08% 8.43%
Political donations The Group made no political donations during the year (2015: nil).
Employees with disabilities The Group is committed to promoting diversity and inclusion across every area of the business through initiatives such as the Diversity Network Alliance. At recruitment, we adjust and enhance our application and selection process, and guide and provide additional training for interviewers, where necessary.
Our Diversity Network Alliance focuses on a number of strands including employees with disabilities. It identifies areas where we can improve and help people continue working for us. We reasonably adjust employees’ working environments and equipment, and roles and role requirements. We also ensure that everyone can access the same opportunities.
Greenhouse gas emissions In order to comply with the Companies Act 2006 (Strategic and Directors’ Report) Regulations 2013, the Group has followed the 2013 UK Government environmental reporting guidance for GHG emissions; used the UK Government’s greenhouse gas conversion factors; and adopted the financial control approach to setting the organisational boundaries of responsibilities for GHG emissions. In applying the GHG Protocol Corporate Accounting and Reporting Standard (revised edition) we have calculated emissions associated with electricity consumption solely using the location-based scope 2 calculation method. GHG emissions are classified as direct or indirect, and divided into scope 1 and scope 2 emissions. Direct GHG emissions are those from sources that the Group owns or controls. Indirect GHG emissions are those that are a consequence of the Group’s activities, but occur at sources owned or controlled by another organisation. The Group has considered the six main GHGs, reported in tonnes of carbon dioxide equivalent (“CO2e”), and set 2013 as the base year. The Group has not included emissions from the International division, which was sold in May 2015, nor has it included emissions associated with its investment portfolio.
Scope 1 – direct emissions including fuels used in office buildings, accident repair centres, and owned vehicles
Scope 2 – indirect emissions resulting from generating electricity purchased for office buildings and accident repair centres
Total GHG emissions for continuing operations for 2016 were 19,315 tonnes (2015: 22,611 tonnes), as set out in the table below. This primarily comprised emissions from purchased electricity and natural gas, diesel fuel, and refrigerant gas used. In addition to total emissions, the Group also monitors emissions per £ million of net earned premium. In 2016, this was 6.4 tonnes CO2e per £ million of net earned premium for continuing operations (2015: 8.0 tonnes). This is a measure of how efficiently insurance products are provided. It allows us to compare our year-on-year performance and performance against other insurance companies. Ecometrica has externally verified the GHG emissions data. You can find verification statements on the Group’s website at www.directlinegroup.com.
You can find further information on the Group’s approach to energy and the environment in the CSR section on page 32.
Year on Year comparison Direct Line Continuing Operations Emissions from:
Tonnes of CO2e
2013 (Baseline) 2015 2016
Percentage change
(2013 to 2016)
Scope 1 8,429 7,643 7,383 -12%Scope 2 21,480 14,968 11,932 -44%Total 29,909 22,611 19,315 -35%Intensity metric: tonnes CO2e/ million GBP net earned premium 8.5 8 6.4 -24%
Going concern The Group has sufficient financial resources to meet its financial needs, including managing a mature portfolio of insurance risk. The Directors believe the Group is well positioned to manage its business risks successfully in the current economic environment.
The Finance review on pages 45 and 46 describes the Group’s capital management strategy, which covers how it measures its regulatory and economic capital needs, and deploys capital.
The Group’s financial position is also covered in that section, including a commentary on cash and investment levels, reserves, currency management, insurance liability management, liquidity, and borrowings. Additionally, note 3 to the consolidated financial statements describes capital management needs and policies. The note also covers insurance, market, liquidity and credit risks which may affect the Group’s financial position.
Having made due enquiries, the Directors reasonably expect that the Company and the Group have adequate resources to continue in operational existence for at least 12 months from the date of approval of the financial statements. Accordingly, the Directors have adopted the going concern basis in preparing the financial statements.
Direct Line Group Annual Report & Accounts 2016112

Directors’ report continued
112 Direct Line Group Annual Report & Accounts 2016
Substantial shareholdings In accordance with the provisions of chapter 5 of the FCA’s Disclosure Guidance and Transparency Rules, the Company has been notified of the following indirect interests in the Company’s voting rights. The Company has not been notified of any direct interests. Information provided by the Company pursuant to the FCA’s Disclosure Guidance and Transparency Rules is publicly available via the regulatory information services and on the Company’s website.
31 December 2016
15 March2017
BlackRock, Inc. 5.08% 8.43%
Political donations The Group made no political donations during the year (2015: nil).
Employees with disabilities The Group is committed to promoting diversity and inclusion across every area of the business through initiatives such as the Diversity Network Alliance. At recruitment, we adjust and enhance our application and selection process, and guide and provide additional training for interviewers, where necessary.
Our Diversity Network Alliance focuses on a number of strands including employees with disabilities. It identifies areas where we can improve and help people continue working for us. We reasonably adjust employees’ working environments and equipment, and roles and role requirements. We also ensure that everyone can access the same opportunities.
Greenhouse gas emissions In order to comply with the Companies Act 2006 (Strategic and Directors’ Report) Regulations 2013, the Group has followed the 2013 UK Government environmental reporting guidance for GHG emissions; used the UK Government’s greenhouse gas conversion factors; and adopted the financial control approach to setting the organisational boundaries of responsibilities for GHG emissions. In applying the GHG Protocol Corporate Accounting and Reporting Standard (revised edition) we have calculated emissions associated with electricity consumption solely using the location-based scope 2 calculation method. GHG emissions are classified as direct or indirect, and divided into scope 1 and scope 2 emissions. Direct GHG emissions are those from sources that the Group owns or controls. Indirect GHG emissions are those that are a consequence of the Group’s activities, but occur at sources owned or controlled by another organisation. The Group has considered the six main GHGs, reported in tonnes of carbon dioxide equivalent (“CO2e”), and set 2013 as the base year. The Group has not included emissions from the International division, which was sold in May 2015, nor has it included emissions associated with its investment portfolio.
Scope 1 – direct emissions including fuels used in office buildings, accident repair centres, and owned vehicles
Scope 2 – indirect emissions resulting from generating electricity purchased for office buildings and accident repair centres
Total GHG emissions for continuing operations for 2016 were 19,315 tonnes (2015: 22,611 tonnes), as set out in the table below. This primarily comprised emissions from purchased electricity and natural gas, diesel fuel, and refrigerant gas used. In addition to total emissions, the Group also monitors emissions per £ million of net earned premium. In 2016, this was 6.4 tonnes CO2e per £ million of net earned premium for continuing operations (2015: 8.0 tonnes). This is a measure of how efficiently insurance products are provided. It allows us to compare our year-on-year performance and performance against other insurance companies. Ecometrica has externally verified the GHG emissions data. You can find verification statements on the Group’s website at www.directlinegroup.com.
You can find further information on the Group’s approach to energy and the environment in the CSR section on page 32.
Year on Year comparison Direct Line Continuing Operations Emissions from:
Tonnes of CO2e
2013 (Baseline) 2015 2016
Percentage change
(2013 to 2016)
Scope 1 8,429 7,643 7,383 -12%Scope 2 21,480 14,968 11,932 -44%Total 29,909 22,611 19,315 -35%Intensity metric: tonnes CO2e/ million GBP net earned premium 8.5 8 6.4 -24%
Going concern The Group has sufficient financial resources to meet its financial needs, including managing a mature portfolio of insurance risk. The Directors believe the Group is well positioned to manage its business risks successfully in the current economic environment.
The Finance review on pages 45 and 46 describes the Group’s capital management strategy, which covers how it measures its regulatory and economic capital needs, and deploys capital.
The Group’s financial position is also covered in that section, including a commentary on cash and investment levels, reserves, currency management, insurance liability management, liquidity, and borrowings. Additionally, note 3 to the consolidated financial statements describes capital management needs and policies. The note also covers insurance, market, liquidity and credit risks which may affect the Group’s financial position.
Having made due enquiries, the Directors reasonably expect that the Company and the Group have adequate resources to continue in operational existence for at least 12 months from the date of approval of the financial statements. Accordingly, the Directors have adopted the going concern basis in preparing the financial statements.
www.directlinegroup.com 113
Viability statement The Strategic report, on pages 1 to 47, sets out the Group’s financial performance, business environment, outlook and financial management strategies. It covers how the Group measures its regulatory and economic capital needs, and deploys capital. You can find discussion about the Group’s principal risks and risk management on pages 26 to 29. Note 3 to the consolidated financial statements starts on page 136 and sets out financial disclosures relating to the Group’s principal risks. This covers insurance, market and credit risk; and the Group’s approach to monitoring, managing and mitigating exposures to these risks.
Every year, the Board considers a five-year strategic plan for the Group. The plan makes certain assumptions in respect of the competitive markets in which the Group operates, and the delivery and implementation of the next generation of customer systems. Appropriate aspects of the strategic plan are stress-tested to understand and help set capital and other requirements.
When reviewing the strategic plan, the Board considered the Group’s prospects over the five-year period that the plan covered. This review included reviews of solvency, liquidity, assessment of principal risks, and risk management. The one-year planning period has greater certainty, so it was used to set detailed budgets across the Group. Outcomes for the four-year period are less certain. However, the plan provides a robust planning tool for strategic decisions. The Board recognises that, in a strategic plan, uncertainty increases over time and, therefore, future outcomes cannot be guaranteed or accurately predicted.
Considering the Group’s current capital and trading position, its principal risks, and the remaining four years of the strategic plan, the Board has a reasonable expectation that the Company and the Group can continue in operation, and provide the appropriate degree of protection to those who are, or may become, policyholders or claimants in the period to 31 December 2020.
Disclosing information to the Auditor Each Director at the date of approving this Annual Report & Accounts confirms that: as far as they are aware, there is no relevant audit information of which Deloitte LLP, the Company’s External Auditor, is unaware; and they have taken all the steps they ought to have taken as a Director to make themselves aware of any relevant audit information, and establish that Deloitte LLP is aware of that information.
This confirmation is given and should be interpreted in accordance with the provisions of section 418 of the Companies Act 2006.
Auditor Deloitte LLP has expressed its willingness to continue in office as the External Auditor. A resolution to reappoint Deloitte LLP will be proposed at the forthcoming AGM. You can find an assessment of the effectiveness and recommendation for reappointing Deloitte LLP in the Audit Committee report on page 67.
Directors’ responsibility statement The Directors are responsible for preparing the Annual Report and financial statements in accordance with applicable law and regulations.
Company law requires the Directors to prepare such financial statements for each financial year. Under that law, the Directors must prepare the Group financial statements in accordance with IFRS, as adopted by the EU and Article 4 of the International Accounting Standard (“IAS”) regulation. The Directors have also chosen to prepare the Parent Company financial statements under IFRS, as adopted by the EU. Under company law, the Directors must not approve the accounts unless they are satisfied that they give a true and fair view of the Company’s state of affairs and profit or loss for that period.
In preparing these financial statements, IAS 1 requires that Directors: properly select and apply accounting policies; present information, including accounting policies, in a manner that provides relevant, reliable, comparable and understandable information; provide additional disclosures when compliance with the specific requirements in IFRS is insufficient to enable users to understand the impact of particular transactions, other events and conditions on the entity’s financial position and financial performance; and assess the Company’s ability to continue as a going concern.
The Directors are responsible for keeping adequate accounting records that are sufficient to show and explain the Company’s transactions and disclose, with reasonable accuracy, the Company’s financial position at any time; and enable them to ensure the financial statements comply with the Companies Act 2006. Additionally, the Directors are responsible for safeguarding the Company’s assets and, hence, taking reasonable steps to prevent and detect fraud and other irregularities. The Directors are responsible for maintaining and ensuring the integrity of the corporate and financial information included on the Company’s website at www.directlinegroup.com. Legislation in the UK governing preparing and disseminating financial statements may differ from legislation in other jurisdictions.
The Directors confirm that, to the best of their knowledge: the financial statements, prepared in accordance with IFRS, give a true and fair view of the assets, liabilities, financial position, and profit or loss of the Company, and the undertakings included in the consolidation taken as a whole; and the Strategic report (on pages 1 to 47) and Directors’ report (on pages 110 to 113) include a fair review of the business's development and performance; and the position of the Company and the undertakings included in the consolidation taken as a whole, together with a description of the principal risks and uncertainties they face.
The Board reviewed and approved this report on 6 March 2017.
By order of the Board
Roger C. Clifton Company Secretary
www.directlinegroup.com 113
Strategic reportG
overnanceFinancial statem
ents
Direct Line Group Annual Report & Accounts 2016114
Contents
114 Direct Line Group Annual Report & Accounts 2016
Financial statements Independent Auditor’s report 115
Consolidated financial statements Consolidated income statement 122
Consolidated statement of comprehensive income 123
Consolidated balance sheet 124
Consolidated statement of changes in equity 125
Consolidated cash flow statement 126
Notes to the consolidated financial statements 1. Accounting policies 127
2. Critical accounting estimates and judgements 134
3. Risk management 136
4. Segmental analysis 149
5. Discontinued operations and disposal group 152
6. Net earned premium 154
7. Investment return 154
8. Other operating income 155
9. Net insurance claims 155
10. Commission expenses 155
11. Operating expenses 155
12. Finance costs 157
13. Tax charge 157
14. Current and deferred tax 158
15. Dividends 159
16. Earnings per share 159
17. Net assets per share and return on equity 160
18. Goodwill and other intangible assets 161
19. Property, plant and equipment 163
20. Investment property 163
21. Subsidiaries 164
22. Reinsurance assets 164
23. Deferred acquisition costs 164
24. Insurance and other receivables 164
25. Derivative financial instruments 165
26. Financial investments 165
27. Cash and cash equivalents and borrowings 166
28. Assets held for sale 166
29. Share capital 166
30. Other reserves 167
31. Subordinated liabilities 167
32. Insurance liabilities 168
33. Unearned premium reserve 169
34. Retirement benefit obligations 170
35. Share-based payments 172
36. Trade and other payables including insurance payables
174
37. Notes to the consolidated cash flow statement 175
38. Contingent liabilities 175
39. Commitments 176
40. Fair value 176
41. Related parties 178
42. Post balance sheet event 178
Parent Company financial statements Parent Company balance sheet 179
Parent Company statement of comprehensive income 180
Parent Company statement of changes in equity 180
Parent Company cash flow statement 181
Notes to the Parent Company financial statements 1. Accounting policies 182
2. Investment in subsidiary undertakings 182
3. Other receivables 183
4. Current and deferred tax 184
5. Derivative financial instruments 184
6. Financial investments 184
7. Cash and cash equivalents 184
8. Share capital and capital reserves 184
9. Subordinated liabilities 185
10. Trade and other payables 185
11. Dividends 185
12. Cash generated from operations 185
13. Related parties 186
14. Share-based payments 186
15. Risk management 186
16. Directors and key management remuneration 186

www.directlinegroup.com 115
Strategic reportG
overnanceFinancial statem
ents
Independent Auditor’s report to the shareholders of Direct Line Insurance Group plc
www.directlinegroup.com 115
Opinion on the financial statements of Direct Line Insurance Group plc In our opinion:
the financial statements give a true and fair view of the state of the Group’s and of the Parent Company’s affairs as at 31 December 2016 and of the Group’s and Parent Company’s profit for the year then ended;
the financial statements have been properly prepared in accordance with IFRSs as adopted by the European Union; and
the financial statements have been prepared in accordance with the requirements of the Companies Act 2006 and, as regards the Group financial statements, Article 4 of the IAS Regulation.
The financial statements, including within the Annual Report and Accounts, comprise:
the Consolidated Income Statement;
the Consolidated and Parent Company Statement of Comprehensive Income;
the Consolidated and Parent Company Balance Sheets;
the Consolidated and Parent Company Cash Flow Statements;
the Consolidated and Parent Company Statements of Changes in Equity; and
the related notes 1 to 42 on the consolidated financial statements, and the related notes 1 to 16 on the Parent Company financial statements.
The financial reporting framework has been applied in their preparation is applicable law and IFRSs as adopted by the European Union.
Separate opinion in relation to IFRSs as issued by the IASB As explained in note 1 to the consolidated financial statements, in addition to complying with its legal obligation to apply IFRSs as adopted by the EU, the Group has also applied IFRSs as issued by the IASB.
In our opinion the Group financial statements comply with IFRSs as issued by the IASB.
Independence We are required to comply with the Financial Reporting Council’s Ethical Standards for Auditors and we confirm that we are independent of the Group and we have fulfilled our other ethical responsibilities in accordance with those standards. We also confirm we have not provided any of the prohibited non-audit services referred to in those standards.
Going concern and the Directors’ assessment of the principal risks that would threaten the solvency or liquidity of the Group As required by the Listing Rules we have reviewed the Directors’ statement on pages 61 and 62 regarding the appropriateness of the going concern basis of accounting to the financial statements and the Directors’ statement on the longer-term viability of the Group. We have nothing material to add or draw attention to in relation to:
the Directors’ confirmation on pages 61 and 62 that they have carried out a robust assessment of the principal risks facing the Group, including those that would threaten its business model, future performance, solvency or liquidity;
the disclosures on pages 27 to 28 that describe those risks and explain how they are being managed or mitigated;
the Directors’ statement on page 112 to the financial statements about whether they considered it appropriate to adopt the going concern basis of accounting in preparing them and their identification of any material uncertainties to the Group’s ability to continue to do so over a period of at least 12 months from the date of approval of the financial statements; and
the Director’s explanation on pages 112 to 113 as to how they have assessed the prospects of the Group, over what period they have done so and why they consider that period to be appropriate, and their statement as to whether they have a reasonable expectation that the Group will be able to continue in operation and meet its liabilities as they fall due over the period of their assessment, including any related disclosures drawing attention to any necessary qualifications or assumptions.
We agreed with the Directors’ adoption of the going concern basis of accounting and we did not identify any such material uncertainties. However, because not all future events or conditions can be predicted, this statement is not a guarantee as to the Group’s ability to continue as a going concern.
Our assessment of risks of material misstatement The assessed risks of material misstatement described below are those that had the greatest effect on our audit strategy, the allocation of resources in the audit and directing the efforts of the engagement team. The procedures described in our response to each risk are not exhaustive and we have focused on those procedures that we consider address areas of judgement or subjectivity; see overleaf.

Direct Line Group Annual Report & Accounts 2016116
Independent Auditor’s report to the members of Direct Line Insurance Group plc continued
116 Direct Line Group Annual Report & Accounts 2016
Risk How the scope of our audit responded to the risk
Insurance reserves valuation Refer to page 65 (Audit Committee Report), page 129 (accounting policies) and page 168 (financial disclosures).
The Group’s insurance reserves total £4.7bn (2015: £4.5bn). The determination of the value of the insurance reserves requires significant judgment in the selection of key methodologies and assumptions. Small changes in these methodologies or assumptions can materially impact the valuation of these liabilities. We have identified the following two key areas of focus for our audit:
1) The frequency and severity of excess bodily injury claims; and 2) The propensity, severity and discount rate assumptions for valuing PPOs.
1) We have identified the estimation of the ultimate number of large bodily injury claims as being inherently uncertain. Management also exercises significant judgement in assessing the impact of market factors which could materially impact the valuation of excess bodily injury claims and hence the insurance reserves. On 27 February 2017 the Lord Chancellor announced a reduction in the Ogden discount rate used to value lump sum injury claim settlements from 2.5% to minus 0.75%. This change in discount rate has a significant impact on the valuation of large bodily injury claims, as detailed on page 137.
We have gained a detailed understanding of the end to end reserving process, including the process for adjusting the reserves as a result of the change in the Ogden discount rate and assessed the design and implementation of selected controls. We have tested the operating effectiveness for actuarial data reconciliations and key management review controls over the reserving process. Our work included attendance at the December Loss Ratio Committee and January Reserve Review Committee.
We have tested the completeness and accuracy of the underlying data used in the Company’s actuarial calculations and the actuarial data used by our Deloitte actuarial specialists in performing their audit through performing reconciliations on the data back to the financial ledger.
Having done this, we worked with those specialists to:
challenge the suitability of the methodology and assumptions used in estimating the ultimate number of large bodily injury claims by comparing it to industry benchmarks;
challenge the approach to and the assumptions used in adjusting reserves for the change in the Ogden discount rate;
assess whether the reserving methodology has been applied consistently across periods;
evaluate prior year reserve releases and emerging trends for consistency with management’s calculations.
Key observations:
We have determined that the estimate for the ultimate value of large bodily claims to be within a reasonable range. We observed that the frequency and severity assumptions were set towards the prudent end of a reasonable range.

www.directlinegroup.com 117
Strategic reportG
overnanceFinancial statem
ents
www.directlinegroup.com 117
Risk How the scope of our audit responded to the risk
2) The Group is required to settle a proportion of large bodily injury claims as PPOs rather than lump sum payments. The valuation of PPOs has a material impact on the financial statements, with these liabilities totalling £983m (2015: £991m) on a discounted gross basis as detailed in note 2. PPO liabilities are sensitive to the choice of the propensity, severity and discount rate assumptions used. These assumptions require significant management judgement which increases the susceptibility of the balance to material misstatement.
In addition, the Lord Chancellor’s announcement of a reduction in the Ogden discount rate is likely to impact the propensity of a claim becoming a PPO going forward which increases the level of uncertainty in the setting of this assumption at year end.
We have assessed the design and implementation of controls surrounding the propensity of a claim to become a PPO, the discount rate used and the severity assumption applied. In addition we tested the operating effectiveness of a direct and precise business control, performed weekly, over the completeness of the PPO listing; this is a key data input which has a material impact on the PPO assumptions and hence the valuation.
We have worked with our actuarial specialists to:
challenge management’s assumptions by performing market benchmarking, sensitivity analysis and reviewing historical trends to assess the reasonableness of long term future expectations, including consideration of the change in the Ogden discount rate;
assess whether the assumptions were consistent in the period or, based on emerging market data, that the assumptions needed to be reconsidered;
consider the suitability of the methodology and model used in estimating the propensity, severity and discount rate; and
test the model of a sample of individual PPO’s through re-performance using a Deloitte developed model.
Key observations:
We have determined that key assumptions used in the calculation of the PPO claims reserve are within a reasonable range. We observed that the investment yield component of the discount rate was towards the optimistic end of a reasonable range, but that the propensity and severity assumptions were set towards the prudent end of a reasonable range.

Direct Line Group Annual Report & Accounts 2016118
Independent Auditor’s report to the members of Direct Line Insurance Group plc continued
118 Direct Line Group Annual Report & Accounts 2016
Risk How the scope of our audit responded to the risk
Change and IT Refer to page 65 (Audit Committee Report), page 129 (accounting policies) and page 161 (financial disclosures).
A number of projects are ongoing across DLG aimed at improving the customer experience and enhancing operational efficiency. Certain costs relating to these projects are capitalised on the balance sheet, with the carrying amount of intangible assets at year-end totalling £298m (2015: £314m). We have identified a key risk that costs relating to these projects are incorrectly capitalised or that the impairment charge recognised in the year of £39m (2015: £4m) has not been accurately determined in line with IAS 36. Significant judgements and estimates have been made in calculating the future economic benefit of these assets, including the expected future cash flows and the discount rate used.
In addition, we have identified a risk that the transformation programme, which includes the outsourcing and offshoring of finance and operations, could impact the financial reporting control environment, in particular where processes and controls have changed operation and location. There is a risk that these changes will cause management stretch which could impact on the effectiveness of existing financial reporting internal controls, particularly in relation to adequate segregation of duties.
We have assessed the design and implementation and tested the operating effectiveness of key controls over the capitalisation of costs and the impairment of intangible assets. These included senior management approval for costs to be capitalised against projects having analysed the detailed business plan and assessed feasibility. We have tested the capitalisation criteria of key projects by assessing the inputs and noting whether these are applicable expenses in accordance with IAS 38. We have tested the impairment charge by performing the following:
testing the completeness and accuracy of the data used in the model;
testing the accuracy and mechanics of the model and assessing whether this was compliant with IAS 38;
challenging management’s expected future cash flows by performing benchmarking analysis and engaging our IT consultants to assess the IT architecture; and
engaging our valuation specialists to assess the appropriateness of the discount rate applied to the asset.
We have assessed the design and implementation and tested the operating effectiveness of key business processes that have been subject to change. For example, we have tested the operating effectiveness of controls at a number of outsourced locations, involving site visits by the audit team. When testing the controls that had been impacted by the transformation programme our testing focussed on determining that there remained an appropriate level of review and segregation of duties.
Key observations:
We completed our procedures on the impairment of the intangibles and have not identified any additional impairment. We have observed that the discount rate used was in the middle of a reasonable range and that the expected future cash flows were reasonable. In addition, we completed our controls testing and did not identify any significant control weaknesses.

www.directlinegroup.com 119
Strategic reportG
overnanceFinancial statem
ents
www.directlinegroup.com 119
Risk How the scope of our audit responded to the risk
Investments not held at fair value Refer to page 65 (Audit Committee Report), page 130 (accounting policies) and page 165 (financial disclosures).
We have identified a key risk for investments relating to the valuation of loan portfolios that are not held at fair value totalling £502m (2015: £388m) as detailed in note 40. During 2016 the Group has invested in a new commercial real estate loan portfolio and has increased investment in its private placement bond portfolio, with investment in infrastructure debt remaining stable at £337m (2015: £330m). These debt instruments are carried at amortised cost and represent a higher credit risk relative to the majority of DLG’s investment portfolio. As a result, there is a risk that the Group does not recognise an impairment provision on these loans when required by IAS 39.
We have assessed the design and implementation and tested the operating effectiveness of the key controls that mitigate the risk over the valuation of investments not held at fair value. Our work included attendance at the year-end impairment review meeting in order to assess the operation of a key management review control.
We have consulted with our credit and valuation specialists to challenge the methodology used in the assessment of credit risk within the investment portfolios that are held at amortised cost against best practice. In addition we performed the following:
independently calculated the fair value for a sample of assets to identify any significant decreases in fair value below book cost;
traced a sample of interest payments to bank during the year to test for default or delinquency in interest payments; and
challenged management on loans of interest where indicators could point to issuer financial difficulty, obtaining evidence to assess whether the position taken by management is reasonable.
Key observations:
We completed our procedures and did not note any indicators of material impairment within the loan portfolios.

Direct Line Group Annual Report & Accounts 2016120
Independent Auditor’s report to the members of Direct Line Insurance Group plc continued
120 Direct Line Group Annual Report & Accounts 2016
Last year our report included risks relating to the reinsurance asset valuation and the Group’s IT control environment. From performing our detailed risk assessment for the 2016 audit, we concluded that these no longer represented key risks of material misstatement. The reinsurance bad debt methodology has remained consistent with prior year and is deemed appropriate. Similarly, the IT infrastructure fully transitioned in 2015 to an independently hosted data centre. In addition, this year we have not reported on our presumed risk over revenue recognition. We concluded that this risk does not exhibit the same level of complexity or management judgement as the risks we have disclosed above.
These matters were addressed in the context of our audit of the financial statements as a whole, and in forming our opinion thereon, and we do not provide a separate opinion on these matters.
Our application of materiality We define materiality as the magnitude of misstatement in the financial statements that makes it probable that the economic decisions of a reasonably knowledgeable person would be changed or influenced. We use materiality both in planning the scope of our audit work and in evaluating the results of our work.
We have determined that the critical benchmark for the Group was average profit before tax from Ongoing operations. This measure uses a three-year average of profit before tax, excluding the impact of discontinued activities, transformation costs and the impact of the Ogden discount rate change to exclude the effect of year on year volatility. With the exception of Ogden, this is consistent with the approach we adopted last year. We determined materiality for the Group to be £28m (2015: £28m), which is below 5.6% (2015: 5.9%) of average profit before tax from Ongoing operations.
Our assessment of materiality was made prior to the announcement of the change in the Ogden discount rate, the impact of which has been disclosed in note 3 on page 137. We have considered whether materiality should be revised for both the Group audit and the audit of the insurance subsidiaries and have concluded that the levels of materiality remain appropriate as the scale and nature of the underlying businesses have not changed. We have performed focused procedures on the impact of the Ogden rate change as reported in the significant risk section of this report.
We also considered this measure to be suitable having compared to other benchmarks: our materiality equates to 7.9% (pre-Ogden change: 4.9%, 2015: 5.5%) of statutory profit before tax, 0.9% (pre Ogden change: 0.9%, 2015: 0.9%) of gross earned premium and 1.1% (pre-Ogden change: 1.0%, 2015: 1.1%) of equity.
Group materiality is used for setting audit scope and the assessment of uncorrected misstatements. Materiality is set for each significant component in line with the components proportion of the chosen benchmark. This is capped at the lower of 90% of Group materiality and the component materiality determined for a standalone audit. The main UK insurance trading entity, which makes up 100% of Group gross earned premium and 89% of Group statutory profit
before tax, is scoped to a component materiality of £25.2m (2015: £24.8m).
We determine performance materiality at a level lower than materiality to reduce the probability that, in aggregate, uncorrected and undetected misstatements exceed materiality for the financial statements as a whole. We have set Group performance materiality at £19.6m (2015: £19.6m) and the audit testing for U K Insurance Limited is carried out to a performance materiality of £17.6m (2015: £17.4m).
Following us reassessing the levels at which we would report to the Audit Committee, and as discussed and agreed with the Committee, we report to them all audit differences in excess of £1.4m (2015: £0.6m), as well as differences below that threshold that, in our view, warranted reporting on qualitative grounds. We also report to the Audit Committee on disclosure matters that we identified when assessing the overall presentation of the financial statements.
An overview of the scope of our audit The scope of our Group audit was determined by obtaining an understanding of the Group and its environment, including Group-wide controls, and assessing the risks of material misstatement at the Group level.
Similarly to prior year, our Group audit scope has focused on the UK as this is the Group’s single trading location. In addition, we perform site visits at the Group’s key outsourcers. This resulted in two entities being subject to a full scope audit, a further two were subject to an audit of specified account balances where the extent of our testing was based on our assessment of the risks of material misstatement and of the materiality of the Group’s operations.
These four entities represent the principal business units and account for 99% (2015: 99%) of the Group’s net assets, 100% (2015: 92%) of the Group’s gross earned premium and 98% (2015: 93%) of the Group’s profit before tax. They were also selected to provide an appropriate basis for undertaking audit work to address the risks of material misstatement identified above.
At the parent entity level we also tested the consolidation process and carried out analytical procedures to confirm our conclusion that there were no significant risks of material misstatement of the aggregated financial information of the remaining components not subject to audit or audit of specified account balances. The Group audit team also performs the audit of the in scope UK entities.
The Group audit team was responsible for both the UK location and Group audit.
Opinion on other matters prescribed by the Companies Act 2006 In our opinion, based on the work undertaken in the course of the audit:
the part of the Directors’ remuneration report to be audited has been properly prepared in accordance with the Companies Act 2006;
the information given in the Strategic report and the Directors’ report for the financial year for which the

www.directlinegroup.com 121
Strategic reportG
overnanceFinancial statem
ents
www.directlinegroup.com 121
financial statements are prepared is consistent with the financial statements; and
the Strategic Report and the Directors’ Report have been prepared in accordance with applicable legal requirements.
Matters on which we are required to report by exception Adequacy of explanations received and accounting records Under the Companies Act 2006 we are required to report to you if, in our opinion:
we have not received all the information and explanations we require for our audit; or
adequate accounting records have not been kept by the Parent Company, or returns adequate for our audit have not been received from branches not visited by us; or
the Parent Company financial statements are not in agreement with the accounting records and returns.
We have nothing to report in respect of these matters.
Directors’ remuneration Under the Companies Act 2006 we are also required to report if in our opinion certain disclosures of Directors’ remuneration have not been made or the part of the Directors’ remuneration report to be audited is not in agreement with the accounting records and returns. We have nothing to report arising from these matters.
Corporate governance statement Under the Listing Rules we are also required to review the part of the corporate governance statement relating to the Company’s compliance with certain provisions of the UK Corporate Governance Code. We have nothing to report arising from our review.
Our duty to read other information in the Annual Report Under International Standards on Auditing (UK and Ireland), we are required to report to you if, in our opinion, information in the Annual Report is:
materially inconsistent with the information in the audited financial statements; or
apparently materially incorrect based on, or materially inconsistent with, our knowledge of the Group acquired in the course of performing our audit; or
otherwise misleading.
In particular, we are required to consider whether we have identified any inconsistencies between our knowledge acquired during the audit and the Directors’ statement that they consider the Annual Report is fair, balanced and understandable and whether the Annual Report appropriately discloses those matters that we communicated to the Audit Committee which we consider should have been disclosed. We confirm that we have not identified any such inconsistencies or misleading statements.
Respective responsibilities of Directors and Auditor As explained more fully in the Directors’ responsibilities statement, the Directors are responsible for the preparation of the financial statements and for being satisfied that they give a true and fair view. Our responsibility is to audit and express an opinion on the financial statements in accordance with applicable law and International Standards on Auditing (UK and Ireland). We also comply with International Standard on Quality Control 1 (UK and Ireland). Our audit methodology and tools aim to ensure that our quality control procedures are effective, understood and applied. Our quality controls and systems include our dedicated professional standards review team and independent partner reviews.
This report is made solely to the Company’s members, as a body, in accordance with Chapter 3 of Part 16 of the Companies Act 2006. Our audit work has been undertaken so that we might state to the Company’s members those matters we are required to state to them in an auditor’s report and for no other purpose. To the fullest extent permitted by law, we do not accept or assume responsibility to anyone other than the Company and the Company’s members as a body, for our audit work, for this report, or for the opinions we have formed.
Scope of the audit of the financial statements An audit involves obtaining evidence about the amounts and disclosures in the financial statements sufficient to give reasonable assurance that the financial statements are free from material misstatement, whether caused by fraud or error. This includes an assessment of: whether the accounting policies are appropriate to the Group’s and the Parent Company’s circumstances and have been consistently applied and adequately disclosed; the reasonableness of significant accounting estimates made by the Directors; and the overall presentation of the financial statements. In addition, we read all the financial and non-financial information in the Annual Report to identify material inconsistencies with the audited financial statements and to identify any information that is apparently materially incorrect based on, or materially inconsistent with, the knowledge acquired by us in the course of performing the audit. If we become aware of any apparent material misstatements or inconsistencies we consider the implications for our report.
Colin Rawlings FCA (Senior Statutory Auditor) for and on behalf of Deloitte LLP Chartered Accountants and Statutory Auditor London, United Kingdom 6 March 2017

Direct Line Group Annual Report & Accounts 2016122
Consolidated income statement For the year ended 31 December 2016
Direct Line Group Annual Report & Accounts 2016 122
Notes 2016
£m 2015
£m
Continuing operations Gross earned premium 6 3,202.8 3,110.1Reinsurance premium 6 (202.2) (189.2)Net earned premium 6 3,000.6 2,920.9Investment return 7 171.5 198.1Instalment income 107.1 100.1Other operating income 8 58.2 50.7Total income 3,337.4 3,269.8Insurance claims 9 (2,179.0) (1,829.3)Insurance claims recoverable from reinsurers 9 375.2 162.4Net insurance claims 9 (1,803.8) (1,666.9)Commission expenses 10 (344.0) (319.3)Operating expenses 11 (799.4) (738.5)Total expenses (1,143.4) (1,057.8)Operating profit 390.2 545.1Finance costs 12 (37.2) (37.6)Profit before tax 353.0 507.5Tax charge 13 (74.2) (108.3)Profit from continuing operations, net of tax 278.8 399.2Profit from discontinued operations, net of tax 5A – 181.2Profit for the year attributable to owners of the Company 278.8 580.4 Earnings per share: Continuing operations: Basic (pence) 16 20.4 27.9Diluted (pence) 16 20.2 27.6Continuing and discontinued operations: Basic (pence) 16 20.4 40.6Diluted (pence) 16 20.2 40.1
The attached notes on pages 127 to 178 form an integral part of these consolidated financial statements.

www.directlinegroup.com 123
Strategic reportG
overnanceFinancial statem
ents
Consolidated statement of comprehensive income For the year ended 31 December 2016
www.directlinegroup.com 123
Notes 2016
£m 2015
£m
Profit for the year 278.8 580.4Other comprehensive income / (loss) Items that will not be reclassified subsequently to the income statement:
Actuarial (loss) / gain on defined benefit pension scheme 34 (4.4) 6.7Tax relating to items that will not be reclassified 14 0.7 (1.6)
(3.7) 5.1Items that may be reclassified subsequently to the income statement:
Exchange differences on translation of foreign operations 0.1 14.4 Cash flow hedges 1.4 (1.4)Fair value gain / (loss) on AFS investments 30 119.6 (100.5)Less: realised net gains on AFS investments included in income statement 30 (15.3) (44.3)Tax relating to items that may be reclassified 30 (17.6) 34.6
88.2 (97.2)Other comprehensive income / (loss) for the year net of tax 84.5 (92.1)Total comprehensive income for the year attributable to owners of the Company 363.3 488.3
The attached notes on pages 127 to 178 form an integral part of these consolidated financial statements.
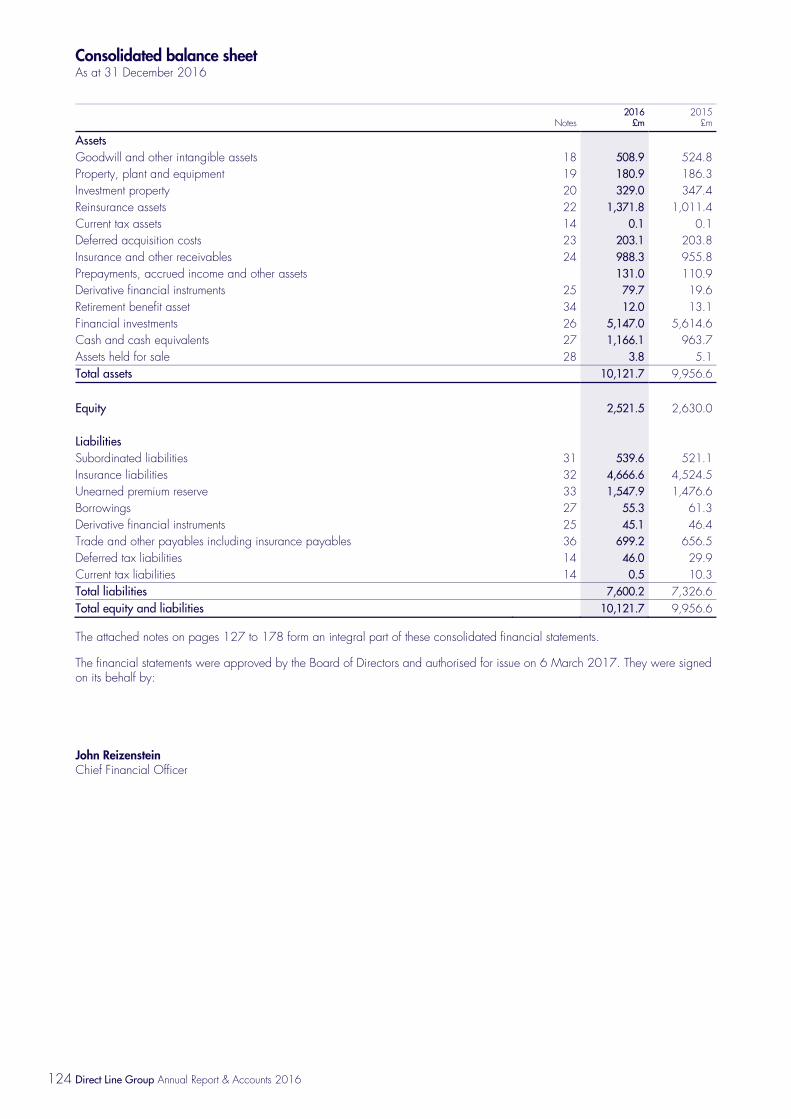
Direct Line Group Annual Report & Accounts 2016124
Consolidated balance sheet As at 31 December 2016
Direct Line Group Annual Report & Accounts 2016 124
Notes 2016
£m 2015
£m
Assets Goodwill and other intangible assets 18 508.9 524.8Property, plant and equipment 19 180.9 186.3Investment property 20 329.0 347.4Reinsurance assets 22 1,371.8 1,011.4Current tax assets 14 0.1 0.1Deferred acquisition costs 23 203.1 203.8Insurance and other receivables 24 988.3 955.8Prepayments, accrued income and other assets 131.0 110.9Derivative financial instruments 25 79.7 19.6Retirement benefit asset 34 12.0 13.1Financial investments 26 5,147.0 5,614.6Cash and cash equivalents 27 1,166.1 963.7Assets held for sale 28 3.8 5.1Total assets 10,121.7 9,956.6 Equity 2,521.5 2,630.0 Liabilities Subordinated liabilities 31 539.6 521.1Insurance liabilities 32 4,666.6 4,524.5Unearned premium reserve 33 1,547.9 1,476.6Borrowings 27 55.3 61.3Derivative financial instruments 25 45.1 46.4Trade and other payables including insurance payables 36 699.2 656.5Deferred tax liabilities 14 46.0 29.9Current tax liabilities 14 0.5 10.3Total liabilities 7,600.2 7,326.6Total equity and liabilities 10,121.7 9,956.6
The attached notes on pages 127 to 178 form an integral part of these consolidated financial statements.
The financial statements were approved by the Board of Directors and authorised for issue on 6 March 2017. They were signed on its behalf by:
John Reizenstein Chief Financial Officer

www.directlinegroup.com 125
Strategic reportG
overnanceFinancial statem
ents
Consolidated statement of changes in equity For the year ended 31 December 2016
www.directlinegroup.com 125
Notes
Share capital
(Note 29)£m
Employee trust
shares£m
Capital reserves
(Note 30) £m
AFS revaluation
reserve (Note 30)
£m
Non-distributable
reserve (Note 30)
£m
Foreign exchange translation
reserve £m
Retained earnings
£m
Totalshareholders’
equity£m
Balance at 1 January 2015 150.0 (13.6) 1,450.0 115.6 124.9 (13.1) 996.7 2,810.5Profit for the year – – – – – – 580.4 580.4Other comprehensive loss – – – (110.2) – 13.0 5.1 (92.1)Dividends 15 – – – – – – (666.0) (666.0)Transfer to non-distributable reserve 30 – – – – 28.0 – (28.0) –Shares acquired by employee trusts – (17.8) – – – – – (17.8)Credit to equity for equity-settled share-based payments 35 – – – – – – 12.1 12.1Shares distributed by employee trusts – 11.0 – – – – (11.0) –Tax on share-based payments – – – – – – 2.9 2.9Balance at 31 December 2015 150.0 (20.4) 1,450.0 5.4 152.9 (0.1) 892.2 2,630.0Profit for the year – – – – – – 278.8 278.8Other comprehensive income – – – 86.7 – 1.5 (3.7) 84.5Dividends 15 – – – – – – (450.6) (450.6) Transfer from non-distributable reserve 30 – – – – (152.9) – 152.9 –Shares acquired by employee trusts – (39.5) – – – – – (39.5)Credit to equity for equity-settled share-based payments 35 – – – – – – 16.8 16.8Shares distributed by employee trusts – 25.6 – – – – (25.6) –Tax on share-based payments – – – – – – 1.5 1.5Balance at 31 December 2016 150.0 (34.3) 1,450.0 92.1 – 1.4 862.3 2,521.5
The attached notes on pages 127 to 178 form an integral part of these consolidated financial statements.

Direct Line Group Annual Report & Accounts 2016126
Consolidated cash flow statement For the year ended 31 December 2016
Direct Line Group Annual Report & Accounts 2016 126
Notes 2016
£m 2015
£m
Net cash generated from operating activities before investment of insurance assets 37 35.0 42.1Cash generated from investment of insurance assets 37 827.4 503.1Net cash generated from operating activities 862.4 545.2Cash flows from investing activities Purchases of property, plant and equipment (49.9) (67.9)Purchases of intangible assets (80.8) (75.5)Proceeds on disposals of assets held for sale 5.1 7.1Net cash flows from disposal of subsidiaries – 327.1Net cash (used by) / generated from investing activities (125.6) 190.8Cash flows from financing activities Dividends paid 15 (450.6) (666.0)Finance costs (38.3) (38.2)Purchase of employee trust shares (39.5) (17.8)Net cash used by financing activities (528.4) (722.0)Net increase in cash and cash equivalents 208.4 14.0Cash and cash equivalents at the beginning of the year 902.4 898.2Effect of foreign exchange rate changes – (9.8)Cash and cash equivalents at the end of the year 27 1,110.8 902.4
The attached notes on pages 127 to 178 form an integral part of these consolidated financial statements.

www.directlinegroup.com 127
Strategic reportG
overnanceFinancial statem
ents
Notes to the consolidated financial statements
www.directlinegroup.com
127
Corporate information Direct Line Insurance Group plc is a public limited company registered in England and Wales (company number 02280426). The address of the registered office is Churchill Court, Westmoreland Road, Bromley, BR11DP, England.
1. Accounting policies Basis of preparation As required by the Companies Act 2006 and Article 4 of the EU IAS Regulation, the consolidated financial statements are prepared in accordance with IFRSs issued by the IASB as adopted by the EU. The Company’s financial statements have been prepared in accordance with and full compliance with IFRSs as issued by the IASB.
The consolidated financial statements are prepared on the historical cost basis except for AFS financial assets, investment property and derivative financial instruments, which are measured at fair value.
The Company’s financial statements and the consolidated financial statements are presented in Sterling, which is the functional currency of the Company.
The International segment was classified as a discontinued operation until disposed of in 2015.
Adoption of new and revised standards The Group has adopted the following new amendments to IFRSs and the IASs that became effective for the Group for the first time during 2016, however these have had no impact on the consolidated financial statements, performance and / or disclosure.
Amendments to IFRS 10 ‘Consolidated Financial Statements’, IFRS 12 ‘Disclosure of Interests in Other Entities’ and IAS 28 ‘Investments in Associates and Joint Ventures’ – Investment Entities: Applying the Consolidation Exception – the amendments address issues that have arisen in applying the investment entities exception under IFRS 10.
IFRS 11 (amended) ‘Joint Arrangements’ Accounting for Acquisitions of Interests in Joint Operations – the amendments require an entity to apply the principles of IFRS 3 ‘Business Combinations’ when it acquires an interest in a joint operation which constitutes a ‘business’ as defined by IFRS 3.
IAS 1 (amended) ‘Presentation of Financial Statements’ Disclosure Initiative – the amendments are intended to assist entities in applying judgement when meeting the presentation and disclosure requirements in IFRS, providing clarity to the materiality requirement in IAS 1, that specific line items in the income statement, other comprehensive income and balance sheet may be disaggregated. The amendments clarify that an entity’s share of the other comprehensive income of associates and joint ventures accounted using the equity method should be presented separately from those arising from the Group. The amendment also addresses that entities have flexibility as to the order in which they present the notes to the financial statements.
IAS 16 (amended) ‘Property, Plant and Equipment’ and IAS 38 (amended) ‘Intangible Assets’ – Classification of Acceptable Methods of Depreciation and Amortisation – the amendments state that revenue-based amortisation models are explicitly
prohibited for property, plant and equipment and may only be used in very limited circumstances to amortise intangible assets.
IAS 27 (amended) ‘Separate Financial Statements’, Equity Method in Separate Financial Statements – the amendments allow an entity to use the equity method for its investments in subsidiaries, joint ventures and associates in its separate financial statements.
Annual Improvements 2012-2014 Cycle – these improvements include:
IFRS 5 (amended) ‘Non-Current Assets Held for Sale and Discontinued Operations’ – assets are generally disposed of either through sale or through a distribution to owners. The amendment clarifies that changing from one disposal method to another is a continuation of the original plan of disposal.
IFRS 7 (amended) ‘Financial Instruments: Disclosures’ – provides additional guidance to clarify whether a servicing contract that includes a fee can constitute continuing involvement in a financial asset for the purpose of the disclosures required in relation to transferred assets.
IAS 19 (amended) ‘Employee Benefits’ – a further amendment has been made to IAS 19 to clarify that the high quality corporate bonds used to estimate the discount rate for post-employment benefits should be issued in the same currency as the benefits to be paid.
1.1 Basis of consolidation The consolidated financial statements incorporate the financial statements of the Company and the entities that are controlled by the Group at 31 December 2016 and 31 December 2015. Control exists when the Group is exposed, or has rights, to variable returns from its involvement with the entity and has the ability to affect those returns through its power over the entity. In assessing if the Group controls another entity, the existence and effect of the potential voting rights that are currently exercisable or convertible are considered.
Where necessary, adjustments have been made to the financial statements of subsidiaries to bring the accounting policies used into line with those used by the Group. The policies set out below have been applied consistently throughout the years ended 31 December 2016 and 31 December 2015 to items considered material to the consolidated financial statements.
A subsidiary acquired is included in the consolidated financial statements from the date it is controlled by the Group until the date the Group ceases to control it. On acquisition of a subsidiary, its identifiable assets, liabilities and contingent liabilities are included in the consolidated financial statements at fair value.
All intercompany transactions, balances, income and expenses between Group entities are eliminated on consolidation.
1.2 Foreign currencies The Group’s consolidated financial statements are presented in Sterling which is the presentational currency of the Group. Group entities record transactions in the currency of the primary economic environment in which they operate (their functional currency), translated at the foreign exchange rate ruling at the date of the transaction.

Direct Line Group Annual Report & Accounts 2016128
Notes to the consolidated financial statements continued
Direct Line Group Annual Report & Accounts 2016 128
1. Accounting policies continued Monetary assets and liabilities denominated in foreign currencies are translated into the relevant functional currency at the foreign exchange rates ruling at the balance sheet date. Foreign exchange differences arising on the settlement of foreign currency transactions and from the translation of monetary assets and liabilities are reported in the income statement.
Non-monetary items denominated in foreign currencies that are stated at fair value are translated into the relevant functional currency at the foreign exchange rates ruling at the dates the values are determined. Translation differences arising on non-monetary items measured at fair value are recognised in the income statement except for differences arising on AFS non-monetary financial assets, which are recognised in other comprehensive income.
Assets and liabilities of foreign operations, including goodwill and fair value adjustments arising on acquisition, are translated into Sterling at the foreign exchange rates ruling at the balance sheet date. Income and expenses of foreign operations are translated into Sterling at average exchange rates unless these do not approximate the foreign exchange rates ruling at the dates of the transactions. Foreign exchange differences arising on the translation of a foreign operation are recognised in the consolidated statement of comprehensive income. The amount accumulated in equity is reclassified from equity to the consolidated income statement on disposal or partial disposal of a foreign operation.
1.3 Contract classification Insurance contracts are those contracts where the Group (the insurer) has accepted significant insurance risk from another party (the policyholder) by agreeing to compensate the policyholder if a specified uncertain future event (the insured event) adversely affects the policyholder.
Once a contract has been classified as an insurance contract, it remains an insurance contract for the remainder of its lifetime, even if the insurance risk reduces significantly during this period, unless all rights and obligations are extinguished.
1.4 Revenue recognition Premiums earned Insurance and reinsurance premiums comprise the total premiums receivable for the whole period of cover provided by contracts incepted during the financial year, adjusted by an unearned premium provision, which represents the proportion of the premiums incepted in the year or prior periods that relate to periods of insurance cover after the balance sheet date. Unearned premiums are calculated over the period of exposure under the policy, on a daily basis, 24ths basis or allowing for the estimated incidence of exposure under policies.
Premiums collected by intermediaries or other parties, but not yet received, are assessed based on estimates from underwriting or past experience, and are included in insurance premiums. Insurance premiums exclude insurance premium tax or equivalent local taxes and are shown gross of any commission payable to intermediaries or other parties.
Cash back payments to policyholders under motor telematics policies represent a reduction in earned premiums.
Investment return Interest income on financial assets is determined using the effective interest rate method. The effective interest rate method is a way of calculating the amortised cost of a financial asset (or group of financial assets) and of allocating the interest income over the expected life of the asset.
Rental income from investment property is recognised in the income statement on a straight-line basis over the period of the contract. Any gains or losses arising from a change in fair value are recognised in the income statement.
Instalment income Instalment income comprises the interest income earned on policyholder receivables, where outstanding premiums are settled by a series of instalment payments. Interest is earned using an effective interest rate method over the term of the policy.
Other operating income Vehicle replacement referral income Vehicle replacement referral income comprises fees in respect of referral income received when a customer or a non-fault policyholder (claimant) of another insurer has been provided with a hire vehicle from a preferred supplier.
Income is recognised immediately when the customer or claimant is provided with the hire vehicle.
Revenue from vehicle recovery and repair services Fees in respect of services for vehicle recovery are recognised as the right to consideration, and accrue through the provision of the service to the customer. The arrangements are generally contractual and the cost of providing the service is incurred as the service is rendered. The price is usually fixed and always determinable.
The Group’s income also comprises vehicle repair services provided to other third-party customers. Income in respect of repairs to vehicles is recognised upon completion of the service. The price is determined using market rates for the services and materials used after discounts have been deducted where applicable.
Other income Commission fee income in respect of services is recognised when a policy has been placed and incepted. Income is stated excluding applicable sales taxes.
Legal services revenue represents the amount charged to clients for professional services provided during the year including recovery of expenses but excluding value added tax. Revenue is only recognised once services have been provided and certainty exists as to the outcome of the respective cases.
1.5 Insurance claims Insurance claims are recognised in the accounting period in which the loss occurs. Provision is made for the full cost of settling outstanding claims at the balance sheet date, including claims incurred but not yet reported at that date, net of salvage and subrogation recoveries. Outstanding claims provisions are not discounted for the time value of money except for claims to be settled by PPOs established under the Courts Act 2003. A court can award damages for future pecuniary loss in respect of personal injury or for other damages in respect of personal injury and may order that the damages are wholly or partly to take the form of PPOs. These are covered in more

www.directlinegroup.com 129
Strategic reportG
overnanceFinancial statem
ents
www.directlinegroup.com 129
detail in note 2.1. Costs for both direct and indirect claims handling expenses are also included.
Provisions are determined by management based on experience of claims settled and on statistical models which require certain assumptions to be made regarding the incidence, timing and amount of claims and any specific factors such as adverse weather conditions. When calculating the total provision required, the historical development of claims is analysed using statistical methodology to extrapolate, within acceptable probability parameters, the value of outstanding claims (gross and net) at the balance sheet date. Also included in the estimation of outstanding claims are factors such as the potential for judicial or legislative inflation.
Provisions for more recent claims make use of techniques that incorporate expected loss ratios and average claims cost (adjusted for inflation) and frequency methods. As claims mature, the provisions are increasingly driven by methods based on actual claims experience. The approach adopted takes into account the nature, type and significance of the business and the type of data available, with large claims generally being assessed separately. The data used for statistical modelling purposes is generated internally and reconciled to the accounting data.
The calculation is particularly sensitive to the estimation of the ultimate cost of claims for the particular classes of business at gross and net levels and the estimation of future claims handling costs. Actual claims experience may differ from the historical pattern on which the actuarial best estimate is based and the cost of settling individual claims may exceed that assumed. As a result, the Group sets provisions at a margin above the actuarial best estimate. This amount is recorded within claims provisions.
A liability adequacy provision is made for unexpired risks arising where the expected value of claims and expenses attributable to the unexpired periods of policies in force at the balance sheet date exceeds the unearned premium reserve in relation to such policies after the deduction of any acquisition costs deferred and other prepaid amounts (for example, reinsurance). The expected value is determined by reference to recent experience and allowing for changes to the premium rates. The provision for unexpired risks is calculated separately by reference to classes of business that are managed together after taking account of relevant investment returns.
1.6 Reinsurance The Group has reinsurance treaties and other reinsurance contracts that transfer significant insurance risk.
The Group cedes insurance risk by reinsurance in the normal course of business, with the arrangement and retention limits varying by product line. Outward reinsurance premiums are generally accounted for in the same accounting period as the premiums for the related direct business being reinsured. Outward reinsurance recoveries are accounted for in the same accounting period as the direct claims to which they relate.
Reinsurance assets include balances due from reinsurance companies for ceded insurance liabilities. Amounts recoverable from reinsurers are estimated in a consistent manner with the outstanding claims provisions or settled claims associated with the reinsured policies and in accordance with the relevant reinsurance contract. Recoveries in respect of PPOs are discounted for the time value of money.
A reinsurance bad debt provision is assessed in respect of reinsurance debtors, to allow for the risk that the reinsurance asset may not be collected or where the reinsurer’s credit rating has been downgraded significantly and this is taken as an indication of a reinsurer’s difficulty in meeting its obligations under the reinsurance contracts. This also includes an assessment in respect of the ceded part of claims provisions to reflect the counterparty default risk exposure to long-term reinsurance assets particularly in relation to periodical payments. Increases in this provision affect the Group by reducing the carrying value of the asset and the impairment loss is recognised in the income statement.
1.7 Deferred acquisition costs Acquisition costs relating to new and renewing insurance policies are matched with the earning of the premiums to which they relate. A proportion of acquisition costs incurred during the year is therefore deferred to the subsequent accounting period to match the extent to which premiums written during the year are unearned at the balance sheet date.
The principal acquisition costs deferred are direct advertising expenditure, directly attributable administration costs, commission paid and costs associated with telesales and underwriting staff.
1.8 Goodwill and other intangible assets Acquired goodwill, being the excess of the cost of an acquisition over the Group’s interest in the net fair value of the identifiable assets, liabilities and contingent liabilities of the subsidiary, associate or joint venture acquired, is initially recognised at cost and subsequently at cost less any accumulated impairment losses. Goodwill arising on the acquisition of subsidiaries, associates and joint ventures is included in the balance sheet category ‘goodwill and other intangible assets’. The gain or loss on the disposal of a subsidiary, associate or joint venture includes the carrying value of any related goodwill.
Intangible assets that are acquired by the Group are stated at cost less accumulated amortisation and impairment losses. Amortisation is charged to the income statement over the assets’ economic lives using methods that best reflect the pattern of economic benefits and is included in operating expenses. The estimated useful economic lives are as follows:
Software development costs Up to 10 years
Expenditure on internally generated goodwill and brands is written off as incurred. Direct costs relating to the development of internal-use computer software and associated business processes are capitalised once technical feasibility and economic viability have been established. These costs include payroll costs, the costs of materials and services and directly attributable overheads. Capitalisation of costs ceases when the software is capable of operating as intended. During and after development, accumulated costs are reviewed for impairment against the projected benefits that the software is expected to generate. Costs incurred prior to the establishment of technical feasibility and economic viability are expensed as incurred, as are all training costs and general overheads.
1.9 Property, plant and equipment Items of property, plant and equipment (except investment property – note 1.11) are stated at cost less accumulated depreciation and impairment losses. Where an item of

Direct Line Group Annual Report & Accounts 2016130
Notes to the consolidated financial statements continued
Direct Line Group Annual Report & Accounts 2016 130
1. Accounting policies continued property, plant and equipment comprises major components having different useful lives, they are accounted for separately.
Depreciation is charged to the income statement on a straight-line basis so as to write off the depreciable amount of property, plant and equipment over their estimated useful lives. The depreciable amount is the cost of an asset less its residual value. Land is not depreciated. Estimated useful lives are as follows:
Freehold and leasehold buildings
50 years or the period of the lease if shorter
Vehicles 3 years
Computer equipment Up to 5 years
Other equipment, including property adaptation costs
2 to 15 years
The gain or loss arising from the derecognition of an item of property, plant and equipment is determined as the difference between the disposal proceeds, if any, and the carrying amount of the item.
1.10 Impairment of intangible assets, goodwill and property, plant and equipment At each reporting date, the Group assesses whether there is any indication that its intangible assets, goodwill or property, plant and equipment are impaired. If any such indication exists, the Group estimates the recoverable amount of the asset and the impairment loss, if any. Goodwill is tested for impairment annually or more frequently if events or changes in circumstances indicate that it might be impaired. If an asset does not generate cash flows that are independent of those of other assets or groups of assets, the recoverable amount is determined for the cash-generating unit (“CGU”) to which the asset belongs. The recoverable amount of an asset is the higher of its fair value less costs to sell and its value in use. Value in use is the present value of future cash flows from the asset or CGU, discounted at a rate that reflects market interest rates, adjusted for risks specific to the asset or CGU that have not been reflected in the estimation of future cash flows.
If the recoverable amount of an intangible or a tangible asset is less than its carrying value, an impairment loss is recognised immediately in the income statement and the carrying value of the asset is reduced by the amount of the impairment loss.
A reversal of an impairment loss on intangible assets or property, plant and equipment is recognised as it arises provided the increased carrying value does not exceed the carrying amount that would have been determined had no impairment loss been recognised. Impairment losses on goodwill are not reversed.
1.11 Investment property Investment property comprises freehold and leasehold properties that are held to earn rentals or for capital appreciation or both. Investment property is not depreciated, but is stated at fair value based on valuations by independent registered valuers. Fair value is based on current prices for similar properties adjusted for the specific characteristics of each property. Any gain or loss arising from a change in fair value is recognised in the income statement.
Investment property is derecognised when it has been either disposed of or permanently withdrawn from use and no future economic benefit is expected from disposal. Any gains or losses on the retirement or disposal of investment property are recognised in the income statement in the year of retirement or disposal.
1.12 Financial assets Financial assets are classified as AFS, held-to-maturity (“HTM”), designated at fair value through profit or loss, or loans and receivables.
Purchases or sales of financial assets that require delivery of assets within a time frame established by regulation or convention in the market place are recognised on the date that the Group commits to purchase or sell the asset.
AFS Financial assets can be designated as AFS on initial recognition. AFS financial assets are initially recognised at fair value plus directly related transaction costs. They are subsequently measured at fair value. Impairment losses and exchange differences resulting from translating the amortised cost of foreign currency monetary AFS financial assets are recognised in the income statement, together with interest calculated using the effective interest rate method. Other changes in the fair value of AFS financial assets are reported in a separate component of shareholders’ equity until disposal, when the cumulative gain or loss is recognised in the income statement.
A financial asset is regarded as quoted in an active market if quoted prices are readily and regularly available from an exchange, dealer, broker, industry group, pricing service or regulatory agency, and those prices represent actual and regularly occurring market transactions on an arm’s length basis. The appropriate quoted market price for an asset held is usually the current bid price. When current bid prices are unavailable, the price of the most recent transaction provides evidence of the current fair value as long as there has not been a significant change in economic circumstances since the time of the transaction. If conditions have changed since the time of the transaction (for example, a change in the risk-free interest rate following the most recent price quote for a corporate bond), the fair value reflects the change in conditions by reference to current prices or rates for similar financial instruments, as appropriate. The valuation methodology described above uses observable market data.
If the market for a financial asset is not active, the Group establishes the fair value by using a valuation technique. Valuation techniques include using recent arm’s length market transactions between knowledgeable and willing parties (if available), reference to the current fair value of another instrument that is substantially the same, discounted cash flow analysis and option pricing models. If there is a valuation technique commonly used by market participants to price the instrument and that technique has been demonstrated to provide reliable estimates of prices obtained in actual market transactions, the Group uses that technique.
HTM Non-derivative financial assets not designated as AFS or loans and receivables with fixed or determinable payments and fixed maturity where the intention and ability to hold them to maturity exists are classified as HTM.

www.directlinegroup.com 131
Strategic reportG
overnanceFinancial statem
ents
www.directlinegroup.com 131
Subsequent to initial recognition, HTM financial assets are measured at amortised cost using the effective interest rate method less any impairment losses.
Loans and receivables Non-derivative financial assets with fixed or determinable repayments that are not quoted in an active market are classified as loans and receivables, except those that are classified as AFS or HTM. Loans and receivables are initially recognised at fair value plus directly related transaction costs and are subsequently measured at amortised cost using the effective interest rate method less any impairment losses.
Impairment of financial assets Insurance receivables At each balance sheet date the Group assesses whether there is any objective evidence that a financial asset or group of financial assets classified as AFS, HTM or loans and receivables is impaired. A financial asset or portfolio of financial assets is impaired and an impairment loss incurred if there is objective evidence that an event or events since initial recognition of the asset have adversely affected the amount or timing of future cash flows from the asset.
AFS When a decline in the fair value of a financial asset classified as AFS has been recognised directly in equity and there is objective evidence that the asset is impaired, the cumulative loss is removed from equity and recognised in the income statement. The loss is measured as the difference between the amortised cost of the financial asset and its current fair value. Impairment losses on AFS equity instruments are not reversed through profit or loss, but those on AFS debt instruments are reversed, if there is an increase in fair value that is objectively related to a subsequent event.
HTM and loans and receivables If there is objective evidence that an impairment loss on a financial asset or group of financial assets classified as HTM or loans and receivables has been incurred, the Group measures the amount of the loss as the difference between the carrying amount of the asset or group of assets and the present value of estimated future cash flows from the asset or group of assets, discounted at the effective interest rate of the instrument at initial recognition.
Impairment losses are assessed individually where significant or collectively for assets that are not individually significant.
Impairment losses are recognised in the income statement and the carrying amount of the financial asset or group of financial assets is reduced by establishing an allowance for the impairment losses. If in a subsequent period the amount of the impairment loss reduces and the reduction can be ascribed to an event after the impairment was recognised, the previously recognised loss is reversed by adjusting the allowance.
Insurance receivables Insurance receivables comprise outstanding insurance premiums where the policyholders have elected to pay in instalments, or amounts due from third parties where they have collected or are due to collect the money from the policyholder.
Receivables also include amounts due in respect of the provision of legal services.
For amounts due from policyholders, the bad debt provision is calculated based upon prior loss experience. For all balances outstanding in excess of three months, a bad debt provision is made. Where a policy is subsequently cancelled, the outstanding debt that is overdue is charged to the income statement and the bad debt provision is released back to the income statement.
Derivatives and hedging Derivative financial instruments are recognised initially, and subsequently measured, at fair value. Derivative fair values are determined from quoted prices in active markets where available. Where there is no active market for an instrument, fair value is derived from prices for the derivative’s components using appropriate pricing or valuation models.
Gains and losses arising from changes in the fair value of a derivative are recognised as they arise in the income statement unless the derivative is the hedging instrument in a qualifying hedge. The Group enters into fair value hedge relationships and a small amount of cash flow hedges.
Hedge relationships are formally documented at inception. The documentation identifies the hedged item and the hedging instrument and details the risk that is being hedged and the way in which effectiveness will be assessed at inception and during the period of the hedge. If the hedge is not highly effective in offsetting changes in cash flows and fair values attributable to the hedged risk, consistent with the documented risk management strategy, or if the hedging instrument expires or is sold, terminated or exercised, hedge accounting is discontinued.
In a cash flow hedge, the effective portion of the gain or loss on the hedging instrument is recognised directly in equity. Any ineffective portion is recognised in the income statement.
In a fair value hedge, the gain or loss on the hedging instrument is recognised in the income statement. The gain or loss on the hedged item attributable to the hedged risk is recognised in the income statement and, where the hedged item is measured at amortised cost, adjusts the carrying amount of the hedged item.
Derecognition of financial assets A financial asset is derecognised when the rights to receive the cash flows from that asset have expired or when the Group has transferred its rights to receive cash flows from the asset and has transferred substantially all the risk and rewards of ownership of the asset.
1.13 Cash and cash equivalents and borrowings Cash and cash equivalents comprise cash in hand and demand deposits with banks together with short-term highly liquid investments that are readily convertible to known amounts of cash and subject to insignificant risk of change in value.
Borrowings, comprising bank overdrafts, are measured at amortised cost using the effective interest rate method.
1.14 Financial liabilities Financial liabilities are initially recognised at fair value net of transaction costs incurred. Other than derivatives which are recognised and measured at fair value, all other financial liabilities are subsequently measured at amortised cost using the effective interest rate method.

Direct Line Group Annual Report & Accounts 2016132
Notes to the consolidated financial statements continued
Direct Line Group Annual Report & Accounts 2016 132
1. Accounting policies continued A financial liability is derecognised when the obligation under the liability is discharged, cancelled or expires.
1.15 Subordinated liabilities Subordinated liabilities comprise subordinated guaranteed dated notes which are initially measured at the consideration received less related transaction costs. Subsequently, subordinated liabilities are measured at amortised cost using the effective interest rate method.
1.16 Provisions The Group recognises a provision for a present legal or constructive obligation from a past event when it is more likely than not that it will be required to transfer economic benefits to settle the obligation and the amount can be reliably estimated.
The Group makes provision for all insurance industry levies, such as the Financial Services Compensation Scheme and Motor Insurance Bureau.
When the Group has an onerous contract, it recognises the present obligation under the contract as a provision. A contract is onerous when the unavoidable costs of meeting the contractual obligations exceed the expected future economic benefit. In respect of leasehold properties, a provision is recognised when the Group has a detailed formal plan to vacate the leasehold property, or significantly reduce its level of occupancy, the plan has been communicated to those affected and the future property costs under the lease exceed future economic benefits.
Restructuring provisions are made, including redundancy costs, when the Group has a constructive obligation to restructure. An obligation exists when the Group has a detailed formal plan and has communicated the plan to those affected.
1.17 Leases Payments made under operating leases are charged to the income statement on a straight-line basis over the term of the lease.
1.18 Pensions and other post-retirement benefits The Group provides post-retirement benefits in the form of pensions and healthcare plans to eligible employees.
Contributions to the Group’s defined contribution pension scheme are recognised in the income statement when payable.
The Group’s defined benefit pension scheme, as described in note 34, was closed in 2003. Scheme liabilities are measured on an actuarial basis, using the projected unit credit method, and discounted at a rate that reflects the current rate of return on a high-quality corporate bond of equivalent term and currency to the scheme liabilities.
Scheme assets are measured at their fair value. Any surplus or deficit of scheme assets over liabilities is recognised in the balance sheet as an asset (surplus) or liability (deficit). The current service cost and any past service costs, together with the net interest on net pension liability or asset, is charged or credited to operating expenses. Actuarial gains and losses are recognised in full in the period in which they occur outside the income statement and presented in other comprehensive income under ‘Items that will not be reclassified subsequently to the income statement’.
1.19 Taxation The tax charge or credit represents the sum of the tax currently payable or receivable and deferred tax.
The current tax charge is based on the taxable profits for the year as determined in accordance with the relevant tax legislation, after any adjustments in respect of prior years. Taxable profit differs from net profit as reported in the income statement because it excludes items of income or expense that are taxable or deductible in other years and it further excludes items that are never taxable or deductible.
Provision for taxation is calculated using tax rates that have been enacted or substantively enacted by the balance sheet date, and is allocated over profits before taxation and amounts charged or credited to components of other comprehensive income and equity, as appropriate.
Deferred taxation is accounted for in full using the balance sheet liability method on all temporary differences between the carrying amount of an asset or liability for accounting purposes and its carrying amount for tax purposes.
Deferred tax liabilities are generally recognised for all taxable temporary timing differences and deferred tax assets are recognised to the extent that it is probable that taxable profits will be available against which deductible temporary differences can be utilised.
Deferred tax assets are reviewed at each balance sheet date and reduced to the extent that it is probable that they will not be recovered.
Deferred tax assets and liabilities are calculated at the tax rates expected to apply when the assets are realised or liabilities are settled based on laws and rates that have been enacted or substantively enacted at the balance sheet date. Deferred tax is charged or credited in the income statement, except when it relates to items charged or credited to other comprehensive income or equity, in which case the deferred tax is also dealt with in other comprehensive income or directly in equity.
Deferred tax assets and liabilities are offset when there is a legally enforceable right to set off current tax assets against current tax liabilities and when they relate to income taxes levied by the same taxation authority and the Group intends to settle its current assets and liabilities on a net basis.
1.20 Share-based payments The Group operates a number of share-based compensation plans under which it awards Ordinary Shares and share options to its employees. Such awards are generally subject to vesting conditions that vary the amount of cash or shares to which an employee is entitled.
Vesting conditions include service conditions (requiring the employee to complete a specified period of service) and performance conditions (requiring the Group to meet specified performance targets).
The fair value of options granted is estimated using valuation techniques which incorporate exercise price, term, risk-free interest rates, the current share price and its expected volatility.

www.directlinegroup.com 133
Strategic reportG
overnanceFinancial statem
ents
www.directlinegroup.com 133
The cost of employee services received in exchange for an award of shares or share options granted is measured by reference to the fair value of the shares or share options on the date the award is granted and takes into account non-vesting conditions and market performance conditions (conditions related to the market price of the Company’s Ordinary Shares).
The cost is expensed on a straight-line basis over the vesting period (the period during which all the specified vesting conditions must be satisfied) with a corresponding increase in equity in an equity-settled award, or a corresponding liability in a cash-settled award. The cost is adjusted for vesting conditions (other than market performance conditions) so as to reflect the number of shares or share options that actually vest.
The cancellation of an award through failure to meet non-vesting conditions triggers an immediate expense for any unrecognised element of the cost of an award.
1.21 Capital instruments The Group classifies a financial instrument that it issues as a financial liability or an equity instrument in accordance with the substance of the contractual arrangement. An instrument is classified as a liability if it is a contractual obligation to deliver cash or another financial asset, or to exchange financial assets or financial liabilities on potentially unfavourable terms, or as equity if it evidences a residual interest in the assets of the Group after the deduction of liabilities.
The consideration for any Ordinary Share of the Company purchased by the Group for the benefit of the employee trusts is deducted from equity.
1.22 Dividends Interim dividends on Ordinary Shares are recognised in equity in the period in which they are paid. Final dividends on Ordinary Shares are recognised when they have been approved at the AGM.
1.23 Accounting developments New IFRSs and amendments that are issued, but not yet effective for the 31 December 2016 reporting periods and have not been early adopted by the Group are disclosed below. The Group intends to adopt these standards, if applicable, when they become effective, except for IFRS 9 as explained below.
In July 2014, the IASB issued the final version of IFRS 9 ‘Financial Instruments’ that replaces IAS 39 ‘Financial Instruments: Recognition and Measurement’ and all previous versions of IFRS 9 which was endorsed by the EU in 2016. IFRS 9 addresses the classification, measurement and derecognition of financial assets and financial liabilities, introduces new rules for hedge accounting and a new impairment model for financial assets and is effective for annual periods beginning on or after 1 January 2018.
In 2016 the Group conducted a high-level assessment of the three aspects of IFRS 9 and based on current available information expects no significant impact on its balance sheet and equity, except for the impact of applying the expected loss model for the first time and this impact is currently immaterial. The Group plans to defer the application of IFRS 9 until the effective date of the new insurance contracts standard IFRS 17 of 1 January 2021, applying the temporary exemption from applying IFRS 9 as introduced by the amendments to IFRS 4 ‘Insurance Contracts’, detailed below.
In September 2016, the IASB issued amendments to IFRS 4 to address issues arising from the different effective dates of IFRS 9 and the upcoming new insurance contracts standard (IFRS 17). The amendment to IFRS 4 is expected to be endorsed by the EU before the effective date of IFRS 9.
The amendments introduce two alternative options, the overlay approach and the temporary exemption from IFRS 9. The overlay approach allows an entity applying IFRS 9 to reclassify between the income statement and other comprehensive income an amount that results in the income statement at the end of the reporting period for the designated financial assets being the same as if an entity had applied IAS 39 ‘Financial Instruments – Recognition and Measurement’ to these designated financial assets. The temporary exemption from IFRS 9 allows entities to defer the implementation date of IFRS 9 for annual periods beginning before 1 January 2021, if it has not applied any version of IFRS 9 previously and its activities are predominantly connected with insurance on its annual reporting date that immediately precedes 1 April 2016.
During 2016 the Group performed an assessment of the temporary exemption from IFRS 9 criteria and concluded that the carrying amount of its liabilities connected with insurance relative to the carrying amount of all its liabilities as at 31 December 2015 is greater than 90% and therefore satisfies the exemption criteria.
In May 2014 the IASB issued IFRS 15 ‘Revenue from Contracts with Customers’ to establish a single comprehensive model to use in accounting for revenue recognition and measurement. The standard provides guidance on when and how combined contracts should be unbundled and when a contract price includes a variable consideration element. IFRS 15 was endorsed by the EU in 2016 and either a full retrospective application or a modified retrospective application is required for annual periods beginning on or after 1 January 2018. The Group expects to apply IFRS 15 fully retrospectively. Insurance contracts are out of the scope of IFRS 15 and therefore the Group does not expect the impact on other operating income to be material.
In January 2016 the IASB issued IFRS 16 ‘Leases’ to replace the existing standard IAS 17, which subject to endorsement from the EU will be effective from 1 January 2019. IFRS 16 sets out the principles for recognition, measurement, presentation and disclosure of leases and requires lessees to account for all leases under a single on-balance sheet model similar to the accounting for finance leases under IAS 17. There are two exemptions for leases of a low value and for leases of short-term nature of 12 months or less. At the start of a lease, a lessee will recognise a liability for the lease payments and an asset representing the right to use the asset during the lease term. Lessees will be required to separately recognise the interest expense on the lease liability and the depreciation expense on the right-of-use asset. Lessor accounting under IFRS 16 is substantially unchanged from the current approach under IAS 17.
In 2017, the Group will assess the potential effect of IFRS 16 on its consolidated financial statements, the undiscounted value of the Group’s lease obligations are disclosed in note 39.

Direct Line Group Annual Report & Accounts 2016134
Notes to the consolidated financial statements continued
Direct Line Group Annual Report & Accounts 2016 134
1. Accounting policies continued The following amendments to IFRSs and IASs have been issued during 2016 that are expected to be endorsed by the EU during 2017. The Group does not expect the amendments to have a material impact on the financial statements of the Group in future periods.
The IASB amended IAS 12 ‘Income Taxes’ – Recognition of Deferred Tax Assets for Unrealised Losses to clarify the accounting for deferred tax assets where an asset is measured at fair value and that fair value is below the asset’s tax base for accounting; the amendment is effective from 1 January 2017.
Amendments to IAS 7 ‘Statement of Cash Flows’ was issued as part of the IASB’s Disclosure Initiative to require entities to explain changes in their liabilities arising from financing activities; the amendment is effective from 1 January 2017.
The IASB amended IFRS 2 ‘Share-based Payments’ – Classification and Measurement of Share-based Payment Transactions, to address three main areas: the effects of vesting conditions on the measurement of a cash-settled share-based payment transaction; the classification of a share-based payment transaction with net settlement features for withholding tax obligations; and accounting where a modification to the terms and conditions of a share-based payment transaction changes its classification from cash-settled to equity-settled; the amendments are effective from 1 January 2018.
2. Critical accounting estimates and judgements The reported results of the Group are sensitive to the accounting policies, assumptions and estimates that underlie the preparation of its financial information. The Group’s principal accounting policies are set out on pages 127 to 134. Company law and IFRSs require the Directors, in preparing the Group’s financial statements, to select suitable accounting policies, apply them consistently and make judgements and estimates that are reasonable and prudent.
In the absence of an applicable standard or interpretation, IAS 8, ‘Accounting policies, Changes in Accounting Estimates and Errors’, requires management to develop and apply an accounting policy that results in relevant and reliable information in the light of the requirements and guidance in IFRS dealing with similar and related issues and the IASB’s Framework for the Preparation and Presentation of Financial Statements. The judgements and assumptions involved in the Group’s accounting policies that are considered by the Board to be the most important to the portrayal of its financial condition are discussed below. The use of estimates, assumptions or models that differ from those adopted by the Group would affect its reported results.
2.1 General insurance: outstanding claims provisions and related reinsurance recoveries The Group makes provision for the full cost of outstanding claims from its general insurance business at the balance sheet date, including claims estimated to have been incurred but not yet reported at that date and claims handling. Outstanding claims provisions net of related reinsurance recoveries at 31 December 2016 amounted to £3,388.3 million (2015: £3,602.6 million).
Claims reserves are assessed separately for large and attritional claims, typically using standard actuarial methods of projection. Key sources of estimation uncertainty include those arising from the selection of specific methods as well as assumptions for claims frequency and severity through the review of historical claims and emerging trends.
The corresponding reinsurance recoveries and impairment provision are calculated on an equivalent basis, with similar estimation uncertainty, as discussed in note 1.6. The reinsurance bad debt provision is mainly for expected recoveries against future PPO payments.
The most common method of settling bodily injury claims is by a lump sum paid to the claimant and, in the cases where this includes an element of indemnity for recurring costs such as loss of earnings or ongoing medical care, settlement normally occurs using a standardised Ogden annuity factor at a discount rate of 2.5% in 2016 (2015: 2.5%). This is normally referred to as the Ogden discount rate. Other estimates are also required for case management expenses, loss of pension, court protection fees, alterations to accommodation and transportation fees.
On 27 February 2017, the Ministry of Justice announced a new Ogden discount rate of minus 0.75% to become effective from 20 March 2017 and a review of the framework under which the rate is set with consultation to start before Easter 2017. The Group expects to fully participate in this consultation.
The Group will continue to exercise judgement around the Ogden rate used in its reserves allowing for the possibility for it to change in the future. The Lord Chancellor’s statement bases the choice of the rate on a 3-year average of yields on index-linked government securities which will be sensitive to future movements in these instruments. It is not yet clear how often the Lord Chancellor plans to review the rate and the coming consultation is proposed to look at the wider framework for setting the rate and compensation. The Group considers the risks to the rate in future as being significant but broadly balanced and therefore provisions at the current proposed rate of minus 0.75% with no additional allowance for further movements. Details of the sensitivity analysis to the assumed Ogden discount rate are shown in note 3.3.1.
The Group settles some large bodily injury claims as PPOs rather than lump sum payments.

www.directlinegroup.com 135
Strategic reportG
overnanceFinancial statem
ents
www.directlinegroup.com 135
The table below analyses the outstanding PPO claims provisions on a discounted and an undiscounted basis at 31 December 2016 and 31 December 2015. These represent the total cost of PPOs rather than any costs in excess of purely Ogden-based settlement.
At 31 December
Discounted 2016
£m
Undiscounted 2016
£m
Discounted 2015
£m
Undiscounted 2015
£m
Gross claims Approved PPO claims provisions 489.0 1,388.0 452.3 1,315.7Anticipated PPOs 494.0 1,509.9 538.3 1,660.8Total 983.0 2,897.9 990.6 2,976.5Reinsurance Approved PPO claims provisions (248.6) (754.4) (231.1) (721.5)Anticipated PPOs (263.1) (875.4) (227.8) (818.4)Total (511.7) (1,629.8) (458.9) (1,539.9)Net of reinsurance Approved PPO claims provisions 240.4 633.6 221.2 594.2Anticipated PPOs 230.9 634.5 310.5 842.4Total 471.3 1,268.1 531.7 1,436.6
The provisions for PPOs have been categorised as either claims which have already been determined by the courts as PPOs (approved PPO claims provisions) or those expected to settle as PPOs in the future (anticipated PPOs). The Group is subject to estimation uncertainty on the propensity of large bodily claims to move from Ogden settled values to PPOs. The recent change in the Ogden discount rate is expected to reduce PPO propensity and these effects are recognised in the Group’s separate Ogden provisions. The estimates in the table above are based on historically observed propensity and therefore do not allow for any future changes in PPO propensity. Anticipated PPOs consist of both existing large loss case reserves including allowances for development and claims yet to be reported to the Group. Reinsurance is applied at claim level and the net cash flows are discounted for the time value of money. The discount rate is consistent with the long duration of the claims payments and the assumed future indexation of the claims payments.
In the majority of cases, the inflation agreed in the settlement is the Annual Survey of Hours and Earnings SOC 6115 inflation published by the Office for National Statistics, for which the long-term rate is assumed to be 4.0% (2015: 4.0%). The rate of interest used for the calculation of present values is 4.0% (2015: 4.0%), which results in a real discount rate of 0.0% (2015: 0.0%). Prior to 20 March 2017 lump sum payments were calculated using a real discount rate of 2.5% (2015: 2.5%) meaning that the PPOs reserved cost was greater than that of lump sum settlements. This will reverse when the new discount rate of minus 0.75% becomes effective.
Details of sensitivity analysis to the discount rate applied to PPO claims are shown in note 3.3.1.
2.2 Impairment provisions – financial assets The Group determines that financial assets are impaired when there is objective evidence that an event or events since initial recognition of the assets have adversely affected the amount or timing of future cash flows from the asset. The determination of which events could have adversely affected the amount or timing of future cash flows from the asset requires judgement. In making this judgement, the Group evaluates, among other factors, the normal price volatility of the financial asset, the financial health of the investee, industry and sector performance, changes in technology and operational and financing cash flow or whether there has been a significant or prolonged decline in the fair value of the asset below its cost. Impairment may be appropriate when there is evidence of deterioration in these factors.
On a quarterly basis, the Group reviews whether there is any objective evidence that a financial asset is impaired based on the following criteria:
actual, or imminent, default on coupon interest or nominal;
adverse movements in the credit rating for the investee / borrower; or
price performance of a particular AFS debt security, or group of AFS debt securities, demonstrating an adverse trend compared to the market as a whole.
There was no impairment of the Group’s financial assets in the year ended 31 December 2016 (2015: £nil).
Had all the declines in AFS asset values met the criteria above at 31 December 2016, the Group would suffer a loss of £12.6 million (2015: £48.7 million), being the transfer of the total AFS reserve for unrealised losses to the income statement. These movements represent mark-to-market movements and where there is no objective evidence of any loss events that could affect future cash flows, no impairments are recorded for these movements.

Direct Line Group Annual Report & Accounts 2016136
Notes to the consolidated financial statements continued
Direct Line Group Annual Report & Accounts 2016 136
2. Critical accounting estimates and judgements continued 2.3 Fair value The Group has made the judgement that level 1 of the Group’s fair value hierarchy set out in note 40 will include only sovereign debt securities issued by members of the G1O group of countries within the Group’s AFS debt securities portfolio, with all other financial assets and liabilities carried at fair value included in level 2 as they are not considered to be quoted in a deeply liquid market.
The Group has also made the judgement that investment properties fall within level 3 of the Group’s fair value hierarchy (note 40) as the valuation model is driven predominantly by unobservable inputs, as although in part the valuations are compared to recent market transactions, they are adjusted for specific characteristics of each property including the size, location and condition by reference to the benchmark property transactions.
2.4 Goodwill and other intangible assets Goodwill impairment testing inherently involves estimation uncertainty in a number of areas including: the preparation of the five-year strategic plan and the extrapolation of cash flow forecasts beyond the normal requirements of management reporting; the assessment of the discount rate appropriate to the CGUs; estimation of market values of CGUs; and the valuation of the separable assets of each business whose goodwill is being reviewed. Details of a sensitivity analysis on the recoverable amount in excess of carrying value are shown in note 18.
Impairment testing of software development costs involves estimation uncertainty in a number of areas including: the projection of the economic benefits associated with each asset; subsequent re-measurement of these benefits through the development cycle and into use; and the projected ultimate cost of each asset at each point through the development cycle due to specification changes.
3. Risk management 3.1 Enterprise Risk Management Strategy and Framework The ERMF sets out, at a high level, our approach and processes for managing risks. Further information can be found in the Risk management section of the Strategic report on page 27.
3.2 Risk and capital management modelling The Board has ultimate responsibility for ensuring that the Group has sufficient funds to meet its liabilities as they fall due. The Group carries out detailed modelling of its assets, liabilities and the key risks to which these are exposed. This modelling includes the Group’s own assessment of its SCR. In 2015, this SCR assessment was submitted to the PRA as part of the Group’s application for IMAP for which approval was subsequently granted in June 2016. The SCR quantifies the insurance, market, credit and operational risks that the regulated entities are undertaking.
The Board is closely involved in the SCR process and reviews, challenges and approves its assumptions and results.
3.3 Principal risks from insurance activities and use of financial instruments The Risk management section of the Strategic report sets out all the risks assessed by the Group as principal risks. Detailed below is the Group’s risk exposure arising from its insurance activities and use of financial instruments specifically in respect of insurance risk, market risk and credit risk.
3.3.1 Insurance risk The Group is exposed to insurance risk as a primary consequence of its business. Key insurance risks focus on the risk of loss due to fluctuations in the timings, amount, frequency and severity of an insured event relative to the expectations at the time of underwriting.
The Group is mainly exposed to the following Insurance risks:
Reserve risk Reserve risk relates to both premiums and claims. This is the risk of understatement of reserves arising from:
the uncertain nature of claims;
data issues and changes to the claims reporting process;
operational failures;
failure to recognise claims trends in the market; and
changes in underwriting and business written so that past trends are not necessarily a predictor of the future.
Understatement of reserves may result in not being able to pay claims when they fall due. Alternatively, overstatement of reserves can lead to a surplus of funds being retained resulting in opportunity cost for example lost investment return or insufficient resource to pursue strategic projects and develop the business.
Reserve risk is controlled through a range of processes:
regular reviews of the claims, premiums and an assessment of the requirement for a liability adequacy provision for the main classes of business by the internal actuarial team;

www.directlinegroup.com 137
Strategic reportG
overnanceFinancial statem
ents
www.directlinegroup.com 137
the use of external actuaries to review periodically the actuarial best estimate reserves produced internally, either through peer review or through provision of independent reserve estimates;
accompanying all reserve reviews with actuarial assessment of the uncertainties through a variety of techniques including bootstrapping and scenario analysis;
oversight of the reserving process by relevant senior management and the Board;
regular reconciliation of the data used in the actuarial reviews against general ledger data and reconciliation of the claims data history against the equivalent data from prior reviews; and
regular assessment of the uncertainty in the reserves to help the Board set management best estimate reserves.
The Group’s reserves are subject to the risk of retrospective changes in judicial conditions such as the change in the Ogden discount rate announced on the 27 February 2017. This is the discount rate set by the Lord Chancellor and used by courts to calculate lump sum awards in bodily injury cases. The rate has been 2.5% since 2001 and will change to minus 0.75% from 20 March 2017. The Group has calculated its estimated reserves based on the new rate which itself is uncertain depending on the outcome of the Government’s proposed consultation on the framework for setting the rate and on the frequency and timing of future changes.
Uncertainty in claims reserves estimation is larger for claims such as PPOs for which annually indexed payments are made typically over the lifetime of the injured party. Claims reserves for PPOs are held on a discounted basis and are sensitive to a change in the assumed real discount rate.
The table below provides a sensitivity analysis of the potential impact of a change in a single factor with all other assumptions left unchanged. Other potential risks beyond the ones described could have an additional financial impact on the Group.
Increase / (decrease) in profit
before tax and equity3
At 31 December 2016
£m 2015
£m
PPOs1 Impact of an increase in the discount rate used in the calculation of present values of 100 basis points 68.2 76.0Impact of a decrease in the discount rate used in the calculation of present values of 100 basis points (97.9) (109.4)Ogden2 as at 31 December 2016 Impact of the Group reserving at a discount rate of 0% compared to minus 0.75% at 31 December 2016 102.1 –Impact of the Group reserving at a discount rate of minus 1.5% compared to minus 0.75% at 31 December 2016 (156.4) –Ogden as at 31 December 2015 Impact of the Group reserving at a discount rate of 2.5% compared to 1.5% at 31 December 2015 – 131.9Impact of the Group reserving at a discount rate of 0.5% compared to 1.5% at 31 December 2015 – (190.0)
Notes: 1. The sensitivities relating to an increase or decrease in the real discount rate used for PPOs illustrate a movement in the time value of money from the assumed level
of 0.0%. 2. As at 31 December 2016 the Group has reserved at a discount rate of minus 0.75% (2015: 1.5%). With effect from 20 March 2017, the Ogden discount rate
will be minus 0.75% (2015: 2.5%). 3. These sensitivities exclude the impact of taxation. 4. These sensitivities reflect one-off impacts at 31 December and should not be interpreted as a prediction.
In addition, there is the risk that claims are reserved or paid inappropriately, including the timing of such activity. However, there are claims management controls in place to mitigate this risk, as outlined below:
Claims are managed utilising a range of IT system-driven controls coupled with manual processes outlined in detailed policies and procedures to ensure claims are handled in an appropriate, timely and accurate manner.
Each member of staff has a specified handling authority, with controls preventing them handling or paying claims outside their authority, as well as controls to mitigate the risk of paying invalid claims. In addition, there are various outsourced claims handling arrangements, all of which are monitored closely by management, with similar principles applying in terms of the controls and procedures.
Loss adjustors are used in certain circumstances to handle claims to conclusion. This involves liaison with the policyholder, third parties, suppliers and the claims function.
Specialist bodily injury claims teams are responsible for handling these types of losses with the nature of handling dependent on the level and type of claim. Claims exceeding a certain threshold are referred to the technical and large loss teams who also deal with all other claim types above defined limits or within specific criteria.

Direct Line Group Annual Report & Accounts 2016138
Notes to the consolidated financial statements continued
Direct Line Group Annual Report & Accounts 2016 138
3. Risk management continued A process is in place to deal with major weather and other catastrophic events, known as the ‘Surge Demand Plan’. A surge
is the collective name given to an incident which significantly increases the volume of claims reported to the Group’s claims functions. The plan covers surge demand triggers, stages of incident, operational impact, communication and management information monitoring of the plan.
Underwriting risk This is the risk that future claims experience on business written is materially different from the results expected, resulting in current year losses. The Group predominantly underwrites personal lines insurance including motor, residential property, roadside assistance, creditor, travel and pet business. The Group also underwrites commercial risks primarily for low-to-medium risk trades within the SME market. Contracts are typically issued on an annual basis which means that the Group’s liability usually extends for a 12 month period, after which the Group is entitled to decline to renew or can impose renewal terms by amending the premium or other policy terms and conditions such as the excess as appropriate.
Underwriting risk includes catastrophe risk, the risk of loss, or of adverse change in the value of the insurance liabilities resulting from significant uncertainty of pricing, underwriting and provisioning assumptions related to extreme or exceptional circumstances.
When underwriting policies, the Group is subject to concentration risk in a variety of forms, including:
Geographic concentration risk – the Group purchases a catastrophe reinsurance programme to protect against a modelled one in 200-year loss. The retained deductible is £150 million at 31 December 2016 (2015: £150 million);
Product concentration risk – the Group’s business is heavily concentrated in the UK general insurance market. However, the Group offers a diversified portfolio of products and a variety of brands sold through a range of distribution channels to its customers; and
Sector concentration risk – the concentration of the Group to any given industry sector is monitored and analysed in respect of commercial customers.
It is important to note that none of these risk categories is independent of the others and that giving due consideration to the relationship between these risks is an important aspect of the effective management of insurance risk.
Distribution risk This is the risk that material change in the volume of policies written, may result in losses or reduced profitability.
Pricing risk This is the risk of economic loss arising from policies being incorrectly priced or accepted to achieve desired volume and profitability.
Reinsurance risk This is the risk of inappropriate selection and / or placement of a reinsurance arrangement, with either individual or multiple reinsurers which renders the transfer of insurance risk to the reinsurer(s) inappropriate and / or ineffective. Other risks include:
Reinsurance concentration risk – the concentration credit exposure to any given counterparty;
Reinsurance capacity being reduced and / or withdrawn;
Underwriting risk appetite and reinsurance contract terms not being aligned;
Reinsurance contract terms being inappropriate or ineffective resulting in classes or types of business not being appropriately reinsured;
Non-adherence to the reinsurance policy terms and conditions, in terms of both policy management and claims not being handled within the reinsurance contract terms and conditions or paid on an ex-gratia basis resulting in reinsurance recoveries not being made in full;
Inappropriate or inaccurate management information and / or modelling being used to determine the value for money and purchasing of reinsurance (including aggregate modelling); and
Changes in the external legal, regulatory, social or economic environment altering the definition and application of reinsurance policy wordings or the effectiveness or value for money of reinsurance.
The Group uses reinsurance to:
protect the underwriting result against low-frequency, high-severity losses through the transfer of catastrophe claims volatility to reinsurers;
protect the underwriting result against unforeseen volumes of, or adverse trends in, large individual claims in order to reduce volatility and to improve stability of earnings;
reduce the Group’s capital requirements; and / or
transfer risk that is not within the Group’s current risk appetite.

www.directlinegroup.com 139
Strategic reportG
overnanceFinancial statem
ents
www.directlinegroup.com 139
Using reinsurance, the Group cedes insurance risk to reinsurers but, in return, assumes counterparty default risk against which a reinsurance bad debt provision is assessed. The financial security of the Group’s panel of reinsurers is therefore important and both the quality and amount of the assumed counterparty default risk are subject to an approval process whereby reinsurance is only purchased from reinsurers that hold a credit rating of at least A- at the time cover is purchased. The Group’s leading counterparty exposures are reviewed on a monthly basis by the Head of Reinsurance and Corporate Insurance. The Group aims to contract with a diverse range of reinsurers on its contracts to mitigate the credit and / or non-payment risks associated with its reinsurance exposures.
Certain reinsurance contracts have long durations as a result of bodily injury and PPO claims, and insurance reserves therefore include provisions beyond the levels created for shorter-term reinsurance bad debt.
3.3.2 Market risk Market risk is the risk of loss resulting from fluctuations in the level and in the volatility of market prices of assets, liabilities and financial instruments.
The Group is mainly exposed to the following market risk factors:
Spread risk;
Interest rate risk;
Property risk; and
Foreign currency risk.
The Group has policies and limits approved by the Investment Committee for managing the market risk exposure. These set out the principles that the business should adhere to for managing market risk and establishing the maximum limits the Group is willing to accept having considered strategy, risk appetite and capital resources.
The Group monitors its market risk exposure on a monthly basis and has established an aggregate exposure limit consistent with its risk objective to maintain capital adequacy. Interdependencies across risk types have also been considered within the aggregate exposure limit. The allocation of the Group’s investments across asset classes has been approved at the Investment Committee.
The strategic asset allocation within the investment portfolio is reviewed by the Investment Committee, which makes recommendations to the Board for its investment strategy approval. The Investment Committee determines policy and controls, covering such areas as risk, liquidity and performance. The Investment Committee meets at least three times a year to evaluate risk exposure, the current strategy, associated policies and investment guidelines and to consider investment recommendations submitted to it. Oversight of the implementation of decisions taken by the Investment Committee is via the 1st and 2nd Lines of Defence.
The investment management objectives are to:
Maintain the safety of the portfolio’s principal both in economic terms and from a capital, accounting and reporting perspective;
Maintain sufficient liquidity to provide cash requirements for operations, including in the event of a catastrophe; and
Maximise the portfolio’s total return within the constraints of the other objectives and the limits defined by the investment guidelines and capital allocation.
The Group has a property portfolio and an infrastructure debt portfolio in order to improve matching to the longer duration PPOs.
The Group uses its internal economic capital model to determine its capital requirements and market risk limits, and monitors its market risk exposure based on a 99.5% value-at-risk measure. The Group also applies market risk stressed scenarios testing for the economic impact of specific severe market conditions. The results of this analysis are used to enhance the understanding of market risk. The asset liability matching and investment management minimum standard explicitly prohibits the use of derivatives for speculative or gearing purposes. However, the Group is able to and does use derivatives for hedging its currency risk and interest rate risk exposures.
Spread risk This is the risk of loss from the sensitivity of the value of assets and investments to changes in the level or in the volatility of credit spreads over the risk-free interest rate term structure. The level of spread is the difference between the risk-free rate and actual rate paid on the asset, with larger spreads being associated with higher risk assets. The Group is exposed to spread risk through its investments in bonds.
Interest rate risk This is the risk of loss from all assets and liabilities for which the net asset value is sensitive to changes in the term structure of interest rates or interest rate volatility. The Group’s interest rate risk arises mainly from its debt, floating interest rate investments and assets and liabilities exposed to fixed interest rates.
The fixed interest rate up to 27 April 2022 on the Group’s 30-year maturity £500 million of subordinated guaranteed dated notes has been exchanged for a floating rate of interest (note 31).

Direct Line Group Annual Report & Accounts 2016140
Notes to the consolidated financial statements continued
Direct Line Group Annual Report & Accounts 2016 140
3. Risk management continued The Group also invests in floating rate debt securities, whose investment income is influenced by the movement of the short-term interest rate. A movement of the short-term interest rate will affect the expected return on these investments.
The market value of the Group’s financial investments with fixed coupons is affected by the movement of interest rates. For the majority of investments in US Dollar corporate bonds, excluding £432.0 million of short duration high yield bonds (2015: £336.9 million), the Group hedges the exposure of this portfolio to the US Dollar interest rate risk using swaps. These derivatives reduce the duration of the portfolio to close to zero.
Property risk This is the risk of loss as a result of sensitivity of assets and financial investment to the level or volatility of market prices of property. At 31 December 2016, the value of these property investments was £329.0 million (2015: £347.4 million). The property investments are located in the UK.
Foreign currency risk The exposure to currency risk is generated by the Group’s investments in US Dollar and Euro denominated corporate bonds.
The Group maintains exposure to US Dollar securities through £2,107.1 million (2015: £1,876.3 million) of investments in US Dollar corporate bonds and Euro securities through £91.8 million (2015: £nil) of Euro corporate bonds. The foreign currency exposure of these investments is hedged by foreign currency forward contracts, maintaining a minimal unhedged currency exposure on these portfolios, as well as a low basis currency risk on the hedging.
Sensitivity analysis The table below provides a sensitivity analysis of the potential impact of a change in a single factor with all other assumptions left unchanged. Other potential risks beyond the ones described in the table could have an additional financial impact on the Group.
Increase / (decrease) in profit before tax
Increase / (decrease) in total equity5 at
31 December
2016£m
2015 £m
2016 £m
2015£m
Spread Impact of a 100 basis points increase in spreads on financial investments1,2,4. – – (183.1) (183.5)Interest rate Impact of a 100 basis points increase in interest rates on financial investments and derivatives1,2,3,4. 21.5 22.1 (101.5) (119.9)Investment property Impact of a 15% decrease in property markets (49.4) (52.1) (49.4) (52.1)
Notes: 1. The income statement impact on financial investments is limited to floating rate instruments and interest rate derivatives used to hedge a portion of the portfolio.
The income statement is not impacted in relation to fixed rate instruments, in particular AFS debt securities, where the coupon return is not impacted by a change in prevailing market rates, as the accounting treatment for AFS debt securities means that only the coupon received is processed through the income statement with fair value movements being recognised through total equity.
2. The increase or decrease in total equity does not reflect any fair value movement in infrastructure debt, HTM debt securities and commercial real estate loans that would not be recorded in the financial statements under IFRSs as they are classified as loans and receivables and HTM respectively, which are carried at amortised cost. It is estimated that a fair value reduction in these asset categories resulting from a 100 basis point increase in spreads would have been £34.4 million (2015: £29.5 million) and a 100 basis point increase in interest rate would have been £4.8 million (2015:£0.1 million).
3. The sensitivities set out above reflect one-off impacts at 31 December with the exception of the income statement interest rate sensitivity on financial investments and derivatives, which projects a movement in a full year’s interest charge as a result of the increase in the interest rate applied to these assets or liabilities on those positions held at 31 December.
4. The subordinated liabilities and associated interest rate swap are excluded from the sensitivity analysis. 5. These sensitivities exclude the impact of taxation. 6. The sensitivities set out above have not considered the impact of the general market changes on the value of the Group’s insurance liabilities or retirement
benefit obligations. They reflect one off impacts at 31 December and should not be interpreted as a prediction.

www.directlinegroup.com 141
Strategic reportG
overnanceFinancial statem
ents
www.directlinegroup.com 141
The Group has a number of open interest rate and foreign exchange derivative positions. Collateral management arrangements are in place for significant counterparty exposures. At 31 December 2016, the Group has pledged £23.7 million in cash (2015: £12.3 million) and £3.4 million in UK Treasury Bills (2015; £nil) to cover initial margins and out-of-the-money derivative positions. At 31 December 2016, counterparties have pledged £19.1 million in cash and £39.4 million in UK Gilts (2015: £19.7 million in UK Gilts) to the Group to cover in-the-money derivative positions.
The terms and conditions of collateral pledged for both assets and liabilities are market standard. When securities are pledged they are required to be readily convertible to cash, and as such no policy has been established for the disposal of assets not readily convertible into cash.
3.3.3 Credit risk This is the risk of loss resulting from default on cash inflows and / or changes in market value of issuers of securities, counterparties and any debtors to which the Group is exposed. The Group is mainly exposed to the following credit risk factors:
Counterparty default risk; and
Concentration risk.
Counterparty default risk This is the risk of loss from unexpected default of the counterparties and debtors of Group undertakings. This risk is primarily managed by the 1st Line of Defence and monitored by three forums: the Investment risk forum monitors credit spreads as indicators of potential losses on investments incurred but not yet realised, the Credit risk forum monitors reinsurance and corporate insurance counterparty default risk; and the NIG credit committee is responsible for monitoring broker credit risk. The main responsibility of these fora is to ensure that all material aspects of counterparty default risk within the Group are identified, monitored and measured.
The main sources of counterparty default risk for the Group are:
Investments – this arises from the investment of funds in a range of investment vehicles permitted by the investment policy; and
Reinsurance recoveries – counterparty exposure to reinsurance counterparties arises in respect of reinsurance claims against which a reinsurance bad debt provision is assessed. PPOs have the potential to increase the ultimate value of a claim and, by their very nature, to significantly increase the length of time to reach final payment. This can increase reinsurance counterparty default risk in terms of both amount and longevity.

Direct Line Group Annual Report & Accounts 2016142
Notes to the consolidated financial statements continued
Direct Line Group Annual Report & Accounts 2016 142
3. Risk management continued The following tables analyse the carrying value of financial and insurance assets that bear counterparty default risk between those assets that have not been impaired by age in relation to due date, and those that have been impaired.
At 31 December 2016
Neither past due nor
impaired£m
Past due 1 – 90 days
£m
Past due more than 90 days
£m
Assets that have been
impaired £m
Carrying value in the balance
sheet£m
Reinsurance assets 1,371.8 – – – 1,371.8Insurance and other receivables 937.8 38.0 12.5 – 988.3Derivative assets 79.7 – – – 79.7Debt securities 4,730.3 – – – 4,730.3Infrastructure debt 337.0 – – – 337.0Commercial real estate loans 79.7 – – – 79.7Cash and cash equivalents1 1,166.1 – – – 1,166.1Total 8,702.4 38.0 12.5 – 8,752.9
At 31 December 2015
Neither past due nor
impaired£m
Past due 1 – 90 days
£m
Past due more than 90 days
£m
Assets that have been
impaired £m
Carrying value in the balance
sheet£m
Reinsurance assets 1,011.4 – – – 1,011.4Insurance and other receivables 917.3 32.4 6.1 – 955.8Derivative assets 19.6 – – – 19.6Debt securities 5,240.1 – – – 5,240.1Deposits with credit institutions with maturities > three months 44.9 – – – 44.9Infrastructure debt 329.6 – – – 329.6Cash and cash equivalents1 963.7 – – – 963.7Total 8,526.6 32.4 6.1 – 8,565.1
Notes: 1. This represents money market funds with no notice period for withdrawal and cash at bank and in hand.
Within the analysis of debt securities above are bank debt securities at 31 December 2016 of £1,199.5 million (2015: £1,305.1 million), that can be further analysed as: secured £62.2 million (2015: £86.4 million); unsecured £973.8 million (2015: £1,059.6 million); and subordinated £163.5 million (2015: £159.1 million).

www.directlinegroup.com 143
Strategic reportG
overnanceFinancial statem
ents
www.directlinegroup.com 143
Concentration risk This is the risk of exposure to increased losses associated with inadequately diversified portfolios of assets and / or obligations, in particular:
large exposures to individual credits (either bond issuers or deposit-taking institutions);
large exposures to different credits where movements in values and ratings are closely correlated.
Concentration risk on investments arises through excessive exposure to particular industry sectors, groups of business undertakings or similar activities. The Group may suffer significant losses in its investment portfolio as a result of over exposure to particular sectors engaged in similar activities or similar economic features that would cause their ability to meet contractual obligations to be similarly affected by changes in economic, political or other conditions.
The table below analyses the distribution of debt securities, by geographical area (commercial real estate loans and infrastructure debt are all within the UK).
At 31 December 2016 Corporate
£m
Local government
£mSovereign
£m
Supranational
£m
Debt securities
total£m
Australia 100.2 – – – 100.2Belgium 59.7 – 9.7 – 69.4Canada 33.3 – – – 33.3Cayman Islands 17.5 – – – 17.5Denmark 15.6 – – – 15.6France 226.2 3.6 – – 229.8Germany 277.0 – – – 277.0Hong Kong 11.8 – – – 11.8Ireland 2.1 – – – 2.1Italy 25.9 – 4.2 – 30.1Japan 42.9 – – – 42.9Luxembourg 6.2 – – – 6.2Mexico 11.8 – – – 11.8Netherlands 166.2 – – – 166.2New Zealand 7.0 – – – 7.0Norway 27.6 – – – 27.6Portugal 1.1 – – – 1.1Singapore 25.6 – – – 25.6South Korea 8.4 9.4 – – 17.8Spain 38.0 – – – 38.0Sweden 74.2 8.7 – – 82.9Switzerland 92.1 – – – 92.1UK 1,093.3 – 324.9 – 1,418.2USA 1,905.1 – 2.4 – 1,907.5Supranational – – – 98.6 98.6Total 4,268.8 21.7 341.2 98.6 4,730.3

Direct Line Group Annual Report & Accounts 2016144
Notes to the consolidated financial statements continued
Direct Line Group Annual Report & Accounts 2016 144
3. Risk management continued The table below analyses the distribution of debt securities by geographical area (infrastructure debt is all within the UK).
At 31 December 2015 Corporate
£m
Local government
£mSovereign
£m
Securitised credit
£m Supranational
£m
Debt securities
total£m
Australia 107.6 – – – – 107.6Austria 6.3 – – – – 6.3Belgium 42.9 – 10.9 – – 53.8Canada 47.5 11.4 – – – 58.9Cayman Islands 22.1 – – 95.3 – 117.4China 4.5 – – – – 4.5Denmark 7.9 8.5 – – – 16.4Finland – 13.7 – – – 13.7France 235.5 25.4 – – – 260.9Germany 325.4 16.4 – – – 341.8Hong Kong 8.2 – – – – 8.2Ireland 0.8 – – – – 0.8Italy 10.1 – 4.2 – – 14.3Japan 47.8 – – – – 47.8Luxembourg 5.3 – – – – 5.3Mexico 9.1 – – – – 9.1Netherlands 170.7 – – – – 170.7New Zealand 5.3 – – – – 5.3Norway 18.3 10.0 – – – 28.3Portugal 1.1 – – – – 1.1Singapore 24.7 – – – – 24.7South Korea 8.0 8.7 – – – 16.7Spain 32.5 – – – – 32.5Sweden 80.7 11.2 – – – 91.9Switzerland 83.9 – – – – 83.9UK 1,250.7 – 427.6 177.3 – 1,855.6USA 1,639.0 – – 83.5 – 1,722.5Supranational – – – – 140.1 140.1Total 4,195.9 105.3 442.7 356.1 140.1 5,240.1

www.directlinegroup.com 145
Strategic reportG
overnanceFinancial statem
ents
www.directlinegroup.com 145
The table below analyses the distribution of debt securities by industry sector classifications.
2016 2015
At 31 December £m % £m %
Basic materials 132.6 3% 102.9 2%Communications 234.1 5% 237.2 4%Consumer, cyclical 349.1 7% 298.3 6%Consumer, non-cyclical 520.7 11% 432.5 8%Diversified 57.3 1% 52.8 1%Energy 310.8 7% 243.6 5%Financial 1,776.9 38% 1,896.6 36%Industrial 215.3 4% 250.4 5%Mortgage and other asset backed securities – – 356.1 7%Sovereign, supranational and local government 461.5 10% 688.1 13%Technology 137.6 3% 115.8 2%Transport 10.1 0% – –Utilities 524.3 11% 565.8 11%Total 4,730.3 100% 5,240.1 100%
The table below analyses the distribution of infrastructure debt by industry sector classifications.
2016 2015
At 31 December £m % £m %
Social, of which: Education 145.5 43% 132.3 40%Healthcare 96.0 29% 98.1 30%Other 57.6 17% 58.8 18%
Transport 37.9 11% 40.4 12%Total 337.0 100% 329.6 100%
The tables below analyse the credit quality of debt securities that are neither past due nor impaired.
At 31 December 2016 AAA£m
AA+ to AA–£m
A+ to A–£m
BBB+ to BBB– £m
BB+ and below £m
Total £m
Corporate 192.3 524.1 2,135.9 1,006.6 409.9 4,268.8Supranational 94.0 4.6 – – – 98.6Local government – 21.7 – – – 21.7Sovereign 2.4 334.6 – 4.2 – 341.2Total 288.7 885.0 2,135.9 1,010.8 409.9 4,730.3
At 31 December 2015 AAA£m
AA+ to AA–£m
A+ to A–£m
BBB+ to BBB– £m
BB+ and below £m
Total £m
Corporate 266.3 604.5 1,976.2 1,019.2 329.7 4,195.9Supranational 123.9 16.2 – – – 140.1Local government 36.9 59.0 9.4 – – 105.3Sovereign – 438.5 – 4.2 – 442.7Securitised credit1 331.2 24.9 – – – 356.1Total 758.3 1,143.1 1,985.6 1,023.4 329.7 5,240.1
Note: 1. Securitised credit consisted of prime mortgage backed securities, collateralised loan obligations, securitised student loans and commercial mortgage backed
securities. Following a strategic decision, the Group decided to exit this asset class during August and September 2016.

Direct Line Group Annual Report & Accounts 2016146
Notes to the consolidated financial statements continued
Direct Line Group Annual Report & Accounts 2016 146
3. Risk management continued The tables below analyse the credit quality of financial and insurance assets that are neither past due nor impaired (excluding debt securities analysed above). The tables include reinsurance exposure, after provision. Note 3.3.1 details the Group’s approach to reinsurance counterparty default risk management.
At 31 December 2016 AAA £m
AA+ to AA−£m
A+ to A−£m
BBB+ to BBB–£m
BB+ and below £m
Not rated £m
Total£m
Reinsurance assets – 993.8 371.4 5.6 – 1.0 1,371.8Insurance and other receivables1 – 19.3 13.7 9.4 – 895.4 937.8Derivative assets – 6.6 32.8 40.3 – – 79.7Infrastructure debt – – 83.7 220.5 32.8 – 337.0Commercial real estate loans 13.8 20.4 41.1 4.4 – – 79.7Cash and cash equivalents2 999.5 0.4 88.9 77.3 – – 1,166.1Total 1,013.3 1,040.5 631.6 357.5 32.8 896.4 3,972.1
At 31 December 2015 AAA £m
AA+ to AA−£m
A+ to A−£m
BBB+ to BBB–£m
BB+ and below £m
Not rated £m
Total£m
Reinsurance assets – 778.2 225.7 3.2 – 4.3 1,011.4Insurance and other receivables1 – 12.4 23.2 25.8 0.4 855.5 917.3Derivative assets – 0.1 0.4 19.1 – – 19.6Deposits with credit institutions with maturities > three months – 5.0 34.9 5.0 – – 44.9Infrastructure debt – – 86.1 227.8 15.7 – 329.6Cash and cash equivalents2 831.9 – 60.8 71.0 – – 963.7Total 831.9 795.7 431.1 351.9 16.1 859.8 3,286.5
Notes: 1. Includes receivables due from policyholders, agents, brokers and intermediaries which generally do not have a credit rating. 2. This represents money market funds with no notice period for withdrawal and cash at bank and in hand.
3.3.4 Operational risk This is the risk of loss due to inadequate or failed internal processes, people, systems or from external events. Sources of operational risk for the Group include:
Change risk This is the risk of failing to manage the Group’s change portfolio resulting in conflicting priorities and failure to deliver strategic outcomes to time, cost or quality.
Technology and infrastructure risk This is the risk that the IT infrastructure is insufficient to deliver the Group’s strategy.
Outsourcing risk This is the risk of failing to implement a robust framework for the sourcing, appointment and ongoing contract management of external suppliers, outsourced service providers and intragroup relationships. This includes both domestic and offshore outsourcing activities.
Information Security Risk This is the risk of loss, corruption to Group or customer data or intellectual property, resulting in lost reputation, regulatory censure, supervision and fines or loss of competitive advantage.
The Group has in place agreed policies and standards to establish key controls relating to operational risk.
3.3.5 Liquidity risk This is the risk of being unable to realise investments in order to settle financial obligations when they fall due.
The measurement and management of liquidity risk within the Group is undertaken within the limits and other policy parameters of the Group’s liquidity risk appetite and is detailed within the liquidity risk minimum standard. As part of this process the Investment and Treasury team are required to put in place a liquidity plan which must consider expected and stressed scenarios for cash in-flows and out-flows that is reviewed at least annually by the Investment risk forum. Compliance is monitored in respect of both the minimum standard and the regulatory requirements of the PRA.

www.directlinegroup.com 147
Strategic reportG
overnanceFinancial statem
ents
www.directlinegroup.com 147
The tables below analyse the maturity of the Group’s derivative assets and liabilities.
Notional amounts Maturity and fair value
At 31 December 2016 £m
Less than 1 year
£m1 – 5 years
£m
Over 5 years
£m Total
£m
Derivative assets
At fair value through the income statement: Foreign exchange contracts (forwards) 1,110.0 21.4 – – 21.4Designated as hedging instruments: Foreign exchange contracts (forwards) 14.8 1.6 0.1 – 1.7Interest rate swaps 1,902.0 (1.1) 3.0 54.7 56.6Total 3,026.8 21.9 3.1 54.7 79.7
Notional amounts Maturity and fair value
At 31 December 2016 £m
Less than 1 year
£m1 – 5 years
£m
Over 5 years
£m Total
£m
Derivative liabilities At fair value through the income statement: Foreign exchange contracts (forwards) 2,589.6 43.5 – – 43.5Designated as hedging instruments: Interest rate swaps 634.8 1.1 – 0.5 1.6Total 3,224.4 44.6 – 0.5 45.1
Notional amounts Maturity and fair value
At 31 December 2015 £m
Less than 1 year
£m1 – 5 years
£m
Over 5 years
£m Total £m
Derivative assets At fair value through the income statement: Foreign exchange contracts (forwards) 27.1 0.4 – – 0.4Designated as hedging instruments: Foreign exchange contracts (forwards) 5.0 0.3 – – 0.3Interest rate swaps 678.4 1.1 0.2 17.6 18.9Total 710.5 1.8 0.2 17.6 19.6
Notional amounts Maturity and fair value
At 31 December 2015 £m
Less than 1 year
£m1 – 5 years
£m
Over 5 years
£m Total £m
Derivative liabilities At fair value through the income statement: Foreign exchange contracts (forwards) 1,876.3 42.2 – – 42.2Designated as hedging instruments: Foreign exchange contracts (forwards) 0.7 0.1 – – 0.1Interest rate swaps 1,241.9 3.0 (0.5) 1.6 4.1Total 3,118.9 45.3 (0.5) 1.6 46.4

Direct Line Group Annual Report & Accounts 2016148
Notes to the consolidated financial statements continued
Direct Line Group Annual Report & Accounts 2016 148
3. Risk management continued The tables below analyse financial investments, cash and cash equivalents, insurance and financial liabilities by remaining duration, in proportion to the cash flows expected to arise during that period, for each category.
At 31 December 2016 Total
£m
Within1 year
£m1 – 3 years
£m3 – 5 years
£m 5 – 10 years
£m
Over 10 years
£m
Debt securities 4,730.3 588.3 1,001.0 1,172.5 1,676.3 292.2Infrastructure debt 337.0 13.1 24.6 28.0 87.0 184.3Commercial real estate loans 79.7 1.3 32.6 45.8 – –Cash and cash equivalents1 1,166.1 1,166.1 – – – –Total 6,313.1 1,768.8 1,058.2 1,246.3 1,763.3 476.5
At 31 December 2016 Total
£m
Within1 year
£m1 – 3 years
£m3 – 5 years
£m 5 – 10 years
£m
Over 10 years
£m
Subordinated liabilities 539.6 8.3 – – 531.3 –Insurance liabilities2 4,666.6 1,283.6 1,139.5 621.6 666.4 955.5Borrowings 55.3 55.3 – – – –Trade and other payables including insurance payables 699.2 688.9 9.8 0.2 0.3 –Total 5,960.7 2,036.1 1,149.3 621.8 1,198.0 955.5
At 31 December 2015 Total£m
Within1 year
£m1 – 3 years
£m3 – 5 years
£m 5 – 10 years
£m
Over 10 years
£m
Debt securities 5,240.1 269.2 1,628.4 1,203.9 1,657.4 481.2Deposits with credit institutions with maturities in excess of three months 44.9 44.9 – – – –Infrastructure debt 329.6 11.6 22.0 23.9 78.4 193.7Cash and cash equivalents1 963.7 963.7 – – – –Total 6,578.3 1,289.4 1,650.4 1,227.8 1,735.8 674.9
At 31 December 2015 Total£m
Within 1 year
£m1 – 3 years
£m3 – 5 years
£m 5 – 10 years
£m
Over 10 years
£m
Subordinated liabilities 521.1 8.3 – – 512.8 –Insurance liabilities2 4,524.5 1,349.8 1,043.3 564.2 575.1 992.1Borrowings 61.3 60.8 0.5 – – –Trade and other payables including insurance payables 656.5 652.9 3.0 0.2 0.3 0.1Total 5,763.4 2,071.8 1,046.8 564.4 1,088.2 992.2
Notes: 1. This represents money market funds with no notice period for withdrawal and cash at bank and in hand. 2. Insurance liabilities exclude unearned premium reserves as there are no liquidity risks inherent in them.

www.directlinegroup.com 149
Strategic reportG
overnanceFinancial statem
ents
www.directlinegroup.com 149
3.4 Capital adequacy (unaudited) Capital is managed in accordance with the Group’s capital management minimum standard, the objectives of which are to manage capital efficiently and maintain an appropriate level of capitalisation and solvency. The Group determines the appropriate level of capital on the basis of a number of criteria, including economic, regulatory and rating agency capital requirements. The Group seeks to hold capital resources consistent with an ‘A’ range credit rating.
From 1 January 2016, the Group’s regulatory capital position has been assessed against the Solvency II framework. From 1 July 2016, the Group was approved to assess its SCR using a partial internal model, including a full internal economic capital model for the UKI underwriting entity. The model is calibrated to a 99.5% confidence interval and consider business written to date and one year of future business, in line with Solvency II requirements.
Using the Group’s partial internal model, there is a capital surplus of approximately £0.9 billion above a solvency capital requirement of £1.4 billion at 31 December 2016. On 1 January 2016, this surplus was £0.6 billion above a solvency capital requirement of £1.8 billion calculated using the standard formula approach. The Group’s capital requirements and solvency position are produced and presented to the Board on a regular basis.
4. Segmental analysis The Directors manage the Group primarily by product type and present the segmental analysis on that basis. The segments reflect the management structure whereby a member of the Executive Committee is accountable to the Chief Executive Officer for each of the operating segments:
Motor This segment consists of personal motor insurance together with the associated legal protection cover. The Group sells motor insurance through its own brands, Direct Line, Churchill and Privilege, and through partnership brands.
Home This segment consists of home insurance together with associated legal protection cover. The Group sells home insurance through its own brands, Direct Line, Churchill and Privilege, and through partnership brands.
Rescue and other personal lines This segment consists of rescue products sold through the Group’s own brand, Green Flag, and other personal lines insurance, including travel, pet and creditor sold through its own brands, Direct Line, Churchill and Privilege, and through partnership brands.
Commercial This segment consists of commercial insurance for small and medium-size entities sold through NIG, Direct Line for Business, Churchill for Business and through partnership brands.
Certain income and charges are not allocated to the specific operating segments above as they are considered by management to be outside underlying business activities by virtue of their one-off incidence, size or nature. Such income and charges are categorised as either run-off or restructuring and other one-off costs, described below.
Run-off The segment consists of two principal lines, policies previously written through the personal lines broker channel and Tesco business. These residual businesses are now in run-off.
Restructuring and other one-off costs Restructuring costs are costs incurred in respect of the business activities where the Group has a constructive obligation to restructure its activities. One-off costs were costs that were non-recurring in nature.
No inter-segment transactions occurred in the year ended 31 December 2016 (2015: £nil). If any transaction were to occur, transfer prices between operating segments would be set on an arm’s length basis in a manner similar to transactions with third parties. Segment income, expenses and results will include those transfers between business segments which will then be eliminated on consolidation.
For each operating segment, there is no individual policyholder or customer that represents 10% or more of the Group’s total revenue.

Direct Line Group Annual Report & Accounts 2016150
Notes to the consolidated financial statements continued
Direct Line Group Annual Report & Accounts 2016 150
4. Segmental analysis continued The table below analyses the Group’s revenue and results by reportable segment for the year ended 31 December 2016.
Motor
£mHome
£m
Rescue and other
personal lines£m
Commercial£m
Total Ongoing
£m Run-off
£mTotal
£m
Gross written premium 1,539.1 834.4 400.8 499.8 3,274.1 – 3,274.1
Gross earned premium 1,461.3 851.0 396.1 494.4 3,202.8 – 3,202.8Reinsurance premium (124.2) (34.7) (1.7) (41.6) (202.2) – (202.2)Net earned premium 1,337.1 816.3 394.4 452.8 3,000.6 – 3,000.6Investment return 116.9 19.9 3.9 27.4 168.1 3.4 171.5Instalment income 76.1 23.5 1.9 5.6 107.1 – 107.1Other operating income 40.9 0.8 13.5 3.0 58.2 – 58.2Total income 1,571.0 860.5 413.7 488.8 3,334.0 3.4 3,337.4Insurance claims (1,297.3) (332.1) (243.0) (297.7) (2,170.1) (8.9) (2,179.0)Insurance claims recoverable from reinsurers 295.6 0.1 – 47.2 342.9 32.3 375.2Net insurance claims (1,001.7) (332.0) (243.0) (250.5) (1,827.2) 23.4 (1,803.8)Commission expenses (42.9) (184.4) (28.4) (88.3) (344.0) – (344.0)Operating expenses (377.3) (177.4) (96.4) (108.2) (759.3) (0.2) (759.5)Total expenses (420.2) (361.8) (124.8) (196.5) (1,103.3) (0.2) (1,103.5)Operating profit before restructuring 149.1 166.7 45.9 41.8 403.5 26.6 430.1
Restructuring costs (39.9)Operating profit 390.2Finance costs (37.2)Profit before tax 353.0
Underwriting (loss) / profit (84.8) 122.5 26.6 5.8 70.1 Loss ratio 74.9% 40.7% 61.6% 55.3% 60.9% Commission ratio 3.2% 22.6% 7.2% 19.5% 11.5% Expense ratio 28.2% 21.7% 24.5% 23.9% 25.3% COR 106.3% 85.0% 93.3% 98.7% 97.7%
The table below analyses the Group’s assets and liabilities by reportable segment at 31 December 2016.
Motor
£mHome
£m
Rescue and other
personal lines£m
Commercial £m
Run-off £m
Total £m
Goodwill 126.7 45.8 28.7 10.1 – 211.3Other segment assets 6,748.9 660.5 160.4 1,587.4 753.2 9,910.4Segment liabilities (5,131.7) (502.2) (122.0) (1,207.0) (637.3) (7,600.2)Segment net assets 1,743.9 204.1 67.1 390.5 115.9 2,521.5
The segmental analysis of assets and liabilities is prepared using a combination of asset and liability balances directly attributable to each operating segment and an apportionment of assets and liabilities managed at a Group wide level.

www.directlinegroup.com 151
Strategic reportG
overnanceFinancial statem
ents
www.directlinegroup.com 151
The table below analyses the Group’s revenue and results for continuing operations by reportable segment for the year ended 31 December 2015. Discontinued operations are detailed in note 5.
Motor
£mHome
£m
Rescue and other
personal lines£m
Commercial£m
Total Ongoing
£m Run-off
£m
Continuing operations
£m
Gross written premium 1,406.7 866.3 394.1 485.3 3,152.4 0.1 3,152.5Gross earned premium 1,358.7 880.3 388.0 483.0 3,110.0 0.1 3,110.1Reinsurance premium (109.4) (35.3) (1.6) (42.9) (189.2) – (189.2)Net earned premium 1,249.3 845.0 386.4 440.1 2,920.8 0.1 2,920.9Investment return 138.9 20.5 3.8 31.5 194.7 3.4 198.1Instalment income 69.7 23.3 1.7 5.4 100.1 – 100.1Other operating income 33.9 0.5 12.6 3.7 50.7 – 50.7Total income 1,491.8 889.3 404.5 480.7 3,266.3 3.5 3,269.8Insurance claims (956.7) (434.8) (231.6) (304.5) (1,927.6) 98.3 (1,829.3)Insurance claims recoverable from reinsurers 161.9 (0.3) – 28.7 190.3 (27.9) 162.4Net insurance claims (794.8) (435.1) (231.6) (275.8) (1,737.3) 70.4 (1,666.9)Commission expenses (31.9) (176.7) (24.5) (86.1) (319.2) (0.1) (319.3)Operating expenses (327.1) (167.6) (96.4) (98.0) (689.1) (0.7) (689.8)Total expenses (359.0) (344.3) (120.9) (184.1) (1,008.3) (0.8) (1,009.1)Operating profit before restructuring and other one-off costs 338.0 109.9 52.0 20.8 520.7 73.1 593.8Restructuring and other one-off costs (48.7)Operating profit 545.1Finance costs (37.6)Profit before tax 507.5Underwriting profit / (loss) 95.5 65.6 33.9 (19.8) 175.2 Loss ratio 63.6% 51.5% 59.9% 62.7% 59.5% Commission ratio 2.6% 20.9% 6.4% 19.6% 10.9% Expense ratio 26.2% 19.8% 24.9% 22.2% 23.6% COR 92.4% 92.2% 91.2% 104.5% 94.0%
The table below analyses the Group’s assets and liabilities by reportable segment at 31 December 2015.
Motor
£mHome
£m
Rescue and other
personal lines£m
Commercial £m
Run-off£m
Total £m
Goodwill 126.4 45.8 28.7 10.1 – 211.0Other segment assets 6,303.4 872.2 177.9 1,573.9 818.2 9,745.6Other segment liabilities (4,701.9) (650.6) (132.7) (1,174.0) (667.4) (7,326.6)Segment net assets 1,727.9 267.4 73.9 410.0 150.8 2,630.0
All continuing operations are in the UK. The reportable segment net assets do not represent the Group’s view of the capital requirements for its operating segments.
The segmental analysis of assets and liabilities is prepared using a combination of asset and liability balances directly attributable to each operating segment and an apportionment of assets and liabilities managed at a Group wide level.

Direct Line Group Annual Report & Accounts 2016152
Notes to the consolidated financial statements continued
Direct Line Group Annual Report & Accounts 2016 152
5. Discontinued operations and disposal group The Group completed the disposal of its Italian and German subsidiaries (represented by Direct Line Insurance S.p.A and Direct Line Versicherung AG respectively) on 29 May 2015, which was treated as discontinued operations, generating a gain on disposal of £167.1 million.
A) Discontinued operations The following table analyses performance relating to the discontinued operations for the period from 1 January to disposal on 29 May 2015.
2015
£m
Gross written premium 261.1Gross earned premium 207.2Reinsurance premium (78.8)Net earned premium 128.4Investment return1 37.1Instalment income 1.4Other operating income 0.1Total income 167.0Insurance claims (156.2)Insurance claims recoverable from reinsurers 60.9Net insurance claims (95.3)Commission expenses (28.0)Operating expenses (10.2)Total expenses (38.2)Operating profit from discontinued operations 33.5Gain on disposal of discontinued operations 167.1Profit before tax from discontinued operations 200.6Tax charge (19.4)Profit after tax from discontinued operations 181.2Underwriting loss (5.1)Loss ratio 74.2%Commission ratio 21.8%Expense ratio 8.0%COR 104.0%
Note: 1. Realised net gains on AFS investments in 2015 included £29.9 million of gains reclassified through the income statement, on disposal of International.
The following table analyses the other comprehensive loss relating to discontinued operations, included in the consolidated statement of comprehensive income for the period from 1 January to disposal on 29 May 2015.
2015
£m
Items that may be reclassified subsequently to income statement: Exchange differences on the translation of foreign operations 14.4 Cash flow hedge (1.2)Fair value gain on AFS investments 0.6 Less: realised net gains on AFS investments included in income statement (31.8)Tax relating to items that may be reclassified 10.1 Other comprehensive loss for the year net of tax (7.9)

www.directlinegroup.com 153
Strategic reportG
overnanceFinancial statem
ents
www.directlinegroup.com 153
The following table analyses the cash flows relating to the discontinued operations included in the consolidated cash flow statement for the period 1 January to disposal on 29 May 2015.
2015
£m
Net cash generated from operating activities 19.1Net cash used by investing activities (1.5)Net cash generated from the disposal of discontinued operations1 327.1Effect of foreign exchange rate changes (9.8)Net increase in cash and cash equivalents 334.9
Note: 1. The net cash generated from the disposal of discontinued operations comprises the net cash consideration of £422.5 million less the cash held by the German
and Italian subsidiaries at the point of sale of £95.4 million.
B) Disposal group The following table analyses the gain on disposal of discontinued operations during the year including the assets and liabilities held for sale in the disposal group immediately prior to the disposal on 29 May 2015.
29 May 2015
£m
Assets Intangible assets 5.4Property, plant and equipment 5.2Reinsurance assets 171.0Deferred tax assets 41.9Current tax assets –Deferred acquisition costs 105.5Insurance and other receivables 152.3Prepayments and accrued income 3.1Financial investments 665.5Cash and cash equivalents 95.4Total assets 1,245.3Liabilities Insurance liabilities 504.5Unearned premium reserve 355.0Trade and other payables including insurance payables 125.3Deferred tax liabilities 32.0Current tax liabilities 4.0Total liabilities 1,020.8Net assets 224.5Cash consideration received1 438.1Transaction costs (15.6)Net cash consideration 422.5Net assets disposed (224.5)Currency translation reserve reclassified to the income statement (30.9)Gain on disposal of discontinued operations 167.1
Note: 1. The Group entered into a foreign currency hedge converting Euro into Sterling in September 2014 for the disposal proceeds. The foreign currency hedge gain of
£34.0 million and other sale-related consideration are included in cash consideration received.

Direct Line Group Annual Report & Accounts 2016154
Notes to the consolidated financial statements continued
Direct Line Group Annual Report & Accounts 2016 154
6. Net earned premium
2016
£m 20151
£m
Gross earned premium: Gross written premium 3,274.1 3,152.5Movement in unearned premium reserve (71.3) (42.4)
3,202.8 3,110.1Reinsurance premium:
Premium payable (206.2) (191.7)Movement in reinsurance unearned premium reserve 4.0 2.5
(202.2) (189.2)Total 3,000.6 2,920.9
Note: 1. Results for the year ended 31 December 2015 are based on continuing operations and exclude discontinued operations.
7. Investment return
2016
£m 20151
£m
Investment income: Interest income from debt securities 136.5 140.1Cash and cash equivalent interest income 4.2 6.7Interest income from infrastructure debt 7.8 4.4Interest income from commercial real estate loans 1.0 –Interest income 149.5 151.2Rental income from investment property 18.4 17.9
167.9 169.1Net realised gains / (losses):
AFS debt securities 15.3 12.4Derivatives (282.3) (56.5)Investment property (note 20) 1.3 –
(265.7) (44.1)Net unrealised gains:
Derivatives 265.2 48.9Investment property (note 20) 4.1 24.2
269.3 73.1Total 171.5 198.1
Note: 1. Results for the year ended 31 December 2015 are based on continuing operations and exclude discontinued operations.
The table below analyses the realised and unrealised gains and losses on derivative instruments included in investment return.
Realised Unrealised Realised Unrealised
2016
£m2016
£m 20151
£m 20151
£m
Derivative (losses) / gains: Foreign exchange forward contracts2 (425.7) 19.1 (82.4) (19.1)Associated foreign exchange risk 151.0 253.0 44.9 61.9Net (losses) / gains on foreign exchange forward contracts (274.7) 272.1 (37.5) 42.8Interest rate swaps2 (16.9) 20.7 (28.7) 1.2Associated interest rate risk on hedged items 9.3 (27.6) 9.7 4.9Net (losses) / gains on interest rate derivatives (7.6) (6.9) (19.0) 6.1Total (282.3) 265.2 (56.5) 48.9
Notes: 1. Results for the year ended 31 December 2015 are based on continuing operations and exclude discontinued operations. 2. Foreign exchange forward contracts are at fair value through the income statement and interest rate swaps are designated as hedging instruments.
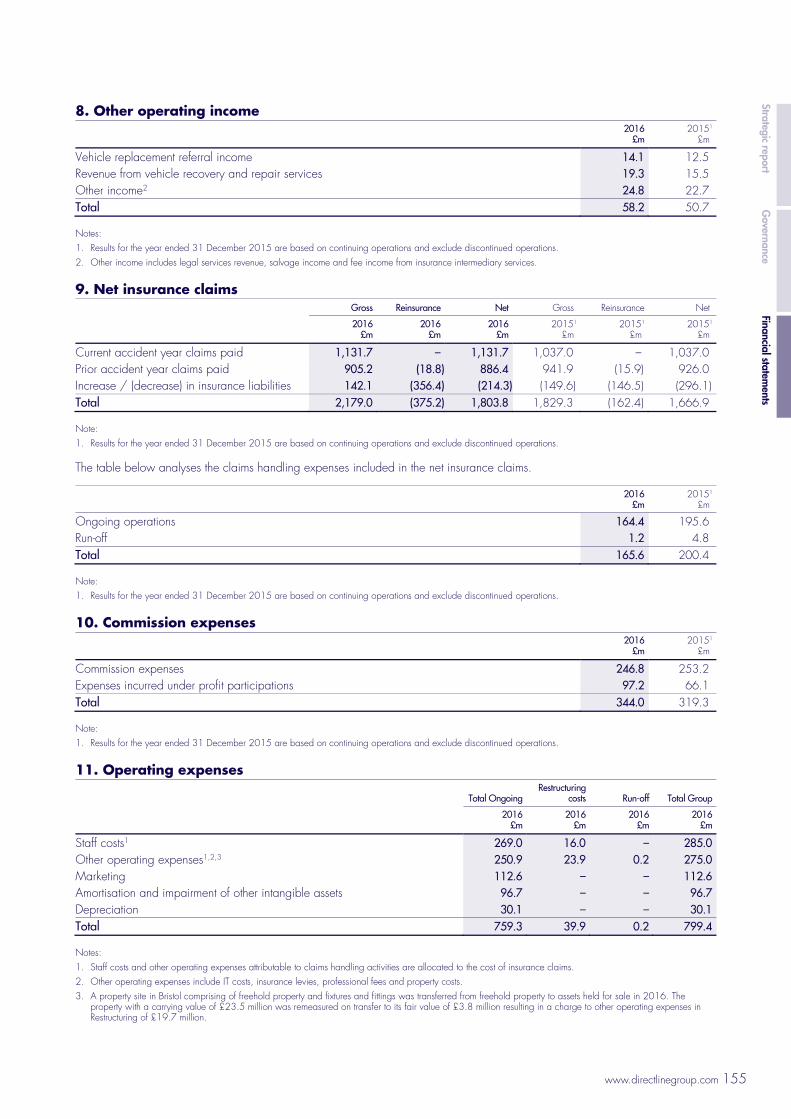
www.directlinegroup.com 155
Strategic reportG
overnanceFinancial statem
ents
www.directlinegroup.com 155
8. Other operating income
2016
£m 20151
£m
Vehicle replacement referral income 14.1 12.5 Revenue from vehicle recovery and repair services 19.3 15.5 Other income2 24.8 22.7 Total 58.2 50.7
Notes: 1. Results for the year ended 31 December 2015 are based on continuing operations and exclude discontinued operations. 2. Other income includes legal services revenue, salvage income and fee income from insurance intermediary services.
9. Net insurance claims Gross Reinsurance Net Gross Reinsurance Net
2016
£m2016
£m2016
£m20151
£m 20151
£m 20151
£m
Current accident year claims paid 1,131.7 – 1,131.7 1,037.0 – 1,037.0 Prior accident year claims paid 905.2 (18.8) 886.4 941.9 (15.9) 926.0 Increase / (decrease) in insurance liabilities 142.1 (356.4) (214.3) (149.6) (146.5) (296.1) Total 2,179.0 (375.2) 1,803.8 1,829.3 (162.4) 1,666.9
Note: 1. Results for the year ended 31 December 2015 are based on continuing operations and exclude discontinued operations.
The table below analyses the claims handling expenses included in the net insurance claims.
2016
£m 20151
£m
Ongoing operations 164.4 195.6 Run-off 1.2 4.8 Total 165.6 200.4
Note: 1. Results for the year ended 31 December 2015 are based on continuing operations and exclude discontinued operations.
10. Commission expenses
2016
£m 20151
£m
Commission expenses 246.8 253.2 Expenses incurred under profit participations 97.2 66.1 Total 344.0 319.3
Note: 1. Results for the year ended 31 December 2015 are based on continuing operations and exclude discontinued operations.
11. Operating expenses
Total OngoingRestructuring
costs Run-off Total Group
2016
£m2016
£m 2016
£m 2016
£m
Staff costs1 269.0 16.0 – 285.0Other operating expenses1,2,3 250.9 23.9 0.2 275.0Marketing 112.6 – – 112.6Amortisation and impairment of other intangible assets 96.7 – – 96.7Depreciation 30.1 – – 30.1Total 759.3 39.9 0.2 799.4
Notes: 1. Staff costs and other operating expenses attributable to claims handling activities are allocated to the cost of insurance claims. 2. Other operating expenses include IT costs, insurance levies, professional fees and property costs. 3. A property site in Bristol comprising of freehold property and fixtures and fittings was transferred from freehold property to assets held for sale in 2016. The
property with a carrying value of £23.5 million was remeasured on transfer to its fair value of £3.8 million resulting in a charge to other operating expenses in Restructuring of £19.7 million.

Direct Line Group Annual Report & Accounts 2016156
Notes to the consolidated financial statements continued
Direct Line Group Annual Report & Accounts 2016 156
11. Operating expenses continued
Total Ongoing
Restructuring and other
one-off costs Run-off Total Group
20151
£m 20151
£m 20151
£m 20151
£m
Staff costs2 254.2 18.7 0.4 273.3 Other operating expenses2,3,4 219.0 30.0 0.2 249.2 Marketing 117.8 – 0.1 117.9 Amortisation and impairment of other intangible assets 67.4 – – 67.4 Depreciation 30.7 – – 30.7 Total 689.1 48.7 0.7 738.5
Notes: 1. Results for the year ended 31 December 2015 are based on continuing operations and exclude discontinued operations. 2. Staff costs and other operating expenses attributable to claims handling activities are allocated to the cost of insurance claims. 3. Other operating expenses include IT costs, insurance levies, professional fees and property costs. 4. The Pudsey sites were transferred from property, plant and equipment to assets held for sales in 2015. The sites with a carrying value of £22.1 million were
remeasured on transfer to their fair value of £5.1 million resulting in a charge to other operating expenses in Restructuring of £17.0 million.
The table below analyses the number of people employed by the Group’s operations.
At 31 December Average for the year
2016 2015 2016 20151
Operations 9,692 9,531 9,546 9,564 Support 1,285 1,190 1,353 1,257 Total 10,977 10,721 10,899 10,821
Notes: 1. Results for the year ended 31 December 2015 are based on continuing operations and exclude discontinued operations. 2. The increase in 2016 headcount relates to the acquisition of additional UK accident repair centres and recruitment of additional DLG Legal Services Limited
employees.
The aggregate remuneration of those employed by the Group’s operations comprised:
2016
£m 20151
£m
Wages and salaries 348.1 335.4 Social security costs 38.9 37.8 Pension costs 24.4 23.4 Share-based payments 16.8 12.1 Total 428.2 408.7
Note: 1. Results for the year ended 31 December 2015 are based on continuing operations and exclude discontinued operations.
The table below analyses auditor’s remuneration in respect of the Group’s operations.
2016
£m 20151
£m
Fees payable for the audit of: The Company’s annual accounts 0.3 0.3 The Company’s subsidiaries 1.5 1.6
Total audit fees 1.8 1.9 Fees payable for non-audit services:
Audit-related assurance services 0.2 0.3 Other services 0.2 0.6
Total non-audit services 0.4 0.9 Total 2.2 2.8
Note: 1. Results for the year ended 31 December 2015 are based on continuing operations and exclude discontinued operations.

www.directlinegroup.com 157
Strategic reportG
overnanceFinancial statem
ents
www.directlinegroup.com 157
Aggregate Directors’ emoluments The table below analyses the total amount of Directors’ remuneration, all of which is in relation to continuing operations, in accordance with Schedule 5 to the Accounting Regulations.
2016
£m 2015
£m
Salaries, fees, bonuses and benefits in kind 3.1 3.5Gains on exercise of share options 3.5 4.9Defined contribution pension scheme contributions – 0.1Total 6.6 8.5
Further information about the remuneration of individual Directors is provided in the Directors’ remuneration report.
At 31 December 2016, one Director (2015: one) had retirement benefits accruing under the defined contribution pension scheme in respect of qualifying service. During the year ended 31 December 2016, one Director exercised share options (2015: two).
12. Finance costs
2016
£m 20151
£m
Interest expense on subordinated liabilities 46.3 46.3 Net interest received on designated hedging instrument2 (8.0) (8.0) Unrealised (gain) / loss on designated hedging instrument2 (19.6) 4.5 Unrealised loss / (gain) on associated interest rate risk on hedged item2 17.8 (5.9) Amortisation of arrangement costs and discount on issue of subordinated liabilities 0.7 0.7 Total 37.2 37.6
Notes: 1. Results for the year ended 31 December 2015 are based on continuing operations and exclude discontinued operations. 2. As described in note 31, on 27 April 2012 the Group issued subordinated guaranteed dated notes with a nominal value of £500 million at a fixed rate of
9.25%. On the same date, the Group also entered into a 10-year designated hedging instrument to exchange the fixed rate of interest on the notes for a floating rate of three-month LIBOR plus a spread of 706 basis points, which increased to 707 basis points with effect from 29 July 2013.
13. Tax charge
2016
£m 20151
£m
Current taxation: Charge for the year 84.4 103.5 Over provision in respect of prior year2 (7.7) (4.6)
76.7 98.9 Deferred taxation (note 14):
(Credit) / charge for the year (5.1) 6.4 Under provision in respect of prior year 2.6 3.0
(2.5) 9.4 Current taxation 76.7 98.9 Deferred taxation (note 14) (2.5) 9.4 Tax charge for the year 74.2 108.3
Notes: 1. Results for the year ended 31 December 2015 are based on continuing operations and exclude discontinued operations. 2. The prior year current tax credit for the year ended 31 December 2016 includes £5.6 million relating to retrospective claims for research and development
tax relief.

Direct Line Group Annual Report & Accounts 2016158
Notes to the consolidated financial statements continued
Direct Line Group Annual Report & Accounts 2016 158
13. Tax charge continued
The following table analyses the difference between the actual income tax charge and the expected income tax charge computed by applying the standard rate of corporation tax of 20.0%1 (2015: 20.25%).
2016
£m 20152
£m
Profit before tax 353.0 507.5 Expected tax charge 70.6 102.8 Effects of:
Disallowable expenses 9.7 7.8 Effect of change in corporation taxation rate (1.0) (0.7) Over provision in respect of prior year (5.1) (1.6)
Tax charge for the year 74.2 108.3 Effective income tax rate 21.0% 21.3%
Notes: 1. In the Finance Act 2013 the UK Government enacted a reduction in the UK corporation tax rate from 21% to 20% effective from 1 April 2015. The Finance
(No 2) Act 2015 enacted further reductions to 19% effective from 1 April 2017 and 18% effective from 1 April 2020. The Finance Act 2016 then enacted a further reduction to 17% effective from the 1 April 2020. As a consequence, the closing deferred tax assets and liabilities have been recognised at the tax rates expected to apply when the assets or liabilities are settled. The impact of these changes on the tax charge for the year is set out in the table above.
2. Results for the year ended 31 December 2015 are based on continuing operations and exclude discontinued operations.
14. Current and deferred tax
. 2016
£m 2015
£m
Per balance sheet: Current tax assets 0.1 0.1Current tax liabilities (0.5) (10.3)Deferred tax liabilities (46.0) (29.9)
The table below analyses the major deferred tax assets and liabilities recognised by the Group and movements thereon.
Provisions and other temporary differences
£m
Retirement benefit
obligations£m
Depreciationin excess of
capital allowances
£m
Non- distributable
reserve1
£m
Investmentproperties
£m
Share-based payments
£m
AFS revaluation
reserve £m
Total£m
At 1 January 2015 5.4 (0.7) 0.8 (25.0) (4.8) 3.7 – (20.6)(Charge) / credit to the income statement on continuing operations (2.1) (0.1) – (3.9) (3.6) 0.3 – (9.4)Charge to other comprehensive income – (1.6) – – – – – (1.6)Credit direct to equity – – – – – 1.7 – 1.7At 31 December 2015 3.3 (2.4) 0.8 (28.9) (8.4) 5.7 – (29.9)(Charge) / credit to the income statement on continuing operations (0.7) (0.4) (1.8) 5.5 0.2 (0.3) – 2.5Charge to other comprehensive income – 0.7 – – – – (18.0) (17.3)Credit direct to equity – – – – – (1.3) – (1.3)At 31 December 2016 2.6 (2.1) (1.0) (23.4) (8.2) 4.1 (18.0) (46.0)
Note: 1. The non-distributable reserve was a statutory claims equalisation reserve calculated in accordance with the rules of the PRA. With the introduction of Solvency II on
1 January 2016, the requirement to maintain this reserve ceased and the balance at 31 December 2015 was released to retained earnings. The taxation of this release is spread over six years from the change in regulation. This is provided for in deferred tax above as it represents the future unwind of previously claimed tax deductions for transfers into this reserve.
In addition, the Group has an unrecognised deferred tax asset at 31 December 2016 of £7.5 million (2015: £4.1 million) in relation to capital losses of which £4.1 million (2015: £1.0 million) relates to realised losses and £3.4 million (2015: £3.1 million) relates to unrealised losses.

www.directlinegroup.com 159
Strategic reportG
overnanceFinancial statem
ents
www.directlinegroup.com 159
15. Dividends
2016
£m 2015
£m
Amounts recognised as distributions to equity holders in the period: 2015 final dividend of 9.2p per share paid on 19 May 2016 126.0 –2014 final dividend1 of 8.8 pence per share paid on 17 April 2015 – 131.62016 first interim dividend of 4.9 pence per share paid on 9 September 2016 67.1 –2015 first interim dividend of 4.6 pence per share paid on 11 September 2015 – 63.02016 first special interim dividend of 10.0 pence per share paid on 9 September 2016 136.9 –2015 first special interim dividend of 27.5 pence per share paid on 24 July 2015 – 411.52015 second special interim dividend of 8.8p per share paid on 19 May 2016 120.6 –2014 second special interim dividend of 4.0 pence per share paid on 17 April 2015 – 59.9
450.6 666.0Proposed dividends:
2016 final dividend of 9.7 pence per share 133.4 –2015 final dividend of 9.2 pence per share – 126.52015 second special interim dividend of 8.8 pence per share – 121.0
Note: 1. The Board paid an interim dividend in lieu of a final dividend.
The proposed final dividend for 2016 has not been included as a liability in these financial statements.
The trustees of the employee share trusts waived their entitlement to dividends on shares held to meet obligations arising on the Long Term Incentive Plan, Deferred Annual Incentive Plan and Restrictive Share Plan awards, which reduced the total dividend paid for the year ended 31 December 2016 by £1.8 million (2015: £1.7 million).
16. Earnings per share Earnings per share is calculated by dividing earnings attributable to the owners of the Company by the weighted average number of Ordinary Shares during the year.
On 30 June 2015, the Group completed an 11 for 12 share consolidation which had the effect of reducing the number of shares in issue from 1,500 million Ordinary Shares of 10 pence each to 1,375 million new Ordinary Shares of 10 10/11 pence each. The weighted average number of Ordinary Shares used in calculating basic and diluted earnings per share for the year ended 31 December 2015 reflects this share consolidation.
Basic Basic earnings per share is calculated by dividing the earnings attributable to the owners of the Company by the weighted average number of Ordinary Shares for the purposes of basic earnings per share during the period, excluding Ordinary Shares held as employee trust shares.
2016
£m 2015
£m
Earnings attributable to owners of the Company arising from: Continuing operations 278.8 399.2Discontinued operations – 181.2Total Group 278.8 580.4Weighted average number of Ordinary Shares (millions) 1,368.7 1,431.2Basic earnings per share (pence): Continuing operations 20.4 27.9Discontinued operations – 12.7Total Group 20.4 40.6

Direct Line Group Annual Report & Accounts 2016160
Notes to the consolidated financial statements continued
Direct Line Group Annual Report & Accounts 2016 160
16. Earnings per share continued Diluted Diluted earnings per share is calculated by dividing the earnings attributable to the owners of the Company by the weighted average number of Ordinary Shares during the period adjusted for dilutive potential Ordinary Shares. The Company has share options and contingently issuable shares as categories of dilutive potential Ordinary Shares.
2016
£m 2015
£m
Earnings attributable to owners of the Company arising from: Continuing operations 278.8 399.2Discontinued operations – 181.2Total Group 278.8 580.4Weighted average number of Ordinary Shares (millions) 1,368.7 1,431.2Effect of dilutive potential of share options and contingently issuable shares (millions) 13.1 17.8Weighted average number of Ordinary Shares for the purpose of diluted earnings per share (millions) 1,381.8 1,449.0Diluted earnings per share (pence): Continuing operations 20.2 27.6Discontinued operations – 12.5Total Group 20.2 40.1
17. Net assets per share and return on equity Net asset value per share is calculated as total shareholders’ equity divided by the number of Ordinary Shares at the end of the period excluding shares held by employee share trusts.
Tangible net asset value per share is calculated as total shareholders’ equity less goodwill and other intangible assets divided by the number of Ordinary Shares at the end of the period excluding shares held by employee share trusts.
The table below analyses net asset and tangible net asset value per share.
At 31 December 2016
£m 2015
£m
Net assets 2,521.5 2,630.0Goodwill and other intangible assets (508.9) (524.8)Tangible net assets 2,012.6 2,105.2Number of Ordinary Shares (millions) 1,375.0 1,375.0Shares held by employee share trusts (millions) (9.9) (6.3)Closing number of Ordinary Shares (millions) 1,365.1 1,368.7Net asset value per share (pence) 184.7 192.2Tangible net asset value per share (pence) 147.4 153.8
Return on equity The table below details the calculation of return on equity.
2016
£m 2015
£m
Earnings attributable to owners of the Company arising from: Continuing operations 278.8 399.2Discontinued operations – 181.2Total Group 278.8 580.4Opening shareholders’ equity 2,630.0 2,810.5Closing shareholders’ equity 2,521.5 2,630.0Average shareholders’ equity 2,575.8 2,720.2Return on equity 10.8% 21.3%

www.directlinegroup.com 161
Strategic reportG
overnanceFinancial statem
ents
www.directlinegroup.com 161
18. Goodwill and other intangible assets
Goodwill £m
Other intangible
assets £m
Total£m
Cost At 1 January 2015 211.0 428.5 639.5Acquisitions and additions – 74.7 74.7Disposals and write-off1 – (8.0) (8.0)At 31 December 2015 211.0 495.2 706.2Acquisitions and additions 0.3 80.5 80.8Disposals and write-off1 – (5.8) (5.8)At 31 December 2016 211.3 569.9 781.2
Accumulated amortisation and impairment At 1 January 2015 – 122.0 122.0Charge for the year relating to continuing operations – 63.1 63.1Disposals and write-off1 – (8.0) (8.0)Impairment losses – 4.3 4.3At 31 December 2015 – 181.4 181.4Charge for the year – 57.4 57.4Disposals and write-off1 – (5.8) (5.8)Impairment losses2 – 39.3 39.3At 31 December 2016 – 272.3 272.3
Carrying amount
At 31 December 2016 211.3 297.6 508.9
At 31 December 2015 211.0 313.8 524.8
Notes: 1. Disposals and write-off include fully amortised intangible assets no longer utilised by the Group in its operating activities. 2. The impairment losses relate to capitalised software development costs for ongoing IT projects primarily relating to development of new systems. The impairment
losses result from a review of the projected benefits and the charge which reduced the carrying value of impaired assets to £nil, is reflected in the Motor segment.
Goodwill arose on the acquisition of U K Insurance Limited (£141.0 million) and Churchill Insurance Company Limited (£70.0 million), which is allocated across Motor, Home, Rescue and other personal lines and Commercial. The addition to goodwill in the year ended 31 December 2016 of £0.3m arose on acquisition of two accident repair centres with a combined purchase price of £3.6 million which was allocated to Motor.
The Group’s testing for goodwill impairment includes the comparison of the recoverable amount of each CGU to which goodwill has been allocated with its carrying value and updated at each reporting date in the event of indications of impairment.

Direct Line Group Annual Report & Accounts 2016162
Notes to the consolidated financial statements continued
Direct Line Group Annual Report & Accounts 2016 162
18. Goodwill and other intangible assets continued The table below analyses the goodwill of the Group by CGU.
2016
£m 2015
£m
Motor 126.7 126.4Home 45.8 45.8Rescue and other personal lines 28.7 28.7Commercial 10.1 10.1Total 211.3 211.0
There have been no impairments in goodwill for the year ended 31 December 2016 (2015: £nil).
The recoverable amount is the higher of the CGU fair value less the costs to sell and its value-in-use. Value-in-use is the present value of expected future cash flows from the CGU. Fair value is the estimated amount that could be obtained from the sale of the CGU in an arm’s length transaction between knowledgeable and willing parties.
The recoverable amounts of all CGUs were based on the value-in-use test, using the Group’s five-year strategic plan. The long-term growth rates have been based on GDP rates adjusted for inflation. The risk discount rates incorporate observable market long-term government bond yields and average industry betas adjusted for an appropriate risk premium based on independent analysis.
The table below details the recoverable amounts in excess of carrying value for the CGUs where goodwill is held.
AssumptionsSensitivity: Impact on
recoverable amount of a:
CGU
Terminalgrowth
rate%
Pre-tax discount
rate%
Recoverableamount in excess of carrying value
£m
1% decrease in terminal growth
rate £m
1% increase in pre-tax discount
rate £m
1% decrease in forecast
pre-tax profit1£m
Motor 3.0 11.6 686.0 (189.9) (260.5) (24.8) Home 3.0 11.6 667.9 (66.6) (68.2) (9.0) Rescue and other personal lines 3.0 11.6 611.6 (56.6) (76.9) (6.9) Commercial 3.0 11.6 374.1 (62.1) (84.5) (7.6)
Note: 1. Reflects a 1% decrease in the profit for each year of the five-year plan.

www.directlinegroup.com 163
Strategic reportG
overnanceFinancial statem
ents
www.directlinegroup.com 163
19. Property, plant and equipment Freehold land and buildings
£m
Other equipment
£m Total£m
Cost At 1 January 2015 83.8 154.3 238.1Additions 17.9 49.2 67.1Disposals (0.1) (15.7) (15.8)Transfer to assets held for sale (note 28) (22.6) – (22.6)At 31 December 2015 79.0 187.8 266.8Additions 18.8 31.1 49.9Disposals – (14.3) (14.3)Transfer to assets held for sale (note 28) (18.0) (8.3) (26.3)At 31 December 2016 79.8 196.3 276.1
Accumulated depreciation and impairment At 1 January 2015 1.7 55.1 56.8Depreciation charge for the year relating to continuing operations 1.2 29.5 30.7Disposals – (11.3) (11.3)Impairment losses – 4.8 4.8Transfer to assets held for sale (note 28) (0.5) – (0.5)At 31 December 2015 2.4 78.1 80.5Depreciation charge for the year 1.0 29.1 30.1Disposals – (12.6) (12.6)Transfer to assets held for sale (note 28) (0.3) (2.5) (2.8)At 31 December 2016 3.1 92.1 95.2
Carrying amount
At 31 December 2016 76.7 104.2 180.9
At 31 December 2015 76.6 109.7 186.3
The Group is satisfied that the aggregate value of property, plant and equipment is not less than its carrying value.
20. Investment property
2016
£m 2015
£m
At 1 January 347.4 307.2Additions at cost 1.4 16.0Increase in fair value during the year 5.4 24.2Disposals (25.2) – At 31 December 329.0 347.4
Note: 1. The cost included in carrying value at 31 December 2016 is £275.3 million (2015: £295.5 million).
The investment properties are measured at fair value derived from valuation work carried out at the balance sheet date by independent property valuers.
The valuation conforms to international valuation standards. The fair value was determined using a methodology based on recent market transactions for similar properties, which have been adjusted for the specific characteristics of each property within the portfolio. This approach to valuation is consistent with the methodology used in the year ended 31 December 2015.
Lease agreements with tenants are drawn up in line with local practice and the Group has no exposure to leases that include contingent rents.

Direct Line Group Annual Report & Accounts 2016164
Notes to the consolidated financial statements continued
Direct Line Group Annual Report & Accounts 2016 164
21. Subsidiaries The principal subsidiary undertakings of the Group, over which it exercises 100% voting power, are shown below. Their capital consists of Ordinary Shares which are unlisted. All subsidiaries (a full list of which is included in note 2 of the Company financial statements) are included in the Group’s consolidated financial information.
Name of subsidiary Place of incorporation and operation Principal activity
DL Insurance Services Limited United Kingdom Management services U K Insurance Limited United Kingdom General insurance
On 29 May 2015, the Group completed the sale of its International business comprising Direct Line Insurance S.p.A and Direct Line Versicherung AG for a cash consideration of £438.1 million. Details of the fair value of assets and liabilities disposed of and the gain on disposal are set out in note 5B.
The Group did not dispose of any other subsidiaries in the years ended 31 December 2016 and 31 December 2015.
22. Reinsurance assets 2016
£m 2015
£m
Reinsurers’ share of general insurance liabilities 1,329.0 975.8Impairment provision (50.7) (53.9) 1,278.3 921.9Reinsurers’ unearned premium reserve 93.5 89.5Total 1,371.8 1,011.4
Movements in reinsurance asset impairment provision 2016
£m 2015
£m
At 1 January (53.9) (66.4)Additional provision (4.2) (5.0)Release to income statement 7.4 17.5At 31 December (50.7) (53.9)
23. Deferred acquisition costs 2016
£m 2015
£m
At 1 January 203.8 208.4Net decrease in the year (0.7) (4.6)At 31 December 203.1 203.8
24. Insurance and other receivables 2016
£m 2015
£m
Receivables arising from insurance contracts: Due from policyholders 820.8 800.1Impairment provision of policyholder receivables (0.3) (0.7)Due from agents, brokers and intermediaries 66.4 60.0Impairment provision of agent, broker and intermediary receivables (1.0) (1.3)
Other debtors 102.4 97.7Total 988.3 955.8

www.directlinegroup.com 165
Strategic reportG
overnanceFinancial statem
ents
www.directlinegroup.com 165
25. Derivative financial instruments
2016
£m 2015
£m
Derivative assets At fair value through the income statement: Foreign exchange contracts (forwards) 21.4 0.4Designated as hedging instruments: Foreign exchange contracts (forwards)1 1.7 0.3Interest rate swaps 56.6 18.9Total 79.7 19.6Derivative liabilities At fair value through the income statement: Foreign exchange contracts (forwards) 43.5 42.2Designated as hedging instruments: Foreign exchange contracts (forwards)1 – 0.1Interest rate swaps 1.6 4.1Total 45.1 46.4
Note: 1. Cash flow hedges in relation to supplier payments.
26. Financial investments
2016
£m 2015
£m
AFS debt securities Corporate 4,183.7 4,182.4Supranational 98.6 140.1Local government 21.7 105.3Sovereign 341.2 442.7Securitised credit – 356.1Total 4,645.2 5,226.6HTM debt securities Corporate 85.1 13.5Total debt securities 4,730.3 5,240.1Total debt securities Fixed interest rate1 4,709.6 4,801.6Floating interest rate 20.7 438.5Total 4,730.3 5,240.1Loans and receivables Deposits with credit institutions with maturities in excess of three months – 44.9Infrastructure debt 337.0 329.6Commercial real estate loans 79.7 –Total 5,147.0 5,614.6
Note: 1. The Group swaps a fixed interest rate for a floating rate of interest on its US Dollar, Euro and a small amount of its Sterling corporate debt securities by entering
into interest rate derivatives. The hedged amount at 31 December 2016 was £1,593.6 million (2015: £1,283.3 million).

Direct Line Group Annual Report & Accounts 2016166
Notes to the consolidated financial statements continued
Direct Line Group Annual Report & Accounts 2016 166
27. Cash and cash equivalents and borrowings
2016
£m 2015
£m
Cash at bank and in hand 166.6 131.8Short-term deposits with credit institutions1 999.5 831.9Cash and cash equivalents 1,166.1 963.7Bank overdrafts2 (55.3) (61.3)Cash and bank overdrafts3 1,110.8 902.4
Notes: 1. This represents money market funds with no notice period for withdrawal. 2. Bank overdrafts represent short-term timing differences between transactions posted in the records of the Group transactions flowing through the accounts
at the bank. 3. Cash and bank overdrafts is included for the purposes of the consolidated cash flow statement.
The effective interest rate on short-term deposits with credit institutions for the year ended 31 December 2016 was 0.45% (2015: 0.56%) and average maturity was 10 days (2015: 10 days).
28. Assets held for sale
2016
£m 2015
£m
Freehold property held for sale1 3.8 5.1
Note: 1. The freehold property held for sale at 31 December 2016 is a site in Bristol which was transferred from property, plant and equipment to AFS in 2016 with a
carrying value of £23.5 million and impaired by £19.7 million to reflect the costs of remediation and estimated realisable value. The freehold property held for sale at 31 December 2015 comprising the sites at Pudsey were sold in the year releasing the carrying value.
29. Share capital
2016NumberMillions
2015 Number Millions
2016£m
2015£m
Issued and fully paid: equity shares Ordinary Shares of 10 10/11 pence each 1,375 1,375 150.0 150.0
At a General Meeting on 29 June 2015, shareholders approved a share consolidation which completed on 30 June 2015. As a result of the share consolidation, shareholders held 11 new Ordinary Shares of 10 10/11 pence each issued by the Company in exchange for every 12 Ordinary Shares of 10 pence each held immediately prior to the share consolidation, which were cancelled by the Company.
Employee trust shares The Group satisfies share-based payments under the Group’s share plans primarily through shares purchased in the market and held by employee share trusts.
At 31 December 2016, 9,946,340 Ordinary Shares (2015: 6,256,108 Ordinary Shares) were owned by the employee share trusts with a cost of £34.3 million (2015: £20.4 million). These Ordinary Shares are carried at cost and have a market value of £36.7 million (2015: £25.5 million).
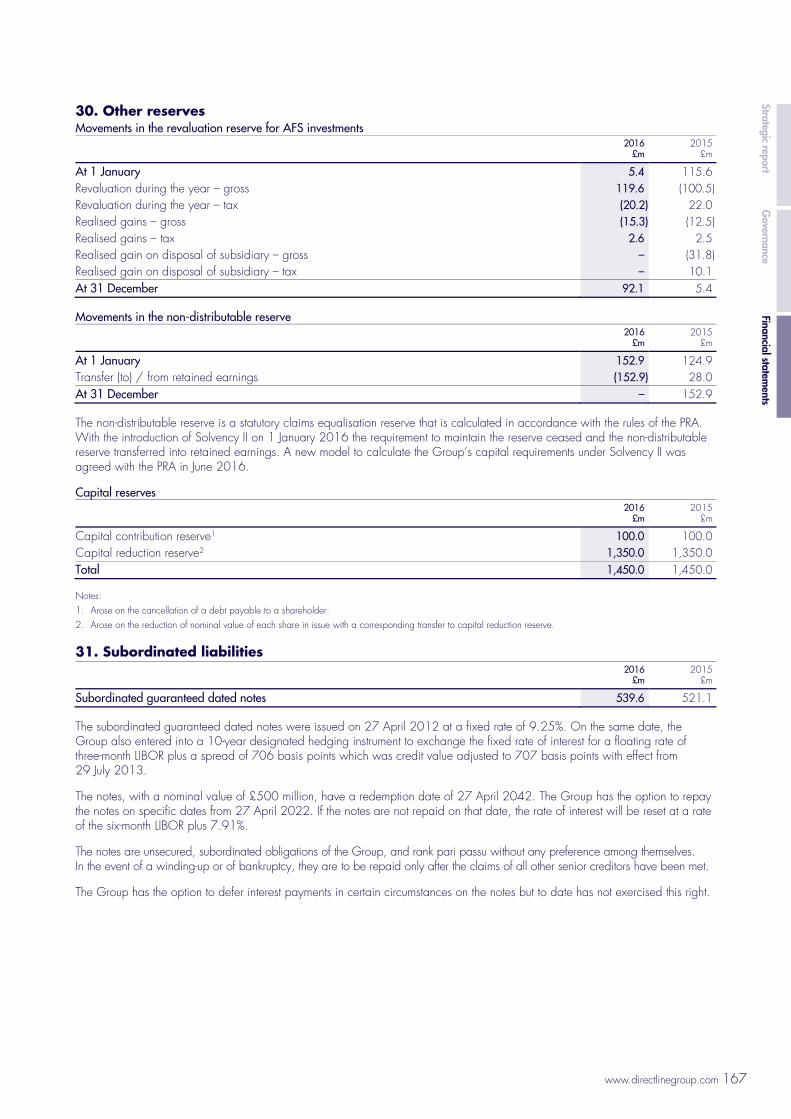
www.directlinegroup.com 167
Strategic reportG
overnanceFinancial statem
ents
www.directlinegroup.com 167
30. Other reserves Movements in the revaluation reserve for AFS investments
2016
£m 2015
£m
At 1 January 5.4 115.6Revaluation during the year – gross 119.6 (100.5)Revaluation during the year – tax (20.2) 22.0Realised gains – gross (15.3) (12.5)Realised gains – tax 2.6 2.5Realised gain on disposal of subsidiary – gross – (31.8)Realised gain on disposal of subsidiary – tax – 10.1At 31 December 92.1 5.4
Movements in the non-distributable reserve
2016
£m 2015
£m
At 1 January 152.9 124.9Transfer (to) / from retained earnings (152.9) 28.0At 31 December – 152.9
The non-distributable reserve is a statutory claims equalisation reserve that is calculated in accordance with the rules of the PRA. With the introduction of Solvency II on 1 January 2016 the requirement to maintain the reserve ceased and the non-distributable reserve transferred into retained earnings. A new model to calculate the Group’s capital requirements under Solvency II was agreed with the PRA in June 2016.
Capital reserves
2016
£m 2015
£m
Capital contribution reserve1 100.0 100.0Capital reduction reserve2 1,350.0 1,350.0Total 1,450.0 1,450.0
Notes: 1. Arose on the cancellation of a debt payable to a shareholder. 2. Arose on the reduction of nominal value of each share in issue with a corresponding transfer to capital reduction reserve.
31. Subordinated liabilities
2016
£m 2015
£m
Subordinated guaranteed dated notes 539.6 521.1
The subordinated guaranteed dated notes were issued on 27 April 2012 at a fixed rate of 9.25%. On the same date, the Group also entered into a 10-year designated hedging instrument to exchange the fixed rate of interest for a floating rate of three-month LIBOR plus a spread of 706 basis points which was credit value adjusted to 707 basis points with effect from 29 July 2013.
The notes, with a nominal value of £500 million, have a redemption date of 27 April 2042. The Group has the option to repay the notes on specific dates from 27 April 2022. If the notes are not repaid on that date, the rate of interest will be reset at a rate of the six-month LIBOR plus 7.91%.
The notes are unsecured, subordinated obligations of the Group, and rank pari passu without any preference among themselves. In the event of a winding-up or of bankruptcy, they are to be repaid only after the claims of all other senior creditors have been met.
The Group has the option to defer interest payments in certain circumstances on the notes but to date has not exercised this right.

Direct Line Group Annual Report & Accounts 2016168
Notes to the consolidated financial statements continued
Direct Line Group Annual Report & Accounts 2016 168
32. Insurance liabilities
2016
£m 2015
£m
Insurance liabilities 4,666.6 4,524.5
Gross insurance liabilities
Accident year 2007
£m 2008
£m 2009
£m 2010
£m2011
£m2012
£m2013
£m2014
£m 2015
£m 2016
£mTotal£m
Estimate of ultimate gross claims costs:
At end of accident year 4,014.7 3,393.4 3,823.3 3,941.7 2,698.1 2,372.7 2,184.0 2,094.5 2,118.1 2,157.7One year later (44.7) 50.8 121.6 (117.1) (99.3) (163.3) (117.6) 20.7 (30.0) Two years later 7.8 51.7 (37.0) (99.1) (94.6) (118.9) (153.0) (38.4) Three years later 64.8 (36.7) (14.0) (50.3) (89.3) (49.3) (21.0) Four years later (5.4) (16.7) (101.5) (105.5) (60.9) (9.9) Five years later (12.1) (55.5) (38.8) (57.7) (21.2) Six years later (24.4) (45.7) (80.8) (25.9) Seven years later (18.8) (29.9) (27.3) Eight years later (14.4) (16.2) Nine years later 0.5
Current estimate of cumulative claims 3,968.0 3,295.2 3,645.5 3,486.1 2,332.8 2,031.3 1,892.4 2,076.8 2,088.1 2,157.7Cumulative payments to date (3,770.5) (3,178.8) (3,463.0) (3,279.1) (2,134.6) (1,813.0) (1,552.7) (1,451.3) (1,360.7) (1,019.4)Gross liability recognised in balance sheet 197.5 116.4 182.5 207.0 198.2 218.3 339.7 625.5 727.4 1,138.3 3,950.8
2006 and prior 636.5Claims handling provision 79.3Total 4,666.6
Net insurance liabilities
Accident year 2007
£m 2008
£m 2009
£m 2010
£m2011
£m2012
£m2013
£m2014
£m 2015
£m 2016
£mTotal£m
Estimate of ultimate net claims costs:
At end of accident year 3,970.3 3,334.7 3,790.6 3,902.0 2,644.4 2,271.8 2,093.9 1,971.0 1,926.7 1,922.2One year later (64.3) 52.0 70.0 (125.2) (131.5) (146.7) (123.6) (29.7) (67.0) Two years later (14.5) 15.9 (17.4) (120.4) (82.1) (107.8) (134.4) (42.0) Three years later 32.9 (22.8) (54.1) (44.0) (76.5) (35.6) (27.8) Four years later (8.9) (45.8) (67.0) (93.6) (48.7) (11.6) Five years later (17.6) (48.7) (29.6) (52.3) (37.3) Six years later (19.6) (30.9) (74.6) (43.9) Seven years later (16.0) (24.5) (38.2) Eight years later (12.5) (16.2) Nine years later (7.5)
Current estimate of cumulative claims 3,842.3 3,213.7 3,579.7 3,422.6 2,268.3 1,970.1 1,808.1 1,899.3 1,859.7 1,922.2Cumulative payments to date (3,705.2) (3,139.0) (3,429.8) (3,264.4) (2,111.2) (1,800.7) (1,537.1) (1,449.7) (1,358.7) (1,019.4)Net liability recognised in balance sheet 137.1 74.7 149.9 158.2 157.1 169.4 271.0 449.6 501.0 902.8 2,970.8
2006 and prior 338.2Claims handling provision 79.3Total 3,388.3

www.directlinegroup.com 169
Strategic reportG
overnanceFinancial statem
ents
www.directlinegroup.com 169
Movements in gross and net insurance liabilities
Gross
£m Reinsurance
£m Net£m
Claims reported 2,791.1 (315.3) 2,475.8Incurred but not reported 1,778.2 (460.2) 1,318.0Claims handling provision 104.8 – 104.8At 1 January 2015 4,674.1 (775.5) 3,898.6Cash paid for claims settled in the year (1,978.9) 16.0 (1,962.9)Increase / (decrease) in liabilities:
Arising from current-year claims 2,307.6 (191.4) 2,116.2Arising from prior-year claims (478.3) 29.0 (449.3)
At 31 December 2015 4,524.5 (921.9) 3,602.6Claims reported 2,732.2 (375.0) 2,357.2Incurred but not reported 1,697.9 (546.9) 1,151.0Claims handling provision 94.4 – 94.4At 31 December 2015 4,524.5 (921.9) 3,602.6Cash paid for claims settled in the year (2,036.9) 18.8 (2,018.1)Increase / (decrease) in liabilities: Arising from current-year claims 2,329.3 (235.4) 2,093.9Arising from prior-year claims (150.3) (139.8) (290.1)At 31 December 2016 4,666.6 (1,278.3) 3,388.3
Claims reported 2,584.5 (388.3) 2,196.2Incurred but not reported 2,002.8 (890.0) 1,112.8Claims handling provision 79.3 – 79.3At 31 December 2016 4,666.6 (1,278.3) 3,388.3
Movement in prior-year net claims liabilities by operating segment
2016
£m 2015
£m
Motor (123.5) (266.8)Home (75.9) (41.9)Rescue and other personal lines (17.5) (13.6)Commercial (49.8) (56.6)Total Ongoing (266.7) (378.9)Run-off (23.4) (70.4)Total (290.1) (449.3)
33. Unearned premium reserve Movement in unearned premium reserve
Gross
£m Reinsurance
£m Net£m
At 1 January 2015 1,434.2 (87.0) 1,347.2Net movement in the year 42.4 (2.5) 39.9At 31 December 2015 1,476.6 (89.5) 1,387.1Net movement in the year 71.3 (4.0) 67.3At 31 December 2016 1,547.9 (93.5) 1,454.4

Direct Line Group Annual Report & Accounts 2016170
Notes to the consolidated financial statements continued
Direct Line Group Annual Report & Accounts 2016 170
34. Retirement benefit obligations Defined contribution scheme The pension charge in respect of the defined contribution scheme for the year ended 31 December 2016 was £24.9 million (2015: £23.5 million).
Defined benefit scheme The Group’s defined benefit pension scheme was closed in 2003 although the Group remains the sponsoring employer for obligations to current and deferred pensioners based on qualifying years’ service and final salaries. The defined benefit scheme is legally separated from the Group with trustees who are required by law to act in the interests of the scheme and of all the relevant stakeholders. The trustees of the pension scheme are responsible for the investment policy with regard to the assets of the scheme.
The weighted average duration of the defined benefit obligations at 31 December 2016 is 20 years (2015: 20 years) using accounting assumptions.
The table below sets out the principal assumptions used in determining the defined benefit scheme obligations.
2016
% 2015
%
Rate of increase in pension payment 2.2 2.1Rate of increase of deferred pensions 2.2 2.1Discount rate 2.7 3.8Inflation rate 3.3 3.2
No assumption has been made for salary growth as there are no obligations in the scheme that are linked to future increases in salaries.
Post-retirement mortality assumptions 2016 2015
Life expectancy at age 60 now: Males 88.1 87.8Females 90.1 89.9
Life expectancy at age 60 in 20 years’ time: Males 90.3 90.1Females 92.5 92.3
The table below analyses the fair value of the scheme assets by type of asset.
2016
£m 2015
£m
Index-linked bonds 28.6 21.5Government bonds 16.9 13.7Corporate bonds – 43.8Liquidity fund1 56.3 5.5Other 0.7 0.6Total 102.5 85.1
Note: 1. The liquidity fund is an investment in an open ended fund incorporated in the Republic of Ireland which targets capital stability and income in the UK. It is invested
in short-term fixed income and variable rate securities (such as Treasury Bills) listed or traded on one or more recognised exchange.
The majority of debt and equity instruments held directly or through the liquidity fund have quoted prices on active markets.

www.directlinegroup.com 171
Strategic reportG
overnanceFinancial statem
ents
www.directlinegroup.com 171
Movement in net pension surplus
Fair value of defined benefit scheme assets
£m
Present value of defined benefit
scheme obligations
£m
Net pension surplus
£m
At 1 January 2015 83.1 (79.6) 3.5Income statement:
Net interest income / (cost)1 2.8 (2.7) 0.1Statement of comprehensive income:
Actuarial gains arising from experience adjustments (1.9) 1.2 (0.7)Actuarial gains arising from changes in demographic assumptions – 1.1 1.1Actuarial gains arising from changes in financial assumptions – 6.3 6.3
Contributions by employer 2.8 – 2.8Benefits paid (1.7) 1.7 –At 31 December 2015 85.1 (72.0) 13.1Income statement:
Net interest income / (cost)1 3.2 (2.7) 0.5Statement of comprehensive income:
Actuarial gains arising from experience adjustments 13.7 1.2 14.9Actuarial losses arising from changes in financial assumptions – (19.3) (19.3)
Contributions by employer 2.8 – 2.8Benefits paid (2.3) 2.3 –At 31 December 2016 102.5 (90.5) 12.0
Note: 1. The net interest income / (cost) in the income statement has been included under other operating expenses.
The table below details the history of the scheme for the current and prior years.
2016
£m2015
£m2014
£m 2013
£m 2012
£m
Present value of defined benefit scheme obligations (90.5) (72.0) (79.6) (68.0) (61.2)Fair value of defined benefit scheme assets 102.5 85.1 83.1 66.0 63.7Net surplus / (deficit) 12.0 13.1 3.5 (2.0) 2.5Experience adjustment gains / (losses) on scheme liabilities 1.2 1.2 1.0 (0.2) (0.1)Experience adjustment gains / (losses) on scheme assets 13.7 (1.9) 12.9 (1.3) 2.2

Direct Line Group Annual Report & Accounts 2016172
Notes to the consolidated financial statements continued
Direct Line Group Annual Report & Accounts 2016 172
34. Retirement benefit obligations continued Sensitivity analysis The table below provides a sensitivity analysis of the potential impact of a change in a single factor with all other assumptions left unchanged. Other potential risks beyond the ones described in the table could have an additional financial impact on the Group. This sensitivity analysis has been selected to reflect the changes to discounted cash flows as a result of changes to the discount rate, inflation rate and mortality assumptions. The methodology adopted involves actuarial techniques.
Impact on pension cost
Impact on present value of defined benefit
scheme obligations
2016
£m2015
£m 2016
£m 2015
£m
Discount rate 0.25% increase in discount rate (0.2) (0.2) (4.7) (3.7)0.25% decrease in discount rate 0.1 0.2 4.7 3.7Inflation rate 0.25% increase in inflation rate – – 2.3 1.70.25% decrease in inflation rate – – (2.3) (1.7)Life expectancy 1 year increase in life expectancy 0.1 0.1 2.7 2.01 year decrease in life expectancy (0.1) (0.1) (2.7) (2.0)
The most recent funding valuation of the defined benefit scheme took place as at 1 October 2014. The Group agreed with the trustees to make a contribution of £2.8 million in 2016 with further contributions of up to £1.5 million per annum in 2017 and 2018 to meet the scheme’s funding requirements. As a result of the latest funding update no contribution is expected to be payable in 2017.
35. Share-based payments The Group operates equity-settled, share-based compensation plans in the form of an LTIP, a Restricted Shares Plan, a DAIP and Direct Line Group Share Incentive Plans, including both the Free Share awards and a Buy-As-You-Earn Plan, details of which are set out below. All awards are to be satisfied using market purchased shares.
Long-Term Incentive Plan Executive Directors and certain members of senior management are eligible to participate in the LTIP with awards granted in the form of nil-cost options. Under the plan, the shares vest at the end of a three-year period dependent upon the continued employment by the Group and also the Group achieving predefined performance conditions associated with TSR and RoTE.
Awards were made in the year ended 31 December 2016 over 3.3 million Ordinary Shares with an estimated fair value of £12.4 million at the 2016 grant dates (2015: 3.4 million Ordinary Shares with an estimated fair value of £11.4 million).
The estimated fair value of the LTIP share awards with market-based performance conditions was calculated using a Monte-Carlo simulation model.
The table below details the inputs into the model.
2016 2015
Weighted average assumptions during the year: Share price (pence) 368 339Exercise price (pence) 0 0Volatility of share price 18% 20%Average comparator volatility 29% 27%Expected life 3 years 3 yearsRisk-free rate 0.3% 0.8%
Expected volatility was determined by considering the actual volatility of the Group’s share price since its initial public offering and that of a group of listed UK insurance companies.
Plan participants are entitled to receive additional shares in respect of dividends paid to shareholders over the vesting period. Therefore no deduction has been made from the fair value of awards in respect of dividends.
Expected life was based on the contractual life of the awards and adjusted based on management’s best estimate, for the effects of exercise restrictions and behavioural considerations.

www.directlinegroup.com 173
Strategic reportG
overnanceFinancial statem
ents
www.directlinegroup.com 173
Restricted Shares Plan The purpose of the Restricted Shares Plan is to facilitate the wider participation in Group share-based awards to eligible employees. These awards can be granted at any time during the year, generally have no performance criteria, and vest over periods ranging between one and three years from the date of the grant, subject to continued employment. During the year awards were made over 0.3 million Ordinary Shares (2015: 0.0 million Ordinary Shares) with an estimated fair value of £0.9 million (2015: £0.1 million) using the market value at the date of grant.
Deferred Annual Incentive Plan To incentivise delivery of performance over a one-year operating cycle, Executive Directors and certain members of senior management are eligible for awards under the Annual Incentive Plan, of which at least 40% is granted in the form of a nil-cost option under the DAIP with the remainder being settled in cash following year end. During the year awards were made over 1.0 million Ordinary Shares (2015: 1.0 million Ordinary Shares) under this plan with an estimated fair value of £3.7 million (2015: £3.4 million) using the market value at the date of grant.
The awards outstanding at 31 December 2016 have no performance criteria attached, other than the requirement that the employee remains in employment with the Group for three years from the date of grant.
Direct Line Group Share Incentive Plans: Free Share awards In 2016, the Group offered all eligible UK employees a Free Share award granting 71 Ordinary Shares (2015: 122 Ordinary Shares) free of charge. These awards have no performance criteria attached and vest on the third anniversary of the award grant date, subject to completion of three years, continuing employment. The Group initially granted 0.8 million Ordinary Shares (2015: 1.3 million) with an estimated fair value of £2.8 million (2015: £4.2 million) using the market value at the date of grant.
Direct Line Group Share Incentive Plans: Buy-As-You-Earn Plan The Buy-As-You-Earn Plan entitles employees to purchase shares from pre-tax pay for between £10 and £150 per month and receive one matching share for every two shares purchased.
In the year ended 31 December 2016, matching share awards were granted over 0.4 million Ordinary Shares (2015: 0.3 million Ordinary Shares) with an estimated fair value of £1.3 million (2015: £1.1 million). The fair value of each matching share award is estimated using the market value at the date of grant.
Under the plan, the shares vest at the end of a three-year period dependent upon the continued employment with the Group together with continued ownership of the associated purchased shares up to the point of vesting.
Movement in total share awards
Number of share awards
millions 2016
Number of share awards
millions2015
At 1 January 17.2 16.4Granted during the year1 7.7 6.8Impact of share consolidation (see note 29) – (1.6)Forfeited during the year (0.8) (1.5)Exercised during the year (6.0) (2.9)At 31 December 18.1 17.2Exercisable at 31 December 2.6 1.6
Note: 1. In accordance with the rules of the LTIP and DAIP award plans, additional awards of 1.9 million shares were granted during the year ended 31 December 2016
(2015: 0.8 million) in respect of the equivalent dividend.
In respect of the outstanding options at 31 December 2016, the weighted average remaining contractual life is 1.39 years (2015: 1.44 years). No share awards expired during the year (2015: nil).
The weighted average share price for awards exercised during the year ended 31 December 2016 was £3.68 (2015: £3.95).
The Group recognised total expenses in the year ended 31 December 2016 of £16.8 million (2015: £12.1 million) relating to equity-settled share-based compensation plans.
Further information on share-based payments, in respect of Directors, is provided in the Directors’ remuneration report.

Direct Line Group Annual Report & Accounts 2016174
Notes to the consolidated financial statements continued
Direct Line Group Annual Report & Accounts 2016 174
36. Trade and other payables including insurance payables
2016
£m 2015
£m
Due to agents, brokers and intermediaries 15.5 22.5Due to reinsurers 84.1 78.9Due to insurance companies 4.4 4.7Trade creditors and accruals 334.7 295.5Other creditors 98.4 98.8Other taxes 93.0 78.9Provisions 64.8 73.1Deferred income 4.3 4.1Total 699.2 656.5
Movement in provisions during the year
Regulatory levies
£mRestructuring
£m Other
£m Total
£m
At 1 January 2016 27.2 9.0 36.9 73.1Additional provision 34.4 9.8 27.2 71.4Utilisation of provision (33.4) (4.9) (29.3) (67.6)Released to income statement – (3.8) (8.3) (12.1)At 31 December 2016 28.2 10.1 26.5 64.8.

www.directlinegroup.com 175
Strategic reportG
overnanceFinancial statem
ents
www.directlinegroup.com 175
37. Notes to the consolidated cash flow statement
2016
£m 2015
£m
Profit for the year 278.8 580.4Adjustments for:
Investment return (171.5) (235.2)Instalment income (107.1) (101.5)Finance costs 37.2 37.6Defined benefit pension scheme – net interest income (0.5) –Equity-settled share-based payment charge 16.8 12.1Tax charge 74.2 127.7Depreciation and amortisation charges 87.5 95.3Impairment of property, plant and equipment, goodwill and intangible assets 39.3 9.1Impairment provision movements on reinsurance contracts (3.2) (12.5)Impairment charge on assets held for sale – freehold property 19.7 12.9Gain on disposal of discontinued operations – (167.1)Loss on sale of property, plant and equipment 1.7 4.7
Operating cash flows before movements in working capital 272.9 363.5Movements in working capital:
Net decrease in net insurance liabilities including reinsurance assets, unearned premium reserves and deferred acquisition costs (143.1) (194.5)Net increase in prepayments and accrued income and other assets (20.1) (2.8)Net increase in insurance and other receivables (32.5) (66.4)Net increase in trade and other payables including insurance payables 42.7 52.3Contribution to defined benefit pension scheme (2.8) (2.8)
Cash generated from operations 117.1 149.3Taxes paid (83.3) (107.4)Cash flow hedges 1.2 0.2Net cash generated from operating activities before investment of insurance assets 35.0 42.1Interest received 294.6 318.7Rental income received from investment property 18.4 17.9Purchases of investment property (1.4) (16.0)Proceeds on disposal of investment property 25.2 –Proceeds on disposal / maturity of AFS debt securities 2,489.9 3,549.3Net decrease in financial investments: loans and receivables to credit institutions 44.9 9.8Advances made for Infrastructure debt and commercial real estate loans (97.7) (268.9)Repayments of infrastructure debt 11.0 16.6Purchases of AFS debt securities (1,886.5) (3,110.8)Purchase of HTM debt securities / commercial real estate loans (71.0) (13.5)Cash generated from investment of insurance assets 827.4 503.1
38. Contingent liabilities The Group did not have any contingent liabilities at 31 December 2016 (2015: none).
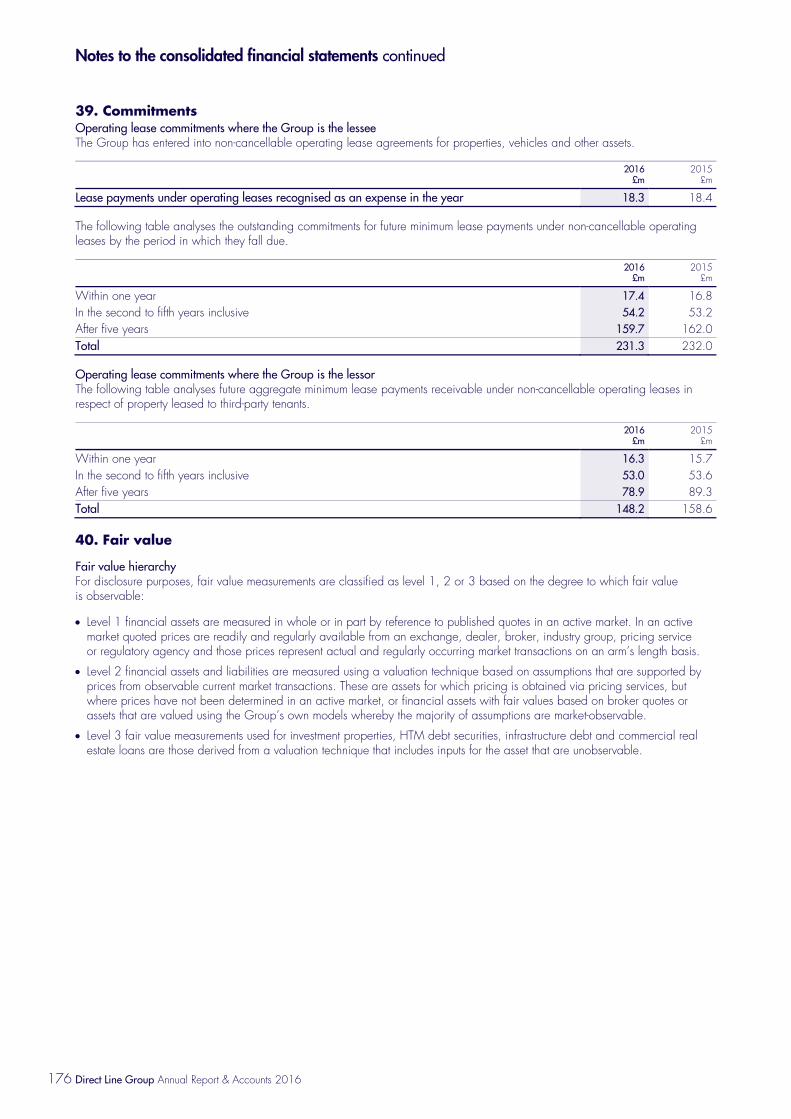
Direct Line Group Annual Report & Accounts 2016176
Notes to the consolidated financial statements continued
Direct Line Group Annual Report & Accounts 2016 176
39. Commitments Operating lease commitments where the Group is the lessee The Group has entered into non-cancellable operating lease agreements for properties, vehicles and other assets.
2016
£m 2015
£m
Lease payments under operating leases recognised as an expense in the year 18.3 18.4
The following table analyses the outstanding commitments for future minimum lease payments under non-cancellable operating leases by the period in which they fall due.
2016
£m 2015
£m
Within one year 17.4 16.8In the second to fifth years inclusive 54.2 53.2After five years 159.7 162.0Total 231.3 232.0
Operating lease commitments where the Group is the lessor The following table analyses future aggregate minimum lease payments receivable under non-cancellable operating leases in respect of property leased to third-party tenants.
2016
£m 2015
£m
Within one year 16.3 15.7In the second to fifth years inclusive 53.0 53.6After five years 78.9 89.3Total 148.2 158.6
40. Fair value
Fair value hierarchy For disclosure purposes, fair value measurements are classified as level 1, 2 or 3 based on the degree to which fair value is observable:
Level 1 financial assets are measured in whole or in part by reference to published quotes in an active market. In an active market quoted prices are readily and regularly available from an exchange, dealer, broker, industry group, pricing service or regulatory agency and those prices represent actual and regularly occurring market transactions on an arm’s length basis.
Level 2 financial assets and liabilities are measured using a valuation technique based on assumptions that are supported by prices from observable current market transactions. These are assets for which pricing is obtained via pricing services, but where prices have not been determined in an active market, or financial assets with fair values based on broker quotes or assets that are valued using the Group’s own models whereby the majority of assumptions are market-observable.
Level 3 fair value measurements used for investment properties, HTM debt securities, infrastructure debt and commercial real estate loans are those derived from a valuation technique that includes inputs for the asset that are unobservable.

www.directlinegroup.com 177
Strategic reportG
overnanceFinancial statem
ents
www.directlinegroup.com 177
Comparison of carrying value to fair value of financial instruments and assets carried at fair value The following table compares the carrying value and the fair value of financial instruments and other assets where the Group discloses a fair value.
At 31 December 2016 Carrying value
£mLevel 1
£mLevel 2
£m Level 3
£m Fair Value
£m
Assets held at fair value: Investment property (note 20) 329.0 – – 329.0 329.0Derivative assets (note 25) 79.7 – 79.7 – 79.7AFS debt securities (note 26) 4,645.2 341.2 4,304.0 – 4,645.2Other financial assets: HTM debt securities (note 26) 85.1 – 13.6 74.6 88.2Infrastructure debt (note 26) 337.0 – – 339.2 339.2Commercial real estate loans (note 26) 79.7 – – 79.8 79.8Total assets 5,555.7 341.2 4,397.3 822.6 5,561.1
Liabilities held at fair value: Derivative liabilities (note 25) 45.1 – 45.1 – 45.1Other financial liabilities: Subordinated liabilities (note 31) 539.6 – 625.0 – 625.0Total liabilities 584.7 – 670.1 – 670.1
At 31 December 2015 Carrying value
£mLevel 1
£mLevel 2
£m Level 3
£m Fair Value
£m
Assets held at fair value: Investment property (note 20) 347.4 – – 347.4 347.4Derivative assets (note 25) 19.6 – 19.6 – 19.6AFS debt securities (note 26) 5,226.6 442.7 4,783.9 – 5,226.6Other financial assets: HTM debt securities (note 26) 13.5 – – 12.7 12.7Deposits with credit institutions > three months (note 26) 44.9 – – 44.9 44.9Infrastructure debt (note 26) 329.6 – – 322.2 322.2Total assets 5,981.6 442.7 4,803.5 727.2 5,973.4Liabilities held at fair value: Derivative liabilities (note 25) 46.4 – 46.4 – 46.4Other financial liabilities: Subordinated liabilities (note 31) 521.1 – 623.2 – 623.2Total liabilities 567.5 – 669.6 – 669.6
Differences arise between carrying value and fair value where the measurement basis of the asset or liability is not fair value (e.g. assets and liabilities carried at amortised cost). Fair values of the following assets and liabilities approximate their carrying values:
Insurance and other receivables;
Cash and cash equivalents;
Borrowings; and
Trade and other payables including insurance payables (excluding provisions)
The movements in assets held at fair value and classified as level 3 in the fair value hierarchy are all within Investment property and are analysed in note 20. There were no changes in the categorisation of assets between levels 1, 2 and 3 during the year for assets and liabilities held at 31 December 2015.

Direct Line Group Annual Report & Accounts 2016178
Notes to the consolidated financial statements continued
Direct Line Group Annual Report & Accounts 2016 178
41. Related parties Transactions between the Group’s subsidiary undertakings, which are related parties, have been eliminated on consolidation and accordingly are not disclosed.
There were no sales and purchases of products and services to or from related parties in the year ended 31 December 2016 (2015: £nil).
Year end balances arising from sales and purchases of products and services to and from related parties Amounts owed by related parties Amounts owed to related parties
2016
£m2015
£m 2016
£m 2015
£m
Total1 0.2 0.2 – –
Note: 1. This balance relates to an amount recoverable from RBS Group plc, the Group’s former parent company.
Movement in amounts owed by and to related parties Amounts owed by related parties Amounts owed to related parties
2016
£m2015
£m 2016
£m 2015
£m
At 1 January 0.2 0.2 – 25.4Settled in the year – – – (25.4)At 31 December 0.2 0.2 – –
Compensation of key management
2016
£m 2015
£m
Short-term employee benefits 8.4 9.5Post-employment benefits – 0.2Termination benefits 0.1 –Share-based payments 7.6 4.5Total 16.1 14.2
42. Post balance sheet events The 2016 results reflect a one-off Ogden discount rate reduction to minus 0.75% impacting operating profit and profit before tax resulting from an announcement made by the Ministry of Justice on 27 February 2017.

www.directlinegroup.com 179
Strategic reportG
overnanceFinancial statem
ents
Parent Company balance sheet As at 31 December 2016
www.directlinegroup.com 179
Notes
2016 £m
2015 £m
Assets Investment in subsidiary undertakings 2 3,084.3 3,067.4Other receivables 3 571.4 540.8Current tax assets 4 0.8 –Derivative financial instruments 5 1.7 0.4Financial investments 6 134.8 7.1Cash and cash equivalents 7 157.5 29.8Total assets 3,950.5 3,645.5 Equity 3,437.5 3,131.6 Liabilities Subordinated liabilities 9 504.5 503.9Derivative financial instruments 5 1.7 0.4Trade and other payables 10 6.4 6.6Deferred tax liabilities 4 0.4 –Current tax liabilities 4 – 3.0Total liabilities 513.0 513.9Total equity and liabilities 3,950.5 3,645.5
The attached notes on pages 182 to 186 form an integral part of these separate financial statements.
The financial statements were approved by the Board of Directors and authorised for issue on 6 March 2017. They were signed on its behalf by:
John Reizenstein Chief Financial Officer
Direct Line Insurance Group plc
Registration No. 02280426

Direct Line Group Annual Report & Accounts 2016180
Parent Company statement of comprehensive income For the year ended 31 December 2016
Direct Line Group Annual Report & Accounts 2016 180
2016
£m 2015
£m
Profit for the year 764.9 539.5Other comprehensive income / (loss) Items that may be reclassified subsequently to income statement:
Cash flow hedges – (1.2)Fair value gain on AFS investments 0.5 –Tax relating to items that may be reclassified (0.1) –
Other comprehensive income / (loss) net of tax 0.4 (1.2)Total comprehensive income for the year attributable to owners of the Company 765.3 538.3
Parent Company statement of changes in equity For the year ended 31 December 2016
Note: 1. There are no non-distributable reserves within retained earnings.
The attached notes on pages 182 to 186 form an integral part of these separate financial statements.
Sharecapital
£m
Capital reserves
£m
Share-based paymentreserve
£m
Revaluation reserve
£m
Foreign exchange translation
reserve £m
Retained earnings1
£m
Total shareholder
equity £m
Balance at 1 January 2015 150.0 1,450.0 9.5 – 1.2 1,647.5 3,258.2Total comprehensive income for the year – – – – (1.2) 539.5 538.3Dividends paid – – – – – (666.0) (666.0)Credit to equity for equity-settled share-based payments – – 12.1 – – – 12.1Shares distributed by employee trusts – – (11.0) – – – (11.0)Balance at 31 December 2015 150.0 1,450.0 10.6 – – 1,521.0 3,131.6Total comprehensive income for the year – – – 0.4 – 764.9 765.3Dividends paid – – – – – (450.6) (450.6)Credit to equity for equity-settled share-based payments – – 16.8 – – – 16.8Shares distributed by employee trusts – – (25.6) – – – (25.6)Balance at 31 December 2016 150.0 1,450.0 1.8 0.4 – 1,835.3 3,437.5

www.directlinegroup.com 181
Strategic reportG
overnanceFinancial statem
ents
Parent Company cash flow statement For the year ended 31 December 2016
www.directlinegroup.com 181
Notes 2016
£m 2015
£m
Net cash used by operating activities 12 (5.1) (3.1)Cash flows from investing activities Interest received on loans to subsidiary undertakings 47.6 47.5Interest received on AFS debt securities 4.7 –Dividends received from subsidiary undertakings 780.6 671.0Net increase in loans advanced to subsidiary undertakings (28.8) (21.8)Capital contribution to subsidiary undertakings (16.9) (225.0)Disposal of assets held for sale – 224.3Proceeds on disposal / maturity of AFS debt securities 5.0 –Purchase of AFS debt securities (136.9) (2.0)Net cash generated from investing activities 655.3 694.0Cash flows from financing activities Dividends paid 11 (450.6) (666.0)Purchase of employee trust shares (25.6) –Finance costs (46.3) (46.3)Net cash used by financing activities (522.5) (712.3)Net increase / (decrease) in cash and cash equivalents 127.7 (21.4)Cash and cash equivalents at the beginning of the year 7 29.8 51.2Cash and cash equivalents at the end of the year 7 157.5 29.8
The attached notes on pages 182 to 186 form an integral part of these separate financial statements.

Direct Line Group Annual Report & Accounts 2016182
Notes to the Parent Company financial statements
www.directlinegroup.com 182
1. Accounting policies 1.1 Basis of preparation Direct Line Insurance Group plc, registered in England and Wales (company number 02280426), is the ultimate parent company of the Direct Line Group. The principal activity of the Company is managing its investments in subsidiaries, providing loans to those subsidiaries, raising funds for the Group and the receipt and payment of dividends.
The Company’s financial statements are prepared in accordance with IFRSs as issued by the IASB and are presented in accordance with the Companies Act 2006. In accordance with the exemption permitted under section 408 of the Companies Act 2006, the Company’s income statement and related notes have not been presented in these separate financial statements.
The accounting policies that are used in the preparation of these separate financial statements are consistent with the accounting policies used in the preparation of the consolidated financial statements of Direct Line Insurance Group plc as set out in those financial statements.
The additional accounting policies that are specific to the separate financial statements of the Company are set out below.
1.2 Investment in subsidiaries Investment in subsidiaries is stated at cost less any impairment.
1.3 Dividend income Dividend income from investment in subsidiaries is recognised when the right to receive payment is established.
2. Investment in subsidiary undertakings
2016
£m 2015
£m
At 1 January 3,067.4 3,065.0Additional investment in subsidiary undertakings 16.9 237.0Impairment of subsidiary undertakings – (234.6)At 31 December 3,084.3 3,067.4
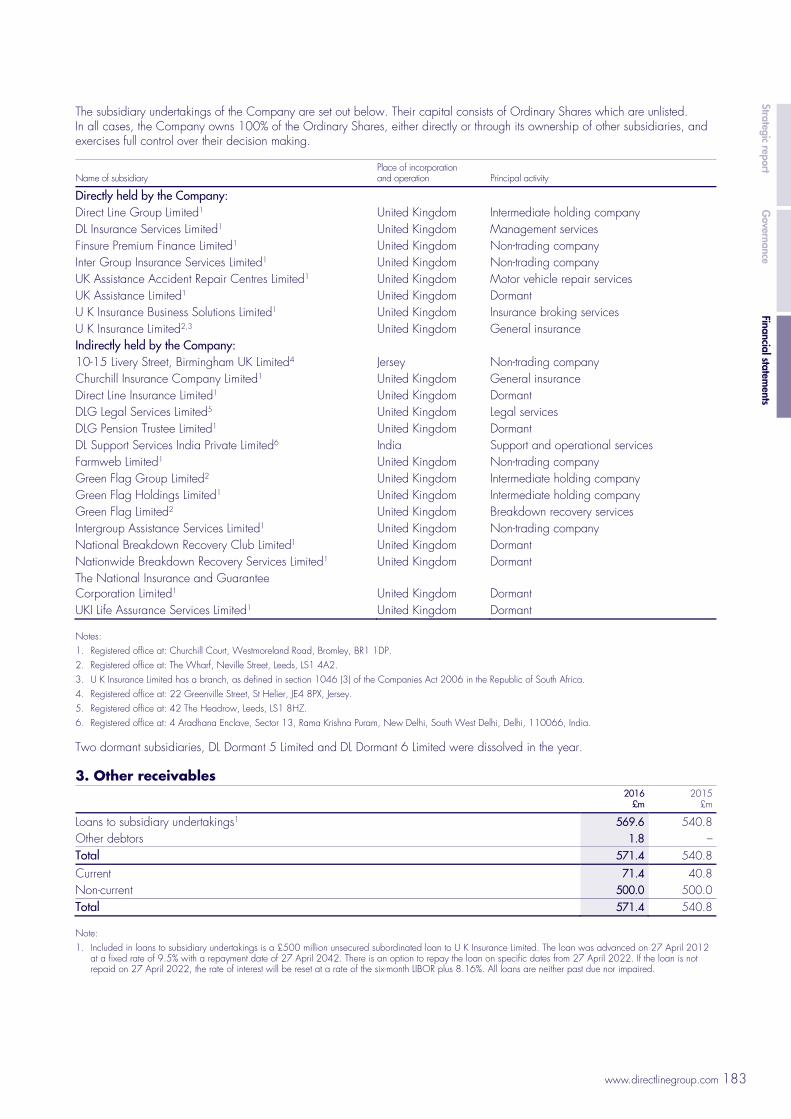
www.directlinegroup.com 183
Strategic reportG
overnanceFinancial statem
ents
www.directlinegroup.com 183
The subsidiary undertakings of the Company are set out below. Their capital consists of Ordinary Shares which are unlisted. In all cases, the Company owns 100% of the Ordinary Shares, either directly or through its ownership of other subsidiaries, and exercises full control over their decision making.
Name of subsidiary Place of incorporation and operation Principal activity
Directly held by the Company: Direct Line Group Limited1 United Kingdom Intermediate holding company DL Insurance Services Limited1 United Kingdom Management services Finsure Premium Finance Limited1 United Kingdom Non-trading company Inter Group Insurance Services Limited1 United Kingdom Non-trading company UK Assistance Accident Repair Centres Limited1 United Kingdom Motor vehicle repair services UK Assistance Limited1 United Kingdom Dormant U K Insurance Business Solutions Limited1 United Kingdom Insurance broking services U K Insurance Limited2,3 United Kingdom General insurance Indirectly held by the Company: 10-15 Livery Street, Birmingham UK Limited4 Jersey Non-trading company Churchill Insurance Company Limited1 United Kingdom General insurance Direct Line Insurance Limited1 United Kingdom Dormant DLG Legal Services Limited5 United Kingdom Legal services DLG Pension Trustee Limited1 United Kingdom Dormant DL Support Services India Private Limited6 India Support and operational services Farmweb Limited1 United Kingdom Non-trading company Green Flag Group Limited2 United Kingdom Intermediate holding company Green Flag Holdings Limited1 United Kingdom Intermediate holding company Green Flag Limited2 United Kingdom Breakdown recovery services Intergroup Assistance Services Limited1 United Kingdom Non-trading company National Breakdown Recovery Club Limited1 United Kingdom Dormant Nationwide Breakdown Recovery Services Limited1 United Kingdom Dormant The National Insurance and Guarantee Corporation Limited1 United Kingdom Dormant UKI Life Assurance Services Limited1 United Kingdom Dormant
Notes: 1. Registered office at: Churchill Court, Westmoreland Road, Bromley, BR1 1DP. 2. Registered office at: The Wharf, Neville Street, Leeds, LS1 4A2. 3. U K Insurance Limited has a branch, as defined in section 1046 (3) of the Companies Act 2006 in the Republic of South Africa. 4. Registered office at: 22 Greenville Street, St Helier, JE4 8PX, Jersey. 5. Registered office at: 42 The Headrow, Leeds, LS1 8HZ. 6. Registered office at: 4 Aradhana Enclave, Sector 13, Rama Krishna Puram, New Delhi, South West Delhi, Delhi, 110066, India.
Two dormant subsidiaries, DL Dormant 5 Limited and DL Dormant 6 Limited were dissolved in the year.
3. Other receivables
2016
£m 2015
£m
Loans to subsidiary undertakings1 569.6 540.8Other debtors 1.8 –Total 571.4 540.8Current 71.4 40.8Non-current 500.0 500.0Total 571.4 540.8
Note: 1. Included in loans to subsidiary undertakings is a £500 million unsecured subordinated loan to U K Insurance Limited. The loan was advanced on 27 April 2012
at a fixed rate of 9.5% with a repayment date of 27 April 2042. There is an option to repay the loan on specific dates from 27 April 2022. If the loan is not repaid on 27 April 2022, the rate of interest will be reset at a rate of the six-month LIBOR plus 8.16%. All loans are neither past due nor impaired.

Direct Line Group Annual Report & Accounts 2016184
Notes to the Parent Company financial statements continued
Direct Line Group Annual Report & Accounts 2016 184
4. Current and deferred tax
2016
£m 2015
£m
Per balance sheet: Current tax assets 0.8 –Current tax liabilities – (3.0)Deferred tax liabilities1 (0.4) –
Note: 1. In the year ended 31 December 2016, deferred tax liabilities of £0.1 million arose on the AFS revaluation reserve and £0.3 million on other temporary timing
differences. Both of these amounts were charged to the statement of comprehensive income. There was no deferred tax asset or liability at 31 December 2015 or movement in the year ended 31 December 2015.
5. Derivative financial instruments Notional amount Fair value Notional amount Fair value
2016
£m2016
£m 2015
£m 2015
£m
Derivative assets Designated as hedging instruments:
Third parties 14.8 1.7 4.6 0.3Subsidiary undertakings – – 0.7 0.1
Total 14.8 1.7 5.3 0.4Derivative liabilities Designated as hedging instruments:
Third parties – – 0.7 0.1Subsidiary undertakings 14.8 1.7 4.6 0.3
Total 14.8 1.7 5.3 0.4
Note: 1. The derivative assets and derivative liabilities are both classified as Level 2 within the Group’s fair value hierarchy set out in note 40 of the consolidated
financial statements.
6. Financial investments
2016
£m 2015
£m
AFS debt securities1 134.8 7.1
Note: 1. The AFS debt securities which are fixed interest UK Sovereign debt are classified as level 1 within the Group’s fair value hierarchy set out in note 40 of the
consolidated financial statements.
7. Cash and cash equivalents
2016
£m 2015
£m
Cash at bank and in hand 0.2 0.1Short-term deposits with credit institutions1 157.3 29.7Total 157.5 29.8
Note: 1. This represents money market funds with no notice period for withdrawal.
8. Share capital and capital reserves Full details of the share capital and capital reserves of the Company are set out in notes 29 and 30 to the consolidated financial statements.

www.directlinegroup.com 185
Strategic reportG
overnanceFinancial statem
ents
www.directlinegroup.com 185
9. Subordinated liabilities
2016
£m 2015
£m
Subordinated guaranteed dated notes 504.5 503.9
The subordinated guaranteed dated notes were issued on 27 April 2012 at a fixed rate of 9.25%. The nominal £500.0 million notes have a redemption date of 27 April 2042. The Company has the option to repay the notes on specific dates from 27 April 2022. If the notes are not repaid on 27 April 2022, the rate of interest will be reset at a rate of the six-month LIBOR plus 7.91%.
The notes are unsecured, subordinated obligations of the Company, and rank pari passu without any preference among themselves. In the event of a winding up or of insolvency, they are to be repaid only after the claims of all other senior creditors have been met.
The notes are guaranteed by U K Insurance Limited, a principal subsidiary of the Company.
The Company has the option, in certain circumstances, to defer interest payments on the notes but to date has not exercised this right.
The aggregate fair value of subordinated guaranteed dated notes at 31 December 2016 was £625.0 million (2015: £623.2 million).
10. Trade and other payables
2016
£m 2015
£m
Payables to subsidiary undertakings 4.7 3.8Payables to third parties 1.7 –Provision – 2.8Total 6.4 6.6
Movement in provision during the year
Total
£m
At 1 January 2016 2.8Utilisation of provision (1.8)Released to statement of comprehensive income (1.0)At 31 December 2016 –
11. Dividends Full details of the dividends paid and proposed by the Company are set out in note 15 to the consolidated financial statements.
12. Cash generated from operations
2016
£m 2015
£m
Profit for the year 764.9 539.5Adjustments for:
Impairment of investment in subsidiary undertakings – 234.6Investment return (829.4) (720.5)Finance costs 46.9 47.1Equity-settled share-based payment charge 16.8 –Gain on disposal of assets held for sale – (109.5)Tax (credit) / charge (0.5) 3.0
Operating cash flows before movements in working capital (1.3) (5.8)Movements in working capital:
Increase in other debtors (1.8) (4.0)Net (decrease) / increase in trade and other payables (0.2) 5.5
Tax (paid) / received (3.0) 1.2Cash flow hedges 1.2 –Cash used by operating activities (5.1) (3.1)

Direct Line Group Annual Report & Accounts 2016186
Notes to the Parent Company financial statements continued
Direct Line Group Annual Report & Accounts 2016 186
13. Related parties Direct Line Insurance Group plc, which is incorporated in England and Wales, is the ultimate parent undertaking of the Direct Line Group of companies.
The following transactions were carried out with related parties:
Sales of services
2016
£m 2015
£m
Interest receivable from subsidiary undertakings 47.9 47.5Dividend income from subsidiary undertakings 780.6 671.0
Interest income from loans to subsidiary undertakings was charged at rates ranging from 0.4% to 9.5% (2015: 0.5% to 9.5%).
Purchases of services
2016
£m 2015
£m
Management fees payable to subsidiary undertakings 18.1 6.0Interest payable to subsidiary undertakings – 0.2
Interest charged on borrowings from related parties in the year ended 31 December 2016 was nil (2015: 0.5% to 0.6%).
14. Share-based payments Full details of share-based compensation plans are provided in note 35 to the consolidated financial statements.
15. Risk management The risks faced by the Company, arising from its investment in subsidiaries, are considered to be the same as those in the operations of the Group. Details of the key risks and the steps taken to manage them are disclosed in note 3 to the consolidated financial statements. The Company also holds, on behalf of its subsidiaries, designated hedging instruments which relate to foreign currency supplier payments.
16. Directors and key management remuneration The Directors and key management of the Group and the Company are the same. The aggregate emoluments of the Directors are set out in note 11 to the consolidated financial statements, the compensation for key management is set out in note 41 to the consolidated financial statements and the remuneration and pension benefits payable in respect of the highest paid Director are included in the Directors’ remuneration report in the Governance section of the Annual Report & Accounts.

www.directlinegroup.com 187
Strategic reportG
overnanceFinancial statem
ents
Additional information
www.directlinegroup.com 187
Corporate website The Group’s corporate website is www.directlinegroup.com. It contains useful information for the Company’s investors and shareholders. For example, it includes press releases, details of forthcoming events, essential shareholder information, a dividend history, a financial calendar, and details of the Company’s AGM. You can also subscribe to email news alerts.
Market The Company has a premium listing on the UK Listing Authority’s Official List. The Company’s Ordinary Shares (EPIC: DLG) are admitted to trading on the London Stock Exchange.
Share ownership Share capital You can find details of the Company’s share capital in note 29 to the consolidated financial statements.
Dividends The Company pays its dividends in Sterling to shareholders registered on its register of members at the relevant record date.
Shareholders can arrange to receive their cash dividend payments in a bank or building society account by completing a dividend mandate form. This is available from the Company’s registrar, Computershare Investor Services PLC (“Registrar”), in the UK. You can find the Registrar’s contact details on page 196. Alternatively, shareholders can access their shareholdings online and download a dividend mandate form from the Investor Centre. You can find details of this below.
Dividend Reinvestment Plan The Company offers a Dividend Reinvestment Plan. This enables shareholders to use their cash dividends to buy the Company’s Ordinary Shares in the market. You can find more details on the Company’s website.
Shareholder enquiries Shareholders with queries about anything relating to their shares can contact our Registrar.
Shareholders should notify the Registrar of any change in shareholding details, such as their address, as soon as possible.
Shareholders can access their current shareholding details online at www.investorcentre.co.uk/directline. Investor Centre is a free-to-use, secure, self-service website that enables shareholders to manage their holdings online. The website allows shareholders to:
check their holdings;
update their records, including address and direct credit details;
access all their securities in one portfolio by setting up a personal account;
vote online; and
register to receive electronic shareholder communications.
To access information, the website requires shareholders to quote their Shareholder Reference Number. Shareholders can find this number on their share certificates.
Shareholder warning Almost five thousand people contact the FCA about share fraud each year – and victims lose an average of £20,000.
Fraudsters use persuasive and high-pressure tactics to lure investors into scams. They may offer to sell shares that prove to be worthless or non-existent. Or they can offer to buy shares at an inflated price in return for you paying upfront. They promise high profits. However, if you buy or sell shares in this way, you will probably lose your money.
How to avoid share fraud Remember that FCA-authorised firms are unlikely to
contact you unexpectedly offering to buy or sell shares
Do not converse with them. Note the name of the person and firm contacting you, then end the call
To see if the person and firm contacting you are authorised by the FCA, check the Financial Services Register at www.fca.org.uk
Beware of fraudsters claiming to be from an authorised firm; copying its website; or giving you false contact details
If you want to phone the caller back, use the firm’s contact details listed on the Financial Services Register at www.fca.org.uk
If the firm does not have contact details on the Register or they tell you the details are out of date, call the FCA on 0800 111 6768
Search the list of unauthorised firms to avoid at www.fca.org.uk/consumers/scams
Remember that if you buy or sell shares from an unauthorised firm, you cannot access the Financial Ombudsman Service or Financial Services Compensation Scheme
Get independent financial and professional advice before handing over any money
If it sounds too good to be true, it probably is
Report a scam If fraudsters approach you, tell the FCA using the share fraud reporting form at www.fca.org.uk/consumers/scams. You can also find out more about investment scams on the same web page.
You can call the FCA Consumer Helpline on 0800 111 6768.
If you have already paid money to share fraudsters, call Action Fraud on 0300 123 2040.

Direct Line Group Annual Report & Accounts 2016188
Additional information continued
188 Direct Line Group Annual Report & Accounts 2016
Tips on protecting your shares Keep all your certificates in a safe place. Alternatively,
consider holding your shares in the UK’s electronic registration and settlement system for equity, called CREST, or via a nominee
Keep correspondence from the Registrar that shows your shareholder reference number in a safe place, and shred unwanted correspondence
Inform the Registrar as soon as you change your address
If you receive a letter from the Registrar regarding a change of address and you have not recently moved, contact them immediately
Find out when your dividends are paid and contact the Registrar if you do not receive them
Consider having your dividends paid direct into your bank account. You will need to complete a dividend mandate form and send it to the Registrar. This reduces the risk of cheques being stolen or lost in the post
If you change your bank account, inform the Registrar of your new account details immediately
If you are buying or selling shares, only deal with brokers registered in the UK or in your country of residence
Be aware that the Company will never call you concerning investments. If you receive such a call from a person saying they represent the Group, please contact the Company Secretary immediately, by calling +44 (0)1132 920 667
Electronic communications and voting The Group produces various communications. Shareholders can view these online, download them, or receive paper copies by contacting the Registrar.
Shareholders, who register their email address with our Registrar, or at the Investor Centre, can receive emails with news on events, such as the AGM. They can also receive shareholder communications electronically, like the Annual Report & Accounts and Notice of Meeting.
Dealing facilities Shareholders who wish to buy, sell or transfer their shares may do so through a stockbroker or a high street bank; or through the Registrar’s share-dealing facility.
You can call or email the Registrar regarding its share-dealing facility using this contact information:
For telephone sales, call +44 (0)370 703 0084 between 8.00 am and 4.30 pm, Monday to Friday, excluding public holidays
For internet sales, go to www.investorcentre.co.uk/directline. You will need your Shareholder Reference Number, as shown on your share certificate, or your welcome letter from the Chairman.
Dividend tax allowance From April 2016, dividend tax credits were replaced by an annual £5,000 tax-free allowance across an individual’s entire share portfolio. Above this amount, individuals will pay tax on their dividend income. The rate of this tax depends on their income tax bracket and personal circumstances. The Company will continue providing registered shareholders with a confirmation of the dividends paid. Shareholders should include this with any other dividend income they receive when calculating and reporting total dividend income received to HMRC. The shareholder is responsible for including all dividend income when calculating tax requirements. If you have any tax queries, please contact your financial adviser.
Financial calendar 2017 Date Event
07 March Preliminary Results 2016 16 March ‘Ex-dividend’ date for 2016 final dividend 17 March Record date for 2016 final dividend 03 May1 Trading update for the first quarter
of 2017 11 May Annual General Meeting 18 May Payment date for 2016 final dividend 01 August1 Half Year Report 2017 10 August1 ‘Ex-dividend’ date for 2017 interim
dividend 11 August1 Record date for 2017 interim dividend 08 September1 Payment date for 2017 interim dividend 07 November1 Trading update for the third quarter of
2017
Annual General Meeting The 2017 AGM will be held on 11 May 2017 at the offices of Allen & Overy LLP, One Bishops Square, London E1 6AD, starting at 11.00 am. All shareholders will receive a separate notice convening the AGM. This will explain the resolutions to be put to the meeting.
Note:
1. These dates are subject to change

www.directlinegroup.com 189
Strategic reportG
overnanceFinancial statem
ents
Glossary and appendices
www.directlinegroup.com 189
Term Definition and explanation
Actuarial best estimate The probability-weighted average of all future claims and cost scenarios. It is calculated using historical data, actuarial methods and judgement. A best estimate of reserves will therefore normally include no margin for optimism or, conversely, caution.
Adjusted diluted earnings per share
Adjusted diluted earnings per share is calculated by dividing the adjusted profit after tax of ongoing operations by the weighted average number of Ordinary Shares during the period adjusted for dilutive potential Ordinary Shares (see page 192 alternative performance measures).
Adjusted profit after tax Profit after tax is adjusted to exclude discontinued operations, the Run-off segment and restructuring and other one-off costs, and is stated after charging tax (using the UK standard tax rate of 20.0%; 2015: 20.25%).
Annual Incentive Plan (“AIP”)
This incentivises the performance of executives and employees over a one-year operating cycle. It focuses on the short to medium-term elements of the Group’s strategic aims.
Available-for-sale (“AFS”) investment
Financial assets that are classified as available-for-sale. Please refer to the accounting policy note 1.12 on page 130.
Buy-As-You-Earn The HM Revenue & Customs approved Buy-As-You-Earn Share Incentive Plan gives all employees the opportunity to become shareholders in the Company.
Capital The funds invested in the Group, including funds invested by shareholders and retained profits. Capital coverage ratio The ratio of Solvency II own funds to the solvency capital requirement. Claims frequency The number of claims divided by the number of policies per year. Claims reserve (provision for losses and loss-adjustment expense)
Funds the Group sets aside to meet the estimated cost of paying claims, and related expenses that the Group considers it will ultimately need to pay.
Clawback The ability of the Company to claim repayment of paid amounts. Combined operating ratio (“COR”)
The sum of the loss, commission and expense ratios. The ratio measures the amount of claims costs, commission and expenses, compared to net earned premium generated. A ratio of less than 100% indicates profitable underwriting.
Commission Payments to brokers, partners and PCWs for generating business. Commission ratio The ratio of commission expense divided by net earned premium. Continuing operations Continuing operations include all activities other than discontinued operations. Current-year attritional loss ratio
The loss ratio for the current accident year, excluding the movement of claims reserves relating to previous accident years, and claims relating to major weather events in the Home division.
Deferred Annual Incentive Plan (“DAIP”)
For Executive Directors, at least 40% of the AIP award is deferred into shares typically vesting three years after grant. The remainder of the award is paid in cash following year-end.
Discontinued operations The Group has sold its International division to Mapfre, S.A. See note 5 to the consolidated financial statements on page 152.
Earnings per share The amount of the Group’s profit allocated to each Ordinary Share of the Company. Employee Representative Body
A forum that represents all employees, including when there is a legal requirement to consult employees.
Expense ratio The ratio of operating expenses divided by net earned premium. Finance costs The cost of servicing the Group’s external borrowings. Financial Conduct Authority (“FCA”)
The independent body that regulates firms and financial advisers. It puts the customers’ interests and market integrity at the core of financial service providers’ activities.
Financial Reporting Council
The UK’s independent regulator responsible for promoting high-quality corporate governance and reporting to foster investment.
Gross written premium The total premiums from contracts that began during the period. International Accounting Standards Board (“IASB”)
A not-for-profit public interest organisation that is overseen by a monitoring board of public authorities. It develops IFRS: standards that aim to make worldwide markets transparent, accountable and efficient.
Incurred but not reported (“IBNR”)
Funds set aside to meet the cost of claims for accidents that have occurred, but have not yet been reported to the Group. This includes an element of uplift on the value of claims reported where the Group has determined that the value currently held in reserves is not sufficient to meet the estimated ultimate costs if the claim is referred to as incurred but not enough reported (“IBNER”).
In-force policies The number of policies on a given date that are active, and against which the Group will pay, following a valid insurance claim.
Insurance liabilities This comprises insurance claims reserves and claims handling provision, which the Group maintains to meet current and future claims.
Investment income yield The income earned from the investment portfolio, recognised through the income statement during the period, and divided by the average AUM. This excludes unrealised and realised gains and losses, impairments, and fair-value adjustments. The average AUM derives from the period’s opening and closing balances for the total Group.

Direct Line Group Annual Report & Accounts 2016190
Glossary and appendices continued
190 Direct Line Group Annual Report & Accounts 2016
Term Definition and explanation
Investment return The income earned from the investment portfolio, including unrealised and realised gains and losses, impairments, and fair value adjustments.
Investment return yield The return earned from the investment portfolio, recognised through the income statement during the period divided by the average AUM. This includes unrealised and realised gains and losses, impairments, and fair-value adjustments. The average AUM derives from the period’s opening and closing balances (see page 193 alternative performance measures).
Loss ratio Net insurance claims divided by net earned premium. Long-Term Incentive Plan (“LTIP”)
Awards made as nil-cost options or conditional share awards, which vest to the extent that performance conditions are satisfied after a period of at least three years.
Malus
An arrangement that permits unvested remuneration awards to be forfeited, when the Company considers it appropriate.
Net asset value The net asset value of the Group is calculated by subtracting total liabilities from total assets. Net claims The cost of claims incurred in the period less any claims costs recovered under reinsurance contracts.
It includes claims payments and movements in claims reserves. Net earned premium The element of gross earned premium less reinsurance premium ceded for the period where
insurance cover has already been provided. Ogden discount rate The discount rate set by the relevant government bodies, the Lord Chancellor and Scottish Ministers.
Bodily injury cases use them to calculate lump-sum awards. Ongoing operations Ongoing operations comprise Direct Line Group’s ongoing divisions: Motor, Home, Rescue and
other personal lines, and Commercial. It excludes discontinued operations, the Run-off segment, and restructuring and other one-off costs.
Operating profit The pre-tax profit that the Group’s activities generate, including insurance and investment activity, but excluding finance costs.
Own Risk and Solvency Assessment (“ORSA”)
A Solvency II requirement. It documents the Group’s insurance underwriting entities’ risks and associated capital requirement, both now and projected over the business planning period. It is forward looking, reflecting business strategy and risk appetite.
Periodic payment order (“PPO”)
These are claims payments as awarded under the Courts Act 2003. PPOs are used to settle large personal injury claims. They generally provide a lump-sum award plus inflation-linked annual payments to claimants who require long-term care.
Prudential Regulation Authority (“PRA”)
The PRA is a part of the Bank of England. It is responsible for regulating and supervising insurers and financial institutions in the UK.
RBS Group The Royal Bank of Scotland Group plc and its subsidiary companies. Reinsurance Contractual arrangements where the Group transfers part or all of the accepted insurance risk
to another insurer. Reserves Funds that have been set aside to meet outstanding insurance claims and IBNR. Return on equity Return on equity is calculated by dividing the profit attributable to the owners of the Company
by average ordinary shareholders’ equity for the period. Return on tangible equity (“RoTE”)
Return on tangible equity for 2016 is adjusted profit after tax from Ongoing operations, divided by the Group’s average shareholders’ equity, less goodwill and other intangible assets. Profit after tax is adjusted to exclude discontinued operations, the Run-off segment, restructuring and other one-off costs, and the gain on disposal of subsidiary. It is stated after charging tax (using the UK standard tax rate of 20.0%; 2015: 20.25%). RoTE for comparative periods include the net assets held for sale in the disposal group, and profit after tax for discontinued operations, as the International division was managed as part of Ongoing operations (see page 192 alternative performance measures).
Risk and business mix Risk and business mix measures the premium impact of channel, tenure and underlying risk mix. It reflects the risk models used in the period, the outputs of which are revised when models are updated.
Run-off Where the Group no longer underwrites new business, but continues to meet its claims liabilities under existing contracts.
Solvency II The capital adequacy regime for the European insurance industry, which became effective on 1 January 2016. It establishes revised capital requirements and risk management standards. It comprises three pillars: Pillar I, which sets out capital requirements for an insurer; Pillar II, which focuses on systems of governance; and Pillar III, which deals with disclosure requirements.
Total costs Total costs comprise operating expenses and claims handling expenses. Total Shareholder Return (“TSR”)
Compares share price movement with reinvested dividends as a percentage of the share price at the beginning of the period.
Underwriting result (profit or loss)
The profit or loss from operational activities, excluding investment return and other operating income.It is calculated as net earned premium less net insurance claims and total expenses.

www.directlinegroup.com 191
Strategic reportG
overnanceFinancial statem
ents
www.directlinegroup.com 191
Appendix A – Alternative performance measures The Group has identified Alternative Performance Measures (“APMs”) in accordance with the European Securities and Markets Authority’s published Guidelines. The Group uses APMs to improve comparability of information between reporting periods and reporting segments, by adjusting for either uncontrollable or one-off costs which impact on IFRS measures, to aid the user of the Annual Report in understanding the activity taking place across the Group. These APMs are contained within the main narrative sections of this document, outside of the financial statements and notes, and may not necessarily have standardised meanings for ease of comparability across peer organisations.
Further information is presented below, defined in the glossary on pages 189 and 190 and reconciled to the most directly reconcilable line items in the financial statements and notes. Note 4 on page 150 of the consolidated financial statements presents a reconciliation of the Group’s business activities on a segmental basis to the statutory income statement including Ongoing operations of the Group.
Group APM Equivalent IFRS measure Adjustment to reconcile primary statements and where calculated Rationale for adjustments
Adjusted diluted earnings per share
Diluted earnings per share
Adjusted diluted earnings per share is defined in the glossary on page 189 and is reconciled on page 192.
This is a representation of the underlying earnings over the number of shares in issue adjusted for potential dilutions from the exercise of options.
Current-year attritional loss ratio
Loss ratio Current-year attritional loss ratio is defined in the glossary on page 189 and is reconciled to loss ratio on page 40.
Express claims performance in the current accident year in relation to net earned premium.
COR Operating profit
COR is defined in the glossary on page 189. The constituent parts: Operating profit – Ongoing operations is discussed below; and Net earned premium (note 4).
This is a measure of underwriting profitability whereby a ratio of less than 100% represents an underwriting profit and a ratio of more than 100% represents an underwriting loss and excludes non-insurance income.
Investment income yield
Investment income
Investment income yield is defined in the glossary on page 189 and is reconciled on page 193.
Expresses a relationship between the investment income and the associated opening and closing assets net of any associated liabilities.
Investment return yield
Investment return
Investment return yield is defined in the glossary on page 190 and is reconciled on page 193.
Expresses a relationship between the investment income and the associated opening and closing assets net of any associated liabilities.
Loss ratio Net insurance claims
Loss ratio is defined in the glossary on page 190 and is reconciled in note 4.
Expenses claims performance in relation to net earned premium.
Operating profit – Ongoing operations
Operating profit
Operating profit – Ongoing operations is defined as operating profit (see glossary on page 190) less operating profit from run-off segment plus restructuring and one-off costs (see note 4) and is reconciled on page 192.
This measure shows the underlying performance (before tax and finance costs) of the business activities without the impact of business that is in run-off and non-repeating restructuring and one-off expenses.
Profit after tax from Ongoing operations
Profit after tax
Profit after tax – Ongoing profit (as above) less Finance costs and Tax at standard rate and is reconciled on page 192.
This measure shows the underlying performance (after tax and finance costs) of the business activities without the impact of business that is in run-off and non-repeating restructuring and one-off expenses.
RoTE Return on Equity
RoTE is defined in the glossary on page 190 and is reconciled on page 192.
This shows underlying performance against a measure of equity that is more able to be compared with other companies.
Tangible equity Equity Tangible equity is defined as Equity less intangible assets within the Balance Sheet and is reconciled on page 192.
This shows the equity excluding intangible assets for comparability with companies who have not acquired businesses or capitalised intangible assets.
Tangible net asset per share
Net assets per share
Tangible net asset per share is defined as Tangible equity (as above) expressed as a value per share and is reconciled in note 17 on page 160
This shows the equity excluding intangible assets per share for comparability with companies who have not acquired businesses or capitalised intangible assets.
Total costs – ongoing operations
Operating expenses
Total costs – Ongoing operations is defined as Operating expenses adjusted to remove restructuring and one-off costs and operating expenses charged to the run-off segment (reconciled in note 11) plus claims handling expenses incurred in net insurance claims on Ongoing operations (note 9). This is reconciled on page 40.
This represents the total value of operating expenses included those allocated to the insurance claims line as claims handling expenses.

Direct Line Group Annual Report & Accounts 2016192
Glossary and appendices continued
192 Direct Line Group Annual Report & Accounts 2016
Appendix A – Alternative performance measures continued Additionally, the current-year attritional loss ratio within the analysis by division section and total costs have also been identified as alternative performance measures, similarly reconciled to the financial statements and notes, on page 40, and defined in the glossary.
Return on tangible equity1
At Note2 2016
£m 2015
£m
Operating profit 4 390.2 545.1Add back: restructuring and other one-off costs 4 39.9 48.7Exclude: operating profit from run-off 4 (26.6) (73.1)Operating profit from Ongoing operations 4 403.5 520.7Finance costs 12 (37.2) (37.6)Profit before tax – Ongoing operations 366.3 483.1Tax charge (using the UK standard tax rate of 20.0% and 20.25% respectively) (73.3) (97.8)Adjusted profit after tax – Ongoing operations 293.0 385.3
Opening shareholders’ equity 2,630.0 2,810.5Opening goodwill and other intangible assets (524.8) (517.5)Opening disposal group equity – (241.0)Opening shareholders’ tangible equity 2,105.2 2,052.0Closing shareholders’ equity 2,521.5 2,630.0Closing goodwill and other intangible assets (508.9) (524.8)Closing shareholders’ tangible equity 2,012.6 2,105.2Average shareholders’ tangible equity3 2,058.9 2,078.6Return on tangible equity 14.2% 18.5%
Adjusted diluted earnings per share1
At Note 2016
£m 2015
£m
Adjusted profit after tax – Ongoing operations 293.0 385.3Weighted average number of Ordinary Shares for the purpose of diluted earnings per share (millions) 16 1,381.8 1,449.0Adjusted diluted earnings per share (pence) 21.2 26.6
Notes:
1. See glossary on pages 189 and 190 for definitions
2. See notes to the condensed consolidated financial statements
3. Mean average of opening and closing balances

www.directlinegroup.com 193
Strategic reportG
overnanceFinancial statem
ents
www.directlinegroup.com 193
Investment yields
At Note 2016
£m 20151
£m
Investment income 7 167.9 169.1Investment return 7 171.5 198.1
Opening investment property 347.4 307.2Opening financial investments 5,614.6 5,961.2Opening cash and cash equivalents 963.7 880.4Opening borrowings (61.3) (69.8)Opening derivatives liability2 (45.7) (27.8)Opening investment holdings 6,818.7 7,051.2Closing investment property 20 329.0 347.4Closing financial investments 26 5,147.0 5,614.6Closing cash and cash equivalents 27 1,166.1 963.7Closing borrowings 27 (55.3) (61.3)Closing derivatives liability2 (5.8) (45.7)Closing investment holdings 6,581.0 6,818.7Average investment holdings 6,699.9 6,935.0Investment income yield 2.5% 2.4%Investment return yield 2.6% 2.9%
Notes:
1. Results for the year ended 31 December 2015 are based on continuing operations and exclude discontinued operations
2. See note 2 on page 45
Glossary and appendices continued
192 Direct Line Group Annual Report & Accounts 2016
Appendix A – Alternative performance measures continued Additionally, the current-year attritional loss ratio within the analysis by division section and total costs have also been identified as alternative performance measures, similarly reconciled to the financial statements and notes, on page 40, and defined in the glossary.
Return on tangible equity1
At Note2 2016
£m 2015
£m
Operating profit 4 390.2 545.1Add back: restructuring and other one-off costs 4 39.9 48.7Exclude: operating profit from run-off 4 (26.6) (73.1)Operating profit from Ongoing operations 4 403.5 520.7Finance costs 12 (37.2) (37.6)Profit before tax – Ongoing operations 366.3 483.1Tax charge (using the UK standard tax rate of 20.0% and 20.25% respectively) (73.3) (97.8)Adjusted profit after tax – Ongoing operations 293.0 385.3
Opening shareholders’ equity 2,630.0 2,810.5Opening goodwill and other intangible assets (524.8) (517.5)Opening disposal group equity – (241.0)Opening shareholders’ tangible equity 2,105.2 2,052.0Closing shareholders’ equity 2,521.5 2,630.0Closing goodwill and other intangible assets (508.9) (524.8)Closing shareholders’ tangible equity 2,012.6 2,105.2Average shareholders’ tangible equity3 2,058.9 2,078.6Return on tangible equity 14.2% 18.5%
Adjusted diluted earnings per share1
At Note 2016
£m 2015
£m
Adjusted profit after tax – Ongoing operations 293.0 385.3Weighted average number of Ordinary Shares for the purpose of diluted earnings per share (millions) 16 1,381.8 1,449.0Adjusted diluted earnings per share (pence) 21.2 26.6
Notes:
1. See glossary on pages 189 and 190 for definitions
2. See notes to the condensed consolidated financial statements
3. Mean average of opening and closing balances

Direct Line Group Annual Report & Accounts 2016194
Glossary and appendices continued
194 Direct Line Group Annual Report & Accounts 2016
Appendix B – Proforma resultsThe table below presents the Group’s results on a proforma basis for 2016 in order to exclude the impact on the income statement of the recent reduction in the Ogden discount rate to minus 0.75%, as management believe that this provides a clearer comparison to 2015.
FY 2016
£m
Proforma FY 2016
£m
FY 2015
£m
Ongoing operations: In-force policies (thousands) 15,806 15,806 16,068
Gross written premium 3,274.1 3,274.1 3,152.4Net earned premium 3,000.6 3,000.6 2,920.8
Underwriting profit 70.1 245.2 175.2Instalment and other operating income 165.3 165.3 150.8Investment return 168.1 168.1 194.7
Operating profit – Ongoing operations 403.5 578.6 520.7Run-off 26.6 68.8 73.1Restructuring and other one-off costs (39.9) (39.9) (48.7)Operating profit 390.2 607.5 545.1
Finance costs (37.2) (37.2) (37.6)Profit before tax 353.0 570.3 507.5Tax (74.2) (117.7) (108.3)Profit from discontinued operations, net of tax – – 181.2Profit after tax 278.8 452.6 580.4
Of which Ongoing operations 293.0 433.1 385.3Key metrics – Ongoing operations Loss ratio1 prior to the reduction in Ogden discount rate 55.0% 55.0% 59.5%Loss ratio1 due reduction in Ogden discount rate 5.9% – –Commission ratio1 11.5% 11.5% 10.9%Expense ratio1 including Flood Re levy 25.3% 25.3% 23.6%COR1 97.7% 91.8% 94.0%Adjusted diluted earnings per share (pence) 2 21.2 31.3 26.6 Return on tangible equity2 14.2% 20.2% 18.5%Key metrics Investment income yield1 2.5% 2.5% 2.4%Investment return1 2.6% 2.6% 2.9%Basic earnings per share (pence) 1 20.4 33.1 27.9 Return on equity 10.8% 17.0% 21.3%
Dividend per share – interim (pence) 4.9 n/a 4.6 – final interim (pence) 9.7 n/a 9.2 – regular (pence) 14.6 n/a 13.8 – first special interim3 (pence) 10.0 n/a 27.5 – second special interim (pence) – n/a 8.8 – total (pence) 24.6 n/a 50.1Net asset value per share (pence) 184.7 197.4 192.2Tangible net asset value per share (pence) 147.4 160.2 153.8
FY
2016 FY
2016 HY
2016
Capital coverage2,4 – estimated 165% 189% 184%
Notes: 1. A reduction in the ratio represents an improvement and positive change as a proportion of net earned premium, while an increase in the ratio represents
a deterioration and negative change
2. See glossary on pages 189 and 190 for definitions and appendix A – Alternative performance measures on pages 192 and 193 for reconciliation to financial statement line items
3. The special interim dividend paid on 24 July 2015 of 27.5 pence per share, following the sale of the Group’s former Italian and German operations
4. Estimates based on the Group’s Solvency II PIM for 31 December 2016

www.directlinegroup.com 195
Strategic reportG
overnanceFinancial statem
ents
Forward-looking statements disclaimer
www.directlinegroup.com 195
This Annual Report & Accounts has been prepared for, and only for, the members of the Company as a body, and no other persons. The Company, its Directors, employees, agents or advisers do not accept responsibility to any other person to whom this document is shown, or into whose hands it may come, and any such responsibility or liability is expressly disclaimed.
Certain information contained in this document, including any information as to the Group’s strategy, plans or future financial or operating performance, constitutes “forward-looking statements”. These forward-looking statements may be identified by the use of forward-looking terminology, including the terms “aims”, “anticipates”, “aspire”, “believes”, “continue”, “could”, “estimates”, “expects”, “guidance”, “intends”, “may”, “mission”, “outlook”, “plans”, “predicts”, “projects”, “seeks”, “should”, “strategy”, “targets” or “will” or, in each case, their negative or other variations or comparable terminology, or by discussions of strategy, plans, objectives, goals, future events or intentions. These forward-looking statements include all matters that are not historical facts. They appear in a number of places throughout this document, and include statements regarding the intentions, beliefs or current expectations of the Directors concerning, among other things: the Group’s results of operations, financial condition, prospects, growth, strategies and the industry in which the Group operates. Examples of forward-looking statements include financial targets and guidance which are contained in this document specifically with respect to the return on tangible equity; solvency capital coverage ratio; the Group’s combined operating ratio; prior-year reserve releases; cost reduction; investment income yield; net realised and unrealised gains; results from the Run-off segment; restructuring and other one-off costs; and risk appetite range. By their nature, all forward-looking statements involve risk and uncertainties because they relate to events and depend on circumstances that may or may not occur in the future, or are beyond the Group’s control.
Forward-looking statements are not guarantees of future performance. The Group’s actual results of operations, financial condition and the development of the business sector in which the Group operates may differ materially from those suggested by the forward-looking statements in this document; for example directly or indirectly as a result of, but not limited to, UK domestic and global economic business conditions, the result of the UK’s withdrawal from the European Union; market-related risks such as fluctuations in interest rates and exchange rates, the policies and actions of regulatory authorities (including changes related to capital and solvency requirements or the Ogden discount rate), the impact of competition, currency changes, inflation and deflation, the timing impact and other uncertainties of future acquisitions, disposals, joint ventures or combinations within relevant industries, as well as the impact of tax and other legislation and other regulation in the jurisdictions in which the Group and its affiliates operate. Additionally, even if the Group’s actual results of operations, financial condition, and the development of the business sector in which the Group operates are consistent with the forward-looking statements in this document, those results or developments may not indicate results or developments in subsequent periods.
The forward-looking statements in this document reflect knowledge and information available as of the date this document was prepared. The Group and the Directors expressly disclaim any obligations or undertaking to update or revise publicly any forward-looking statements, whether as a result of new information, future events or otherwise, unless an applicable law or regulation requires them to do so. Nothing in this document should be construed as a profit forecast.
Neither the content of Direct Line Group’s website nor the content of any other website accessible from hyperlinks on the Group’s website is incorporated into, or forms part of, this document.

Direct Line Group Annual Report & Accounts 2016196
Contact information
196 Direct Line Group Annual Report & Accounts 2016
Registered office Direct Line Insurance Group plc Churchill Court Westmoreland Road Bromley BR1 1DP
Registered in England and Wales No. 02280426 Company Secretary: Roger C Clifton
Telephone: +44 (0)1132 920 667 Website: www.directlinegroup.com
Registrars Computershare Investor Services PLC The Pavilions Bridgwater Road Bristol BS99 6ZZ
Shareholder helpline: +44 (0)370 873 5880 Shareholder fax: +44 (0)370 703 6101 Telephone number for the hard of hearing: +44 (0)370 702 0005 Website: www.computershare.com
Investor Centre To find out more about Investor Centre, go to www.investorcentre.co.uk/directline
Auditors Deloitte LLP Hill House 1 Little New Street London EC4A 3TR
Telephone: +44 (0)20 7936 3000 Website: www.deloitte.com
Legal advisers Allen & Overy LLP One Bishops Square London E1 6AD
Telephone: +44 (0)20 3088 0000 Website: www.allenovery.com
Slaughter and May One Bunhill Row London EC1Y 8YY
Telephone: +44 (0) 20 7600 1200 Website: www.slaughterandmay.com
Principal banker The Royal Bank of Scotland Group plc 280 Bishopsgate London EC2M 4RB
Telephone: +44 (0)131 556 8555 Website: www.rbs.com
Corporate brokers Goldman Sachs International Peterborough Court 133 Fleet Street London EC4A 2BB
Telephone: +44 (0)20 7774 1000 Website: www.goldmansachs.com
Morgan Stanley & Co International plc 25 Cabot Square Canary Wharf London E14 4QA
Telephone: +44 (0)20 7425 8000 Website: www.morganstanley.com
RBC Europe Ltd (trading as ‘RBC Capital Markets’) Riverbank House 2 Swan Lane London EC4R 3BF
Telephone: +44 (0)20 7653 4000 Website: www.rbccm.com

This report is printed on mixed source paper which is FSC® certified (the standards for well-managed forests, considering environmental, social and economic issues).
Designed and produced by Black Sun Plc
Printed by Pureprint Group

Direct Line Insurance Group plc ©
Registered in England & Wales No. 02280426 Registered Office: Churchill Court, Westmoreland Road, Bromley, BR1 1DP
Direct Line Insurance G
roup plc Annual Report &
Accounts 2016