BUILDING HUMAN CAPITAL -...
22
BUILDING HUMAN CAPITAL May 2018 Human Capital Project and Index
Transcript of BUILDING HUMAN CAPITAL -...
BUILDING HUMAN CAPITAL
May 2018
Human Capital Project and Index

Human Capital Project
A program of advocacy and analytical work that will raise awareness and
increase demand for interventions to build human capital in client countries.
Component 1: An index measuring countries’ investment in the human
capital of the next generation, as a tool for advocacy.
Component 2: An ambitious program to improve measurement and provide
analysis to support effective investments in human capital
formation.

To Be Launched in World Development Report 2019
• The Human Capital
Index (HCI) will be
launched as a
chapter in the
World Development
Report 2019 on the
Changing Nature of
Work.
http://www.worldb
ank.org/en/public
ation/wdr2019
• The Report will be
published in
October 2018.
2

Human Capital Index: The Story
“How much human capital will a child born today acquire by the end of
secondary school, given the risks to poor health and poor education that
prevail in the country where she was born?”
Three main ingredients, reflecting building blocks of the human capital of
the next generation:
1. Survival – Will kids born today survive to school age?
2. School – How much school will they complete and how much
will they learn?
3. Health – Will kids leave school in good health and be ready for
further learning and/or work?
3
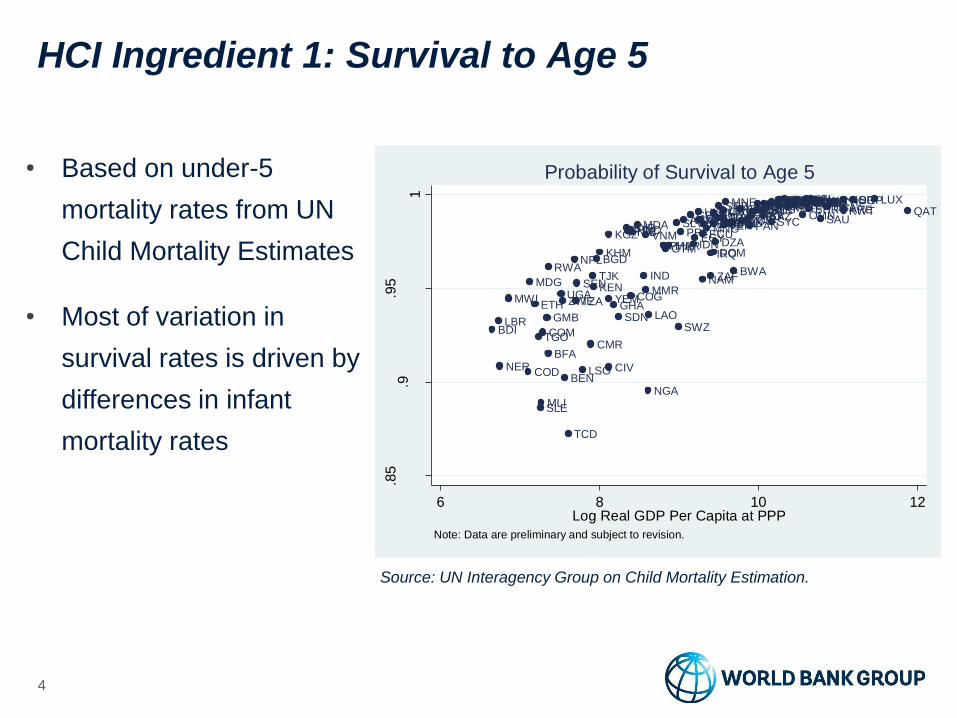
HCI Ingredient 1: Survival to Age 5
4
Source: UN Interagency Group on Child Mortality Estimation.
• Based on under-5
mortality rates from UN
Child Mortality Estimates
• Most of variation in
survival rates is driven by
differences in infant
mortality rates
ALB
DZA
ARGARM
AUSAUTBHR
BGD
BEL
BEN
BWA
BRA
BGR
BFA
BDI
KHM
CMR
TCD
CHLCHNCOL
COM
COD
COG
CRI
CIV
HRVCYPCZE DNK
DOM
ECUEGY
SLV
EST
ETH
FINFRA
GMB
GEODEU
GHA
GRC
GTM
HND
HUNISL
IND
IDN
IRN
IRQ
IRLISRITAJPN
KAZ
KEN
KORKWT
KGZ
LAO
LVALBN
LSO
LBR
LTULUX
MKD
MDG
MWI
MYS
MLI
MLTMUSMEXMDA MNG
MNE
MAR
MMRNAM
NPL
NLDNZL
NIC
NER
NGA
NOR
OMNPAN
PRYPER
PHL
POLPRTQATROURUS
RWA
SAU
SEN
SRB
SYC
SLE
SGPSVKSVN
ZAF
ESP
SDNSWZ
SWECHE
SYR
TJK
TZA
THA
TGO
TUN TUR
UGA
UKR AREGBRUSAURY
VENVNMPSE
YEMZWE
.85
.9.9
5
1
Pro
ba
bili
ty o
f S
urv
iva
l to
Age
5
6 8 10 12Log Real GDP Per Capita at PPP
Note: Data are preliminary and subject to revision.
Probability of Survival to Age 5

HCI Ingredient 2a: Expected Years of School
How many years of education can a child passing through the current
school system expect to obtain given current enrollment rates?
• Answer requires chaining together gross enrollment rates at different levels of
school (Pre-Primary, Primary, Lower Secondary, Upper Secondary), combined
with duration of each level
Two issues with UNESCO-reported expected years of school that we are
addressing:
1. Gross enrollment rates exceed 100% in many countries and levels, leading to
implausibly-high expected school years (greater than total duration)
➢ Solution: Calculate new measures of expected years of school using data on
net enrollment rates (where available); cap gross enrollment rates
at 100% if needed
2. Official duration of different levels of school varies substantially across
countries, making differences in expected years harder to compare
➢ Solution: Impose “standardized duration” of 12 years of primary and
secondary, preceded by 2 years of pre-primary
5

Expected Years of School
6
ALB
DZA
ARG
ARM
AUSAUT
BHR
BGD
BEL
BENBWA
BRA
BGR
BFA
BDI
KHM
CMR
TCD
CHLCHN
COL
COMCOD
COG
CRI
CIV
HRVCYP
CZE
DNK
DOM
ECU
EGYSLV
EST
ETH
FINFRA
GMB
GEO
DEU
GHA
GRC
GTMHND
HUNISL
IND
IDN
IRN
IRQ
IRLISRITAJPNKAZ
KEN
KOR
KWTKGZ
LAO
LVA
LBN
LSO
LBR
LTU
LUX
MKD
MDG
MWI
MYS
MLI
MLT
MUSMEX
MDA
MNG
MNE
MARMMRNAM
NPL
NLDNZL
NIC
NER
NGA
NOR
OMN
PANPRY
PERPHL
POL
PRT
QATROU
RUS
RWA
SAU
SEN
SRBSYC
SLE
SGP
SVK
SVN
ZAF
ESP
SDN
SWZ
SWE
CHE
SYR
TJK
TZA
THA
TGO
TUN
TUR
UGA
UKR ARE
GBR
USA
URYVEN
VNM
PSE
YEM
ZWE
46
81
01
21
4
Ye
ars
6 8 10 12Log Real GDP Per Capita at PPP
Note: Data are preliminary and subject to revision.
Expected Years of School
Source: World Bank staff calculations.

HCI Ingredient 2b: Learning
7
New dataset of “harmonized learning outcomes (HLO)”
• May 2018 version: 152 countries, 98% of world population, nearly all FCV
countries
Exhaustive effort to combine:
• Major international testing programs (e.g. OECD Program for International
Student Assessment (PISA), Trends in International Math and Science
(TIMSS))
• Regional testing programs (e.g. Latin American Laboratory for Assessment
of the Quality of Education (LLECE) , Southern and Eastern Africa Consortium
for Monitoring Educational Quality (SACMEQ))
• Other programs (e.g. Young Lives, Service Delivery Indicators, Early Grade
Reading Assessments)
HLO database is maintained in partnership with UNESCO Institute of Statistics.

Quality-Adjusted School Years
8
ALB
DZA
ARG
ARM
AUSAUT
BHR
BGD
BEL
BEN
BWA
BRA
BGR
BFABDI
KHM
CMR
TCD
CHL
CHN
COL
COM
COD
COG
CRI
CIV
HRVCYP
CZE DNK
DOM
ECU
EGYSLV
EST
ETH
FIN
FRA
GMB
GEO
DEU
GHA
GRC
GTMHND
HUN ISL
IND
IDN IRN
IRQ
IRL
ISRITA
JPN
KAZ
KEN
KOR
KWT
KGZ
LAO
LVA
LBN
LSO
LBR
LTU
LUX
MKD
MDG
MWI
MYS
MLI
MLT
MUSMEXMDA
MNG
MNE
MARMMR
NAM
NPL
NLDNZL
NIC
NER
NGA
NOR
OMN
PANPRY
PERPHL
POLPRT
QATROU
RUS
RWA
SAU
SEN
SRB
SYC
SLE
SGP
SVK
SVN
ZAF
ESP
SDN SWZ
SWECHE
SYR
TJK
TZA
THA
TGO
TUN
TUR
UGA
UKR
ARE
GBRUSA
URYVEN
VNM
PSE
YEM
ZWE
05
10
15
Ye
ars
6 8 10 12Log Real GDP Per Capita at PPP
Note: Data are preliminary and subject to revision.
Quality-Adjusted School Years, Most Recent
Source: World Bank staff calculations.

HCI Ingredient 3: Health
Health matters for kids’ ability to stay in school and learn (already captured
in education component of index), and also matters directly for their
eventual productivity as workers.
HCI will use two broad indicators of overall health:
1. Stunting Rate: Fraction of kids under 5 more than 2 reference
standard deviations below reference median height-for-age
• WHO-UNICEF-WB Joint Malnutrition Estimates, latest May 2018
update
• Based on direct survey measurement
2. Adult Survival Rate: Fraction of 15 year-olds who survive to age 60
• UN Population Division
• Based on vital registries (where available), otherwise estimated
based on limited available mortality data and model life tables
9

Stunting Rates
10
Source: WHO-UNICEF-World Bank Joint Malnutrition Estimates.
ALB
DZAARM
AUS
BGDBEN
BWA
BRA
BFA
BDI
KHMCMR
TCD
CHL
CHN
COL
COM
COD
COG
CRI
CIV
DOM
ECUEGY
SLV
ETH
GMB
GEO
GHA
GTM
HND
INDIDN
IRN
IRQ
JPNKAZ
KEN
KORKWT
KGZ
LAO
LSOLBR
MKD
MDG
MWI
MYS
MLI
MEX
MDA
MNGMNE
MAR
MMR
NAM
NPL
NIC
NERNGA
OMN
PAN
PRY
PER
PHL
RWA
SEN
SRBSYC
SLE
ZAF
SDN
SWZSYRTJK
TZA
THA
TGO
TUN TUR
UGA
USA
URYVEN
VNM
PSE
YEM
ZWE
.4.6
.81
Fra
ctio
n N
ot S
tunte
d
6 8 10 12Log Real GDP Per Capita at PPP
Note: Data are preliminary and subject to revision.
Fraction of Children Under 5 Not Stunted

Adult Survival Rates (ASR)
11
Source: UN Population Division.
ALB
DZAARGARM
AUSAUTBHR
BGD
BEL
BEN
BWA
BRABGR
BFA
BDI
KHM
CMR
TCD
CHLCHN
COL
COM
COD COG
CRI
CIV
HRV
CYP
CZEDNK
DOM
ECU
EGY
SLV
EST
ETH
FINFRA
GMB
GEO
DEU
GHA
GRC
GTMHND
HUN
ISL
IND IDN
IRN
IRQ
IRLISRITAJPN
KAZKEN
KORKWT
KGZLAO
LVA
LBN
LSO
LBR
LTU
LUX
MKD
MDG
MWI
MYS
MLI
MLT
MUS
MEX
MDA
MNG
MAR
MMR
NAM
NPL
NLDNZL
NIC
NER
NGA
NOR
OMNPAN
PRYPER
PHL
POL
PRTQAT
ROU
RUS
RWA
SAU
SEN
SRB
SYC
SLE
SGP
SVK
SVN
ZAF
ESP
SDN
SWZ
SWECHE
SYR
TJKTHA
TGO
TUNTUR
UGA
UKR
AREGBR
USAURY
VENVNM
PSE
YEM
ZWE
.5.6
.7.8
.91
Ad
ult S
urv
ival R
ate
6 8 10 12Log Real GDP Per Capita at PPP
Note: Data are preliminary and subject to revision.
Adult Survival Rates (Age 15 to 60)

Why These Health Measures?
Open door to policy discussion of range of childhood and adult
health interventions• Combination of ASR and/or stunting is salient at all income levels.
(Reasonably) direct and frequent measurement
• ASR better measured in rich countries, stunting widely and directly measured in
poor countries where ASR data is more likely to be modelled.
Informed decision not to use heavily-modeled YLD data
• Scarcity of primary sources and direct measurement in low-income countries
• Communications challenges around disability weights, imputation procedures
• Offsetting effects of reduced incidence but higher survival makes cross-country
patterns in YLD hard to interpret.
12

Combining Indicators into Index
HCI/HCP is about effects of human capital investments on future
productivity, not just their (undisputed) intrinsic value
• This is reflected in aggregation strategy that converts indicators into
contributions to the productivity of future workers.
Express contributions to worker productivity relative to benchmark of
complete education and full health
• Resulting index has values from 0 to 1;
• Value of 0 < 𝑥 < 1 means that the expected productivity as a future
worker of a child born today is only a fraction 𝑥 of what it would be under
the benchmark of complete education and full health.
13

Education and Worker Productivity
• Many estimates of direct links from education to productivity based on
microeconometric studies of relationship between wages and education.
• Additional year of (quality-adjusted) school raises worker productivity by
~8%.
14
0
2
4
6
8
10
12
14
Year
of S
cho
ol
0
0.25
0.5
0.75
1
Pro
du
ctiv
ity
Rel
ativ
e to
Ben
chm
ark
Education
Component of
HCI:
Relative
Productivity (0-1)
Gap=5
Years’

Health and Productivity
Improved health leads to less stunting and higher adult survival – convert
into effects on worker productivity using microeconometric evidence on
the returns to height
Better
Health
Higher Earnings
Increased Adult
Height
Less Stunting
Improved
Adult Survival
(ASR)
Evidence on “return” to
height
1cm↑ → ~3% earnings ↑
Reduction in stunting by 10%
→
~3% productivity increase
Improvement in ASR by 10%
→
~6% productivity increase
Average of two effects in HCI
15

Overall Human Capital Index
16
Survival
Kids who don’t survive don’t grow up
to become future
workers
School
Contribution
of quality-
adjusted
years of
school to
productivity
of future
workers
Health
Contribution
of health
(average of
ASR and
stunting) to
productivity
of future
workers
HCI
Productivity
of a future
worker
(relative to
benchmark of
complete
education and
full health)
XX =

Human Capital Index
17
ALB
DZA
ARGARM
AUSAUT
BHR
BGD
BEL
BEN
BWA
BRA
BGR
BFABDI
KHM
CMR
TCD
CHL
CHN
COL
COMCOD COG
CRI
CIV
HRVCYP
CZE DNK
DOM
ECU
EGYSLV
EST
ETH
FIN
FRA
GMB
GEO
DEU
GHA
GRC
GTMHND
HUN
ISL
IND
IDN
IRN
IRQ
IRL
ISRITA
JPN
KAZ
KEN
KOR
KWTKGZ
LAO
LVA
LBN
LSO
LBR
LTULUX
MKD
MDG
MWI
MYS
MLI
MLT
MUSMEX
MDA
MNGMNE
MARMMR
NAM
NPL
NLDNZL
NIC
NER
NGA
NOR
OMN
PANPRY
PER
PHL
POLPRT
QATROU
RUS
RWA
SAU
SEN
SRB
SYC
SLE
SGP
SVK
SVN
ZAF
ESP
SDN SWZ
SWECHE
SYR
TJK
TZA
THA
TGO
TUN
TUR
UGA
UKR ARE
GBRUSA
URY
VEN
VNM
PSE
YEM
ZWE
.2.4
.6.8
1
Pro
du
ctivity R
ela
tive
to
Be
nch
mark
6 8 10 12Log Real GDP Per Capita at PPP
Note: Data are preliminary and subject to revision.
Human Capital Index• HCI covers 141
countries as of June
15.
• Country coverage
should expand to up
to 170 countries as
remaining gaps in
education and health
data are filled.

18
.85 .9 .95 1
Probability of Survival to Age 5
4 6 8 10 12 14
Expected Years of School
0 5 10 15
Quality-Adjusted Expected Years of School
.5 .6 .7 .8 .9 1
Adult Survival Rate
.4 .6 .8 1
Fraction of Children Under 5 Not Stunted
.2 .4 .6 .8 1
Human Capital Index
Note: Vertical lines indicate quartiles of each variable. Data are preliminary and subject to revision.
Human Capital Index and Components: Indonesia

From Human Capital to Growth
HCI score of 𝑥% means next generation of workers will be only 𝑥% as
productive as they could be with complete education and full health.
If current trends continue, eventually entire future workforce will only be
𝑥% as productive as it could be.
GDP per worker is lower than it could be with complete education and
full health:
• Direct effect: less productive workers;
• Indirect effect: less capital accumulation;
• Combined effect: GDP per worker is only 𝑥% of what it could be in
the long run with complete education and full
health.
19

From Human Capital to Growth: Illustrative Calculation
HCI of x = 0.5means GDP per worker could be twice as high if
country reached benchmark of
complete education and full
health – or an extra 1.4% of
annual growth over 50 years
0
0.5
1
1.5
2
HCI=0.5 HCI=0.6 HCI=0.7 HCI=0.8
Status Quo
More Human
Capital
(Direct Effect)
More Physical
Capital
(Indirect Effect)
20

21