“Building for the Future” FLL · PDF file“Building for the Future” FLL...
39
Presented to the Greater Fort Lauderdale Chamber of Commerce Board of Directors & Trustee Luncheon Mark E. Gale, CEO/Director of Aviation Broward County Aviation Department Fort Lauderdale-Hollywood International Airport August 17, 2016 “Building for the Future” FLL Update
Transcript of “Building for the Future” FLL · PDF file“Building for the Future” FLL...

Presented to the Greater Fort Lauderdale Chamber of Commerce
Board of Directors & Trustee Luncheon
Mark E. Gale, CEO/Director of Aviation Broward County Aviation Department
Fort Lauderdale-Hollywood International Airport
August 17, 2016
“Building for the Future” FLL Update

Today’s Agenda
FLL Today - Traffic and Service Highlights Economic Impact Airport Development Future Challenges Q&A

FLL Today
Passenger Terminal Complex
• 4 terminals - 57 air carrier gates
• 3 Parking Garages
• 30 carriers – Average of 307 daily departures to 117 cities
• 90% Origin and Destination (O&D) traffic
Activity in 2015
• Total passengers - 26.9 million
• Total aircraft operations - 278,002
• Total air cargo - 81,198 tons
Employees*
• 10,839 badged employees
• Regionally support 129,081 jobs
$13.2 billion in total regional economic impact annually*

DEN 33,920 acres 541,213 operations
16 operations per acre
DFW 18,076 acres 681,261operations
38 operations per acre
IAH 10,000 acres 502,844operations
50 operations per acre
ORD 7,700 acres 875,136 operations
114 operations per acre
ATL 4,700 acres 875,136 operations
188 operations per acre
LAX 3,586 acres 655,564 operations
183 operations per acre
LAS 2,853 acres 530,330 operations
186 operations per acre
FLL 1,400 acres 278,002 operations
199 operations per acre
FLL operates on a very small footprint
2015 North America Airport Traffic Summary - Operations

2015 - FLL ranked as the 21st busiest airport in the U.S. with 26, 954,511, up 9.3%.
June 2016 was the 27th consecutive month of growth in total passenger traffic.
International traffic has increased 250% times from 2005 to 2015.
Nonstop service to top 50 U.S. markets (except Salt Lake City)…yes we are working on it.
Domestic fares are among the lowest for Large airports, 22% less than MIA, 17% less than PBI, (based on U.S. DOT Data YE Q1-2016)
FLL works closely with the Greater Fort Lauderdale Chamber of Commerce, Port Everglades,
the Broward County Convention & Visitors Bureau, and the Greater Fort Lauderdale Alliance.

FLL was the 4th fastest growing Large Hub airport in 2015 FLL was up 9.4%, Large Hub average was 5.8%
0%
2%
4%
6%
8%
10%
12%
14%
2015 North America Airport Traffic Summary - Passengers
Total Passengers

In the last two years, FLL has seen the arrival of four new airlines: • Copa to Panama City, Panama • Azul with new service to Sao Paulo, Brazil • Tame to Guayaquil, Ecuador • Volaris began service to Mexico City and Guadalajara, Mexico
Other new international service includes: • Quito, Ecuador (JetBlue) • London, England (Norwegian Air Shuttle) • Providenciales, Turks and Caicos (JetBlue) • Bridgetown, Barbados (JetBlue)

JetBlue Nashville and Aguadilla in May San Diego in June New Orleans in September
Spirit Philadelphia in April Newark in October Akron/Canton in November
Delta Seattle in December United Washington Dulles in December
Allegiant Fort Walton/Destin in May Ogdensburg, NY in October Niagara Falls in November
Norwegian Paris in August Guadalupe in December
Southwest Nassau, Bahamas in August Frontier Cincinnati in October
New Service 2016

Coming soon…….awarded flights to Cuba Weekly Flts Weekly Flts Weekly Flts
Weekly Flts TTL Daily
Destination Silver Southwest JetBlue Spirit Cayo Coco, CU 3 3 0.4 Camaguey, CU 5 7 12 1.7
Cayo Largo Del Sur, CU 1 1 0.1 Havana, CU 14 13 14 41 5.9 Holguin, CU 7 7 14 2.0
Manzanillo, CU 3 3 0.4 Santiago de Cuba, CU 7 7 1.0
Santa Clara, CU 7 7 7 21 3.0 Varadero, CU (Matanzas) 4 14 18 2.6
Cienfuegos, CU 2 2 0.3 Total 39 35 34 14 122 Daily 5.6 5.00 4.9 2.0 17.4
First flight will be Silver Airways to Santa Clara on August 30, 2016

Daily Departures 307
Domestic Destinations 72
International Destinations 45
FLL serves more U.S. cities nonstop than
any other airport in South Florida, and also
nonstop service to 25 international
destinations.
August 2016 Schedule

FLL’s Top 15 Domestic and International Markets (based on total passengers, nonstop and connecting)
Domestic Airlines International Airlines New York-La Guardia 3 Toronto 4
Atlanta 3 Montreal 3 New York-JFK 2 Port Au Prince 3
Baltimore 3 Nassau 3 Newark 2 Bogota 3 Detroit 3 San Jose 2 Boston 2 Montego Bay 3
Chicago-O'Hare 3 Kingston 3 Los Angeles 3 Cancun 2 Philadelphia 3 Santo Domingo 2
San Juan 3 Medellin 2 Washington-National 3 Port of Spain 2
San Francisco 3 Sao Paulo 1 Dallas/Fort Worth 2 Lima 2
Denver 3 Cartagena 2

[CATEGORY NAME]
24%
Spirit 19%
Southwest 18%
[CATEGORY NAME]
11%
[CATEGORY NAME]
9%
FLL’s Top 10 Largest Airlines (Jan-Jun 2016 passenger market share)
United 6% Air
Canada 3%
Allegiant 2% Virgin
America 1%
WestJet 1%
Over 60% of FLL’s passengers travel on a low cost carrier

Based on current passenger traffic, historical data, and future published airline schedules, we anticipate that passenger traffic will exceed 29 million in 2016.
In addition to the increase in service by existing and new carriers, FLL has been authorized for more flights to Cuba than any other airport in the U.S.
Passenger traffic is currently projected to increase between 4.6% to 7.1% annual growth rates resulting in 34.7M to 38.1M by 2020*.
Outlook for 2016-2025
* Preliminary Master Plan, Ricondo & Associates, February 2016

Economic Impact

Total economic impact – Top Florida airports (Billions)
- 5.0
10.0 15.0 20.0 25.0 30.0 35.0 40.0
Miami Orlando FLL Tampa FortMeyers
West PalmBeach
Florida Department of Transportation IMPLAN Economic Modeling August 2014

$13.2 billion in total annual economic impact* 10,839 direct badged employees = $498 million in total payroll
129,081 supported jobs = $12.7 billion in wages
Florida Department of Transportation IMPLAN Economic Modeling August 2014
FLL = Job$

Increase in passenger traffic (1,000s) = more jobs
1 new food concession = 30 (average) new employees
7 opened since last November = 210 new employees
Number of badged employees has increased by 28% since 2013
76% of the badged employees live in Broward County (10,435)
1 new retail concession = 6 (average) new employees
5 opened since last November = 30 new employees
0
2,000
4,000
6,000
8,000
10,000
12,000
14,000
16,000
2013 2014 2015 2016Enplaned Passengers Employees
4.9% 12.6% 9.2% 12.2%
9.0% 12.0%
*est.

Rental Cars 46%
Parking 32%
Concessions
16%
Ground Trans
4%
Other Concession
s 2%
Terminal Rent 43%
Landing Fees 43%
Customs (FIS ) 10%
Gate Fees 3%
Other 1%
Airport revenue sources are diverse with a healthy share of non-airline revenue
Non-Airline Revenue 68% of total revenue
Airline Revenue 32% of total revenue

“Building for the Future” Airport Development
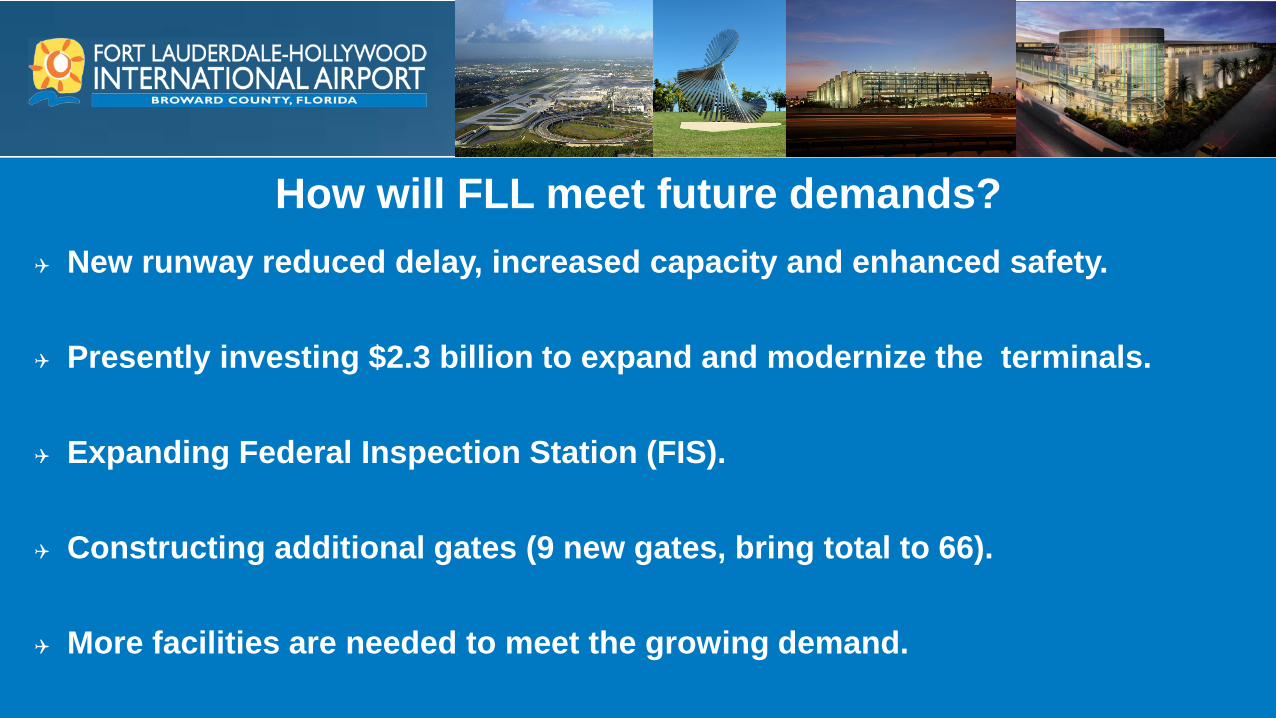
New runway reduced delay, increased capacity and enhanced safety.
Presently investing $2.3 billion to expand and modernize the terminals.
Expanding Federal Inspection Station (FIS). Constructing additional gates (9 new gates, bring total to 66).
More facilities are needed to meet the growing demand.
How will FLL meet future demands?


New South Runway Opened September 18, 2014

New Concourse A (May 2017)
T1
5 new international swing gates 2nd Federal Inspection Station Project managed by Southwest Airlines Estimated cost $333 million

Terminal 1 Modernization
Concourse B-C Connector Concourse A Rotunda

Terminal 2 Modernization

Current
Proposed

Terminal 2 Airside Exterior

Fort Lauderdale – Hollywood International Airport Terminal 2 Modernization Terminal 2 Modernization
Estimated completion Spring 2019 Square footage increased by 33,157 sq.ft. Project managed by Delta Airlines Estimated cost of $110 million
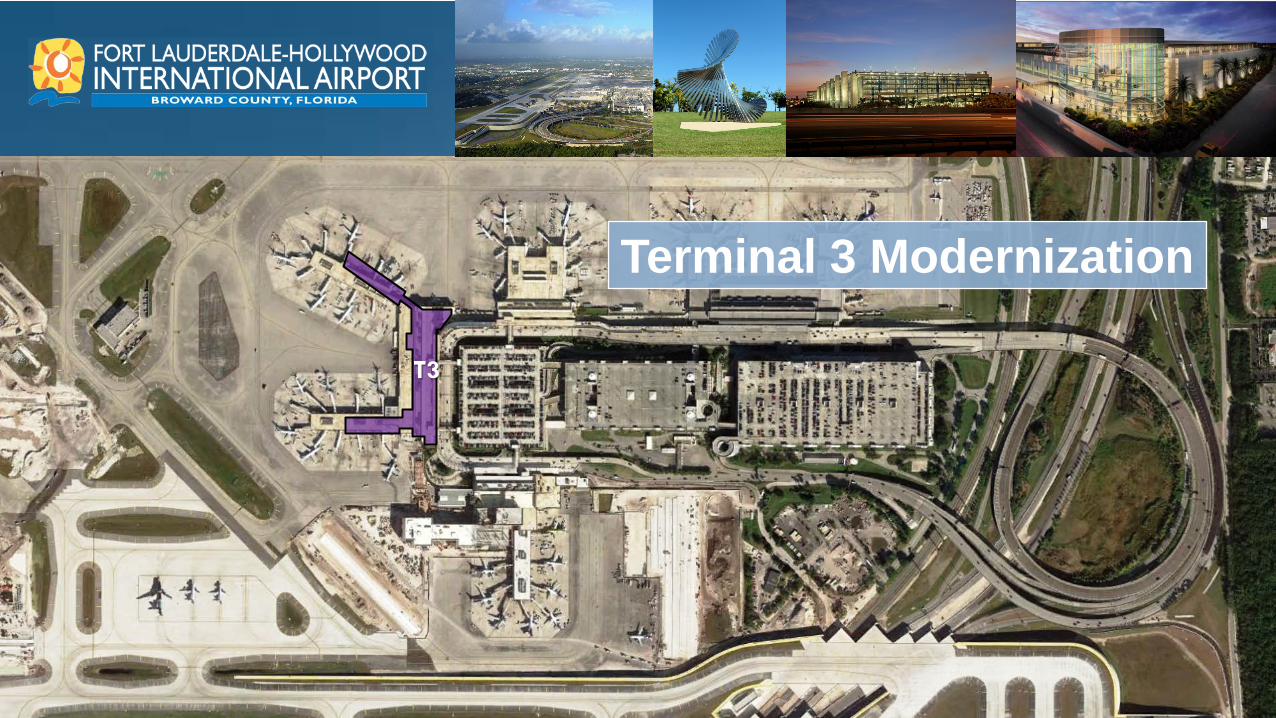
T3
Terminal 3 Modernization
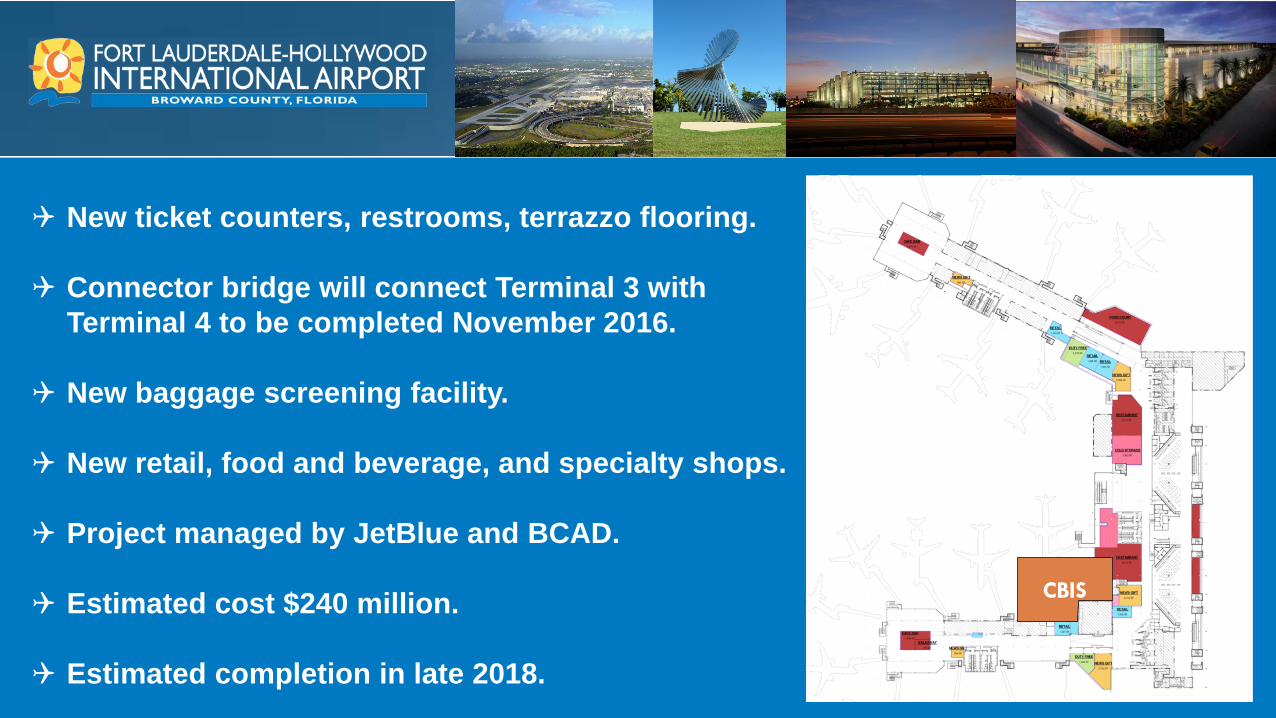
New ticket counters, restrooms, terrazzo flooring.
Connector bridge will connect Terminal 3 with Terminal 4 to be completed November 2016.
New baggage screening facility.
New retail, food and beverage, and specialty shops.
Project managed by JetBlue and BCAD.
Estimated cost $240 million.
Estimated completion in late 2018.
CBIS

Sterile connector bridge opening in November 2016
Terminal 3 Terminal 4

Broward County Public Art Project “Rainbow’s End”

T4
Terminal 4 Expansion

Western Portion 6 total gates 5 opened by Nov. 2015 1 to open in Spring 2018
Eastern Portion 8 total gates 6 to open in May 2017 2 to open in Spring 2018
Federal Inspection Station Facility Expansion (late 2017)
New hall and initial
processing facility by May 2017
Checked Baggage Inspection System (late 2018)
Provide efficient screening of
checked baggage
Apron (Nov 2017) Provide new
drainage and aircraft parking/movement areas

Provide a better passenger experience
Curbside Valet Parking
Curbside Canopies
Parking Assist Guidance System
Pedestrian Bridges
Public Art & Design

Provide a better passenger experience
Golden Bear Grill
Hoffman’s
Univision

Future Challenges Maintain low operating costs while building and expanding. Debt increases but
so does passenger traffic.
Keep the “breeze in, breeze out” passenger experience while being one of the fastest growing airports in the country. Airports need “balance”.
Preserve high levels of service while undergoing a $2.3 billion expansion program (building on top of ourselves while remaining fully operational).
Provide facilities for new entrants while meeting the needs of existing carriers.
Ongoing Master Plan initiatives to plan for additional airport facilities.

What’s Next?

Thank You!