Building Drought Resilience in California’s Cities and Suburbs
57
JUNE 2017 David Mitchell, Ellen Hanak, Ken Baerenklau, Alvar Escriva-Bou, Henry McCann, María Pérez-Urdiales, and Kurt Schwabe with research support from Linda Grand, Jelena Jezdimirovic, and Natalie Shahbol Supported with funding from California Water Service, the S. D. Bechtel, Jr. Foundation, and the US Environmental Protection Agency Building Drought Resilience in California’s Cities and Suburbs
Transcript of Building Drought Resilience in California’s Cities and Suburbs

JUNE 2017
David Mitchell, Ellen Hanak, Ken Baerenklau, Alvar Escriva-Bou, Henry McCann, María Pérez-Urdiales, and Kurt Schwabe with research support from Linda Grand, Jelena Jezdimirovic, and Natalie Shahbol
Supported with funding from California Water Service, the S. D. Bechtel, Jr. Foundation, and the US Environmental Protection Agency
Building Drought Resilience in California’s Cities and Suburbs

© 2017 Public Policy Institute of California
PPIC is a public charity. It does not take or support positions on any ballot measures or on any local, state, or federal legislation, nor does it endorse, support, or oppose any political parties or candidates for public office.
Short sections of text, not to exceed three paragraphs, may be quoted without written permission provided that full attribution is given to the source.
Research publications reflect the views of the authors and do not necessarily reflect the views of our funders or of the staff, officers, advisory councils, or board of directors of the Public Policy Institute of California.

Introduction 5
California’s Urban Water Sector in Context 6
Policies and Precedents from Past Droughts 9
Policy Evolution in the Latest Drought 13
Local Responses and Reactions to the State Mandate 23
Financial and Economic Impacts 32
Longer Term Consequences for Water Use and Growth 36
Lessons for Future Droughts 40
Conclusion 50
References 51
About the Authors 54
Acknowledgments 55
Technical appendices to this paper are available on the PPIC website.
Droughts are a recurring feature of California’s climate. Major droughts provide an opportunity to review management responses and derive policy lessons that can better prepare society for the next one. Here we take stock of how California’s cities and suburbs have responded to recent droughts, review the state’s evolving role in urban drought management, and recommend actions to increase urban areas’ drought resilience.
California’s urban water supply system is complex and highly decentralized, with 400-plus utilities serving more than 90 percent of the state’s residents. Following the hard lessons learned from the 1976–77 and 1987–92 droughts, these utilities made substantial investments in drought resilience. This included diversifying supplies with new surface and underground storage, interconnections with neighboring suppliers, recycled wastewater, and water transfer agreements, as well as freeing up supplies by reducing indoor water use. Consequently, urban water suppliers generally believed they were prepared as the state entered a five-year drought in 2012.
The state has also played essential roles in building urban drought resilience since the late 1970s by strengthening local water planning requirements, providing financial assistance, and fostering voluntary water trading to help move supplies to areas experiencing the worst shortages. But concerns about the latest drought’s severity prompted the state to intervene in new ways. In particular, it adopted a more hands-on approach to short-term demand management—a key part of drought resilience strategies that had traditionally been left to local authorities. And in 2015, the state took the unprecedented step of ordering an across-the-board mandate for urban water conservation.
Although California’s residents overwhelmingly responded to the mandate, the policy generated significant discord between the state and local water suppliers—entities that need to work well together to protect the state’s residents and economy from the worst effects of drought. Perhaps more importantly, it muddied the waters in terms of state and local roles and responsibilities going forward. If left unaddressed, this uncertainty could undermine effective planning and response to future droughts.
Actions in the following five areas can clarify this process and improve urban drought resilience going forward:
Coordinating water shortage contingency planning and implementation: The misalignment between state and local views on local drought preparedness reflects an information gap. The state should avoid the “better safe than sorry” approach it took with the mandate and rely instead on a “trust but verify” policy. The stress test the state
CONTENTS
SUMMARY

PPIC.ORG/WATER Building Drought Resilience in California’s Cities and Suburbs 4
adopted toward the end of the drought—which allowed local utilities to drop mandated conservation if they could demonstrate drought-resilient supplies—is a good model.
Fostering water system flexibility and integration: Priorities include continued local and state investment in cooperative regional approaches to water supply management and greater attention to the regulatory context in which planning and investment decisions are made.
Improving water suppliers’ fiscal resilience: Utilities can improve their ability to weather future droughts by being more proactive on drought pricing and communication with their customers. The state can also help by offering utilities guidance in navigating constitutional requirements regarding water pricing.
Addressing water shortages in vulnerable communities and ecosystems: Simply saving water in cities is not enough to provide meaningful assistance to at-risk rural communities and ecosystems. The state needs to take the lead in improving drought preparation and response for these vulnerable sectors.
Balancing long-term water use efficiency and drought resilience: As water managers look to make long-term gains in conservation, they need to recognize that reducing water used by urban landscapes will make it harder to cut water use quickly during future droughts. Utilities can address these trade-offs by explicitly considering them in their drought planning—for instance, by allocating some long-term savings to a reliability reserve. The state can help by updating urban water management planning requirements.

PPIC.ORG/WATER Building Drought Resilience in California’s Cities and Suburbs 5
Introduction
Droughts are significant events for urban water suppliers and the communities they serve. Prolonged droughts can disrupt service, harm customers, and weaken utility finances. Few water suppliers come through the worst droughts unaffected. But the extent of the impact depends on factors beyond the severity of the meteorological event. In particular, the degree of prior planning and preparation affects the ability of utilities and their customers to mitigate and adapt to drought conditions. Droughts provide opportunities to take stock of this resilience and identify what needs to be improved to better weather the next one.
In this report, we review how California’s cities and suburbs fared during the 2012–16 drought. Although droughts are recurring features of California’s variable climate, this one was unusual in its severity—including the driest four-year stretch in 120 years of record keeping (Mount et al. 2016). It has also been marked by record-high temperatures, which reduced water stored in the Sierra Nevada snowpack and intensified drought conditions in other ways.1 This combination of dry, hot weather makes it a harbinger of the kinds of droughts California can expect more often as the climate changes (Diffenbaugh et al. 2015).
This drought has also been unusual in the types of policies the state adopted for the urban sector. California’s urban water supply system is highly decentralized, with more than 400 local retail suppliers—along with some two dozen wholesalers—supplying 93 percent of the state’s residents. In past droughts, mandatory rationing decisions were made by local authorities while the state focused on supporting better local drought planning and increasing water system flexibility, such as through water trading. This time, state officials—concerned that urban utilities were moving too slowly for a drought of this severity and the possibility it could continue for several more years—took the unprecedented step of ordering an across-the-board curtailment of urban water use in April 2015, mandating 25 percent average savings compared to 2013.2
California’s residents overwhelmingly responded to the mandate, but the policy generated significant discord between the state and local water suppliers. Many local suppliers objected to the state second-guessing their supply conditions, believing that these conditions did not warrant the mandatory level of cuts imposed.3 Urban utilities had been making substantial investments in drought resilience for years, and generally believed they were prepared for the exigencies of a prolonged drought as 2012 approached.
In response to local suppliers’ concerns and following somewhat better rains in early 2016, the state authorized utilities to opt out of the state mandate by “self-certifying” that they had adequate supplies to weather at least three more years of drought without mandatory rationing. Eighty-three percent of suppliers chose this option. This change, too, was controversial. Conservation advocates raised concerns that switching back to local control would undermine the water savings achieved under the state mandate.4 Water suppliers, meanwhile, emphasized that while they are committed to the state’s long-term conservation goals, some easing of restrictions was appropriate in communities with adequate supplies (Quinn 2016a).
1 For temperature trends, see Escriva-Bou et al. (2017). On the effect of temperatures on drought conditions, see Hanak et al. (2015), Griffin and Anchukaitis (2014), Williams et al. (2015), and Goulden and Bales (2016). 2 Technically, the mandate applied only to potable water (not untreated or recycled water destined for industrial or irrigation uses) and was measured in terms of water production, which includes both water delivered to customers and water lost in the distribution system. As we explain later, while the aggregate reduction target was 25 percent, mandated targets for individual water suppliers ranged from 4 to 36 percent, varying with their level of residential per capita use in summer 2014, relative to the same months in 2013. 3 The State Water Board received more than 200 comments on the draft emergency regulation for mandatory urban water conservation, most of which were from urban water suppliers. 4 See, for example, the May 16, 2016 letter to the State Water Board from the Natural Resources Defense Council (NRDC), the Pacific Institute, and the California Coastkeeper Alliance. Also see NRDC’s May 19, 2016 blog post (Quinn 2016b).

PPIC.ORG/WATER Building Drought Resilience in California’s Cities and Suburbs 6
Looking ahead, state agencies and local suppliers can harvest rich lessons from the past five years for improving the ability of California’s cities and suburbs to withstand future droughts. Important questions include: What are the key gaps in urban drought planning and preparation? How can local suppliers build resilience within their communities and their regions that will help them prepare for future droughts and a changing climate? And how can the state best support and encourage drought resilience in this diverse, geographically dispersed sector?
This report seeks to contribute to this discussion. We draw on multiple sources of information about the impacts of drought on urban communities and state and local actions to reduce these effects. For a qualitative picture of local utility preparedness, impacts, response, and takeaways from the drought, we conducted a survey in September 2016 of 410 urban water suppliers.5 The responding sample of 173 suppliers (42%) is broadly representative of the sector in terms of geography, utility size, and other metrics. For a quantitative analysis of water conservation patterns during the drought, we draw on two main data sources. The first is the State Water Board’s reporting of monthly water use, which covers all urban suppliers. The second is a more detailed look at the system owned and operated by the state’s largest investor-owned utility, California Water Service (Cal Water), whose 24 retail service areas serve 1.7 million Californians. Our analysis of Cal Water includes more detailed information on water use patterns for residential and business sectors and households across a geographically and socioeconomically diverse set of communities. We also received valuable input from state and local officials through interviews and focus group discussions throughout 2016. Details of the survey results and quantitative analyses are provided in several technical appendices.6
The report is organized as follows. We begin with some background on the state’s urban water sector. Next we summarize the policies and precedents that emerged from other droughts over the past 40 years—key to understanding both state and local roles coming into this latest drought. We then review the hydrologic and policy timeline of this drought, and describe early actions undertaken by local suppliers. The next three sections focus on local impacts and responses during and after the statewide conservation mandate. We end with lessons for how the state and local suppliers can build drought resilience within California’s urban areas and beyond.
California’s Urban Water Sector in Context
More than 400 retail utilities are classified by the state as urban water suppliers. Here we describe the sector in terms of population served, utility governance structures, water use, and drought impacts.
Population served: Urban utilities―each serving at least 3,000 homes and businesses, and usually many more―supply water to about 93 percent of the state’s population. The rest of the population is supplied by roughly 2,500 small, principally rural community water systems serving between 15 and 3,000 customers, or by very small water systems or domestic wells (State Water Resources Control Board 2015c and 2015d).
Governance: Most urban retailers (83%) are local public agencies. About half are city or county water departments, governed by city councils or county supervisors (or their appointed boards). A third are special districts governed by publicly elected boards. The remaining 17 percent are run by private investor-owned utilities (IOUs). Some IOUs have multiple service areas, which are considered distinct retail suppliers under state urban
5 We use the terms utilities and suppliers interchangeably to refer to local urban water supply systems, including the individual service areas of investor-owned utilities that own and operate multiple service areas. We use the term agency only when referring to a retail or wholesale utility that is a public agency. 6 Technical Appendix A presents details of the analysis of all urban suppliers, Technical Appendix B presents the results of the survey, and Technical Appendix C presents the results of the analysis of water savings in the Cal Water system.

PPIC.ORG/WATER Building Drought Resilience in California’s Cities and Suburbs 7
water planning laws. About half of all urban retailers receive a portion of their water supplies from wholesale water utilities. Roughly two dozen utilities only provide wholesale services. The largest of these—the Metropolitan Water District of Southern California―serves roughly half the state’s population across six counties. A similar number of utilities provide both retail and wholesale services―for example, San Francisco’s water department sells water to retailers in much of Silicon Valley (Technical Appendix B).
Key state agencies involved in urban water system oversight and policy include the State Water Board (water rights administration, water quality enforcement), the Department of Water Resources (DWR―water resources planning, operating the State Water Project), and the California Public Utilities Commission (CPUC―regulation of water rates for private utilities). DWR and the State Water Board administer state matching grant and loan programs for local water projects. The State Water Board administered the state conservation mandate and other drought-related regulations in cooperation with the CPUC.
Water use: The Department of Water Resources estimates that on average, the urban sector used 10 percent of the state’s water supplies between 1998 and 2010. This includes all residential and non-farm business use in urban and rural communities. About half of urban water use was for landscape irrigation. The agricultural sector used 40 percent, and the remaining 50 percent was allocated for environmental purposes such as water quality, wild and scenic rivers, and protection of aquatic species. The environmental water share is volatile because it depends mainly on surface water flows; it is much higher in wet years and much lower in dry years (Mount and Hanak 2016).
Drought impacts: Although many urban water suppliers experienced challenges during this drought, none faced dry taps. In contrast, some economically disadvantaged rural communities that rely on shallow wells lost their supplies as groundwater levels fell. The state provided emergency supplies, and programs are underway to establish long-term solutions, including connecting some communities to urban water systems. Agriculture experienced large declines in surface water deliveries. Farmers adapted by pumping extra groundwater, reallocating available surface water through water trades, and fallowing some cropland. California’s riverine and wetland ecosystems were under extreme stress, with low flows and high water temperatures harming fish and wildlife in many watersheds.7
7 See Hanak et al. (2015) for a review of drought impacts in different sectors.

PPIC.ORG/WATER Building Drought Resilience in California’s Cities and Suburbs 8
Box 1. The Language of Urban Drought Management
The terminology used to describe urban drought management is not always consistent, and sometimes results in ambiguity in policy discussions. Here we describe some key concepts.
Drought resilience: The basic goal of urban drought management is to avoid significant economic and social disruptions to businesses and residents—in effect, an insurance policy. Utilities aim to achieve this goal through a combination of two approaches: supply investments that reduce the risk of extreme water shortages (such as storage or infrastructure to connect water systems with different supplies), and emergency demand management measures to reduce water use (e.g., restrictions on outdoor water use, higher prices for high levels of water use). Utilities combine these approaches since it would generally be too costly to fully “drought-proof” the system with supply investments alone, or to rely entirely on reducing water use to get through a severe or prolonged drought. Conspicuously absent from many discussions of urban drought resilience are terms relating to utilities’ fiscal well-being, an issue we discuss later in the report.
Water supply portfolios: Most urban utilities have strategies to diversify their water sources that consider both reliability and cost. Utilities are sometimes willing to pay a higher price for supplies that are more reliable during droughts (e.g., surface storage and interconnections, recycled water, or seawater desalination). This evokes the parallel with financial portfolios, which combine different types of investments in an effort to maximize return within an acceptable range of risk.
Demand management: Strategies to reduce customer water use fall into two broad categories: Long-term or “structural” demand management involves durable reductions in
water use—for example, through the adoption of low-flow plumbing fixtures and appliances or low-water landscaping. Because this water savings can make water available for other uses, utilities often treat it as though it were a supply source in their long-term plans.
Short-term or “emergency” demand management involves water savings in response to supply shortages, and is a key component of utilities’ drought resilience strategies. Utilities’ water shortage contingency plans typically ramp up savings as droughts progress, starting with calls to limit outdoor water use, followed by voluntary savings targets, and then mandatory savings. Although restrictions are temporary, some savings can be durable if customers invest in long-term changes.
The term conservation is often used to refer to both types of demand management, but water professionals sometimes reserve it for short-term water savings and use the term water use efficiency for long-term savings. Rationing is also used to describe short-term voluntary and mandatory demand management programs.

PPIC.ORG/WATER Building Drought Resilience in California’s Cities and Suburbs 9
Policies and Precedents from Past Droughts
Several droughts since the 1970s resulted in local suppliers substantially improving their drought preparedness (Figure 1). At first, the state’s primary roles were to encourage and support local planning and investments and improve the ability to get water where it was most needed using voluntary water trading and exchanges. In 2009, the state shifted gears and adopted a more hands-on approach to urban water use, requiring local suppliers to set long-term conservation targets. Here we summarize key policies and precedents from modern droughts.
FIGURE 1 Past droughts resulted in state and local policies and actions
SOURCE: Developed by the authors from various sources. NOTES: UWMP is urban water management plan. WSCP is water shortage contingency plan. Proposition 50 authorized $3.4 billion for water-related purposes, including $450 million for integrated regional water management and $655 million for local water supply projects. Proposition 84 authorized $5.4 billion for water-related purposes, of which $1 billion was for integrated regional water management projects (Chappelle et al. 2014).Water savings rates are for the urban sector. Central Coast savings during the 1987–92 drought is for 1990.
1976–77: A Wake-up Call This was the first major drought widely experienced by urban California, coming at a time when about 90 percent of the state’s population resided in cities and suburbs.8 It was a wake-up call that changed how state policymakers and urban water managers thought about water. It exposed the inadequacy of past water supply planning and highlighted the need for more supply diversification, interconnection, and cooperation among water suppliers. It showed that water conservation is practical and effective. It demonstrated that transfers and exchanges can help mitigate the worst effects of drought, and illuminated the need to reform water rights law to facilitate such exchanges.
8 Author calculations using information from the US Census Bureau.

PPIC.ORG/WATER Building Drought Resilience in California’s Cities and Suburbs 10
Local response: Local suppliers across the state instituted voluntary conservation programs, and those in all the major communities in Northern California imposed some form of mandatory rationing.9 Statewide, urban per capita water use fell by 21 percent between 1976 and 1977 (Department of Water Resources 1978). The response was strongest in the most drought-impacted communities—for example, the Sierra foothills reduced per capita water use by 68 percent, while the Bay Area averaged 32 percent savings. Southern California, which had access to more diverse supplies, was able to transfer surplus water to communities in the Bay Area and to San Joaquin Valley farmers, which helped mitigate drought impacts in those regions.10
State response: State legislation enacted in the wake of this drought promoted improved water supply planning measures—including the first indoor water use efficiency standards (Box 2), as well as laws to facilitate the development of a water market.11 California also institutionalized urban water supply, demand, and conservation planning with the passage of the Urban Water Management Planning (UWMP) Act in 1983. This law required all urban water suppliers with more than 3,000 customers or supplying more than 3,000 acre-feet of water annually to prepare an urban water management plan by the end of 1985, and to update this plan every five years. The UWMP Act has since been amended 20 times and continues to be the primary policy tool by which the state monitors and guides urban water supply planning. Initially, the act’s only “teeth” were the prospect of lawsuits for non-compliance filed by citizen groups. As described below, over time the state has also added financial incentives to encourage compliance—by making grant funding conditional on plans satisfying the act’s requirements—as well as the prospect of state sanctions for non-compliance (Hanak 2010).
9 Much like today, mandatory conservation generally required either a mandated percent reduction from the previous year’s use; or a quota, usually expressed in gallons per day per person or per household; as well as restrictions on non-essential uses and limitations on landscape watering (Department of Water Resources 1978, p.105). 10 Metropolitan Water District and three other Southern California State Water Project (SWP) contractors made available 435,000 acre-feet of their SWP water for San Joaquin Valley agriculture and urban suppliers in the San Francisco Bay Area. Recipients included the Marin Municipal Water District, which was served via an emergency pipeline across the San Rafael Bridge (Department of Water Resources 2015). 11 After the drought, the governor established a commission to review California water rights law. Among other things, the commission advocated changes in the California Water Code to facilitate transfers, notably provisions to ensure the security of water rights for parties leasing water to others and to ensure access to the use of conveyance facilities owned by other parties. Many of the recommendations were accomplished in the years that followed (Hanak and Stryjewski 2012).
Box 2. Droughts Have Prompted Water-Efficiency Standards
California has been a leader in promoting water use efficiency standards for indoor plumbing fixtures and appliances since the 1976–77 drought. Starting in 1978, state law required toilets to use no more than 3.5 gallons per flush (gpf), compared to 5–7 gpf that was typical before this law. Following changes made during the 1987–92 drought, toilets and urinals could not exceed 1.6 and 1.0 gpf, respectively. Other states adopted similar requirements. The patchwork of state-specific regulations was rationalized with the passage of the federal Energy Policy Act in 1992, which adopted the California standards.
Today, California has the most stringent water efficiency regulations in the nation for plumbing fixtures. New toilets and urinals cannot use more than 1.28 and 0.125 gpf, respectively. Showerheads are limited to 2.0 gallons per minute (gpm); this will go to 1.8 gpm in 2018. Bathroom, kitchen, and public lavatory faucets cannot use more than 1.2, 1.8, and 0.5 gpm, respectively. The state has also aggressively pushed for more stringent water efficiency standards for clothes washers, which are set under the authority of the federal Energy Policy Act. A typical residential clothes washer made in the 1990s used about 12 gallons per cubic foot of capacity. In 2015, the allowable use for top- and front-loading residential washers was reduced to 8.4 and 4.7 gallons, respectively. In 2018, the maximum use for top-loading residential washers will be reduced again to 6.5 gallons.
These efficiency requirements have resulted in new and remodeled homes having a much smaller “water footprint” than older homes and, along with utility-sponsored retrofit programs, have been key to driving down the state’s indoor residential water use.

PPIC.ORG/WATER Building Drought Resilience in California’s Cities and Suburbs 11
1987–92: Transfers, Conservation, and Recycling This was the longest drought to hit California since the 1930s. It resulted in water transfers, conservation, and recycling becoming fundamental elements of urban water planning and management in California. Before this, conservation and transfers were viewed as short-term strategies during periods of shortage, and recycling was thought to be impractical and expensive. They were now seen as integral to long-term reliability.12
Local response: As with the prior drought, the Bay Area experienced large urban shortages. This time around so did the entire Central Coast.13 Supplies from the Colorado River and the State Water Project mostly protected Southern California during the first four years. But by 1991, urban water shortages became widespread. Urban per capita water use was reduced by an average of 19 percent between 1987 and 1991, with the largest reductions in the Central Coast and the Bay Area.14 More than 70 percent of urban water suppliers imposed mandatory quantity and type-of-use restrictions (such as limits on landscape watering). Nearly all urban water suppliers implemented public education programs and provided water conservation kits to customers—including items like free low-flow showerheads, toilet dams, and toilet leak detectors—and about one-third offered customer water audits and incentives for ultra-low-flow toilets (Dixon et al. 1996).
State response: One focus of state action was on expanding water trading, to move water to where it was needed most. This included launching a drought water bank, in which DWR served as a broker between willing buyers and sellers. The water bank made available more than half a million acre-feet of water to urban and agricultural suppliers in 1991 (Department of Water Resources 2015). DWR also brokered trades to get water to wildlife refuges (Hanak and Stryjewski 2012). Urban suppliers that wanted to buy water were required to show that they had a critical need for it and adopt a rationing level of at least 25 percent.15
The state also promoted stronger water planning and drought preparation by urban suppliers. In 1991, this included several key modifications to the UWMP Act. Assembly Bill (AB) 11X extended the act’s requirements to wholesale water suppliers and required urban water suppliers to develop water shortage contingency plans and submit them to the state. Significantly, this law introduced the first carrot for UWMP compliance, by making eligibility for state drought assistance conditional on the adoption and submittal of these plans. AB 1869 expanded the planning and reporting requirements pertaining to water conservation and recycling programs. The legislature also passed the Water Recycling Act of 1991, which set ambitious goals for expanding the reuse of highly treated wastewater.16
Joint responses: Meanwhile, urban water suppliers and environmental interest groups worked together to develop new guidelines for conservation programs. The Memorandum of Understanding Regarding Urban Water Conservation in California (MOU), adopted in 1991, established the California Urban Water Conservation Council and the urban water conservation best management practices (BMPs). These BMPs would guide the development and implementation of urban water conservation programs in California for the next 20 years. The
12 For instance, the 1991 Memorandum of Understanding Regarding Urban Water Conservation in California (MOU), described below, states that water conservation best management practices (BMP) “are intended to reduce long-term urban demands … and are in addition to programs which may be instituted during occasional water supply shortages... It is the intent of this MOU that individual signatory water suppliers (1) develop comprehensive conservation BMP programs using sound economic criteria and (2) consider water conservation on an equal basis with other water management options.” 13 In the 1976–77 drought, urban areas in Santa Cruz and Monterey Counties were hard hit, but communities to the south in San Luis Obispo, Santa Barbara, and Ventura Counties were able to get by with rationing of 15 percent or less, according to DWR data. This was emphatically not the case in the 1987–91 drought. The City and County of Santa Barbara experienced severe water shortages in 1990 and 1991. A state of emergency was declared in the county in 1990. The City of Santa Barbara imposed a 14-month ban on lawn watering and constructed an emergency desalination facility (Department of Water Resources 2015). 14 In the Bay Area, for instance, the average reduction was 27 percent, versus 16 percent in Southern California, which had more diverse and reliable supplies (Dixon et al. 1996). 15 Personal communication with Tim Quinn, executive director of Association of California Water Agencies, January 17, 2017. 16 The act called for one million acre-feet of recycled water by 2010—equivalent to about 12 percent of total urban water use. By 2010, roughly a third of that goal had been met according to DWR data. This number is likely higher today in light of recent investments in this resource, particularly in Southern California.

PPIC.ORG/WATER Building Drought Resilience in California’s Cities and Suburbs 12
legislature amended the UWMP Act in 1993 to formally incorporate the BMPs (AB 892). To bolster conservation efforts, the state also adopted new water-efficiency standards for toilets and showerheads (Box 2).
Following this drought, local suppliers undertook major investment programs to diversify their water supply portfolios, and began teaming up to use “integrated regional water management” approaches and investments, such as regional storage projects and interconnections to facilitate supply sharing. The state encouraged these investments with matching grants, made available through a series of voter-approved general obligation bonds (Hanak et al. 2011, 2014). An amendment to the UWMP Act in 2001 added financial incentives for complying with that law by making receipt of bond funding contingent on the submission of a plan that addressed all required elements of supply and demand planning. This change significantly increased local supplier compliance with the law (Hanak 2010).
2007–09: Delta Reforms and Conservation Targets While not as severe hydrologically as the two previous droughts, this one brought the imposition of new export restrictions in the Sacramento–San Joaquin Delta—the hub for moving Central Valley Project (CVP) and State Water Project (SWP) water from the state’s high mountain watersheds to distant farms and cities.17
Reduced allocation of water for the environment in the Delta during the prior drought contributed to sharp declines in several native fish populations, and resulted in measures to increase flows to support these species during the 1990s.18 Continued fish population declines prompted court-ordered revisions of the Endangered Species Act requirements governing CVP and SWP exports in 2008. The Congressional Research Service estimated that environmental water requirements in the Delta were directly responsible for 20–25 percent of the reduction in Delta exports in 2009.19 These pumping restrictions also limited the ability to trade water, which had been an important drought management tool during the prior drought (Hanak and Stryjewski 2012).
Local response: In contrast to some rural communities in the San Joaquin Valley, urban suppliers were much better positioned going into this drought and came through it without much difficulty.20 Most communities did not impose quantity and type-of-use restrictions. Those that did mostly used voluntary restrictions, and the requested level of cutback was generally 10–15 percent.21
State response: Despite urban suppliers’ relatively good position, a major policy change arose from this drought that affects urban water use today. As part of a package of reforms primarily aimed at resolving Delta conflicts, the legislature passed Senate Bill (SB) X7-7, the Water Conservation Act of 2009. This law amended the UWMP Act to require urban water suppliers to reduce per capita water use by 20 percent by 2020 relative to a 10-year
17 For hydrologic details of the droughts discussed in this report, see Department of Water Resources (2015). 18 This included the passage of the 1992 Central Valley Project Improvement Act, a federal law that designated 600,000 to 800,000 acre-feet per year for environmental purposes. In 1995, the State Water Board adopted Water Rights Decision D-1641, which implemented new Delta outflow requirements to protect fish and wildlife and meet Delta water quality objectives for agricultural and urban uses. Although these laws reduced water available for some water users (particularly farmers on the west side of the San Joaquin Valley receiving CVP water), their net effect is uncertain (Hanak et al. 2017). Total exports were higher in many years during the 2000s as compared with the 1990s (Mount et al. 2016b, Cody et al. 2015). 19 See Cody et al. (2015). In its digest of the 2007–09 drought, DWR noted that “2007–09 marked a period of then-unprecedented restrictions in CVP and SWP diversions from the Delta to protect listed fish species, a regulatory circumstance that exacerbated the impacts of the hydrologic drought” (Department of Water Resources 2015, p. 59). 20 Communities connected to agriculture along the west side of the valley experienced significant impacts, resulting in the first-ever state emergency proclamation linking drought with the provision of social services (Department of Water Resources 2010). 21 See Department of Water Resources (2010), Table A-1.

PPIC.ORG/WATER Building Drought Resilience in California’s Cities and Suburbs 13
historical baseline.22 The carrot of state financial support for UWMP compliance switched to a regulatory stick: water suppliers not meeting their targets by January 1, 2021 could jeopardize their water rights.23
SB X7-7 ushered in an era of urban water use targets in California and fundamentally changed the relationship between urban water suppliers and state regulatory agencies. Previously, urban water suppliers were encouraged to incorporate conservation measures in their long-term plans, but they were left to their own devices to manage customer water demands. After SB X7-7, the state became an active participant in these decisions. This law paved the way for the state conservation mandate in 2015. It was also the forerunner to new long-term urban water use targets being developed by DWR and the State Water Board (State of California 2017).
Policy Evolution in the Latest Drought
For the urban sector, state and local responses to this latest drought can be divided into four distinct phases: (1) the lead-up covering the span of time since the last major drought; (2) initial responses as this drought unfolded (covering 2012 to early 2015), including Governor Brown’s official declaration of a drought emergency in January 2014; (3) the state conservation mandate period (June 2015 to May 2016), and (4) the self-certification period—when the state authorized retailers with adequate supplies to revert to locally developed conservation standards (running from June 2016 to April 2017, the official end of the drought emergency). Each phase is important for understanding how the drought and related policies affected urban water suppliers and their customers.
Lead-up to the Drought Despite the addition of 9 million new residents since the early 1990s, the state’s large urban water systems were better prepared for this drought thanks to significant investments in conservation, storage, new supplies, and interconnections that enable supply sharing.24 To summarize:
San Francisco Bay Area: The region’s water suppliers completed a range of infrastructure projects to bolster regional reliability, including the Freeport Intake project that allows water from the Sacramento River to flow to the Bay Area in dry years; Los Vaqueros Reservoir (completed in 1998 and expanded in 2012); interconnections between East Bay Municipal Utility District, Contra Costa Water District, San Francisco Public Utilities Commission, and Santa Clara Valley Water District; and investments in conservation, groundwater banking, water recycling and advanced purification projects (Bay Area Regional Reliability n.d.).
Southern California: This region was already more resilient in prior droughts because of a diverse set of water supplies and a highly interconnected water delivery network. Investments since the early 1990s built on these assets. Metropolitan Water District—wholesale water supplier to much of the region—increased storage more than 13-fold with the construction of Diamond Valley Lake and development of numerous underground storage projects (Metropolitan Water District of Southern California 2016). The agency also spent nearly a billion dollars on conservation, recycled water, and groundwater recovery projects. Local water suppliers also invested heavily. Southern California utilities also entered long-term and permanent
22 Under certain circumstances, a supplier could adopt a 15-year historical baseline. 23 Non-compliant suppliers could be found in violation of the law for purposes of any state administrative or judicial proceeding, such as a water rights hearing. See Water Code §10608.4(k)(2). 24 On the order of $20 billion has been spent for drought-resilient local supplies over the past 25 years, according to Tim Quinn, executive director of the Association of California Water Agencies (Reese and Sabalow 2016).
PPIC.ORG/WATER Building Drought Resilience in California’s Cities and Suburbs 14
transfer agreements with irrigation districts to improve reliability and accommodate population growth (Hanak and Stryjewski 2012). The result is that the region’s water supply is more diverse and drought resilient. The change in Irvine Ranch Water District’s supply portfolio is a good example. In 1990, 66 percent of its supply was imported and the rest came from local surface water (10%), groundwater (9%), and recycled water (14%). By 2013, 78 percent of its supply came from local surface water (3%), groundwater (50%), and recycled water (25%), with direct imports accounting for just 22 percent.25
Central Coast: Communities in this region invested heavily in conservation and recycling, and some, including Santa Barbara and San Luis Obispo, connected to the SWP. Both Santa Barbara and San Luis Obispo have incorporated reliability goals into their water supply planning. San Luis Obispo went a step further, by explicitly defining a reliability reserve—a portion of its water supply that is set aside for dry conditions or other water supply emergencies. The reliability reserve concept is incorporated into the city’s charter (Section 909) which states that the water may not be used to serve future development.
San Joaquin Valley: Many communities in the region have implemented conservation best management practices. Additionally, the number of unmetered service connections in this region has been greatly reduced since the 1987–92 drought. Communities such as Fresno and Clovis have partnered with local irrigation districts to store groundwater reserves for drought. Others have partnered with irrigation districts to fund system efficiency upgrades and long-term water transfers (Hanak and Stryjewski 2012).
Northern California: In the Sacramento region, local suppliers formed a regional joint powers authority to manage groundwater reserves and protect flows in the American River. As part of this agreement, these utilities also committed to implementing a comprehensive water conservation plan. They are now embarking on the Sacramento River Regional Water Reliability Project (2015), involving utilities throughout the Sacramento area in collaboration with the US Bureau of Reclamation. The project is intended to enhance water supply diversity and reliability on a regional scale, increase the sustainability of regional groundwater supplies, and improve environmental protection in the American River watershed.
Our survey of urban suppliers (detailed in Technical Appendix B) found that most had adopted multiple long-term supply reliability strategies prior to the onset of the drought (Figure 2). Long-term demand management—using rebates, information campaigns, and pricing to encourage durable reductions in indoor and outdoor water use—was the most commonly reported strategy, used by more than 80 percent of all suppliers. Retailers and their regional wholesalers often implemented supply reliability programs jointly. Wholesalers also had major roles in regional water transfers, surface storage, supply-related partnerships, and desalination. Southern California suppliers reported implementing more strategies than suppliers in other regions, as did larger suppliers compared to smaller ones, though this latter finding is attenuated by the fact that many smaller suppliers are members of wholesale networks that jointly invest in these types of projects.26
25 Irvine Ranch Water District (2014). Nineteen percent of groundwater supplies are from “reclaimed” groundwater, involving treatment of groundwater that would otherwise be too salty or polluted to use. Because imported water is also used to replenish regional groundwater resources, the total amount of imported water the district depends upon is greater than 22 percent. However, this banked water is more drought-resilient than direct imports, which vary more with the hydrologic conditions. 26 See technical appendix Table B4 and related discussion.

PPIC.ORG/WATER Building Drought Resilience in California’s Cities and Suburbs 15
FIGURE 2 Local suppliers and their wholesalers implemented a variety of long-term reliability strategies before the drought
SOURCE: PPIC Survey of Urban Water Suppliers 2016 (for details, see technical appendix Table B4).
NOTE: Headwaters investments involve protecting headwater catchment areas to increase water supply or improve its quality.
Long-term demand management programs have contributed significantly to the long-term decline in urban per capita water use that began in the 1990s.27 In 2010, average urban daily water use was 178 gallons per capita, down from 220 in 2000.28 Most of the long-term gains in water efficiency have been indoors, aided by the adoption of low-flow plumbing fixtures and appliances.29
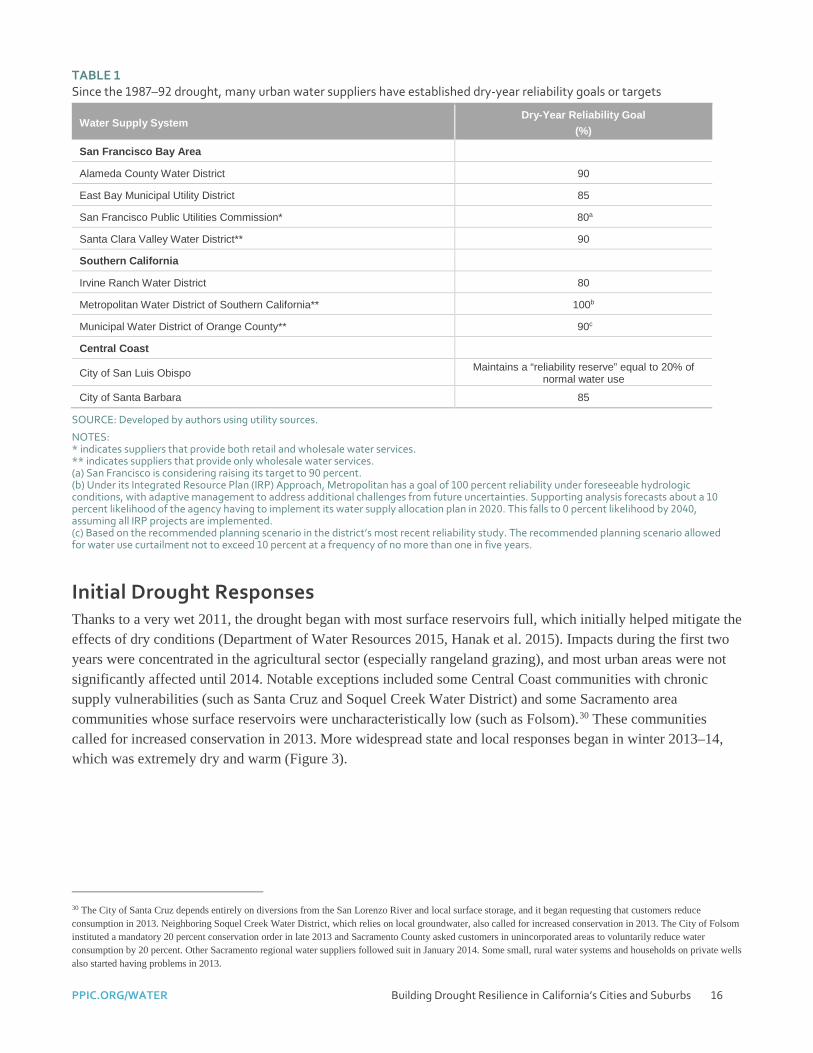
Thus, by the start of the drought in 2012, many urban water systems had diversified their water supply portfolios, made significant investments in dry-year storage and banking programs, and established multi-faceted water conservation programs with dedicated staffing. Many had also adopted dry-year reliability goals or targets to guide these investments. These reliability goals vary from system to system, but typically aim to limit the need for short-term demand management (or rationing) during drought to no more than 20 percent (Table 1).
27 Over this period the urban economy also has become less dependent on water-intensive industries. Some activities that require a lot of water, such as computer chip manufacturing, have moved out of state, and manufacturing now uses only 6 percent of urban water, down from 8 percent in 1990. Overall, businesses have been reducing water use while continuing to grow. In 2014, water used by cities generated more than three times the economic value per gallon than it did in 1967, measured by output of goods and services in inflation-adjusted dollars (Hanak et al. 2016). 28 This comparison is between two average rainfall years, using DWR estimates of actual water use (Hanak et al. 2016). Per capita water use in the mid-1990s may have been higher than in 2000, but the comparison is not as valid, as the available data are “normalized” rather than actual use estimates. 29 Since the mid-1990s, indoor household water use in North America has decreased by about 22 percent on average, according to the latest residential end-use study (DeOreo et al. 2016). This study includes sites in California.
PPIC.ORG/WATER Building Drought Resilience in California’s Cities and Suburbs 16
TABLE 1 Since the 1987–92 drought, many urban water suppliers have established dry-year reliability goals or targets
Water Supply System Dry-Year Reliability Goal
(%)
San Francisco Bay Area
Alameda County Water District 90
East Bay Municipal Utility District 85
San Francisco Public Utilities Commission* 80a
Santa Clara Valley Water District** 90
Southern California
Irvine Ranch Water District 80
Metropolitan Water District of Southern California** 100b
Municipal Water District of Orange County** 90c
Central Coast
City of San Luis Obispo Maintains a “reliability reserve” equal to 20% of normal water use
City of Santa Barbara 85
SOURCE: Developed by authors using utility sources.
NOTES: * indicates suppliers that provide both retail and wholesale water services. ** indicates suppliers that provide only wholesale water services. (a) San Francisco is considering raising its target to 90 percent. (b) Under its Integrated Resource Plan (IRP) Approach, Metropolitan has a goal of 100 percent reliability under foreseeable hydrologic conditions, with adaptive management to address additional challenges from future uncertainties. Supporting analysis forecasts about a 10 percent likelihood of the agency having to implement its water supply allocation plan in 2020. This falls to 0 percent likelihood by 2040, assuming all IRP projects are implemented. (c) Based on the recommended planning scenario in the district’s most recent reliability study. The recommended planning scenario allowed for water use curtailment not to exceed 10 percent at a frequency of no more than one in five years.
Initial Drought Responses Thanks to a very wet 2011, the drought began with most surface reservoirs full, which initially helped mitigate the effects of dry conditions (Department of Water Resources 2015, Hanak et al. 2015). Impacts during the first two years were concentrated in the agricultural sector (especially rangeland grazing), and most urban areas were not significantly affected until 2014. Notable exceptions included some Central Coast communities with chronic supply vulnerabilities (such as Santa Cruz and Soquel Creek Water District) and some Sacramento area communities whose surface reservoirs were uncharacteristically low (such as Folsom).30 These communities called for increased conservation in 2013. More widespread state and local responses began in winter 2013–14, which was extremely dry and warm (Figure 3).
30 The City of Santa Cruz depends entirely on diversions from the San Lorenzo River and local surface storage, and it began requesting that customers reduce consumption in 2013. Neighboring Soquel Creek Water District, which relies on local groundwater, also called for increased conservation in 2013. The City of Folsom instituted a mandatory 20 percent conservation order in late 2013 and Sacramento County asked customers in unincorporated areas to voluntarily reduce water consumption by 20 percent. Other Sacramento regional water suppliers followed suit in January 2014. Some small, rural water systems and households on private wells also started having problems in 2013.

PPIC.ORG/WATER Building Drought Resilience in California’s Cities and Suburbs 17
FIGURE 3 The latest drought brought a new round of policy changes and actions at the state and local levels
SOURCE: Developed by the authors from various sources.
NOTE: The figure’s four periods reflect state policies in force regarding urban water use: early drought actions (before the state called for savings), state-promoted conservation (when the state called for voluntary savings), state-mandated conservation, and self-certification (when suppliers could be relieved of the mandate if they could show adequate supplies).
Early State Actions In December 2013, the state formed an interagency drought task force to facilitate coordinated monitoring and rapid response to critical issues. By January 2014, reservoir levels were well below normal and the Sierra snowpack stood at just 20 percent of average. Governor Brown proclaimed a state emergency, calling on Californians to voluntarily reduce their water usage by 20 percent and directing urban water suppliers to immediately implement their water shortage contingency plans (Brown 2014a). These plans link requested cutbacks in water use to specific water supply conditions that are relevant for the utility, and are typically organized into four or five stages reflecting the risk and severity of a potential local water shortage.
The proclamation also directed the state’s drinking water program to assist communities in danger of running out of water.31 It also ordered the State Water Board and DWR to expedite water transfers.32 In March 2014, the legislature passed a $687 million drought relief bill, with most of the funds (88%) intended for projects to help cities and farms save water and make their water systems more drought-resilient (Hanak et al. 2015).
31 The initial list included 17 primarily small, isolated water systems (Mount 2014). As the drought continued, state and local officials and community groups expanded their ability to identify at-risk small water systems and residents served by dry domestic wells (Hanak et al. 2015). Emergency actions included trucking in water and drilling new or deeper wells. 32 Prior to this, in May 2013, the governor had issued Executive Order B-21-13 directing the State Water Board and DWR to expedite short-term water transfers and calling on the state and federal water projects to coordinate their operations to alleviate critical impacts to San Joaquin Valley agriculture.

PPIC.ORG/WATER Building Drought Resilience in California’s Cities and Suburbs 18
In April, following another disappointing snowpack survey, the governor proclaimed a continued state of emergency, and directed the State Water Board to adopt emergency regulations to curtail water rights where necessary—the first time this action was taken since the 1976–77 drought (Brown 2014b, Gray et al. 2015). This order also called on the board to issue regulations to prevent waste and unreasonable uses of water. The regulations prohibited a variety of wasteful uses of water, such as hosing down driveways, using non-recirculating fountains, and irrigating landscape to the point of excessive runoff.33 They also ordered urban water suppliers to implement water shortage contingency plans to a level where restrictions on outdoor irrigation were mandatory, and to start giving the state monthly reports on how much water was used in their service areas.
Local Water Savings Strategies and Responses Local suppliers began to activate their water shortage contingency plans and accelerate implementation of short-term demand management programs. Our survey asked suppliers to identify which, if any, of 13 actions to promote conservation and reduce customer water use they had taken in response to the drought before the statewide urban conservation mandate was announced. As described further below, most reported implementing multiple actions, with an average of nearly seven actions per supplier.34 The most common strategies, used by more than 80 percent of all suppliers, were BMP-based programs addressing indoor and outdoor conservation and messaging. A bit more than half employed some type of water use restriction. A similar proportion made adjustments to their water rates. And a quarter gave their customers water budgets—a water allotment that is sometimes linked to surcharges or penalties if the customer exceeds it.35
Statewide savings in the second half of 2014 were just half the amount requested by Governor Brown (Figure 4). But the savings varied both within and across regions, and our review of water supplier drought restrictions indicates that water savings were frequently in line with the reductions water suppliers were asking for based on their water supply contingency plans.36 This was especially true in the Sacramento region, the Bay Area, and the Central Coast, where savings averaged between 15 and 19 percent―much closer to the governor’s 20 percent goal. The lower savings rates in Southern California—averaging just 6 percent—brought down the statewide number. Southern California suppliers followed the landscape irrigation restrictions and water waste prohibitions required by the executive orders, but they were less likely to tie these requirements to percentage reduction targets than water suppliers elsewhere. As in the early years of the 1987–92 drought, Southern California’s more diversified water supplies and greater storage reserves allowed local suppliers to forestall asking customers for significant cutbacks in water use—a point water suppliers raised repeatedly in our Southern California focus group discussions.
33 Such restrictions have been staples of urban water waste ordinances since the 1976–77 drought and were already in effect in most areas. However, the governor’s emergency proclamations and the subsequent State Water Board regulations put a public spotlight on these restrictions. 34 For details, see Figure 9 in the next section. 35 In Southern California, budget-based tiered rate structures have become increasingly popular over the past decade. These rate structures define an efficient level of water use for the number of residents and landscape water needs of the customer, and charge higher rates when water use exceeds the budget. 36 Technical appendix Table A2 provides a sampling of water supplier conservation requirements and realized water savings for this period.

PPIC.ORG/WATER Building Drought Resilience in California’s Cities and Suburbs 19
FIGURE 4 Regional savings patterns varied with water supply conditions in the voluntary conservation period
SOURCE: Author calculations using State Water Board supplier data, dated January 4, 2017. For details, see technical appendix Table A2.
NOTES: Savings rates are calculated relative to the same period in 2013. Mean savings rates (shown as diamonds) are weighted by volume. A negative savings rate indicates water use increased relative to 2013. The San Joaquin Valley consists of the Tulare Lake and San Joaquin River hydrologic regions. North Coast and Mountains includes the North Coast and North Lahontan regions. Southern California includes the South Coast, South Lahontan, and Colorado River hydrologic regions. Water use data are not available for January through May 2014.
It is noteworthy that savings rates in this period were not correlated with per capita water use. Rather, savings depended on local water supply situations, and some utilities with low per capita use (such as those on the Central Coast) were in short supply relative to demands in their service areas. This would change with the introduction of the state conservation mandate, which divorced conservation requirements from water supply conditions and instead set targets solely on the basis of per capita use.37
The experience during this period reflects some tension between the two key parts of the governor’s emergency proclamation concerning urban water use: (1) that Californians voluntarily reduce their use by 20 percent and (2) that urban water suppliers immediately implement their water shortage contingency plans. In 2014, most suppliers implemented the first or second stage of their plans, requiring voluntary rather than mandatory conservation. The early stages of most plans implement restrictions on non-essential water uses (particularly outdoor water uses), but they do not always include explicit percentage savings goals. And in plans that do have such goals, they typically fall between 10 and 20 percent. By following their water shortage contingency plans, water suppliers adhered to the second of the two key requests made by the governor, but this also meant that the cutbacks they requested were often less than 20 percent.
37 See the discussion in Box 2 and Technical Appendix A.

PPIC.ORG/WATER Building Drought Resilience in California’s Cities and Suburbs 20
The State Conservation Mandate In April 2015, after a record-low snowpack survey, Governor Brown directed the State Water Board to impose a statewide 25 percent reduction in potable urban water use. This marked the first time that state authorities mandated a statewide reduction in urban water use.38 The State Water Board adopted emergency regulations that initially ran from June 2015 to February 2016, and then until May of that year.
Rather than require all water suppliers to reduce water use by 25 percent, the State Water Board adopted a sliding scale based on residential per capita water use in the summer of 2014 (Figure 5). Mandated reductions varied between 4 and 36 percent relative to water use in 2013, and they applied to all potable water delivered in the service area, including water used in the commercial, institutional, and industrial sectors. Targets above 30 percent were concentrated in the inland parts of the state where per capita water use rates are highest, largely because warmer temperatures and larger lot sizes contribute to higher outdoor water use (Hanak and Davis 2006). Coastal communities—including many of the state’s most populous urban areas—mostly had targets below 24 percent. Importantly, the targets did not take into account a supplier’s current supply conditions or prior actions to improve dry-year supply reliability, such as banking surface and groundwater or expanding recycled water use.39 This proved to be a point of contention between the State Water Board and urban water suppliers.
FIGURE 5 Higher conservation targets were concentrated in inland areas, where per capita use is higher
SOURCE: Author calculations using State Water Board Urban Water Supplier Final Targets for June 2015 to February 2016.
38 Although the state set a 25 percent rationing requirement for urban suppliers wishing to purchase water from the 1991 drought water bank, this was still voluntary, since suppliers could choose not to participate. 39 There was one exception: if a water supplier did not depend on groundwater or water imported from outside its hydrologic region and could demonstrate a minimum availability of four years of reserved supply, it could apply for a 4 percent target. Only four suppliers, all in the North Coast region, met these conditions.

PPIC.ORG/WATER Building Drought Resilience in California’s Cities and Suburbs 21
Rationales for the Mandate Based on the language introducing the mandate and our conversations with state officials, we find three principal rationales for the state taking this unprecedented step: insuring against the consequences of a longer drought, reallocating water to those in need, and changing social norms on water use to encourage long-term conservation.
Insuring against the consequences of a longer drought
The foremost concern was that urban suppliers were not fully taking into account the risk that the drought might continue for several more years—similar, say, to Australia’s decade-long Millennium Drought—and would find themselves in trouble down the road. As one official we spoke with noted:
“There was not a good way for the state to easily track implementation of the water shortage contingency plans by 400-plus agencies, so we viewed the 10 percent voluntary reduction as the agencies falling short of what was needed.”
State officials emphasized their concerns regarding small- and medium-sized suppliers, but also noted that larger suppliers were drawing down reserves at what they considered to be imprudent rates. The emergency regulation emphasized water conservation—particularly for outdoor uses—as a relatively inexpensive form of drought insurance:
“In many areas, 50 percent or more of daily water use is for lawns and outdoor landscaping. Outdoor water use is generally discretionary, and many irrigated landscapes will survive while receiving a decreased amount of water…Water conservation is the easiest, most efficient and most cost-effective way to quickly reduce water demand and extend supplies into the next year, providing flexibility for all California communities.” (State Water Resources Control Board 2015b)
State officials also noted that they had heard from some local water managers who wanted to implement more stringent rationing but couldn’t because of local political factors, including opposition from their elected boards. Making rationing mandatory removed these barriers.
Reallocating water to those in need
Another justification was the idea that “we’re all in this together”—that if some parts of the state or some sectors were experiencing difficult drought impacts, everyone should make an effort to conserve.
“…dry conditions and lack of precipitation present urgent problems to drinking water supplies and cultivation of crops, which put farmers’ long-term investments at risk. The conditions also threaten the survival of animals and plants that rely on California’s rivers, including many species in danger of extinction….Many California communities are facing social and economic hardship due to this drought. The rest of us can make adjustments to our water use, including landscape choices that conserve even more water.” (State Water Resources Control Board 2015b)
Although the implication is that urban conservation could help other communities or the environment, the mandate did not explicitly call for the reallocation of saved water, and state officials we spoke with gave mixed views regarding the importance of this rationale. Some noted the potential benefits, while others considered these as limited, given that the urban sector uses just a quarter as much water as agriculture does. Agricultural water deliveries were reduced during the drought, but this sector was not subject to a similar savings mandate, reflecting the Brown administration’s perception that urban water savings were less costly to the economy.40
40 In explaining the decision not to impose a conservation mandate on the farm sector, Governor Brown stated: “They’re not watering their lawn or taking long showers. They’re providing most of the fruits and vegetables of America to a significant part of the world” (Neese 2015).

PPIC.ORG/WATER Building Drought Resilience in California’s Cities and Suburbs 22
Changing social norms on water use
Some state officials also saw an opportunity to make permanent inroads into cutting outdoor water use, which accounts for about half of all urban water use in California. As the emergency regulation noted:
“When conservation becomes a social norm in a community, the need for enforcement is reduced or eliminated.” (State Water Resources Control Board 2015b).
The mandate’s structure—with higher savings requirements for communities with higher per capita residential use—was consistent with this goal, as was a state program to fund the replacement of lawns with low-water landscapes.41 This goal was also reflected in the emphasis on “making conservation a way of life” as the first of ten goals outlined in the administration’s California Water Action Plan, released soon after the drought emergency declaration (State of California 2014).
As we will see, the mandate was more successful at meeting some of these objectives than others, and the experience offers lessons for state and local policy going forward.
Self-Certification In May 2016, following a near-normal winter and improved water storage conditions, the State Water Board replaced the conservation mandate with a self-certification process. This allowed suppliers to opt out of state-mandated conservation targets, provided they could demonstrate they had supplies adequate to carry them through at least three more years of drought without mandatory rationing. The board likened the policy to the Federal Reserve’s stress tests of banks following the financial crisis of the late 2000s. The new standards were in effect from June 2016 until the drought emergency was lifted in April 2017.
The new regulation was similar to the state’s approach in previous droughts—where it was left to local suppliers to set rationing levels for their systems—but with two key differences. First, water suppliers had to justify their new standard, which the board could reject in cases of deficiency. Second, self-certifications were immediately made available to the public. The reporting requirements and public disclosure were intended to discourage suppliers from relaxing conservation standards unless there was strong justification for doing so.42
Water suppliers could opt out of self-certification by continuing to be subject to the state mandate. Only 8 percent chose this alternative―mostly along the Central Coast and in the San Joaquin Valley.43 A similar share of suppliers (9%) self-certified, but maintained some level of mandated conservation. Most suppliers (83%) elected to have no mandated reductions—although they generally maintained voluntary conservation targets.
We now review how water suppliers and their customers responded as the drought unfolded, starting with the introduction of the state mandate, a unique feature of this drought.
41 Concurrently with the mandate, DWR was ordered to implement programs to replace 50 million square feet of lawns—about 1,150 acres—with drought tolerant landscapes. Water savings would, at most, amount to 5,000 acre-feet annually, or approximately 0.1 percent of total annual urban water use. As described below, water suppliers across the state also implemented turf-replacement programs. Given the limited near-term savings these programs entailed, catalyzing a long-term shift in landscape preferences seems a more likely objective than providing immediate drought relief. 42 As part of this process, urban water wholesalers—which were not directly subject to the state’s conservation mandate—were required to report expected supplies and deliveries for three more years of drought. 43 Private (investor-owned) utilities were more likely to self-certify than public agencies, as were communities with higher median household incomes, but we did not find differences related to utility size or membership in a wholesale network (Technical Appendix A).

PPIC.ORG/WATER Building Drought Resilience in California’s Cities and Suburbs 23
Local Responses and Reactions to the State Mandate
The drought itself led to wide-ranging impacts and responses at the local level. For instance, nearly 80 percent of all urban water suppliers responding to our survey experienced some adverse physical effects, including reduced availability of one or more supply sources (71%), water quality problems (40%), infrastructure management difficulties or damage (21%), water theft (18%), and a variety of challenges in managing other services such as wastewater and watersheds.44
In the initial years, urban suppliers implemented a combination of supply- and demand-side strategies to address water shortages, including tapping drought reserves and requesting near-term savings from their customers. The mandate caused many suppliers to shift gears and focus more heavily on managing demand.
Widespread Water Savings The mandate’s effect on urban water use was significant and immediate. The uptick in water savings began in April 2015—immediately following Governor Brown’s executive order, and two months before the emergency water conservation regulations took effect (Figure 6). The aggregate savings rate for June 2015 to February 2016 was 24 percent, just shy of the 25 percent the governor ordered. Cumulative water savings over this period were roughly two and a half times the savings for the same period one year prior.45 Savings rates increased in all regions, and the gap narrowed between regions.46
As in past droughts, most savings came from reducing landscape irrigation. Under the mandate, the usual peak in summer use was substantially lower (Figure 7). Detailed analyses of water savings patterns confirms the role of outdoor water savings at both the supplier and customer level (Box 3). Within Cal Water’s 24 service areas, for example, the highest savings rates were realized by single-family residential customers and the governmental customer class, which have high water use for landscapes (including public spaces such as parks, schools, and roadway medians). Cal Water’s single-family households saved proportionately more water when they had larger landscaped areas. Similar patterns were observed statewide: suppliers with higher ratios of outdoor to indoor use saved more, as did suppliers with a higher residential share of total water use. Consistent with these findings, survey respondents ranked outdoor water conservation as the most effective of all supply and demand management strategies used to respond to the drought.47
44 See technical appendix Figure B9 and related discussion. In follow-up workshops with survey respondents it became clear that reports of shortages from particular water sources did not necessarily mean that their overall system was in shortage. 45 Cumulative savings from June 2015 to February 2016 were 1.12 million acre-feet (maf), versus 0.46 maf the year prior. 46 From June 2015 to February 2016, savings by hydrologic region ranged from 20 to 30 percent (technical appendix Table A2). 47 The survey asked water suppliers to select the three most and least effective supply and demand management strategies that they or their wholesaler implemented. Outdoor conservation was the top ranked strategy (most effective for 39% of respondents, least effective for just 5%), followed by information campaigns (most effective for 35%, least effective for 9%) (technical appendix Figures B11–B13).

PPIC.ORG/WATER Building Drought Resilience in California’s Cities and Suburbs 24
FIGURE 6 Urban water use dropped rapidly after adoption of the conservation mandate
SOURCE: Author calculations using data from the State Water Board (see technical appendix Figure A3).
NOTES: The figure shows an annual moving average of per capita water use—calculated as the average use in the month shown and the preceding 11 months. This is a way of presenting monthly trends without the influence of seasonal variations in water use. Northern California includes the North Coast, North Lahontan, and Sacramento River hydrologic regions; San Joaquin Valley includes both the San Joaquin River and the Tulare Lake regions; and Southern California includes the Colorado River, South Coast, and South Lahontan regions.
FIGURE 7 The state conservation mandate resulted in less outdoor water use in summer
SOURCE: Author calculations using data from State Water Board “Water Conservation Portal – Conservation Reporting” (see technical appendix Figure A2).
NOTES: The ratio of July to January per capita water use was 1.4 in 2015, versus 1.9 in 2013, a decrease of 26 percent. A similar pattern is seen in total water production.
PPIC.ORG/WATER Building Drought Resilience in California’s Cities and Suburbs 25
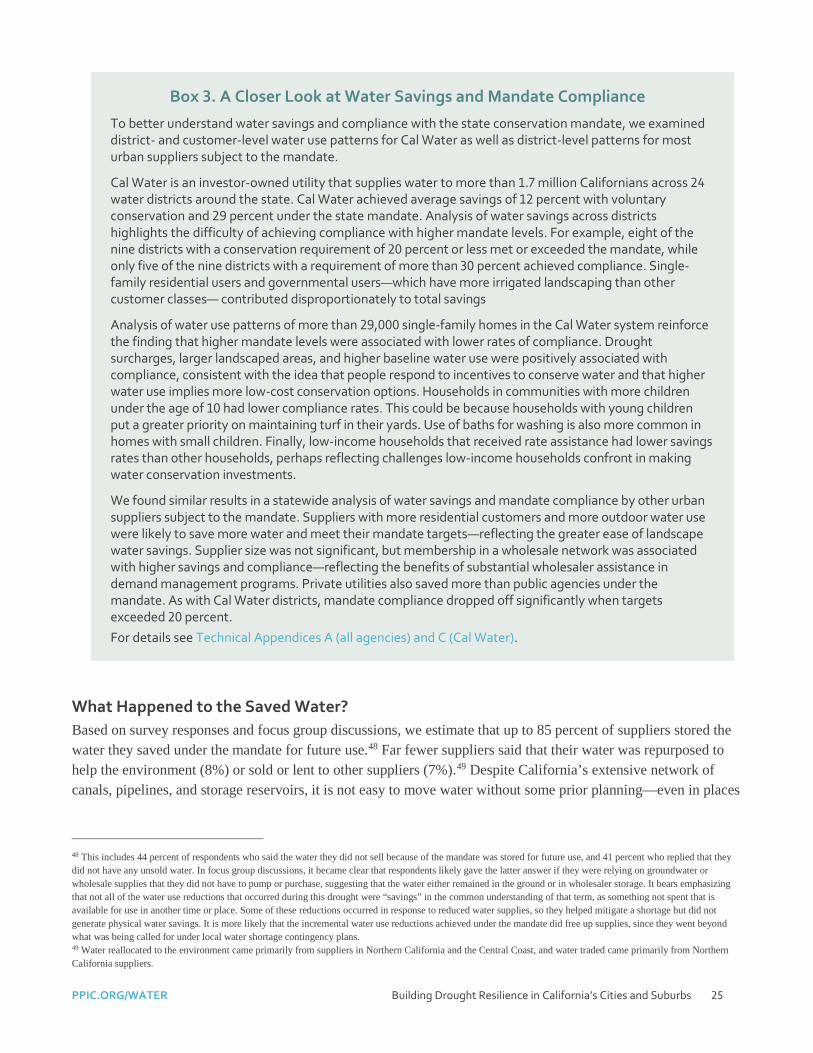
What Happened to the Saved Water? Based on survey responses and focus group discussions, we estimate that up to 85 percent of suppliers stored the water they saved under the mandate for future use.48 Far fewer suppliers said that their water was repurposed to help the environment (8%) or sold or lent to other suppliers (7%).49 Despite California’s extensive network of canals, pipelines, and storage reservoirs, it is not easy to move water without some prior planning—even in places
48 This includes 44 percent of respondents who said the water they did not sell because of the mandate was stored for future use, and 41 percent who replied that they did not have any unsold water. In focus group discussions, it became clear that respondents likely gave the latter answer if they were relying on groundwater or wholesale supplies that they did not have to pump or purchase, suggesting that the water either remained in the ground or in wholesaler storage. It bears emphasizing that not all of the water use reductions that occurred during this drought were “savings” in the common understanding of that term, as something not spent that is available for use in another time or place. Some of these reductions occurred in response to reduced water supplies, so they helped mitigate a shortage but did not generate physical water savings. It is more likely that the incremental water use reductions achieved under the mandate did free up supplies, since they went beyond what was being called for under local water shortage contingency plans. 49 Water reallocated to the environment came primarily from suppliers in Northern California and the Central Coast, and water traded came primarily from Northern California suppliers.
Box 3. A Closer Look at Water Savings and Mandate Compliance
To better understand water savings and compliance with the state conservation mandate, we examined district- and customer-level water use patterns for Cal Water as well as district-level patterns for most urban suppliers subject to the mandate.
Cal Water is an investor-owned utility that supplies water to more than 1.7 million Californians across 24 water districts around the state. Cal Water achieved average savings of 12 percent with voluntary conservation and 29 percent under the state mandate. Analysis of water savings across districts highlights the difficulty of achieving compliance with higher mandate levels. For example, eight of the nine districts with a conservation requirement of 20 percent or less met or exceeded the mandate, while only five of the nine districts with a requirement of more than 30 percent achieved compliance. Single-family residential users and governmental users—which have more irrigated landscaping than other customer classes— contributed disproportionately to total savings
Analysis of water use patterns of more than 29,000 single-family homes in the Cal Water system reinforce the finding that higher mandate levels were associated with lower rates of compliance. Drought surcharges, larger landscaped areas, and higher baseline water use were positively associated with compliance, consistent with the idea that people respond to incentives to conserve water and that higher water use implies more low-cost conservation options. Households in communities with more children under the age of 10 had lower compliance rates. This could be because households with young children put a greater priority on maintaining turf in their yards. Use of baths for washing is also more common in homes with small children. Finally, low-income households that received rate assistance had lower savings rates than other households, perhaps reflecting challenges low-income households confront in making water conservation investments.
We found similar results in a statewide analysis of water savings and mandate compliance by other urban suppliers subject to the mandate. Suppliers with more residential customers and more outdoor water use were likely to save more water and meet their mandate targets—reflecting the greater ease of landscape water savings. Supplier size was not significant, but membership in a wholesale network was associated with higher savings and compliance—reflecting the benefits of substantial wholesaler assistance in demand management programs. Private utilities also saved more than public agencies under the mandate. As with Cal Water districts, mandate compliance dropped off significantly when targets exceeded 20 percent. For details see Technical Appendices A (all agencies) and C (Cal Water).

PPIC.ORG/WATER Building Drought Resilience in California’s Cities and Suburbs 26
that are interconnected. And as described below, although facilitating water transfers was one of the state’s priority actions under the drought emergency, few suppliers considered the state helpful in this area.
This meant the state mandate primarily saved water for use by the suppliers themselves rather than reallocating it. The water would be available in following years should the drought continue, but in most cases it was not available to alleviate immediate hardships in other communities or ecosystems facing severe water shortages. In this regard, the mandate was a supplemental insurance policy for urban areas against future dry conditions.50 The value of insurance depends on the specific circumstances of the policy holder. As we discuss next, most urban water suppliers believed the mandate provided more insurance than they needed.
Compliance Challenges for Suppliers with High Targets Half of all water suppliers met or exceeded their targets, often by large amounts (Figure 8).51 However, compliance is negatively correlated with target levels, even though these targets were set with the assumption that communities with higher per capita water use had more non-essential water to save. Compliance rates drop off sharply once targets exceed 20 percent, and on average, suppliers were unable to comply with targets above 24 percent. Our analysis of Cal Water’s system is consistent with these findings (Box 3).
It is also interesting to see that the mean savings rates for suppliers with targets below 24 percent hovered right around 20 percent, regardless of whether the target was 8 percent or 20 percent.52 This suggests that state-level messaging may have overshadowed local messaging during the mandate period—something we heard from some focus group participants.53 It also suggests that up to 20 percent of current urban water use can be cut (on average) without significant economic disruption during a drought emergency.54 Recall that at the height of the 1976–77 and 1987–92 droughts, urban water use was also scaled back by about 20 percent, on average. We also note that in planning for drought, urban water suppliers have mostly set dry-year reliability goals that require no more than 20 percent rationing as part of their drought response (Table 1).
50 The economic impact analysis completed for the governor’s drought emergency (EO B-29-15) and the State Water Board’s emergency regulations acknowledges this, stating: “At its core, the EO is a drought insurance policy for the state.” (Moss et al. 2015). 51 Here and in Figure 8 we are reporting whether suppliers were at or above their target. The statistical analysis in Technical Appendix B considers suppliers to have met their target if their cumulative water production for the period June 2015 to February 2016 was within 10 percent of their target (i.e., 18–22% savings for a supplier with a target of 20%), and exceeded their target if savings were higher than that. 52 The four districts in the North Coast hydrologic region with 4 percent targets do not follow this pattern, but they are a special case. They were not in a drought condition and had four years of supply reserves on hand. 53 One utility representative noted that prior to the mandate, staff had a good handle on the savings they were requesting and were able to achieve; after the mandate, they said they “lost control of the situation.” 54 These patterns could also reflect civic-mindedness—that people are willing to reduce water use beyond what is required for the common good—as well as customer difficulties in knowing how much water they will save from various behaviors. Previous research has shown that households often do not know how much water they use even when they are given regular detailed information on their water use (Mitchell and Chesnutt 2013). In addition, residents did not necessarily know how much they were expected to save under the mandate. PPIC statewide surveys at the time found that most residents supported the mandate, but most did not know what their required savings rate was in their community (Baldassare et al. 2015a and 2015b). As described below, emergency conservation does have some costs for customers even when it does not result in significant economic disruption.

PPIC.ORG/WATER Building Drought Resilience in California’s Cities and Suburbs 27
FIGURE 8 Compliance with the state mandate was more difficult for suppliers with higher targets
SOURCE: Author calculations using State Water Board Supplier Compliance Worksheet.
NOTES: The small dots show June 2015 to February 2016 cumulative savings rates of individual water suppliers, and the diamonds show average savings rate for suppliers at each target level. Blue dots (above the dark diagonal line) represent water suppliers that met or exceeded their target and red dots (below the line) represent water suppliers that did not.
Most Suppliers Disagreed with the Mandate Levels Most water suppliers thought the mandate’s rationing requirement was excessive, given their water supply conditions at the time. Seventy-one percent of our survey respondents said the mandate required somewhat (27%) or much more reduction (44%) than necessary. Twenty-six percent responded that it was about the right level, and just 3 percent said it was less than necessary.
Interestingly, these responses appear to be independent of target level.55 Suppliers with high targets were not more likely to indicate the mandate required more water savings than necessary. This result supports what we heard during workshops conducted after the survey: water suppliers told us they disagreed with the mandate not because they thought the targets were too high, but because they thought the targets were too high relative to their water supply conditions. Results from the survey suggest this sentiment cuts across all mandate levels. On the other hand, suppliers that did not meet their targets were somewhat more likely to say the mandate was too high than suppliers that did. Among suppliers that met or exceeded their target, 65 percent said the target was too high, versus 85 percent of suppliers who did not meet their target.
Although the survey asked suppliers to look back to their water supply conditions in 2015 when responding, state officials we spoke with raised the possibility that responses may have reflected the benefit of hindsight, since the survey was fielded after the somewhat wetter winter of 2015–16. While our results seem consistent with water
55 See Technical Appendix B.

PPIC.ORG/WATER Building Drought Resilience in California’s Cities and Suburbs 28
supplier reactions to mandate targets at the time of their introduction, it is indeed possible that another very dry winter would have changed their perspective.
The Mandate Increased the Use of “Sticks” Suppliers achieved water use reductions through an array of strategies and actions. Many of these were initiated prior to the adoption of the state mandate. After the mandate, water suppliers intensified their efforts and adopted new tools (Figure 9). Before April 2015, they reported implementing 7 out of 13 demand management strategies. Afterwards, this increased to 9 strategies. The biggest increases were in strategies involving “sticks”—drought surcharges, penalties, water use restrictions, and enforcement actions such as ticketing customers for violating such restrictions. With the exception of drought surcharges, suppliers in the highest mandate tiers were not statistically more likely to use sticks than suppliers in the lower tiers.56 In our water supplier workshops we heard two rationales for the increased use of sticks while the mandate was in effect. For some, the state mandate removed local political constraints on tougher measures. For others, these tougher methods were needed to meet the mandated reductions.
FIGURE 9 After the mandate, local suppliers increased the use of “sticks” to compel water savings
SOURCE: PPIC Survey of Urban Water Suppliers 2016 (for details, see technical appendix Table B8).
NOTES: The figure shows the share of suppliers that implemented the listed demand management strategies since the onset of the drought, either before the announcement of the mandate or afterwards. Strategies that could be considered “sticks” are marked with an asterisk. “Political outreach” refers to outreach with local elected officials about drought response measures.
The Mandate Limited the Use of Short-term Supply Strategies Some suppliers also employed short-term supply strategies once the drought hit, though implementation was more limited compared to short-term demand management actions. Survey respondents reported implementing, on average, between 1 and 2 strategies out of 8 listed in Figure 10. The most common ones were adjusting water
56 Suppliers with higher mandate targets also tended to adopt some demand management tools later than those with lower targets, including messaging campaigns and financial measures such as water use budgets and adjustment of water rates or tiers (technical appendix Table B8 and related discussion).

PPIC.ORG/WATER Building Drought Resilience in California’s Cities and Suburbs 29
system maintenance to save water (such as less frequent flushing of water mains), using drought reserves, temporary transfers, and new emergency interties.
New interties—plumbing structures that connect different water systems—are noteworthy because they were used in some cases to help neighboring suppliers, including smaller communities with less reliable supplies. This reflects an expansion of the broader regional partnerships that have developed since the 1987–92 drought.57
FIGURE 10 Some utilities also employed short-term supply strategies during the drought
SOURCE: PPIC Survey of Urban Water Suppliers 2016 (for details, see technical appendix Table B6).
NOTES: Infrastructure idling involves sidelining some facilities (e.g., wells, treatment plants) to reduce operating costs when water sales are low. Adjusting water pressure in mains can lower water use, as can changing system maintenance—such as less frequent flushing of water mains or fixing leaks.
Survey respondents also noted that the state conservation mandate limited the usefulness of strategies such as transfers and drought reserves because it required water suppliers to reduce consumption even if they could augment their supply. The following comments from survey respondents are typical of these concerns:
“Our city had invested $10 million in water banking facilities for the specific purpose of providing water during a drought. However, under the state’s mandate, any water used from the banking facilities would have been counted as ‘consumption’…. Since we were mandated to reduce consumption, we could not take advantage of the supplies in which we had previously invested.”
…
“The state conservation target did not encourage agencies to use supplies specifically developed for drought. There was no benefit, and in fact, there was a disincentive to using banked groundwater supplies and facilities that had been invested in specifically for drought situations.”
Respondents identified various short-term supply augmentation strategies that were not fully utilized during the drought because of the mandate, including replenished/reclaimed groundwater, banked groundwater, stored surface water, direct diversion of surface water, desalination, and water from interruptible agricultural contracts.58
57 Interviews with suppliers in summer 2015 also highlighted the key role of regional partnerships in drought response (Hanak et al. 2015). 58 These contracts provide discounts in exchange for less reliability. In the event of a supply shortfall, those with interruptible contracts have their water use cut first.

PPIC.ORG/WATER Building Drought Resilience in California’s Cities and Suburbs 30
Survey respondents were significantly more likely to characterize the mandate as excessive if they also believed it prevented them from using their drought reserves or caused them to deviate from their water shortage contingency plans. The following comments are typical:
“Our water shortage plan is triggered by a shortage in supply. The mandate for a 28 percent reduction did not match our supply conditions and the implementation of our water conservation stages.”
…
“The state mandate required us to trigger response measures that would not have otherwise been called for based on an analysis of supply and demand.”
…
“We declared a water supply shortage in order to meet the state mandate and avoid regulatory fines, not because we were in fact short of water.”
However, most water suppliers (60%) indicated that they did not encounter significant barriers to implementing their water supply and demand management strategies. For those that did encounter barriers, the most frequently mentioned obstacles—apart from the state mandate—were financial constraints, staffing constraints, and difficulties obtaining regulatory or legal approvals. This latter category included requirements for public agencies on rate and fee adjustments, which are subject to constitutional constraints under Proposition 218 (see Box 4).
The Mandate Also Helped Urban Drought Response in Key Ways While more than two-thirds of suppliers indicated they felt the mandate required greater reductions than necessary, a similar proportion said the mandate was helpful to their drought response (Figure 11). The following comment from a survey respondent helps explain the apparent contradiction:
“The establishment of the conservation mandate was helpful in providing a focus on the drought but was unhelpful in that it did not necessarily accurately reflect the degree of reductions needed locally.”
This sentiment was often repeated in our workshops with local water suppliers. While misalignment of the mandate with local water shortage response plans frustrated water suppliers, reducing customer water use was nonetheless made easier by the mandate. As noted earlier, it gave suppliers cover or justification to implement unpopular but effective sticks to encourage or compel customers to use less water. The mandate also received extensive and persistent media coverage, which resonated with water users.59 Suppliers also said their own messaging campaigns were very important for getting customers to reduce their water use after the mandate was adopted, and these campaigns were often built around the mandate and its directives.
59 Seventy-eight percent of suppliers said media coverage of the drought was moderately to very important in helping them reduce customer water use following the announcement of the mandate (technical appendix Table B10).

PPIC.ORG/WATER Building Drought Resilience in California’s Cities and Suburbs 31
FIGURE 11 Local suppliers considered some state actions more helpful for responding to the drought than others
SOURCE: PPIC Survey of Urban Water Suppliers 2016 (for details, see technical appendix Table B12).
NOTES: Sample size: 168.The figure omits responses of “neither helpful nor unhelpful” and “unsure.” Unsure responses were low for the first three items shown: messaging (2%), waste prohibitions (1%), mandate (1%). They were most prevalent for the last four items, with which fewer suppliers likely had experience during the drought: funding for conservation (7%), funding for supply programs (8%), facilitating transfers (13%), and fast-tracking permits for construction projects (11%).
The conservation mandate also created opportunities for customer outreach and engagement. Although more suppliers reported a deterioration in customer relations because of the drought and rationing, close to 30 percent reported improved relations with their residential customers, and about 20 percent reported improved relations with their commercial customers.60 Whether suppliers reported improved customer relations partly depended on their mandate level. Utilities with low targets were twice as likely to report improved customer relations as those with targets of 20 percent or more.
Public Support for the Mandate Statewide PPIC public attitude surveys conducted during the drought found that most respondents supported the mandate and mandatory rationing. For example, asked if they would favor or oppose their water district making it mandatory for residents to reduce their water use, 75 percent of respondents said they would favor it (Baldassare et al. 2014). Asked whether they thought the mandatory reductions ordered by Governor Brown were too much, about the right amount, or not enough, 46 percent said about the right amount while 36 percent said not enough. Only 12 percent said the mandate required too much reduction, and 6 percent were unsure (Baldassare et al. 2015a). That said, most respondents did not know the specific target set for their community—again suggesting the importance of broader regional and statewide messaging about the mandate.61
60 Forty-seven percent reported deteriorated relations with residential customers, and 32 percent reported deteriorated relations with commercial, institutional, and industrial customers. The remainder reported no change in customer relations (technical appendix Table B9). 61 When asked if they knew the amount of water cuts required for their water district under the mandate, 64 percent of adults responded that they did not, 30 percent responded that they did, and 6 percent were unsure (Baldassare et al. 2015b).

PPIC.ORG/WATER Building Drought Resilience in California’s Cities and Suburbs 32
Financial and Economic Impacts
Both the drought and the mandate had significant repercussions for water suppliers’ finances, as well as more limited, but still noteworthy, effects on the local economies in their service areas.
Utility Finances and Near-Term Investments As in past droughts, this one hit water supplier finances hard. More than 60 percent of suppliers reported the drought somewhat or greatly reduced their revenues and their net financial position (Figure 12). Costs also increased―especially operational costs associated with drought management activities, such as increased customer outreach, enforcement of water use restrictions, and conservation program deployment. Roughly half the respondents reported having higher water supply costs, and about a quarter indicated their treatment costs went up despite lower sales.62
Many suppliers reported this revenue-cost squeeze was intensified by the mandate. Statewide, total reductions in urban water supplier net revenues in 2015 likely approached a billion dollars, with more than half of this reduction related to the mandate.63
These impacts were widely reported in the press. Urban water suppliers’ concerns about the mandate were often distilled by the media to an issue of revenue loss.64 Yet our survey of water suppliers suggests this narrative is too simplistic. Adverse financial impacts reported by respondents did not correlate with whether they thought the mandate too high, as one would expect if water suppliers objected primarily because of its impact on their finances. Instead, the mandate’s interference with a supplier’s drought response strategy—rather than the impact on its finances or the level of the target—seems to be the key factor in whether a supplier felt the mandate was excessive. This harkens back to lessons from the 1976–77 and 1987–92 droughts, when local implementation of shortage response plans was viewed as essential because of the diversity, intrinsic complexity, and local specificity of California’s myriad water storage and conveyance systems.
62 Higher supply and treatment costs may be due to multiple drought-related factors, the most common being the purchase and treatment of supplemental water supplies. One commonly noted water quality issue was higher salinity levels, reflecting an increased proportion of saltier Colorado River water in Southern California supplies, and increased salinity of water shipped through the Delta. 63 The mandate alone was projected to cost more than half a billion dollars in the state’s economic impact analyses, excluding the losses from voluntary conservation already achieved before the mandate. The revenue loss estimates in the state’s analyses comport well with what actually occurred, based on results from a survey of water suppliers by the Association of California Water Agencies (ACWA) and the California Municipal Utilities Association (CMUA). The state estimated average loss in gross revenue per acre-foot would range between $850 and $975. The median loss per acre-foot reported by the ACWA/CMUA survey respondents was $780 and the mean loss was $960 (Moss et al. 2015; Mitchell et al. 2016). 64 A July 15, 2016 Sacramento Bee article titled “How revenue losses played into decision to relax conservation rules in California” (Sabalow 2016) is typical of how the financial impacts of the drought and the state mandate were linked in the press.

PPIC.ORG/WATER Building Drought Resilience in California’s Cities and Suburbs 33
FIGURE 12 A majority of suppliers experienced drops in revenue and net financial position, and costs also rose for many
SOURCE: PPIC Survey of Urban Water Suppliers 2016 (for details, see technical appendix Table B2).
NOTES: The figure reports suppliers’ qualitative assessment of changes in financial indicators. Suppliers reporting no change or “unsure” for a given impact are not shown in the chart, but can be inferred by subtracting the percentage shown from 100 percent. For example, approximately 70 percent of suppliers reported a decrease in revenue because of the drought, while about 2 percent reported an increase. Thus, about 28 percent reported no change or unsure.
The drought also resulted in near-term adjustments in capital spending. In our survey, 38 percent of respondents indicated they had deferred some investments because of the drought, largely as a consequence of the deterioration in revenues and net financial position.65 Mostly this deferral affected investments in long-lived infrastructure such as water mains or tanks, where a few years’ delay was not expected to be consequential.
A similar proportion of suppliers reported accelerating some capital expenditures, mostly to do with increasing near-term supply or managing customer demands, such as installing new wells, extending recycled water distribution networks, and implementing advanced metering infrastructure. Interestingly, suppliers that reported deferring some capital expenditures were no less likely to report accelerating other expenditures, suggesting they primarily reprioritized their capital programs to focus dollars on projects that could do the most immediate good in responding to drought conditions.
As seen earlier, 75 percent of all water suppliers adjusted their water rates in response to the drought, and many also instituted financial penalties (79%) or drought surcharges (29%) (Figure 9). Rate adjustments and surcharges not only helped reduce use, but also helped mitigate revenue losses from the drought and mandate to varying degrees.66 In our survey, 35 percent of respondents said the drought did not impair their net financial position, while 60 percent said it did (5% were unsure). Investor-owned utilities were much more likely to report no impairment. These suppliers—which are not subject to Proposition 218—already had in place at the start of the drought a revenue adjustment mechanism (RAM) that allowed them to automatically implement surcharges to
65 There is a strong positive association between responses indicating a high level of financial impact and responses indicating deferral of capital expenditure (Technical Appendix B). 66 Our analysis of Cal Water single-family households shows the significant effect on savings of the drought surcharge instituted in those districts, which charged customers twice the top tier price for quantities of water used that exceeded the mandate target (Technical Appendix C).

PPIC.ORG/WATER Building Drought Resilience in California’s Cities and Suburbs 34
recover revenue shortfalls due to the drought. Proposition 218’s rate setting and public noticing requirements made implementation of RAMs more complicated and less timely for public water suppliers (Box 4). Consequently, 71 percent of investor-owned utilities indicated no adverse change in their net financial position because of the drought, compared to only 26 percent of public water supply agencies.
The conundrum faced by urban water suppliers is selling a commodity for which 70–80 percent of the costs are fixed, but where most of these costs are recovered through variable commodity charges to encourage efficient water use (Mitchell and Hanemann 1994). Absent a RAM, water suppliers had to rely on their cash reserves and post hoc rate adjustments to restore their balance sheets, leading to the “catch-22” of asking customers to curtail their water use and then hitting them with a rate increase.67 The need to recover fixed costs necessitated the rate increases, but this cost of service nuance is lost on many consumers, who rightly or wrongly feel punished for conserving water.68
67 One especially contentious case is the Southern California community of Yorba Linda, where customers sought to overturn a rate increase by referendum and ultimately recalled their governing board (Healy 2015, Salazar 2016). 68 The shift to increasing-block rates over the past 20 years has worsened revenue volatility during droughts (University of North Carolina Environmental Finance Center 2014). This is because water use in the upper tiers is reduced during shortages, while that in the lower tiers is preserved.
Box 4. How Proposition 218 Restricts Water Rate Adjustments
Proposition 218, a constitutional amendment passed by California voters in 1996, makes it more challenging for public water agencies to implement tiered water rates —which charge customers higher rates per gallon for higher levels of use—and to adjust water rates quickly in response to droughts (Gray et al. 2014). Changing this law would require another constitutional amendment and approval by a majority of the state’s voters.
Proposition 218 requires a clear and proportionate relationship between the fees or charges assessed for each unit of water service and the cost to the utility of providing those units. Demonstrating such a cost relationship when rates are tiered can be a significant accounting challenge, and depending on how the tiers are designed, such a relationship may not, in fact, exist. Tiered rates that have been subject to legal challenge under Proposition 218 have generally failed to satisfy the proportionality test. A majority of California’s urban water suppliers use tiered rates to encourage water conservation, and survey respondents said that the uncertainties surrounding rate structures were a constraint to adjusting rates during the drought.
Proposition 218 also requires water suppliers to conduct a public hearing on any proposed rate changes. If a majority of property owners object to the proposed changes, the new rates cannot be adopted. Even small changes can take a minimum of four to five months to complete. This can be an issue in times of drought when declining water sales can make it difficult for utilities to cover their fixed costs without rate increases. Utilities typically recover at least 70 percent of their expenses through volumetric rates, even though 70 to 80 percent of their costs do not vary with the volume of water sold. Delayed rate adjustments can create challenges for customer relations by fueling the perception that customers are being punished for having saved water. To avoid financial and customer relations problems, utilities need to have advanced authorization to build significant financial reserves or rate structures that allow them to increase per-gallon charges during droughts.
Investor-owned water utilities, whose rates are regulated by the California Public Utilities Commission, are not subject to Proposition 218. They generally have tiered rate structures as well as pre-approved revenue adjustment mechanisms, which enable them to recover fixed costs when sales decline from conservation efforts.
PPIC.ORG/WATER Building Drought Resilience in California’s Cities and Suburbs 35
Broader Economic Impacts Economists measure the economic impact of water shortages in terms of the value of foregone water uses—including the value households place on water they are unable to consume and the value businesses place on water they are unable to use in production during a shortage (Griffin 2016). An estimate prepared for the State Water Board as part of the adoption of the emergency conservation regulation put the statewide economic impact of the mandate at between $1.0 and $1.3 billion.69 Adding in the additional costs of rationing achieved through the voluntary conservation programs would likely put the total economic impacts of the drought in urban regions during the mandate period at closer to $2 billion.70
It is useful to give some context to these loss estimates. In terms of aggregate dollar impacts, the losses are similar to what the farm sector incurred in 2015 for roughly twice the reduction in water use.71 However, farm sector losses were much more concentrated—averaging 3 to 4 percent of total farm revenues. By contrast, losses in the urban sector over the mandate period represented only 0.1 percent of statewide non-farm output.72 That said, communities with a larger share of commercial and industrial water use faced tougher challenges in meeting the mandate because of the way it was designed (Box 5).
Whatever impacts the drought has had on California’s urban economy, they were not significant enough to derail the strong economic expansion that started in 2011. As the drought unfolded, growth in California’s real GDP and nonfarm employment continued to outpace the national economy as a whole.73
69 Note that this estimate is for the costs of the initial nine-month period of the mandate, from June 2015 to February 2016 (Moss et al. 2015). A separate study by Buck et al. (2016) estimated economic losses of $843 million for the Bay Area and Southern California due to the mandate. Factoring in the losses in the Central Valley and Central Coast would likely result in total losses similar to the State Water Board’s estimate. For example, a simple population-based scaling of their estimate yields statewide impacts of $1.2 billion. Some portion of these costs would likely have occurred without the mandate, as some local suppliers ramped up their own rationing programs to respond to the continuing drought. 70 The net revenue losses water suppliers incurred during the mandate are part of the economic impact to households and businesses. This is because households and businesses ultimately have to pay these costs since utilities will have to adjust their rates to repair the damage to their balance sheets caused by the reduction in water sales. Only the variable costs of water supply are truly avoided by consumers when water is rationed, and these variable costs typically represent less than a third of the volumetric charges paid by utility customers. 71 Economic losses in the farm sector from land fallowing and extra groundwater pumping were estimated at $1.5 to $1.8 billion annually in 2014 and 2015, respectively, for net water use reductions of 1.6 maf and 2.7 maf compared to 2010 conditions (Hanak et al. 2015, technical appendix Table A5). Urban water use reductions in calendar 2015 compared to 2013 were approximately 1.4 maf (State Water Board reporting data). 72 This calculation is based on costs to the economy for the initial nine months of the mandate, using as a denominator three-quarters of 2015 California’s non-farm gross domestic product (GDP) of $2.4 trillion. 73 For additional perspective on the resilience of California’s economy during the drought, see Groc (2016) and Legislative Analyst’s Office (2015).
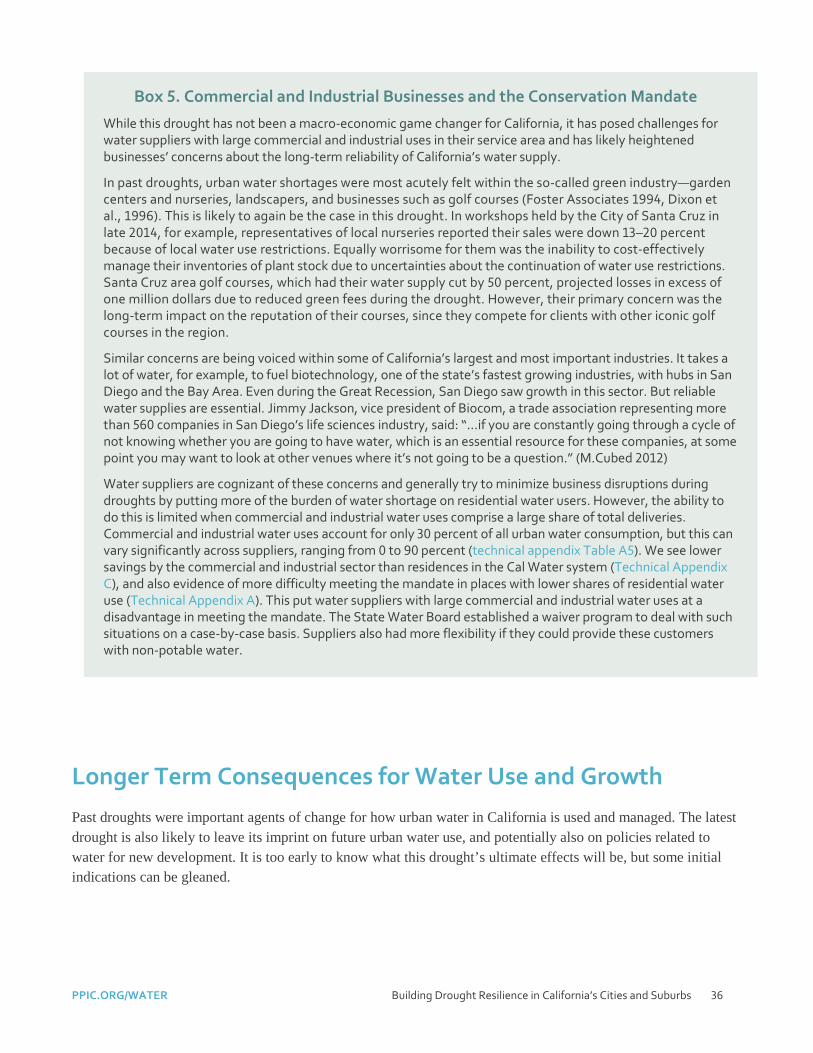
PPIC.ORG/WATER Building Drought Resilience in California’s Cities and Suburbs 36
Longer Term Consequences for Water Use and Growth
Past droughts were important agents of change for how urban water in California is used and managed. The latest drought is also likely to leave its imprint on future urban water use, and potentially also on policies related to water for new development. It is too early to know what this drought’s ultimate effects will be, but some initial indications can be gleaned.
Box 5. Commercial and Industrial Businesses and the Conservation Mandate
While this drought has not been a macro-economic game changer for California, it has posed challenges for water suppliers with large commercial and industrial uses in their service area and has likely heightened businesses’ concerns about the long-term reliability of California’s water supply.
In past droughts, urban water shortages were most acutely felt within the so-called green industry—garden centers and nurseries, landscapers, and businesses such as golf courses (Foster Associates 1994, Dixon et al., 1996). This is likely to again be the case in this drought. In workshops held by the City of Santa Cruz in late 2014, for example, representatives of local nurseries reported their sales were down 13–20 percent because of local water use restrictions. Equally worrisome for them was the inability to cost-effectively manage their inventories of plant stock due to uncertainties about the continuation of water use restrictions. Santa Cruz area golf courses, which had their water supply cut by 50 percent, projected losses in excess of one million dollars due to reduced green fees during the drought. However, their primary concern was the long-term impact on the reputation of their courses, since they compete for clients with other iconic golf courses in the region.
Similar concerns are being voiced within some of California’s largest and most important industries. It takes a lot of water, for example, to fuel biotechnology, one of the state’s fastest growing industries, with hubs in San Diego and the Bay Area. Even during the Great Recession, San Diego saw growth in this sector. But reliable water supplies are essential. Jimmy Jackson, vice president of Biocom, a trade association representing more than 560 companies in San Diego’s life sciences industry, said: “…if you are constantly going through a cycle of not knowing whether you are going to have water, which is an essential resource for these companies, at some point you may want to look at other venues where it’s not going to be a question.” (M.Cubed 2012)
Water suppliers are cognizant of these concerns and generally try to minimize business disruptions during droughts by putting more of the burden of water shortage on residential water users. However, the ability to do this is limited when commercial and industrial water uses comprise a large share of total deliveries. Commercial and industrial water uses account for only 30 percent of all urban water consumption, but this can vary significantly across suppliers, ranging from 0 to 90 percent (technical appendix Table A5). We see lower savings by the commercial and industrial sector than residences in the Cal Water system (Technical Appendix C), and also evidence of more difficulty meeting the mandate in places with lower shares of residential water use (Technical Appendix A). This put water suppliers with large commercial and industrial water uses at a disadvantage in meeting the mandate. The State Water Board established a waiver program to deal with such situations on a case-by-case basis. Suppliers also had more flexibility if they could provide these customers with non-potable water.
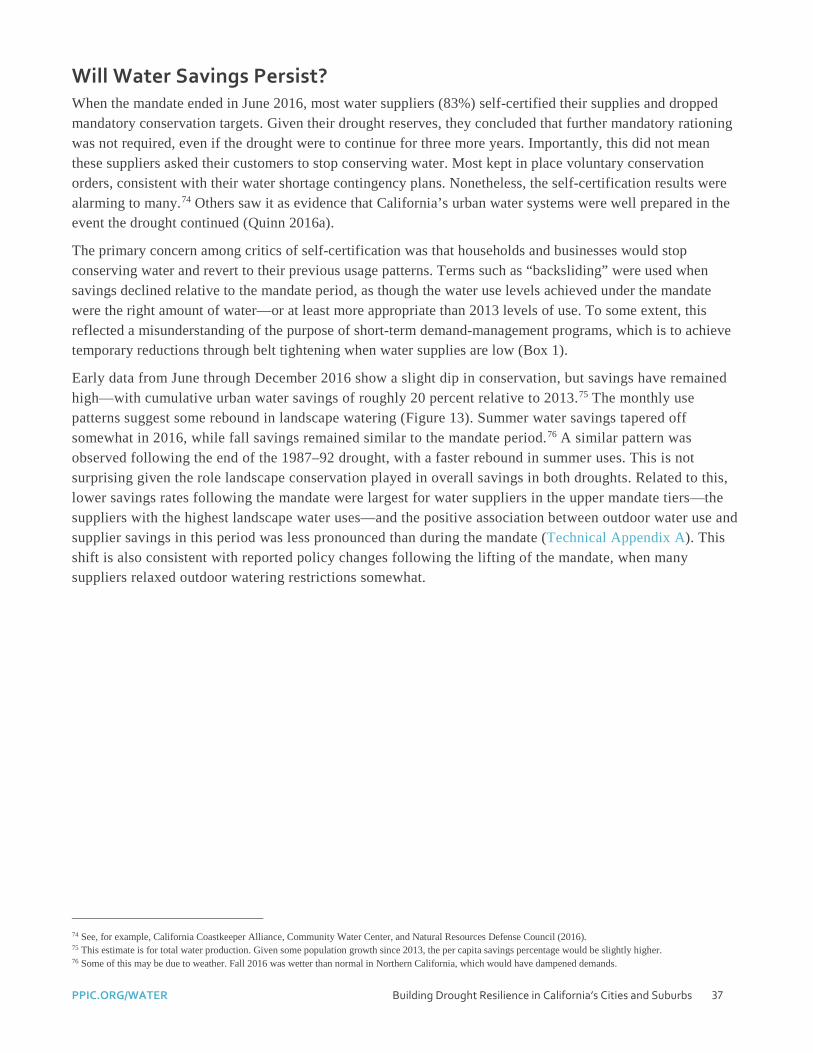
PPIC.ORG/WATER Building Drought Resilience in California’s Cities and Suburbs 37
Will Water Savings Persist? When the mandate ended in June 2016, most water suppliers (83%) self-certified their supplies and dropped mandatory conservation targets. Given their drought reserves, they concluded that further mandatory rationing was not required, even if the drought were to continue for three more years. Importantly, this did not mean these suppliers asked their customers to stop conserving water. Most kept in place voluntary conservation orders, consistent with their water shortage contingency plans. Nonetheless, the self-certification results were alarming to many.74 Others saw it as evidence that California’s urban water systems were well prepared in the event the drought continued (Quinn 2016a).
The primary concern among critics of self-certification was that households and businesses would stop conserving water and revert to their previous usage patterns. Terms such as “backsliding” were used when savings declined relative to the mandate period, as though the water use levels achieved under the mandate were the right amount of water—or at least more appropriate than 2013 levels of use. To some extent, this reflected a misunderstanding of the purpose of short-term demand-management programs, which is to achieve temporary reductions through belt tightening when water supplies are low (Box 1).
Early data from June through December 2016 show a slight dip in conservation, but savings have remained high—with cumulative urban water savings of roughly 20 percent relative to 2013.75 The monthly use patterns suggest some rebound in landscape watering (Figure 13). Summer water savings tapered off somewhat in 2016, while fall savings remained similar to the mandate period.76 A similar pattern was observed following the end of the 1987–92 drought, with a faster rebound in summer uses. This is not surprising given the role landscape conservation played in overall savings in both droughts. Related to this, lower savings rates following the mandate were largest for water suppliers in the upper mandate tiers—the suppliers with the highest landscape water uses—and the positive association between outdoor water use and supplier savings in this period was less pronounced than during the mandate (Technical Appendix A). This shift is also consistent with reported policy changes following the lifting of the mandate, when many suppliers relaxed outdoor watering restrictions somewhat.
74 See, for example, California Coastkeeper Alliance, Community Water Center, and Natural Resources Defense Council (2016). 75 This estimate is for total water production. Given some population growth since 2013, the per capita savings percentage would be slightly higher. 76 Some of this may be due to weather. Fall 2016 was wetter than normal in Northern California, which would have dampened demands.

PPIC.ORG/WATER Building Drought Resilience in California’s Cities and Suburbs 38
FIGURE 13 Summer water savings declined somewhat following the end of the mandate
SOURCE: State Water Board, Water Supplier Data.
NOTES: Statewide voluntary 20 percent conservation was in effect in 2014; statewide conservation mandate was in effect in 2015; self-certification was in effect in 2016.
For water suppliers, the bigger question is how much of the reductions in use achieved during the drought will be temporary versus permanent. In our survey, 60 percent of suppliers indicated they were likely to reassess their water demand forecasts in the wake of this drought, given the expectation that some savings will persist.
Yet it is too soon to know how urban demand will evolve over the long run. After the 1987–92 drought, urban per capita use does appear to have rebounded substantially for a number of years before falling again in the late 2000s. For instance, Figure 14 shows this pattern for the Cal Water family of water districts, which span across the state.77 In many developed coastal areas, per capita use never regained pre-drought levels, however, reflecting efficiency gains in indoor plumbing and appliances.78
77 This is difficult to illustrate well with state-level data. Water use series compiled by DWR prior to 1998 are not fully compatible with estimates reported since then. DWR’s California Water Plan Updates (Bulletin 160) report urban water use statewide and by hydrologic region, but before 1998 these data were “normalized”—i.e., adjusted to account for typical differences in water use between dry years (when outdoor watering is usually higher absent drought restrictions) and wet years (when outdoor watering is usually lower because soils are moister). DWR also has pre-1998 estimates of actual water use from a utility survey, but this series is subject to reporting gaps (Jones et al. 2001). Christian-Smith et al. (2012) use these state-level data to show a rebound to pre-droughts levels after the 1987–92 drought. However, the statewide average could mask gains made in different parts of the state, because there has also been a trend toward increasing population in inland areas (including within coastal regions), where higher temperatures and larger lots increase landscape irrigation (Hanak and Davis 2006). 78 See, for example, Figure G-1 in East Bay Municipal Utility District’s 2015 UWMP and Figure 6 in Jones et al. (2001).

PPIC.ORG/WATER Building Drought Resilience in California’s Cities and Suburbs 39
FIGURE 14 Water use per customer in the Cal Water system rebounded after the 1987–92 drought before declining in the 2000s
SOURCE: Author calculations using data from Cal Water.
NOTES: The figure shows annual averages of monthly water use per meter relative to 1987. This includes both residential and non-residential customers. CCF is hundred cubic feet.
Coming out of this drought, some rebound in water use is to be expected because rationing leads water users to save more than they would under more normal circumstances. But some sustained savings are also likely, particularly if habits change regarding outdoor water use. Landscape water use efficiency programs—including rebates to replace lawns with plants that use less water—appear to have accelerated the shift in preferences away from traditional turf-based landscapes.79 While this transformation was already underway in some parts of the state before the drought, it now seems to be fairly widespread. Landscape water budgets that assign customers a water allotment based on the size of their landscaped area and plant water requirements are also gaining in popularity in Southern California. New state policies may reinforce these trends. The state updated the Model Water Efficient Landscape Ordinance in 2015, establishing much stricter design and water use standards for new construction. It is now considering whether to replace the per capita urban water use targets established by SB X7-7 with new standards tied directly to landscape water budgets, as part of the “Making Water Conservation a California Way of Life” initiative (State of California 2017).
To the extent that households and businesses made other efficiency improvements in their indoor plumbing and appliances, these adjustments to their water use will also be long-lasting. And urban water costs are expected to continue to escalate, which will also help curb future water demand.
All of this indicates that while some rebound in water use is inevitable, per capita use may never fully return to its pre-drought levels.
79 The largest program was run by Metropolitan Water District. Following the success of a $100 million rebate program in 2014, Metropolitan’s board approved an additional $350 million in rebates in spring 2015—enough to replace roughly 4,000 acres of turf. The program was fully subscribed within the first month.

PPIC.ORG/WATER Building Drought Resilience in California’s Cities and Suburbs 40
Water for Growth The drought also put the spotlight back on concerns about population growth, economic development, and water availability (e.g., Siders 2015). While such concerns are hardly new, the Great Recession of the late 2000s sidelined them temporarily. The drought brought them roaring back. Almost half of the water suppliers responding to our survey indicated an uptick in community concerns over water for growth, though only 3 percent reported temporary moratoria on new construction during the drought.80 In focus group discussions, local suppliers in Southern California noted that this seemed to be less of an issue than in the later years of the 1987–92 drought, reflecting better preparation for drought emergencies today.
State law has more built-in checks in place for new development than it did at that time. Since 2001, cities and counties have been required to get documentation from their local water suppliers that adequate long-term supplies are available to support new growth before approving large new developments.81 Legislation enacted in 2016 has sought to address some gaps in oversight of water availability for new growth―for instance, by discouraging residential development in outlying areas that lack access to reliable water supplies and encouraging partnerships between water systems (McCann and Hanak 2016).
While water is an essential resource for development, there are many issues besides water supply that are relevant for determining the amount of growth that California’s communities can sustainably accommodate. And because water supply conditions vary geographically, the flexibility to support growth while maintaining the community’s ability to weather prolonged droughts will also vary. Growth in some small, relatively isolated communities with limited water supplies has been constrained for decades.82 But the past several decades have shown that most California communities have been able to supply water to new residents and businesses while building their drought resilience, thanks to a diversified set of investments in water supplies and long-term conservation. Looking ahead, durable reductions in per capita water use will likely continue to be an important tool for accommodating new growth. As we describe below, however, there are trade-offs between using water savings for growth and maintaining communities’ drought resilience—something state and local policymakers will need to consider when promoting long-term conservation.
Lessons for Future Droughts
Every major drought provides opportunities to draw lessons for better managing the next one, and this latest drought is no exception. For California’s cities and suburbs—home to more than 90 percent of the state’s residents and most of the state’s non-farm businesses—key questions revolve around the best roles for the state and more than 400 utilities that provide local water service. Local utilities have the frontline responsibility for keeping the taps running across California’s diverse, geographically dispersed communities. Our assessment shows that urban water suppliers have largely risen to this challenge following the hard lessons learned from the
80 More precisely, 38 percent indicated new concerns in the community were raised, 8 percent reported adoption of new local requirements for development, and three percent said temporary building moratoria were put into effect during the drought. 81 These requirements were implemented in 2001 under SB 610 and SB 221. Both statutes require detailed information regarding water availability to be provided to city and county decision makers prior to approval of development projects with more than 500 new residential units (or an equivalent commercial or industrial water demand). In smaller communities, developments that would increase water demand by more than 10 percent are also subject to the law. In general, the law appears to be effective at providing additional oversight, although there may be weaknesses in smaller, more remote communities that lack large water suppliers and where there is less community oversight (Hanak 2010). 82 Examples include Calistoga (Napa County), Bolinas (Marin County), and several Central Coast communities, where new construction (sometimes even adding a bathroom in an existing structure) is tightly restricted. See Hanak (2005).

PPIC.ORG/WATER Building Drought Resilience in California’s Cities and Suburbs 41
1977 and 1987–92 droughts. The state has also played essential roles in building urban drought resilience since the late 1970s. It has progressively strengthened local water planning requirements, provided financial assistance for local investments in supply diversification and demand management, and fostered voluntary water trading to help move supplies to communities experiencing the worst shortages.
The state pursued these kinds of efforts this time too, but concerns about the drought’s severity prompted it to intervene in new ways, particularly through the introduction of the statewide conservation mandate. Although California’s residents overwhelmingly responded to the mandate, the policy generated significant discord between the state and local water suppliers—entities that need to work well together to protect the state’s residents and economy from the worst effects of drought. Perhaps more importantly, it muddied the waters in terms of state and local roles and responsibilities going forward, which if left unaddressed could undermine effective planning and response to future droughts.
In our view, the main lessons coming out of this drought in terms of urban drought planning and response have mostly to do with understanding how the state and local water suppliers can best work together in the following five interrelated areas:
Coordinating water shortage contingency planning and implementation
Fostering water system flexibility and integration
Improving water suppliers’ fiscal resilience
Addressing water shortages in vulnerable communities and ecosystems
Balancing long-term water use efficiency and drought resilience
Here we review key takeaways in these five areas, and recommend priorities for state and local action, including areas where joint efforts will be key.
Coordinating Drought Contingency Planning and Implementation The state’s primary reason for introducing the mandate was a concern that urban suppliers were not sufficiently prepared to weather the kind of drought that was unfolding—particularly if it lasted several more years. The mandate succeeded in saving water, and most of this water appears to have been stored for later use by communities themselves or their wholesalers. But it was a blunt instrument, and it reflected a lack of awareness of how well prepared most urban suppliers were, and of their willingness to further reduce water use if warranted.
When average statewide savings were lower than the 20 percent the governor called for during the voluntary conservation period, state officials interpreted that as an indication that utilities were not doing enough to reduce water use. But there are two components to drought resilience strategies―supply reserves and short-term demand management―and the urban sector had invested vast sums in supply diversification, interconnections, and storage since the last major drought. As a result, most local suppliers were better prepared for this drought than previous ones, and many were able to limit rationing to less than 20 percent, in accordance with their water shortage contingency plans. As in past droughts, savings varied across regions, reflecting geographic diversity in local supply conditions.
More evidence of local resilience is found in the results of the self-certification process. Most suppliers were able to demonstrate reliable supplies for at least another three years of drought without the need for further mandatory rationing.83 Given the speed with which the new policy was developed and implemented, it is likely that not every
83 Not everyone is convinced. See, for example, the blog post from Tracy Quinn (2016c) of the Natural Resources Defense Council, who argues that water suppliers’ assessments of available supply are overstated.

PPIC.ORG/WATER Building Drought Resilience in California’s Cities and Suburbs 42
self-certification would withstand close scrutiny. On the other hand, water suppliers are famously risk averse when it comes to ensuring adequacy of supply for their systems.84 One cannot know how local programs would have evolved in the absence of the mandate if the drought had lasted beyond 2016, but responses before the mandate—as well as evidence from previous droughts—suggests that water suppliers would have responded as needed to ensure adequate supplies for essential uses.85
The central question the mandate raises is whether it is better to make demand management decisions at the state or local level. In prior droughts, the state always emphasized the need for local decision making. Reliance on local planning and implementation of water shortage contingency plans was viewed as essential because of the complexity and diversity of California’s myriad urban water systems. Coming out of the 1976–77 drought, DWR concluded that “[l]ocal water conservation programs based on specific community needs and values must be developed. Uniform, statewide rules were not requested as water needs and supplies vary from one locale to another.” The preamble to the Urban Water Management Planning Act declares “conservation and efficient use of urban water supplies are of statewide concern; however, the planning for that use and the implementation of those plans can best be accomplished at the local level.”86
The state’s deference to local planning and implementation began to slip, however, with the passage of SB X7-7 in 2009, which required local suppliers to set long-term conservation targets based on historical use. In the current drought, the state went a step further and set mandated reduction targets for more than 400 separate water utilities, based solely on their residential per capita water use. Savings patterns prior to the mandate suggest this is not a good indicator of vulnerability: savings rates were highest in communities with some of the state’s highest and lowest water use levels.
The resulting misalignment between the mandated reductions and local water supply conditions and water shortage contingency plans created significant challenges for some water suppliers. Asked what the state should have done differently in its response to the drought, 61 percent of the utilities we surveyed said they preferred that the state support local water shortage contingency plans but not mandate conservation targets. Moreover, 84 percent of water suppliers said that if the state adopts a conservation mandate it should better account for local water supply conditions, availability of drought reserves, and past conservation.
Interestingly, only a quarter of those surveyed said they preferred self-certification of local suppliers’ own assessments of their water supplies―the option that the state adopted as an alternative to the mandate. Yet for a variety of reasons, this stress test approach—combined with continued monthly reporting of data on urban water use—may be the sweet spot for state and local roles on managing water demand during droughts.
Recommended Actions To a large extent, the disconnect between state and local views on local preparedness during this drought reflects an information gap. Urban water management plans (which include overviews of drought planning) are publicly 84 As Neil Grigg writes in his 2011 book Water Finance: Public Responsibilities and Private Opportunities, “Water-supply managers are risk averse and do not, under any circumstances, want to be the ones responsible for running out of water. This can mean loss of reputation or of a job, even at the minimum.” The tendency towards over- rather than under-investment in water supply is a long-standing issue; it is addressed in the seminal works on water resources development and conservation by Hirshleifer et al. (1960) and Martin et al. (1984). 85 Our survey results on regional differences about whether the size of the mandate target was appropriate are consistent with regional patterns in the voluntary period, with Central Coast and Bay Area suppliers more likely to find the targets about right and Southern California suppliers more likely to find them much higher than necessary (Technical Appendix B). 86 These statements echo Hayek (1945) where he states: “the knowledge of the circumstances of which we must make use never exist in concentrated or integrated form but solely as the dispersed bits of incomplete and frequently contradictory knowledge which all the separate individuals possess … If we can agree that the economic problem of society is mainly one of rapid adaptation to changes in the particular circumstances of time and place, it would seem to follow that the ultimate decisions must be left to the people who are familiar with those circumstances.” Thinking about this in terms of water supply development and use, Hirshleifer, et al. (1960) conclude that “[o]ther things being equal, we prefer local to state authority, state to federal—and private decision-making (the extreme of decentralization) to any of these.”

PPIC.ORG/WATER Building Drought Resilience in California’s Cities and Suburbs 43
available, and DWR reviews them for completeness to determine eligibility for state grant funding. But these plans do not provide a good way for the state or the public to track drought preparedness and supply risks in real time. State officials we spoke with emphasized their difficulty tracking what was happening locally as a key reason for adopting the state mandate—a “better safe than sorry” approach.
The lesson is that it is necessary to improve the quality and transparency of information about local supplier conditions during droughts. We recommend institutionalizing the stress test approach and making monthly reporting on water use permanent. Implementing these recommendations will require action by the state and local suppliers: the state to adopt changes in reporting requirements, local suppliers to comply with those requirements, and cooperative efforts to build a shared understanding of supply conditions and prudent responses.
(1) Adopt the stress test approach for urban reporting on drought resilience
At its heart, the self-certification process is a “trust-but-verify” approach to accountability. Adopting this as an element of state policy may be the best way to keep the state informed, address gaps in local readiness, and harness local knowledge about when and how much rationing is needed during a drought.
During droughts, requiring suppliers to conduct an annual review of their ability to withstand multiple additional dry years and report this to the state provides important transparency to local communities, while enabling the state to catch potential problem areas early and step in with assistance. The self-certification process could be incorporated in an update to the Urban Water Management Plan Act’s requirements regarding local water shortage contingency plans. As during this drought, the state could retain a mandated reduction for utilities unwilling or unable to demonstrate adequate supplies. Annual updates throughout the duration of a drought provide the opportunity for course corrections in longer droughts.
The stress test provides a more holistic view of urban drought resilience than that taken by water shortage contingency plans, which have been required as part of UWMPs since 1991. Water shortage contingency plans are about the demand side of droughts: how utilities will ration water as supplies get tighter. The self-certification process asks utilities to show their supply side, and justify the amount of rationing needed.
There is a parallel between this trust-but-verify approach and the state’s Sustainable Groundwater Management Act of 2014, which requires local water suppliers to develop and implement groundwater sustainability plans using a set of fixed requirements and deadlines. The state’s role in that process is to track local progress and step in when local suppliers are not meeting their obligations.
(2) Make monthly reporting on urban water use permanent
The state should also make permanent the requirement that suppliers report on their water use each month. This is a valuable tool for maintaining transparency and tracking water use trends around the state, not only for state and local water managers, but also for the media and general public. Maintaining this reporting during non-drought years can also help support efforts to reduce water use over the long term.
Fostering Water System Flexibility and Integration The drought also offers lessons for improving the supply side of urban drought resilience. Despite progress made since the early 1990s, this remains a work in progress given California’s growing population and changing climate. Urban utilities will need to continue pursuing cost-effective supply portfolios that are robust to prolonged droughts. This includes being able to store water for dry times, access some supplies that are not as dependent on the weather, and share water with other communities. The list of options is long: surface reservoirs and managed groundwater basins to store water, conveyance systems to connect communities to a variety of water sources, and

PPIC.ORG/WATER Building Drought Resilience in California’s Cities and Suburbs 44
a diverse set of ways to augment water supplies, including long-term conservation, water transfer agreements, recycling, stormwater capture, and desalination of brackish groundwater and seawater. The appropriate mix will depend on a utility’s existing supply base, the costs of alternatives, and ratepayer preferences in terms of supply augmentation versus short-term demand management.
This drought has shown the value of cooperative regional approaches, which enabled joint investments and the ability to more easily coordinate responses as the drought unfolded. Often facilitated by large wholesale utilities, these regional efforts have been key for smaller urban suppliers that lack the capacity to diversify supplies on their own.87 Regional water sharing agreements increase flexibility to respond to droughts in ways that lessen the costs of shortages.
Although urban water suppliers have the primary responsibility for planning and funding supply portfolios, the state has key regulatory roles that help define what is possible. This includes oversight of the approval process for water trades and infrastructure projects to develop new supplies. State matching grants have also incentivized local projects that build regional integration.88
Water suppliers in our survey gave the state mixed reviews on its helpfulness in these areas during this drought (Figure 11). State funding for local conservation projects received as many scores of helpful as unhelpful (25%). More suppliers rated state funding for local supply projects unhelpful (27%) than helpful (15%). The same was true for regulatory actions, including fast-tracking construction permits (22% unhelpful, versus 9% helpful) and facilitating water trades (18% unhelpful, versus 10% helpful). Focus group participants also suggested that they found the state’s actions in these areas to be more unhelpful than helpful. For instance, several noted the administrative difficulties of trading water within their regions, even when they had interconnected infrastructure that would have made it physically possible.89
Perhaps more importantly, the state’s response to this drought created new uncertainties for local suppliers regarding their investments in drought-resilient supplies, because of concerns that these investments will not be utilized if the state again mandates conservation beyond what is locally needed. Approximately half the water suppliers responding to our survey said it was likely to very likely that they would reassess their long-term supply strategies. While in some cases this was linked to expectations of lower future demand, having such investments stranded in the future was a clear concern for some. The following two comments from survey respondents typify the concerns we heard in our water supplier workshops:
“Our region will probably reduce … developing new supplies at the pace originally intended—it will depend on what the [state’s] long-term water use efficiency regulations turn out to be.”
….
“Any reassessment [of our long-term supply strategy] will occur only because of lack of trust in the state allowing us to implement our own plans.”
This type of uncertainty is very detrimental to planning for the next drought, and it highlights the importance of the state and local suppliers getting on the same page.
87 As an indication, smaller utilities were just as likely to self-certify drought supplies as larger ones. 88 Several billion dollars in state bond funds have been made available to support local conservation and supply investments, and the state has favored projects that build regional integration (Hanak et al. 2014, Jezdimirovic and Hanak 2016). 89 Consistent with this feedback, water market trends through 2014 show that trading has slowed somewhat in recent droughts, reflecting institutional and infrastructure barriers (Hanak and Stryjewski 2012, Hanak and Jezdimirovic 2016a).

PPIC.ORG/WATER Building Drought Resilience in California’s Cities and Suburbs 45
Recommended Actions Priorities in this area include continued local and state support for regional integration and greater attention to the regulatory context in which planning and investment decisions are made.
(1) Support regional integration
Local and state efforts to foster regional approaches to drought resilience should continue. For the state, this includes incentivizing regional investments with available funding programs.
(2) Facilitate water trading during droughts
The state should prioritize removing barriers to water trading―for instance, by preauthorizing some transfers and expediting reviews.90 Urban utilities can also help themselves by seeking regulatory preapprovals of regional trades that can be activated during droughts.
(3) Lower regulatory hurdles to non-traditional supplies
Expanding some non-traditional supply sources such as recycled water and stormwater capture will require help from the state in overcoming regulatory hurdles. This includes permitting to build new facilities to, for example, treat wastewater to drinking water standards. It also includes developing new standards that give local suppliers more options—potentially at lower cost—for using recycled water.91
(4) Reduce uncertainties about state policies affecting urban water investments
The state needs to recognize that policies it establishes on the demand side will influence urban investments in supply portfolios. Adopting a stress test approach—and clarifying that the state will not mandate savings that are not locally needed—is important to avoid undermining local drought resilience efforts.
Improving Water Suppliers’ Fiscal Resilience Although in general we did not detect significant gaps in local supplier preparedness from a water supply and demand management perspective, their fiscal vulnerability to the drought was widespread. These problems were amplified for some by the mandate, but the drought itself was the primary driver, causing more than 60 percent of all suppliers to experience declines in their net financial positions. Investor-owned utilities were far less likely to experience financial difficulties because they had CPUC-approved rate adjustment mechanisms going into the drought. This is a perennial problem for public water agencies in California, which generally lack the ability to swiftly implement drought surcharges and hold adequate reserves to cover their fixed costs when sales decline.92
The lack of fiscal preparedness among public water agencies is somewhat surprising, given how much utilities prepare for droughts in other ways. The strong seasonality of precipitation in California means that suppliers have a very good idea every spring of what their supplies for the year will be, and whether they will need to call for increased conservation that summer. Proposition 218-related restrictions make it hard to adjust rates quickly. This makes it all the more important that utilities plan ahead.
90 See Gray et al. (2015) for a discussion of actions the state and local utilities can undertake to improve the trading environment. 91 To date, recycled water is used for non-potable purposes such as landscape irrigation and industrial processes and cooling. Highly treated recycled water is also used in some places to recharge groundwater basins that are used as a potable water supply source. Regulatory frontiers in this area include authorizing the incorporation of highly treated recycled water into surface reservoirs (which is now under consideration by the City of San Diego), as well as “direct potable reuse,” which incorporates highly treated recycled water directly into the water supply. California is in the early stages of developing regulations that would make this possible (Pottinger 2016). 92 Reserves are a form of self-insurance and can make good economic sense, but they carry significant political risks, especially because the possibility of prolonged drought may require large reserve levels in order to be actuarially sound. The water industry is also starting to explore the feasibility of weather hedges and other market-based insurance and derivative contracts to better manage revenue volatility (Alliance for Water Efficiency 2014, Zeff and Characklis 2013). For general guidelines on building fiscal sustainability, see Alliance for Water Efficiency, financingsustainablewater.org.

PPIC.ORG/WATER Building Drought Resilience in California’s Cities and Suburbs 46
Legal uncertainties around Proposition 218’s requirements that charges must be directly proportionate to the cost of service may also limit public water agencies’ ability to administer drought-related rate adjustments—such as introducing a drought surcharge or adjusting tiers. In practice, it can be difficult to show that surcharges for higher levels of water use meet the proportionality test.93 These uncertainties may also impede utilities’ efforts to promote conservation over the longer term using tiered rate structures.
Recommended Actions Utilities can improve their ability to weather future droughts by being more proactive about drought pricing and communicating with their customers. The state can also help by offering utilities guidance in navigating Proposition 218’s cost-of-service requirements, particularly during times of drought.
(1) Adopt drought-responsive pricing structures
To maintain fiscal resilience during droughts, public water agencies need to adopt rate structures that build in pre-approved rate adjustment mechanisms for droughts.
(2) Improve communications with customers about costs
Pre-approved rate structures should help avoid the customer relations problems that occur when utilities have to play catch-up, raising rates after drought-related savings have already occurred. Utilities can develop clear, up-front messaging about the cost structures of these community-owned water systems and the need to recover fixed costs during droughts.
(3) Address Proposition 218’s cost-of-service issues
While maintaining cost-of-service accountability to customers is essential, there are also good reasons to reform Proposition 218’s proportionate cost-of-service requirements for urban water rates. Suppliers need more flexibility to use price signals to promote water use efficiency, particularly during droughts.
Reforming this law can only be accomplished with a majority vote of the public to amend the constitution. But the state can help promote change. The state legislature or citizens’ groups can put such a measure on the ballot.94 Legislation can also be enacted to advise the courts on the relationship between cost-of-service restrictions under Proposition 218 and the requirements of emergency drought water management (Gray et al. 2014, Hanak et al. 2014).
Reforming Proposition 218 may take time. In the meanwhile, the state can help water suppliers navigate the rate-setting complexities of current law. In the words of one survey respondent:
“State-developed guidance and recommended policy for managing reduced revenues resulting from conservation mandates and drought that agencies could cite when proposing and adopting new policy/ rates would be beneficial.”
Addressing Shortages in Vulnerable Communities and Ecosystems Although messaging around the state mandate suggested that urban water savings could be used to help reduce drought impacts in at-risk communities and ecosystems, our survey results suggest that this largely did not occur. This reflects the fact that there were no straightforward ways to get the saved water to some of the most vulnerable communities and ecosystems.
93 See Hanak et al. (2014) for a discussion of the complexities associated with allocating costs of water service to individual parcels (Box 3 and related discussion). 94 Senate Constitutional Amendment 4 is one such measure, under consideration in the 2017 legislative session.

PPIC.ORG/WATER Building Drought Resilience in California’s Cities and Suburbs 47
One case in point was small, well-dependent rural communities—a group with longstanding vulnerabilities to drought.95 More than 100 small water systems faced shortages and more than 2,000 domestic wells went dry during this drought, mostly in poor, rural communities (Hanak et al. 2015). Some urban suppliers were able to help communities within their regions, but in most cases lack of interconnections and long distances to urban systems made this difficult or impossible. The state worked with counties and local nonprofits to get water to failed systems and residents reliant on dry domestic wells—usually by trucking it in.
Another perennially vulnerable area was California’s riverine and wetland ecosystems, which were even more stressed during this drought than past ones because of record heat (Hanak et al. 2015). In most watersheds, the state lacked clear and consistent policies regarding how much water was needed to protect the environment during droughts (Gray et al. 2015 and Mount et al. 2016). This limited the extent to which cities and farms were asked to contribute to alleviating environmental water shortages.
The lesson is that simply saving water in cities is not enough to provide meaningful assistance to at-risk communities and ecosystems. California needs better drought preparation and responses for these vulnerable sectors.
Recommended Actions The state needs to take the lead in tackling these issues, but urban communities can contribute to meaningful long-term solutions.
(1) Improve small-community drinking water supplies
Some small communities are in close enough proximity to urban areas that it is feasible to connect them to urban water systems. For more remote communities, another option is administrative consolidation, where the urban utility takes on the technical and managerial oversight of the system.96 Less formal arrangements, such as agreements to provide technical assistance, are also possible. The state should promote these good neighbor policies—which can also help small systems with unsafe water quality—with financial assistance and supportive policies. Recent legislation, for instance, protects urban utilities from liability for pre-existing problems when they connect small systems to their network.97
(2) Promote watershed health
Building drought resilience in aquatic ecosystems will require a suite of actions to identify priority habitats, develop baseline levels of environmental flows that are enforceable during droughts, and implement flexible strategies to acquire water through trading where and when it is most needed (Gray et al. 2015, Mount et al. 2016). Here again, the state needs to take the lead in establishing environmental protections and developing funds to support water trading programs and other investments in habitat. Urban water suppliers—along with farm water users—can make essential contributions to this process by seeking cooperative approaches to protect
95 As DWR notes in its 2015 review of past droughts, “Water shortage problems with small systems on unreliable sources have been consistently observed in past droughts, and the requirements of shortage contingency planning …are not applicable to smaller systems.” (Department of Water Resources 2015, p. 78). 96 Investor-owned utilities and several public water agencies already do this. 97 In Riverside County, the Eastern Municipal Water District recently relied on this change and state funding to connect a small, aging water system to its service area (Valley News 2017). Another community benefitting from consolidation is East Porterville (Tulare County), where well-dependent homes (many of which went dry during this drought) are being connected to the neighboring water system (McGaffic 2016). See McCann and Chappelle (2015) and McCann and Hanak (2016) for descriptions of recent legislation enacted to address safe drinking water issues in rural communities.

PPIC.ORG/WATER Building Drought Resilience in California’s Cities and Suburbs 48
watershed health.98 When solutions require communities to reduce water diversions from vulnerable rivers and streams during droughts, both short- and long-term water savings can be important parts of the toolkit.99
Balancing Long-Term Conservation with Drought Resilience Coming out of this drought, both the state and local water suppliers are emphasizing the importance of making durable reductions in per capita water use for the long term. It is important to recognize that the way these savings are used will have important implications for future drought resilience. Water freed up by long-term water conservation can help regions accommodate future growth, provide greater drought resilience, or be used to benefit the environment, but the same water cannot serve all of these purposes simultaneously. Saved water can only provide greater drought resilience if it is accompanied by storage or exchange arrangements so that it can be called upon when drought strikes.
Presently, a large fraction of drought reserves in urban areas comes from water applied to landscapes during normal hydrologic conditions. During droughts, this water can be re-purposed to more essential uses and help mitigate economic losses. A cornerstone of the state’s “Making Water Conservation a California Way of Life” policy is to increase water use efficiency and eliminate “wasteful” water use in urban landscapes (State of California 2017). Reducing waste and inefficiency is generally a laudable goal. But it is also important to recognize that waste in one context can be salvation in another.
One implication of the state’s long-term conservation policy is that in future droughts, urban communities may find they have less flexibility to generate large savings over short periods. As one water manager told us, “You can’t put a brick in a low-flow toilet, and you can’t stop watering your plastic lawn.”100 This means the water savings will have to come from more essential water uses. The term used in the literature is “demand hardening.” As inefficiency is wrung out of the system, the ability or willingness to curtail water use in times of shortage is lessened because the cost of doing so has become greater. Of course, if the saved water is reserved in some way for such emergencies, urban areas will have the same (or perhaps even greater) ability to accommodate a water shortage as before.101 But this will not be the case if the water is instead used for growth or re-purposed to the environment (Martin et al. 1984).
To be clear, this does not mean that long-term conservation is a bad policy objective; it simply means there is a potential trade-off that must be recognized in planning for drought resilience. To date, demand hardening has not been a major factor affecting the ability of urban areas to curtail water use in times of shortage (Alliance for Water Efficiency 2015). But this could change in the future, especially if water used in urban landscapes is substantially reduced. State and local water shortage contingency planning needs to account for this possibility.
98 For example, the Sonoma County Water Agency and its member agencies support a program to protect flows in the Russian River watershed and fund ecosystem restoration for salmon and steelhead (Hanak et al. 2014). An example of such cooperation involving farming interests is in the Yuba River watershed, with the Yuba County Water Agency and its member agencies (Ugai 2017, Hanak et al. 2011, pp. 335, 408). 99 In places with clear plans for addressing environmental flows, it may also be possible to use tools such as groundwater storage to mitigate drought impacts for the environment and water users. This is a key element of the Yuba River Accord (see the preceding note). 100 Our analyses of statewide urban water use (Technical Appendix A) and Cal Water household-level water use (Technical Appendix C) show that reduced landscape water use was a key driver of drought water savings. The level of savings achieved by communities and individual households positively correlated with the extent of water used for landscaping. 101 The question then is whether it is better to continue to “store” this water within urban landscapes or to extract it from those landscapes and store it more conventionally. This question cannot be fully answered without also taking into account how reductions in landscaping could effect a range of benefits provided by urban landscapes—including better air quality, mitigation of the urban “heat island effect” (the increase in local temperatures caused by heat-reflecting surfaces), the capture and filtering of storm water, and improved aesthetics and recreational opportunities (Beard and Green 1994). Treating landscape watering as a flexible use of water has parallels in the agricultural sector. Because the economic losses from fallowing annual crops are often lower, this facilitates water trading to enable irrigation on orchards and vineyards during droughts. The shift over time to more perennial crop acreage in some water-scarce areas like the San Joaquin Valley has raised similar questions about tradeoffs in the agricultural sector (Hanak et al. 2017, Loch et al. 2017, Franklin et al. 2017).

PPIC.ORG/WATER Building Drought Resilience in California’s Cities and Suburbs 49
Recommended Actions Several actions can help the urban water sector address trade-offs between long-term conservation and drought resilience. Although local utilities—and regional water wholesalers—will need to take the lead in this work, the state can play a vital support role by updating urban water management planning requirements and guidelines.
(1) Allocate some water savings to a reliability reserve
One way communities could translate long-term savings into gains in reliability would be by adopting San Luis Obispo’s reliability reserve approach, described earlier. This would mean ensuring that some portion of long-term or structural demand management savings may not be used to serve future development, but rather would be reserved in storage for times of drought emergency.
(2) Update water shortage contingency planning guidelines and requirements
A key finding from the Alliance for Water Efficiency’s 2015 report on long-term conservation and demand hardening is that contingency plans will likely need to be modified as outdoor water use is significantly reduced over time. In particular, water suppliers will need to tailor their contingency plans to reflect how water is being used in their service areas. As outdoor water use is ratcheted down by long-term efficiency standards, it is likely to become necessary to target reductions in indoor water use sooner than was previously the case. This is something the state and urban water suppliers can reasonably anticipate and plan for. Working with organizations like the Association of California Water Agencies and the American Water Works Association, for example, the state could develop model shortage contingency plans or cases studies under different mixes of urban water use, and update planning guidelines to address the implications of demand hardening on drought response.
(3) Incorporate formal service-reliability goals into long-range water supply planning
Formal service-reliability goals can help to guide and rationalize the type, level, and timing of water supply and demand management investments. Many of California’s large urban water suppliers already do this (Table 1), but many small and medium-sized suppliers still do not. Establishing an optimal level of reliability for a water system requires jointly considering two interrelated costs (Mitchell et al. 2014). The first is the cost of supply and demand management investments—costs that current and future ratepayers will incur directly through their utility’s rates and charges. The second is the cost of periodic water shortages that current and future ratepayers will incur under different levels of reliability.102 These two costs move inversely to one another, with higher reliability entailing more investment cost and less shortage cost, and vice versa. From an economic perspective, an optimal reliability level is one that minimizes the sum of the two costs. One of the main benefits of going through the process of establishing service-reliability goals is making these cost trade-offs both explicit and transparent to utility decision makers and the public they serve.
There is no reason to expect, and certainly no reason to promote, the same level of service reliability across all water systems. The “right” amount of reliability depends on a host of factors—existing infrastructure and capacity, availability and cost of additional supply, risk and cost of water shortage, and community preferences—that will differ across communities and regions. But there is reason for the state to promote and support the incorporation of formal service-reliability goals into urban water management planning and to work with urban water suppliers on the development of guidelines and standards for establishing such goals.
102 Shortage costs are typically measured by estimating the willingness-to-pay of water users to avoid the shortages (Young 2005). For an in-depth discussion of urban water shortage cost and an example of how it can be measured, see Buck et al. (2016).
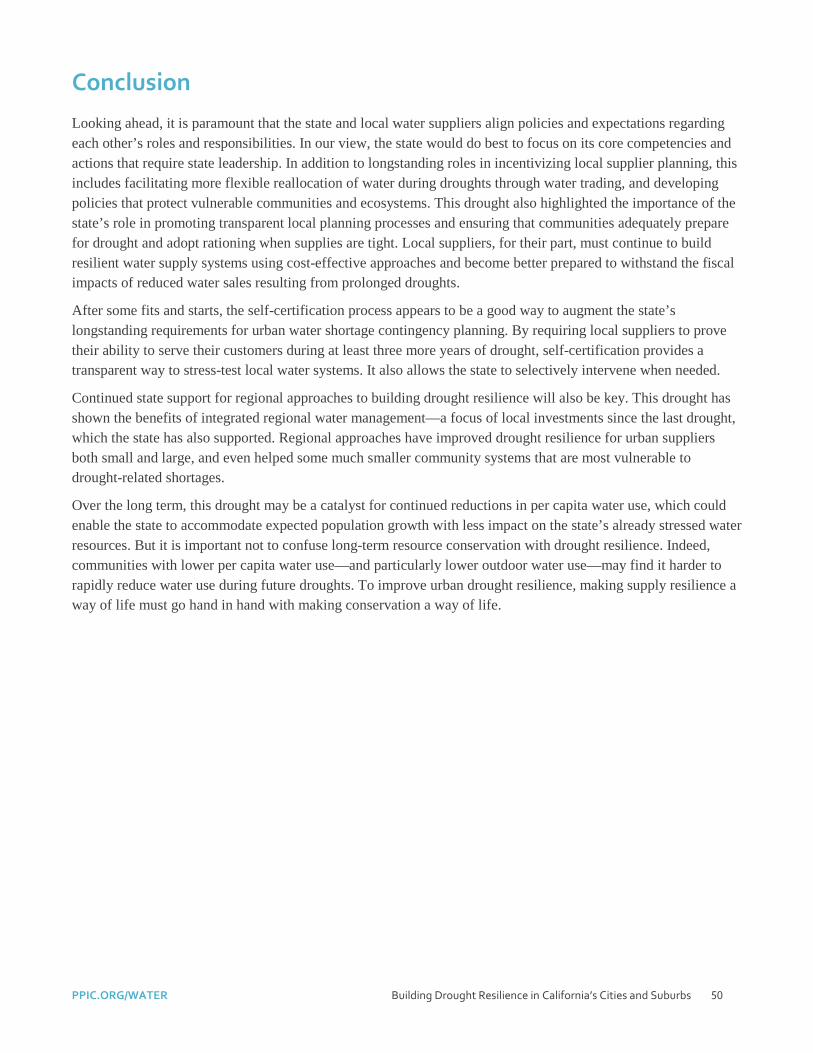
PPIC.ORG/WATER Building Drought Resilience in California’s Cities and Suburbs 50
Conclusion
Looking ahead, it is paramount that the state and local water suppliers align policies and expectations regarding each other’s roles and responsibilities. In our view, the state would do best to focus on its core competencies and actions that require state leadership. In addition to longstanding roles in incentivizing local supplier planning, this includes facilitating more flexible reallocation of water during droughts through water trading, and developing policies that protect vulnerable communities and ecosystems. This drought also highlighted the importance of the state’s role in promoting transparent local planning processes and ensuring that communities adequately prepare for drought and adopt rationing when supplies are tight. Local suppliers, for their part, must continue to build resilient water supply systems using cost-effective approaches and become better prepared to withstand the fiscal impacts of reduced water sales resulting from prolonged droughts.
After some fits and starts, the self-certification process appears to be a good way to augment the state’s longstanding requirements for urban water shortage contingency planning. By requiring local suppliers to prove their ability to serve their customers during at least three more years of drought, self-certification provides a transparent way to stress-test local water systems. It also allows the state to selectively intervene when needed.
Continued state support for regional approaches to building drought resilience will also be key. This drought has shown the benefits of integrated regional water management—a focus of local investments since the last drought, which the state has also supported. Regional approaches have improved drought resilience for urban suppliers both small and large, and even helped some much smaller community systems that are most vulnerable to drought-related shortages.
Over the long term, this drought may be a catalyst for continued reductions in per capita water use, which could enable the state to accommodate expected population growth with less impact on the state’s already stressed water resources. But it is important not to confuse long-term resource conservation with drought resilience. Indeed, communities with lower per capita water use—and particularly lower outdoor water use—may find it harder to rapidly reduce water use during future droughts. To improve urban drought resilience, making supply resilience a way of life must go hand in hand with making conservation a way of life.

PPIC.ORG/WATER Building Drought Resilience in California’s Cities and Suburbs 51
REFERENCES Alliance for Water Efficiency. 2014. Sustainable Utilities: Financial Instruments to Manage Weather-Related Revenue Risk (accessed on
December 13, 2016).
Alliance for Water Efficiency. 2015. An Assessment of Increasing Water-Use Efficiency on Demand Hardening (accessed on April 22, 2017).
Baldassare, Mark, Dean Bonner, David Kordus, and Lunna Lopes. 2015a. PPIC Statewide Survey: Californians and their Government (May). Public Policy Institute of California.
Baldassare, Mark, Dean Bonner, David Kordus, and Lunna Lopes. 2015b. PPIC Statewide Survey: Californians and the Environment (July). Public Policy Institute of California.
Baldassare, Mark, Dean Bonner, Sonja Petek, and Jui Shrestha. 2014. PPIC Statewide Survey: Californians and the Environment (July). Public Policy Institute of California.
Bay Area Regional Reliability. n.d. BARR Fact Sheet (accessed on December 6, 2016).
Beard, J., and R. Green. 1994. “The Role of Turfgrasses in Environmental Protection and their Benefits to Humans.” Journal of Environmental Quality. 23 (3).
Brown, Governor Jerry. 2014a. “Governor’s Drought Declaration.” January 17.
Brown, Governor Jerry. 2014b. “A Proclamation of a Continued State of Emergency.” April 25.
Buck, S., M. Nemati, and D. Sunding. 2016. “The Welfare Consequences of the 2015 California Drought Mandate: Evidence from New Results on Monthly Water Demand.” Paper presented at the 2016 Annual Meeting of the Agricultural and Applied Economics Association, Boston, Massachusetts, July 31-August 2. No. 236049.
Department of Water Resources. 1978. The 1976–1977 California Drought: A Review. May.
Department of Water Resources. 1993. California’s 1987–92 Drought: A Summary of Six Years of Drought.
Department of Water Resources. 2010. California’s Drought of 2007–2009: An Overview.
Department of Water Resources. 2015. California’s Most Significant Droughts: Comparing Historical and Recent Conditions.
California Coastkeeper Alliance, Community Water Center, and Natural Resources Defense Council. 2016. Environmental Community Calls for Reinstatement of Emergency Water Use Standards in Light of Declining Conservation. November 1.
Cody, Betsy, Peter Folger, and Cynthia Brown. 2015. California Drought: Hydrological and Regulatory Water Supply Issues. Congressional Research Service. R40979.
DeOreo, W., P. Mayer, B. Dziegielewski, and J. Kiefer. 2016. Residential End Uses of Water, Version 2. Water Research Foundation.
Diffenbaugh, Noah, Daniel Swain, and Danielle Touma. 2015. “Anthropogenic Warming Has Increased Drought Risk in California.” Proceedings of the National Academy of Sciences 112 (13): 3931-3936.
Dixon, Lloyd, Nancy Moore, and Ellen Pint. 1996. Drought Management Policies and Economic Effects in Urban Areas of California, 1987-1992. RAND.
Escriva-Bou, Alvar, Brian Gray, Ellen Hanak, Jeffrey Mount. 2017. California’s Future: Climate Change. Public Policy Institute of California.
Foster Associates. 1994. The Impact of Water Shortage and Recession on California’s Green Industry. Los Angeles: Metropolitan Water District of Southern California.
Franklin, B., K. Knapp, and K. Schwabe. 2017. “A Dynamic Regional Model of Irrigated Perennial Crop Production.” Water Economics and Policy, 3(1): DOI: 10.1142/S2382624X16500363
Goulden, M. and R.C. Bales. 2016. “Widespread Tree Mortality with the Ongoing California Drought: The Role of Water Balance and Temperature.” Fall Meeting, American Geophysical Union. December.
Gray, Brian, Dean Misczynski, Ellen Hanak, Andrew Fahlund, Jay Lund, David Mitchell, and James Nachbaur. 2014. Paying for Water in California, Technical Appendix A: The Legal Framework. Public Policy Institute of California.
Gray, Brian, Ellen Hanak, Richard Frank, Richard Howitt, Jay Lund, Leon Szeptycki, Buzz Thompson. 2015. Allocating California’s Water. Public Policy Institute of California.
Groc, Isabelle. 2016. “Why Economic Losses from the Drought Are Low.” Water Deeply Blog. March 3.

PPIC.ORG/WATER Building Drought Resilience in California’s Cities and Suburbs 52
Griffin, D., and K. J. Anchukaitis. 2014. “How Unusual Is the California 2012–2014 Drought?” Geophysical Research Letters, 41, 9017–9023,doi:10.1002/2014GL062433.
Griffin, R. 2016. Water Resource Economics: The Analysis of Scarcity, Policies and Projects, second ed. The MIT Press.
Hanak, Ellen and Matthew Davis. 2006. Lawns and Water Demand in California. Public Policy Institute of California.
Hanak, Ellen. 2010. “Show Me the Water Plan: Urban Water Management Plans and California’s Water Supply Adequacy Laws.” 4 Golden Gate University Environmental Law Journal.
Hanak, Ellen and Jelena Jezdimirovic. 2016a. “California’s Water Market.” Just the Facts (March). Public Policy Institute of California.
Hanak, Ellen and Jelena Jezdimirovic. 2016b. “Water Marketing That Helps Nature.” PPIC Blog. September 13.
Hanak, Ellen, Jay Lund, Ariel Dinar, Brian Gray, Richard Howitt, Jeffrey Mount, Peter Moyle, Buzz Thompson. 2011. Managing California’s Water: From Conflict to Reconciliation. Public Policy Institute of California.
Hanak, Ellen, Jay Lund, Brad Arnold, Alvar Escriva-Bou, Brian Gray, Sarge Green, Thomas Harter, Richard Howitt, Duncan MacEwan, Josué Medellín-Azuara, Peter Moyle, Nathaniel Seavy. 2017. Water Stress and a Changing San Joaquin Valley. Public Policy Institute of California.
Hanak, Ellen and Elizabeth Stryjewski. 2012. California’s Water Market, By the Numbers: Update 2012. Public Policy Institute of California.
Hanak, Ellen, Brian Gray, Jay Lund, David Mitchell, Caitrin Chappelle, Andrew Fahlund, Katrina Jessoe, Josué Medellín-Azuara, Dean Misczynski, James Nachbaur, and Robyn Suddeth. 2014. Paying for Water in California. Public Policy Institute of California.
Hanak, Ellen, Jeffrey Mount, Caitrin Phillips-Chappelle, Jay Lund, J Josué Medellín-Azuara, Peter Moyle, and Nathaniel Seavy. 2015. What If California’s Drought Continues? Public Policy Institute of California.
Hanak, Ellen, Ken Baerenklau, Alvar Escriva-Bou, Jay Lund, Kurt Schwabe, Newsha Ajami, J.R. DeShazo, David Mitchell, Jean-Daniel Saphores, David Sedlak, and Casey Wichman. 2016. California’s Water: Water for Cities. Public Policy Institute of California.
Hayek, Friedrich A. 1945. “The Use of Knowledge in Society.” American Economic Review. 35(4): 519-30.
Healy, Patrick. 2015. “Drought Conservation Puts Water District and Customers in Catch 22 over Fee Increase.” NBC Los Angeles, October 14.
Hirshleifer, J., J. DeHaven, and J. Milliman, 1960. Water Supply: Economics, Technology, and Policy. University of Chicago Press.
Irvine Ranch Water District. 2014. “Irvine Ranch Water District Statewide Drought Regulations: Always Business Smart.” Presentation slides (accessed on January 28, 2017).
Jezdimirovic, Jelena, and Ellen Hanak. 2016. “How is California Spending the Water Bond?” PPIC Blog. June 16.
Jones, J., J.S. Matyac, and M. Orang. 2001. “Uses of a Long-term Water Production Database.” Journal of the American Water Works Association. March.
Legislative Analyst’s Office. 1995. “The California Economy” (accessed on November 30, 2016).
Legislative Analyst’s Office. 2015. “Limited Statewide Economic Impact of Drought,” California Economy & Taxes. April 14.
Loch, A., D. Adamson, and K. Schwabe. 2017. “Adaptation Responses to Increasing Drought Frequency.” Australian Journal of Agricultural and Resource Economics. Forthcoming.
Martin, W., H. Ingram, N. Laney, and A. Griffin. 1984. Saving Water in a Desert City. Resources for the Future.
McCann, Henry and Ellen Hanak. 2016. “New Laws Strengthen State’s Water Safety Net.” PPIC Blog. October 5.
McCann, Henry and Caitrin Chappelle. 2015. “Drought Bills: Small Changes, High Impact.” PPIC Blog. June 20.
M.Cubed. 2012. “California’s Economy in the Age of Water Scarcity: The Case for Private Sector Engagement in California Water Policy.” California Water Foundation.
Metropolitan Water District of Southern California. 2016. Water Tomorrow, Regional Progress Report to the California State Legislature on Achievements in Conservation, Recycling, and Groundwater Recharge (accessed on December 6, 2016).
Mitchell, D. and T.W. Chesnutt. 2013. Evaluation of East Bay Municipal Utility District’s Pilot of WaterSmart Home Water Reports. A report prepared for California Water Foundation and East Bay Municipal Utility District.
Mitchell, D., D. Sunding, and G. Fiske. 2014. Urban Water Supply Investment: Why Shortage Cost Matters. California Water Foundation.
PPIC.ORG/WATER Building Drought Resilience in California’s Cities and Suburbs 53
Mitchell, D., S. Moss, and R. Mann. 2016. Proposed Regulatory Framework for Extended Emergency Regulation for Urban Water Conservation: Fiscal and Economic Impact Analysis. Prepared for the State Water Resources Control Board (accessed on December 12, 2016).
Moss, S., R. McCann, D. Mitchell, E. Stryjewski, R. Mann, T. Wegge, D. MacEwan, and R. Howitt. 2015. Executive Order B-29-15 State of Emergency Due to Severe Drought Conditions Economic Impact Analysis. Prepared for the State Water Resources Control Board (accessed on December 12, 2016).
Mount, Jeffrey. 2014. “Size Matters….in a Drought.” PPIC Blog. February 11.
Mount, Jeffrey, Caitrin Chappelle, Brian Gray, Ellen Hanak, Richard Howitt, Jay Lund, Richard Frank, Greg Gartrell, Ted Grantham, Josué Medellín-Azuara, Peter Moyle, Barton “Buzz” Thompson, and Joshua Viers. 2016. California’s Water: Managing Droughts. Public Policy Institute of California.
Mount, Jeffrey, Caitrin Chappelle, Brian Gray, Ellen Hanak, Jay Lund, James Cloern, William Fleenor, Wim Kimmerer, Peter Moyle. 2016b. California’s Water: The Sacramento–San Joaquin Delta. Public Policy Institute of California.
Mount, Jeffrey and Ellen Hanak. 2016. Water Use in California. Public Policy Institute of California.
Neese, David. 2015. “Jerry Brown on California Drought: ‘Climate Change is Not a Hoax’.” ABC’s This Week, April 5.
Pottinger, Lori. 2016. “Recycled Drinking Water: The Next Frontier.” PPIC Blog. October 17.
Quinn, Tim. 2016a. “Stress Test Results Are a Good News Story.” Association of California Water Agencies Blog. August 3.
Quinn, Tracy. 2016b. “State Board Lets Water Suppliers Set Their Own Conservation Targets.” NRDC Blog. May 19.
Quinn, Tracy. 2016c. “MWD Rolls the Dice with Our Water Supplies During Drought.” NRDC Blog. August 4.
Reese, Philip and Ryan Sabalow. 2016. “California Backing Away from Strict Water-savings Standards.” Sacramento Bee. May 9.
Sabalow, Ryan. 2016. “How Revenue Losses Played into Decision to Relax Conservation Rules in California.” Sacramento Bee. July 15.
Sacramento River Regional Water Reliability Project. 2015. Planning Phase I. Prepared by West Yost Associates, September.
Salazar, Denisse. 2016. “Recall Successful in Yorba Linda Water Board; City Council Adding Two New Faces.” Orange County Register. November 9.
Siders, David. 2015. “California Drought Resurrects Old Population Growth Concerns.” Sacramento Bee. June 27.
State of California. 2014. California Water Action Plan. California Natural Resources Agency, California Department of Food and Agriculture, and California Environmental Protection Agency.
State of California. 2017. Making Water Conservation a California Way of Life: Implementing Executive Order B-37-16, April 2017 (accessed on April 18, 2017).
State Water Resources Control Board. 2015b. “Resolution No. 2015-0032 to Adopt an Emergency Regulation for Statewide Urban Water Conservation” (accessed on January 30, 2017).
State Water Resources Control Board. 2015c. Annual Compliance Report 2015.
State Water Resources Control Board. 2015d. A Guide for Private Well Owners.
Ugai, John. 2017. “Conjunctive Use on the Yuba: Lessons from Drought Management in the Yuba Watershed.” West-Northwest Journal of Environmental Law and Policy. 23(1): 57-82.
University of North Carolina Environmental Finance Center. 2014. Measuring & Mitigating Water Revenue Variability: Understanding How Pricing Can Advance Conservation Without Undermining Utilities’ Revenue Goals.
Valley News. 2017. “Eastern Municipal Water District Begins Service to County Water Company Customers.” April 21.
Williams, A. P., R. Seager, J. T. Abatzoglou, B. I. Cook, J. E. Smerdon, and E. R. Cook. 2015. “Contribution of Anthropogenic Warming to California Drought During 2012–2014,” Geophysical Research Letters, 42, 6819–6828, doi:10.1002/2015GL064924.
Young, R. 2005. “Determining the Economic Value of Water: Concepts and Methods.” Resources for the Future, Washington, D.C.
Zeff, H. B., and G. W. Characklis. 2013. “Managing Water Utility Financial Risk through Third-Party Index Insurance Contracts,” Water Resources Research. Research. 49: 4939–4951, doi:10.1002/wrcr.20364.

PPIC.ORG/WATER Building Drought Resilience in California’s Cities and Suburbs 54
ABOUT THE AUTHORS David Mitchell is a principal at M.Cubed, an economic consulting firm based in Oakland, California, specializing in water and energy resources management. He has been directly involved in a range of regional and statewide water and natural resource management initiatives, including the Bay Delta Conservation Plan (lead economist for cost analysis), the Delta Risk Management Strategy (economic impact assessment of disruption to Delta exports), the CALFED Bay Delta Program, the Lake Tahoe Environmental Improvement Program, and the California State Water Plan. He consults with water utilities throughout California on water resources management and financial planning issues. He holds a BSc and MSc in agricultural and resource economics from the University of California, Berkeley.
Ellen Hanak is director of the PPIC Water Policy Center and a senior fellow at the Public Policy Institute of California. Under her leadership, the center has become a critical source of information and guidance for natural resource management in California. She has authored dozens of reports, articles, and books on water policy, including What If California’s Drought Continues? and Managing California’s Water. Her research is frequently profiled in the national media, and she participates in briefings, conferences, and interviews throughout the nation and around the world. Her other areas of expertise include climate change and infrastructure finance. Previously, she served as research director at PPIC. Before joining PPIC, she held positions with the French agricultural research system, the President’s Council of Economic Advisers, and the World Bank. She holds a PhD in economics from the University of Maryland.
Ken Baerenklau is an associate professor of environmental economics and policy in the School of Public Policy and associate provost at the University of California, Riverside. He is also a cooperating faculty member in the Departments of Economics and Environmental Sciences at UC Riverside and an adjunct fellow at the PPIC Water Policy Center. He has more than 15 years of experience working on a variety of issues related to water resource management, and is an associate editor for Water Resources Research. He holds a BS and MS in civil and environmental engineering from Stanford University and a PhD in agricultural and applied economics from the University of Wisconsin, Madison.
Alvar Escriva-Bou is a research fellow at the PPIC Water Policy Center. His research explores integrated water, energy, and environmental resources management, including systems approaches, simulation and optimization of economic-engineering models, and climate change analysis. Previously, he worked as a civil engineer managing and developing large infrastructure projects for local and regional governments and consulting firms in Spain. He holds a PhD and MS in water and environmental engineering and a BS in civil engineering from the Polytechnic University of Valencia in Spain, and an MS in agricultural and resource economics from the University of California, Davis.
Henry McCann is a research associate at the PPIC Water Policy Center, where he works on data collection, analysis, mapping, and legislative tracking. He previously managed research projects within the Smart Water Systems initiative at the UCLA Luskin Center for Innovation, including volume 1 of Los Angeles County Community Water Systems: Atlas and Policy Guide. He holds an MA in urban and regional planning from the University of California, Los Angeles, and a BA from the University of Chicago in geographical studies.
María Pérez-Urdiales is a postdoctoral scholar at the School of Public Policy of the University of California Riverside. Her research focuses on applied econometrics and environmental economics, especially the analysis and design of residential water demand management policies. Her work has been published in journals including Environmental and Resource Economics and Ecological Economics. Previously, she worked as a postdoctoral researcher at the Public Economics Research Unit at the French National Institute of Agricultural Research (INRA) in Paris. She holds a PhD and MA in economics from the University of Oviedo in Spain, a BSc in actuarial and financial sciences, and a BA in business administration and management from the University of León in Spain.
Kurt Schwabe is a professor of environmental economics and policy at the School of Public Policy at the University of California, Riverside. He is also an adjunct policy fellow at the PPIC Water Policy Center, and adjunct professor at the Center for Global Food and Resources at the University of Adelaide. His research focuses on economic issues associated with water use and reuse, agricultural production, urban water conservation, ecosystem services, and environmental regulation. He has published more than 50 journal articles and book chapters, and is co-editor of two recent books on water: Drought in Arid and Semi-Arid Regions: A Multi-Disciplinary and Cross-Country Perspective and The Handbook of Water Economics. He holds a BA in mathematics and economics from Macalester College, an MS in economics from Duke University, and a PhD in economics from North Carolina State University.

PPIC.ORG/WATER Building Drought Resilience in California’s Cities and Suburbs 55
ACKNOWLEDGMENTS This research would not have been possible without the contributions of the many urban water managers who generously made time to participate in our survey and focus group discussions, as well as the state officials who kindly offered their input through interviews and focus group discussions. We also thank the following individuals whose reviews of an earlier draft of this report greatly improved this final version: Janice Beecher, Caitrin Chappelle, Wade Crowfoot, Greg Gartrell, Brandon Goshi, Ron Griffin, Ken Jenkins, Joone Lopez, and Dean Misczynski. Lori Pottinger and Lynette Ubois provided expert editorial support. Special thanks to Brian Gray, who served as lead reviewer and provided overall guidance to the team. The authors alone are responsible for any remaining errors or omissions.
This publication was developed with partial support from Assistance Agreement No. 83586701 awarded by the US Environmental Protection Agency to the Public Policy Institute of California. It has not been formally reviewed by EPA. The views expressed in this document are solely those of the authors and do not necessarily reflect those of the agency. EPA does not endorse any products or commercial services mentioned in this publication.

PUBLIC POLICY INSTITUTE OF CALIFORNIA
Board of Directors
Mas Masumoto, Chair Author and Farmer
Mark Baldassare President and CEO Public Policy Institute of California
Ruben Barrales President and CEO, GROW Elect
María Blanco Executive Director Undocumented Student Legal Services Center University of California Office of the President
Louise Henry Bryson Chair Emerita, Board of Trustees J. Paul Getty Trust
A. Marisa Chun Partner, McDermott Will & Emery LLP
Chet Hewitt President and CEO Sierra Health Foundation
Phil Isenberg Former Chair Delta Stewardship Council
Donna Lucas Chief Executive Officer Lucas Public Affairs
Steven A. Merksamer Senior Partner Nielsen, Merksamer, Parrinello, Gross & Leoni, LLP
Gerald L. Parsky Chairman Aurora Capital Group
Kim Polese Chairman ClearStreet, Inc.
Gaddi H. Vasquez Senior Vice President, Government Affairs Edison International Southern California Edison
Celeste Cantú, Chair General Manager Santa Ana Watershed Project Authority
Timothy Quinn, Vice Chair Executive Director Association of California Water Agencies
Linda Rosenberg Ach President The Rosenberg Ach Foundation
Mark Baldassare President and CEO Public Policy Institute of California
Dave Cogdill President & CEO California Building Industry Association
Wade Crowfoot CEO Water Foundation
Lauren B. Dachs President and Vice Chair of the Board of Directors S. D. Bechtel, Jr. Foundation
Daniel M. Dooley Principal New Current Water and Land, LLC
E. Joaquin Esquivel Board Member State Water Resources Control Board
Debbie Franco Community and Rural Affairs Advisor and Local Drought Liaison Governor’s Office of Planning and Research
Phil Isenberg Former Chair Delta Stewardship Council
David Puglia Executive Vice President Western Growers
Lester Snow Senior Advisor Water Foundation
Mike Sweeney Executive Director The Nature Conservancy California Chapter
PPIC WATER POLICY CENTER
Advisory Council

The Public Policy Institute of California is dedicated to informing and improving public policy in California through independent, objective, nonpartisan research.
Public Policy Institute of California 500 Washington Street, Suite 600 San Francisco, CA 94111 T: 415.291.440 F: 415.291.4401 PPIC.ORG/WATER
PPIC Sacramento Center Senator Office Building 1121 L Street, Suite 801 Sacramento, CA 95814 T: 916.440.1120 F: 916.440.1121