Building Diversity in the Scientific Workforce (nsf9837)
44
D IVERSITY in the Scientific Workforce Building A Report from the National Science Foundation Minority Postdoctoral Research Fellows and Mentors Annual Meeting September 11-13, 1996 Arlington, Virginia
Transcript of Building Diversity in the Scientific Workforce (nsf9837)

DIV
ERSI
TYin theScientificWorkforce
Building
A Report from
the National Science
Foundation Minority
Postdoctoral Research
Fellows and Mentors
Annual Meeting
September 11-13, 1996Arlington, Virginia


DIV
ERSI
TYin theScientificWorkforce
Building
A Report from
the National Science
Foundation Minority
Postdoctoral Research
Fellows and Mentors
Annual Meeting
September 11-13, 1996Arlington, Virginia

“Building Diversity in the Scientific Workforce” was the title
of a September 1996 meeting of NationalScience Foundation (NSF) Fellows andtheir sponsoring scientists. This reportwas written by several of the meeting’sparticipants, and a draft was circulated toall participants. It documents individualexperiences, opinions, and recommenda-tions, not an official NSF position. Anyopinions, findings, conclusions, or recommendations expressed in thisreport are those of the individual partici-pants and not those of the NationalScience Foundation.
Since 1990, NSF has awarded approxi-mately 12 Minority PostdoctoralResearch fellowships each year in
the biological, social, economic, andbehavioral sciences. Each year Fellowsand their mentors are invited to a workshop at NSF to present researchfindings, share information, and learnabout funding for science. For the 1996annual meeting, all former and currentFellows, their mentors, and minorityFellows from other NSF programs, e.g.,NATO, International Fellows, Chemistry, and Math Sciences, were included todocument the experiences of NSFFellows across all areas of science.
Preface
■
ii

iii
Preface ................................................................................................................................................................................. ii
Acknowledgments.............................................................................................................................................................. iv
Introduction ......................................................................................................................................................................... 1
Building Diversity in the Scientific Workforce: Recommendations of Postdoctoral Fellows ........................................ 3
Overview of Observations and Experiences................................................................................................................ 3
Key Concepts and Recommendations ......................................................................................................................... 4
A Proposal to Increase Entry and Retention of Minorities in Academic Science Programs..................................... 6
Guest Speaker Presentations ..............................................................................................................................................11
Access to Mathematics and Science Careers For UnderrepresentedMinority Students: Research Findings and Explorations ..............................................................................11
Production of Chicana and Chicano Doctoral Scientists: Status, Barriers, and Policy Recommendations............................................................................................. 17
Perceptions of Faculty Research Preceptors Toward Minority Undergraduates in a Summer Research Program...........................................................................24
Educational and Career Experiences of African-American PhD Scientists............................................................. 28
1996 National Science Foundation Minority Postdoctoral Research Fellows andMentors Annual Meeting Agenda..................................................................................................................................... 32
1996 National Science Foundation Minority Postdoctoral Research Fellows andMentors Annual Meeting Attendees ................................................................................................................................. 34
The National Science Foundation Mission .......................................................................................................................36
Table of Contents
Figure 1: Projected U.S. Population by Race and Hispanic Origin................................................................................. 2
Figure 2: Racial and Ethnic Populations in the United States: 1990............................................................................. 18
Figure 3: Latino Subpopulations in the United States: 1990 ......................................................................................... 19
Figure 4: Doctoral Parity in Science Fields by Race: 1980-1990.................................................................................. 21
Figure 5: Baccalaureate Origins of Science PhDs by Racial/Ethnic Group: 1980-1990..............................................21
Table 1: Number and Percent of Chicana and Chicano Doctorate Production by Science Fields: 1980-1990 .............................................................................................................................. 20
List of Figures
List of Tables

Building Diversity in the Scientific Workforce
iv
The National Science Foundationwishes to acknowledge the contribu-
tions of the many past and present NSFpostdoctoral fellows and their sponsorswho contributed to this report. Specialthanks go to the following fellows whoadvised and assisted in the preparation ofthis report: Kim E. Armstrong, PhD,Department of Psychology, University ofIllinois at Urbana-Champaign; Norma J.Burgess, PhD, Department of Child andFamily Studies, Syracuse University;
Mark A. Melton, PhD, Department ofPhysiology, School of Medicine,University of North Carolina-Chapel Hill;Peter Serrano, PhD, Department ofPsychology, Northwestern University;Pamela Sharpe, PhD, Department ofMolecular Biology and Genetics, JohnsHopkins University; and Leroy Worth, Jr.,PhD, Laboratory of Molecular Genetics,National Institute of EnvironmentalHealth Sciences.
Acknowledgments
Building Diversity in the Scientific Workforce
■

Chapter
1
The composition of the United Statespopulation in the 21st century will be
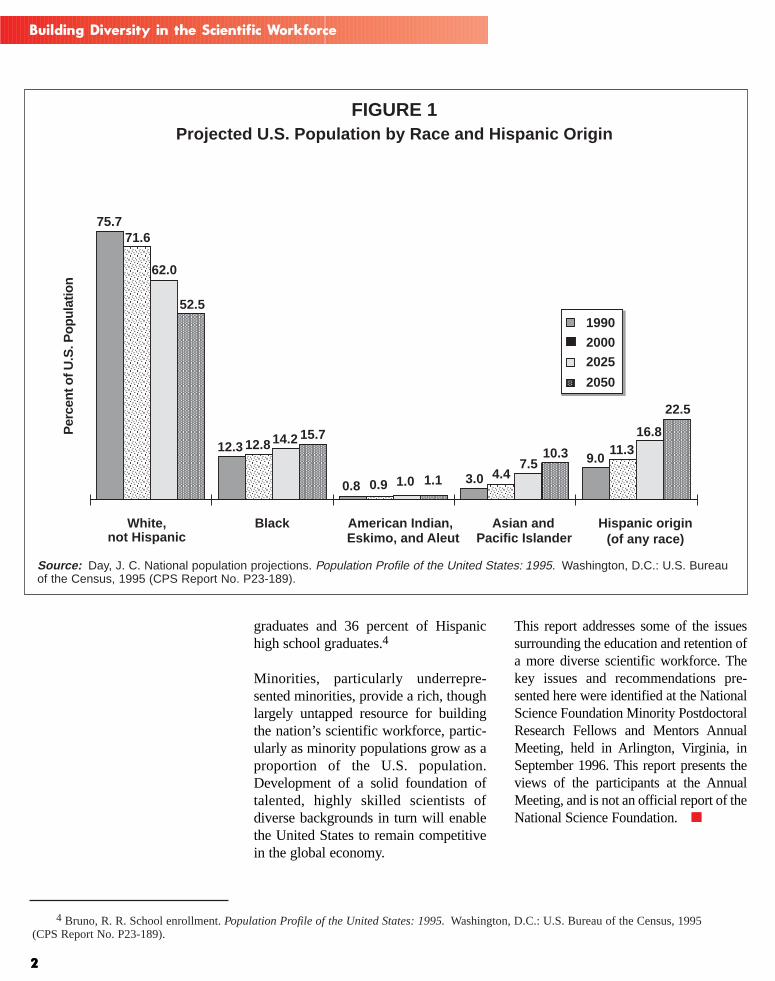
vastly different from that of the 20th cen-tury. Fertility and mortality rates, immi-gration patterns, and age distributionswithin subgroups of the population arecontributing to an increasingly diversenational population. The U.S. CensusBureau projects that the non-Hispanicwhite population will decrease from 75.7percent to 52.5 percent of the populationbetween the years 1990 and 2050.During the same time period, the black,Hispanic origin, Asian and PacificIslander, and American Indian/Eskimo/Aleut populations will grow (see Figure1). By the year 2050, the black popula-tion will double its present size and theHispanic-origin population will quadru-ple its size.1
Despite these shifts in the population,certain minority groups remain under-represented in scientific occupations inthis country. In 1993, blacks, Hispanics,and American Indians together com-prised 23 percent of the U.S. populationbut only 6 percent of the science andengineering labor force. In contrast,Asians comprised 3 percent of the popu-lation but 9 percent of the science andengineering labor force. The proportionof underrepresented minorities at thedoctoral level is much smaller, evenwhen compared to underrepresentedminorities at the bachelor’s degree ormaster’s degree levels. In 1993, blacksand Hispanics each accounted for only 2percent of the doctoral scientists and
engineers in this country; AmericanIndians accounted for less than one halfof 1 percent. In addition, minority fac-ulty members at universities are not comparable to whites in terms academicrank and tenure.2
Educational attainment levels continueto rise for the black and Hispanic popu-lations. For example, in 1940 the per-centages of blacks and whites 25 yearsand older who had completed highschool were 7.7 percent and 26.1 percentrespectively. By 1993, 70.4 percent ofblacks 25 years and older had completedhigh school, compared with 81.5 percentof whites.3 However, there has been lesssuccess in closing the gaps among popu-
lation groups in terms of attaining a col-lege degree—a prerequisite for almostany science career. Between 1940 and1993, the proportion of black collegegraduates ages 25 and older increased;however, it is only about one-half of theproportion of white college graduates(12.2 percent compared with 22.6 per-cent in 1993). Also in 1993, 42 percentof white high school graduates ages 18to 24 were enrolled in college, comparedwith 33 percent of black high school
Introduction
Minorities, particularly underrepresented minorities, provide a rich,
though largely untapped resource for building the nation’s scientific
workforce, particularly as minority populations grow as a proportion
of the U.S. population.
1 Day, J. C. National population projections. Population Profile of the United States: 1995.Washington, D.C.: U.S. Bureau of the Census,1995 (CPS Report No. P23-189).
2 Women, Minorities, and Persons with Disabilities in Science and Engineering: 1996.Arlington, Virginia: National Science Foundation, 1996(Report No. NSF 96-311).
3 Adams, A. Educational attainment. Population Profile of the United States: 1995.Washington, D.C.: U.S. Bureau of the Census, 1995(CPS Report No. P23-189).
Building Diversity in the Scientific Workforce
2
graduates and 36 percent of Hispanichigh school graduates.4
Minorities, particularly underrepre-sented minorities, provide a rich, thoughlargely untapped resource for buildingthe nation’s scientific workforce, partic-ularly as minority populations grow as aproportion of the U.S. population.Development of a solid foundation oftalented, highly skilled scientists ofdiverse backgrounds in turn will enablethe United States to remain competitivein the global economy.
This report addresses some of the issuessurrounding the education and retention ofa more diverse scientific workforce. Thekey issues and recommendations pre-sented here were identified at the NationalScience Foundation Minority PostdoctoralResearch Fellows and Mentors AnnualMeeting, held in Arlington, Virginia, inSeptember 1996. This report presents theviews of the participants at the AnnualMeeting, and is not an official report of theNational Science Foundation.
2
White,not Hispanic
Black American Indian,Eskimo, and Aleut
Asian andPacific Islander
Hispanic origin(of any race)
75.7
12.3
0.8 3.0
9.0
71.6
0.94.4
11.3
62.0
14.2
1.07.5
16.815.7
1.1
10.3
22.5
12.8
52.5
Projected U.S. Population by Race and Hispanic Origin
1990
2000
2025
2050
FIGURE 1
Per
cent
of U
.S. P
opul
atio
n
4 Bruno, R. R. School enrollment. Population Profile of the United States: 1995.Washington, D.C.: U.S. Bureau of the Census, 1995(CPS Report No. P23-189).
■
Source: Day, J. C. National population projections. Population Profile of the United States: 1995. Washington, D.C.: U.S. Bureauof the Census, 1995 (CPS Report No. P23-189).
■

Chapter
33
In September 1996, the National Science Foundation(NSF) brought together a distinguished group of minor-
ity scientists and their sponsoring scientists/mentors at theNSF Minority Postdoctoral Research Fellows and MentorsAnnual Meeting in Arlington, Virginia. The fellows, whowork at academic institutions and research organizationsacross the nation, represented a range of scientific fieldsfrom molecular biology to psychology to geochemistry. Atthe meeting, the fellows presented five-minute “chalktalks,” listened to presentations about the education andcareer development of minority scientists, and met in smallbreakout groups to discuss their own experiences andinfluences in pursuing science careers.
Each breakout group prepared a brief oral report address-ing such questions as: What influences led to your interestin science? To what extent has mentoring been importantto your continued interest in science? How well has yourgraduate training prepared you for the current job market
Building Diversity in the Scientific Workforce:Recommendations of Postdoctoral Fellows
or your planned career? And, what difference did thereceipt of an NSF postdoctoral fellowship make in yourplans and/or success?
In November 1996, a subgroup of six postdoctoral fellowswho had attended the Annual Meeting met to summarizeissues surrounding the education and career developmentof minority scientists, based on discussion at theSeptember meeting. The fellows addressed such globaland societal issues as the growing gap between the richand poor, the corrosion of the middle class, racial polar-ization, the need to build students’ and the public’s com-petence in science and math, the changing employmentmarket for scientists, and the impact of affirmative actionprograms. They also related their own experiences, identi-fied key concepts, and made recommendations for devel-oping and retaining underrepresented minorities in scien-tific careers.
Overview of Observationsand Experiences
The following information summarizesobservations, key concepts, and recom-mendations outlined by the NSF minoritypostdoctoral fellows, and represents theimpressions of the fellows.
Exposure to science and “hands-on”experiences during the early years of
life have a tremendous impact on thedevelopment of an interest in scienceand the decision to become a scientist.Reflecting on what led them to pursuescientific careers, minority scientists citea host of influences that include interac-tion with adult relatives or friends whowere scientists, participation in science
fairs, experiences in the natural environ-ment, watching television shows aboutscience, and encouragement receivedfrom teachers. Any of these factors mayinspire a young person’s curiosity andappreciation for science, but perhapsnone is more powerful than the influenceof teachers and schools. Just oneteacher’s enthusiasm for science can becritical in a young person’s decision topursue a science career.
A student’s perception of science can bepositive or negative depending on indi-vidual teachers and on the availability andrange of resources offered by a school.Minority students face challenges that areeither amplified or different from those oftheir non-minority counterparts.5 For
5 The term “minority,” as used in this report, refers to three groups of “underrepresented minorities” (Blacks, Hispanics, and AmericanIndians), whose representation in science is less than their representation in the U.S. population.

Building Diversity in the Scientific Workforce
4
example, schools in urban or rural minor-ity communities often have fewer or moreantiquated resources compared to schoolsin suburban communities. Blacks attend-ing primarily white or integrated schoolssometimes are steered to play on sportsteams rather than urged to concentrate onscience or math. Guidance counselors andteachers make assumptions about the“best” career directions for minority stu-dents, and may unknowingly providenegative reinforcement to those whoaspire to higher learning in the sciences.Often a professional school education
(law, medicine, or dentistry) is the“track” recommended for bright minoritystudents. In addition, minority studentsfrequently lack exposure to scientists oftheir own racial or ethnic backgroundswho can serve as role models.
After high school, challenges persist forminority students who decide to pursuescience careers and to move through theacademic “pipeline.” In undergraduateand graduate school, minority studentsmay find that they lack some of theskills needed to compete with their non-minority counterparts. They may be lessconnected to other students and facultyand, as a consequence, may miss infor-mation or opportunities that could helpthem advance in their training or careerplans. Minority students whose parentsor friends did not attend college alsomay not get timely advice needed tomaximize their college experience, andthus may be less prepared for graduateschool. In addition, minority studentsmay have family obligations or face
financial obstacles that prevent themfrom continuing their training as scien-tists, although special funding targetedfor minority students is now available.
Following graduate school, supportiveprograms such as the National ScienceFoundation’s (NSF) Minority PostdoctoralResearch Fellowship Program help tolevel the “playing field,” enablingminorities to compete more equally withtheir non-minority counterparts. Duringthis phase of training, postgraduateminority scientists, like their non-minor-ity counterparts, benefit from committedmentors and expanding professional net-works that can lead to successfulemployment in their selected fields.
During the 1996 NSF Minority PostdoctoralResearch Fellows and Mentors AnnualMeeting, the following key concepts andrecommendations emerged regarding theentry and retention of minorities in sci-ence careers. Many of these conceptsapply to both minority and non-minoritypersons. However, by improving scienceeducation and equalizing opportunities forminority students, all students will benefit.
Key Concepts andRecommendations
Preschool through High School
Teachers must remain current in theirfields and in science overall. Thoseteaching science at the kindergartenthrough high school level must be pro-vided opportunities and incentives forongoing professional development. NSFshould increase funding for workshops,symposia, and other continuing educa-tion programs, such as opportunities towork in research laboratories during thesummer months, to help teachers remaincurrent and aware of scientific progressand developments. Mechanisms are
4
Exposure to science and “hands-on” experiences during the early
years of life have a tremendous impact on the development of an
interest in science and the decision to become a scientist.

Chapter
5
Recommendations of Postdoctoral Fellows
needed to assess teachers’ knowledge ofcurrent science. Recommendations forprofessional development and retrainingshould be viewed by teachers as con-structive and positive, rather than criticaland punitive.
New technologies should be used toincrease teachers’ and students’ accessto current scientific information.Thevast information resources availablethrough the Internet and other electronictechnologies should be used to providecurriculum ideas and to support studentprojects. Ideally, all school systemswould make such resources available toall teachers, and all schools, regardlessof their locations or the populations theyserve, should have equal access to theseresources. At a minimum, teachers andschools that do not have on-line accessshould be provided current materials inprinted or other formats. NSF couldwork with organizations such as theNational Science Teachers Associationto develop and disseminate both on-lineand printed materials. A teacher-liaisonat NSF should coordinate these effortsand serve as a resource.
Teachers must make subject matter rele-vant to students’ lives.Beginning in thepreschool years, teachers must instill instudents the importance and practicalapplication of science in daily life.Rather than relying solely on textbooksand memorization, hands-on projects,science fairs, and field trips must beincorporated into teaching to demon-strate science’s relevance and to promotecontinued interest in science. Teacherswith firsthand knowledge of the scien-tific work world are better prepared tomake science relevant to students.Therefore, continuing education pro-grams at universities or in industry mustbe offered to keep teachers current in thesubject matter they are teaching. In
addition, working scientists should beinvited to talk with students about sci-ence and how it is relevant to their lives.
Teachers and guidance counselors mustbe made aware of cultural differences.As part of their continuing education,teachers and guidance counselors mustreceive multicultural awareness training,and must be enlightened about the manyfactors that impact the academic successof minority students. Such training willhelp to reduce bias about which studentscan excel in science, and therefore willminimize preconceived ideas aboutwhich students should have an interest inscience or pursue science careers.
“When I was a sophomore in college I liked biology, but I was all set
to declare a philosophy major. A young African-American biology
professor, however, took me under his wing and provided me with my
first research experience. He became my friend as well as my mentor,
and within a year I had switched to biology. He also encouraged me to
consider graduate rather than medical school. I can safely say that I
would never have started a career in science without his guidance.”
—Michael Romero, PhD
5

Building Diversity in the Scientific Workforce
6
Teachers must have high expectations ofall students.Throughout middle schooland high school, all students—regardlessof race or ethnicity—must be encour-aged to pursue a college education, andthen permitted to decide for themselvesif that is the direction they wish to take.If all students are considered to be on acollege-bound track and offered equalacademic preparation, then college entryand higher education will be viewed asan attainable goal for all.
Guidance counselors should guide, notdirect students’ career decisions.Highschool guidance counselors must serveas neutral advisors who do not makeassumptions about students based onrace or ethnicity. Counselors must pro-vide all students with equal informationabout career options, offering support asneeded but encouraging students them-selves to take responsibility for choosingtheir career directions, based on theirpersonal interests. At the same time,counselors must guide students towardtheir goals by assisting with the selectionand most effective sequence of coursesto meet college entrance requirements.
Two-year colleges should be presented asan option. Students who begin to show aninterest in science in the later high schoolyears (and therefore have not takencourses necessary for college admission)should be encouraged to attend commu-nity colleges in order to develop compe-tencies necessary for baccalaureate orgraduate study in scientific fields.
Parents must be involved in their chil-dren’s education and development.Working in tandem with teachers, par-ents play a critical role in their children’seducation and interest in pursuing sci-ence careers. Supports must be availableto assist parents in taking an active rolein their children’s education and devel-
A Proposal to Increase Entry and Retention ofMinorities in Academic Science Programs
Minority students face special challenges when pursuing science careers, accordingto minority postdoctoral fellows funded by the National Science Foundation
(NSF). For example, minority students entering college often come from schools in ruralor urban communities that offer fewer education resources than those available in middle-class suburban areas; thus, minority students must work harder to “catch up” and achievethe same level of academic success as non-minority students. Many minority students alsodo not have the benefit of parents who attended college or graduate school and whounderstand the academic system. In addition, minority students’ personal and academiccircles often are limited, providing less support and fewer networking opportunities thanthose of their non-minority counterparts.
Postdoctoral fellows who attended the 1996 NSF Minority Postdoctoral Research Fellowsand Mentors Annual Meeting proposed a mentoring system as a strategy to assist minoritiesin overcoming some of the barriers they face as they progress through the science career“pipeline”—from undergraduate and graduate school to postdoctoral fellowships toemployment. The proposed program would be funded and coordinated by NSF with theoverall goal of increasing entry and retention of minorities in academic science programs.The system would strengthen networking, improve communication among all levels ofacademia, provide academic and emotional support, offer assistance in learning the acade-mic “system” to make the most of the university experience, and help develop study skillsand career development abilities among minority scientists-in-training.
Through the proposed program, principal investigators receiving NSF research fundingwould be eligible to receive supplemental awards to pay mentors and to coordinatementors’ activities at the undergraduate, graduate, postdoctoral, and faculty levels.Mentors would be selected through an application and interviewing process. Each mentorwould be held accountable and evaluated by his or her protégés. Junior and senior studentswould serve as mentors for freshmen and sophomores, graduate students for junior andsenior undergraduates, postdoctoral fellows for both undergraduate and graduate students,and faculty members for postdoctoral fellows. Mentors would not need to be minorities,but should have attained the goals to which the persons they are mentoring aspire.
As part of the proposed program, symposia would be held for mentors and those they arementoring. Symposia might address such topics as exploring science career options,improving scientific writing and oral presentation skills, building interviewing skills,preparing effective curriculum vitae, improving technical writing, publishing scientificpapers, developing professional networks, marketing oneself, developing a scientific niche,establishing and managing a research lab, and increasing one’s effectiveness as a mentor.The mentoring program would also include a component to provide minority undergradu-ate students’ with expanded opportunities for hands-on research experience.
Information and guidelines for mentors and those they are mentoring would be posted onthe World Wide Web and would be dynamic, changing with input from those using the Website. Use of e-mail would also facilitate communication among those who participate in theprogram.

Chapter
7
Recommendations of Postdoctoral Fellows
opment, especially for children from dis-advantaged homes. For example, sup-port systems should be made available tolow-income or single parents who areless available to their children becausethey must work long hours to supporttheir families. Paid time off might beprovided for parents to attend confer-ences or school activities during theirnormal working hours. In addition,communication with parents shouldinclude discussion of college preparationoptions.
Parent-teacher collaboration must beincreased and expected.Parent-teacherrelationships must be established early inthe school year and parents must beencouraged to communicate with teach-ers throughout the school year. Parentsof all students must be kept abreast of thescience curriculum so that they canencourage their children to take an inter-est in science. In addition, reinforcementof minority students’ self-concept andself-esteem must be a joint effortbetween parents and schools, therebycultivating a positive school-home rela-tionship. Parents of minority studentsmust be educated about how to ensurethat their children receive from schoolsany extra support and assistance thattheir children may need. For example,parents must know when and how toobtain tutoring or mentoring for theirchildren if they cannot provide it them-selves.
Working scientists, especially minorityscientists, should participate in schooloutreach activities in order to developstudents’ interest in science careers.Justas firefighters or police officers visitclassrooms, working scientists shouldshare their experiences with students,especially those of racial and ethnicminorities. Appropriate, effective incen-tives must be provided to encourage sci-
entists to participate in school programs,including career days. NSF could estab-lish a Web site to link schools and prac-ticing scientists who are available to par-ticipate in school-based activities.
Public-private partnerships must beencouraged.Public-private partnershipsmust be used to encourage universityand industry scientists to “adopt” school
science programs. As part of the pro-grams, the scientists could visit theschools, teach labs, and provide continu-ing education opportunities for teachers,for example.
Students in grades 7 through 12 must beintroduced to the “scientific method.”Middle school and high school studentsmust be exposed to the concept ofhypotheses and the scientific discoveryprocess in order to understand why andhow scientific investigation proceeds.Teachers must emphasize that not all ofscience is “known” and that the text-books do not represent all that is or canbe known about science. Science teach-ers must also reinforce the importance ofgood writing and oral presentation skillsin reporting scientific discoveries.
Television should be used creatively toteach science and to provide minorityrole models.Television is a powerfultool to reach youth; therefore it should beused extensively to inform young peopleabout the different aspects of scientificdiscovery, as well as to present minorityscientists as role models. Television pro-ducers should be encouraged to portray
Teachers must emphasize that not all of science is “known” and that
the textbooks do not represent all that is or can be known about
science.

Building Diversity in the Scientific Workforce
8
scientists in a positive manner. In addi-tion, television programs should concur-rently address social issues that confrontminority children and adolescents.
Materials depicting minority scientistsmust be present and visible in class-rooms. More multiculturally orientedbooks, videotapes, posters, and othermaterials must be used in the curriculumor made available in classrooms to por-tray persons of racial and ethnic minori-ties as scientists. Teachers should rein-force the diversity of the scientistsillustrated in these materials.
Undergraduate and Graduate School
More minority faculty members areneeded in university science programs.Minority faculty members offer uniqueand valuable perspectives, making theacademic programs in which they teachmore attractive to minority students.Such faculty are too few in number andoften are burdened with multipledemands. In addition to their teachingand research responsibilities, minorityfaculty members often are sought out asadvisors and mentors, particularly byminority students. Therefore, minorityscientists must be encouraged to seekacademic positions, and universitiesmust proactively seek qualified minorityscientists as faculty members.
Mentors must be provided at all levels,beginning with undergraduate school.Peer mentors can provide minority stu-
dents the support, encouragement, andimpetus needed to train for, enter, andsucceed in science careers. At the under-graduate level, junior and senior studentsshould serve as peer mentors for fresh-men and sophomores, helping youngerstudents to maneuver through the univer-sity system and advising on how best toposition themselves for graduate school.Likewise, graduate students should serveas mentors to juniors and seniors, andpostdoctoral fellows to both graduateand undergraduate students. Incentivesshould be provided to mentors, and men-tors should be held accountable for theiractivities as mentors.
Students must learn good study habits.Undergraduate students often lack goodstudy habits and time managementskills. Programs must be established toassist students in these areas, therebybuilding their competitiveness within theundergraduate environment and prepar-ing them for graduate school. For exam-ple, peer mentors could help students toimprove their study skills.
Minority students will benefit from assis-tance in learning “the system.”Manyminority students, especially thosewhose parents did not attend college,need assistance in learning how to maxi-mize their undergraduate experiences.Junior- and senior-level peer mentorsshould advise freshmen and sophomoresabout the best sequencing of courses,how to find lab experience opportunities,and how to improve the possibility ofgraduate school admission, for example.Working with more experienced stu-dents, young minority undergraduatescould build their networks and becomeexposed to positive role models.
Committed faculty mentors are a deter-minant of success.Faculty mentors canprovide undergraduate and graduate stu-
Minority scientists must be encouraged to seek academic positions,
and universities must proactively seek qualified minority scientists as
faculty members.

Chapter
9
Recommendations of Postdoctoral Fellows
dents important guidance for continuededucation and career planning, and canhelp them to develop contacts and a net-work for the employment search. Thisguidance is particularly important in fos-tering minority students’ success in pur-suing science careers. Incentives areneeded to encourage faculty members toserve as mentors to minority students,and faculty mentors must be heldresponsible for students’progress towardtheir goals.
Research experience is paramount at theundergraduate level.The opportunity toparticipate in hands-on research is criti-cal in undergraduate students’ decisionsto pursue further training and to enterscience careers. However, because theirnetworks with fellow students and fac-ulty members are often smaller thanthose of other students, minority studentsmay be unaware of research experiencesthat are available on campus or else-where. Therefore, efforts to make minor-ity students aware of hands-on researchopportunities are needed. Programs suchas NSF’s Research Experiences forUndergraduates and the NationalInstitutes of Health’s Minority Access toResearch Careers (MARC) are valuablein that their stipends enable students togain research experience in laboratoriesat their own universities or at distantinstitutions during the summer months.
Graduate school programs must placegreater emphasis on learning to teach.Graduate students who plan to work inacademic environments must learn toconduct research as well as to developtheir skills as effective teachers.Teaching, and the development of teach-ing skills, must be regarded more oftenas an important part of academic cultureand training.
More broad-based skills training must beoffered. Minority students often findthemselves unprepared for the next stageof their training and career preparation.Graduate schools and NSF could supportprograms to assist those in training withessential skills in science writing, oralpresentation, and grant proposal writing.In addition, students must be encouragedto explore career alternatives, such asresearch development, policy making,science writing, and patent law.
Funding is essential for many minority students who plan to obtaingraduate degrees.Minority students arehesitant to borrow money to attend gradu-ate school, and many base their decisionsto continue their educations on the avail-ability of external funding. Therefore,undergraduate minority students must bemade more aware of funding opportuni-ties, including but not limited to specialfunding for minorities. Universities, orga-nizations such as NSF, and mentors mustensure that minority students are informedabout how to locate and successfullyapply for funding.
Postdoctoral Fellowships andEmployment
Postdoctoral fellowships provide minor-ity scientists with opportunities to workin prestigious, highly respected labs.Theexistence of fellowship funding, such asthat offered by NSF, enhances the abilityof minority scientists to work in highlyregarded labs, which in turn opens door-ways and creates pathways for greateropportunities. Working in high-qualityscientific environments allows postdoc-toral fellows to conduct research andwork with respected scientists, as well asto present papers at major scientificmeetings, to gain valuable experiencepreparing grant applications, to learnhow to manage a lab, and to expand their
“What I found mostrewarding about being in theNSF postdoctoral programwas the other postdocs. Ireally enjoyed listening totheir presentations becausethey do great science, theylove their work, and theyknow how to convey both thescience and the love.”
–Elizabeth Mezzacappa, PhD
Building Diversity in the Scientific Workforce
10
professional networks. In addition, men-tors and other scientists at prestigiouslabs can assist fellows in securing posi-tions in academia or industry by provid-ing essential contacts and letters of rec-ommendation.
Fellowship applicants must learn tomaximize their skills and backgrounds.Minority scientists applying for postdoc-toral fellowships must distinguish them-selves in their applications. Many appli-cants do not know how to prepare andpackage an application to their bestadvantage. Excellent written communi-
cation skills are needed to convey notonly the applicant’s academic qualifica-tions and experience, but also his or herdetermination and goals in pursuing ascience career. Mentoring and work-shops could constructively assist minor-ity graduate students in preparing suc-cessful applications.
Mentoring is important at the postdoc-toral level. Postdoctoral fellows benefitfrom the knowledge, experience, andprofessional contacts offered by theirmentors. Mentors can advise on how toseek employment, write a successfulcurriculum vitae, establish and manage aresearch lab effectively, review manu-scripts, write grant proposals, developone’s own scientific niche, and marketoneself as a scientist.
Minority scientists need to be more visi-ble within professional organizations.Few minority scientists achieve high-profile positions in professional soci-eties. Minority scientists must find waysto break through the “glass ceiling”within these organizations, and the orga-nizations themselves must more proac-tively seek out minorities as leaders.
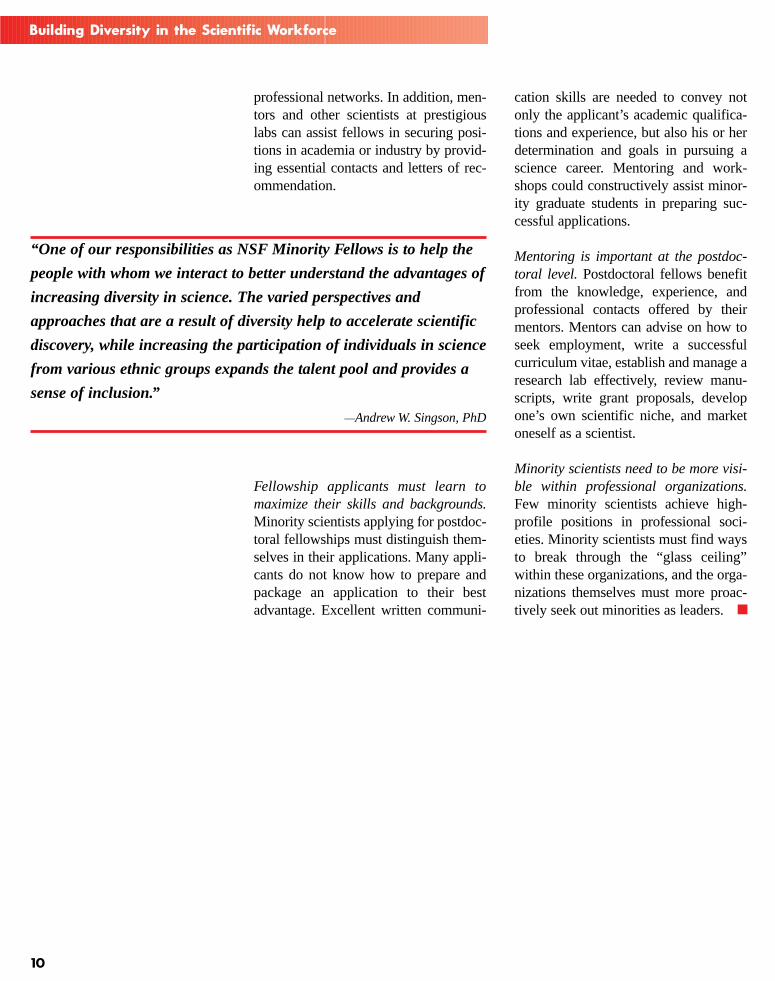
“One of our responsibilities as NSF Minority Fellows is to help the
people with whom we interact to better understand the advantages of
increasing diversity in science. The varied perspectives and
approaches that are a result of diversity help to accelerate scientific
discovery, while increasing the participation of individuals in science
from various ethnic groups expands the talent pool and provides a
sense of inclusion.”
—Andrew W. Singson, PhD
■

Chapter
11
Guest Speaker Presentations
In order to participate in math and sci-ence careers, students must first
develop an interest in math and/or sci-ence, and acquire the skills necessary toperform well in those courses. Then theyhave to take a sufficient number ofcourses in math and science in highschool and of course that means being inan academic track. It is very unusual forsomeone who is not in the academictrack to go on to a math/science career.Then they have go into college—toenroll in college, declare a math or sci-ence major, and persist through collegeuntil they graduate. When you think ofall the possibilities for people to fall outof the so-called “pipeline,” there is noreal secret why there are so few of us inmath and science.
There has been quite a bit of researchdone on the math and science talent poolbecause people want to know where theyreally should target their efforts, theirintervention efforts. We know that it [thetalent pool] reaches its maximum sizebefore the high school level but migra-tion still occurs through grade 12. Eventhough people may not have been in themath and science pool in the early years,they can still get in up to grade 12.However, by maintaining an interest inmath and science in elementary and mid-dle school, people can still retain mem-bership in the pool. But by high school,if their skills have not increased and theyare not doing well in the courses, therereally is little chance of them going intomath and science careers. So by highschool you not only have to be interestedand maintain your interest, but you alsohave to do well in your courses and youhave to be thinking about college.
Four barriers have been identified thatimpede the access of minority studentsto math and science careers. One ofthose is negative attitudes towards mathand science. There are a lot of data froma national assessment of educationalprogress, for example, where firstgraders, eighth graders, and 12th gradersare asked about their opinions and theirfeelings and interest in math and science.Minority students and female studentstended to say that they do not understandthe relevance of math and science totheir lives, to the future of humanity, orto society. There has been some evidencethat that is changing, that minorities are
tending to like math and science more,but we are not really sure where that’sgoing.
The second barrier is a lack of informa-tion about mathematics and sciencecareers. Many minority students havenever seen a scientist. They have no ideawhat a mathematician does or how math-ematics can be used in science. One ofthe most significant indicators of minor-ity students going into math and sciencecareers is whether or not they know ascientist personally.
Third, minority students tend to not dowell in math and science, although datashow that scores are going up, which wefind very encouraging.
Access to Mathematics and Science Careers forUnderrepresented Minority Students:Research Findings and Explorations
Dr. Beatriz ClewellThe Urban Institute
When you think of all the possibilities for people to fall out of the so-
called “pipeline,” there is no real secret why there are so few of us in
math and science.

Building Diversity in the Scientific Workforce
12
Fourth, the failure to participate inhigher level math and science courses inhigh school is a barrier. Minority stu-dents are underrepresented in the acade-mic tracks and that’s where you get thehigh level math and science courses.When I [visited] high schools, many ofthem did not offer advanced placementcourses in math, and when I asked why,they said, “Well, there is no one to takethem.” So even if minorities wanted totake higher level courses in some ofthese cases, they would not have accessto them.
I am going to talk about four researchprojects. The first two have to do withthe middle school level and I will takekind of a pipeline approach. The thirddeals with choice of a math or sciencemajor and undergraduate education, andthe fourth concerns persistence in doc-toral education. The fourth really focuseson the efficacy of financial aid and finan-cial aid packaging in helping minoritystudents to persist through doctoral pro-grams. The first two have been com-pleted and the second two are in progressright now.
In the 1980s, a lot of attention [was paidto] intervention programs and the impor-tance of intervention programs inexpanding the pool of minority scien-tists. People realized that minorities werenot participating in math and science. Atthat time a whole spate of interventionprograms sprang up. Because people didnot know a lot about what to do or howto do it, they tended to focus on the
wrong part of the pipeline—they focusedon high school. As we know, high schoolmight be a little too late. Those are goodprograms to retain people in the pipelinebut they are not good to expand the pool.
So finally, people started thinking,“Well, why don’t we go higher in thepipeline? Why don’t we try to increasethe number of students at the middleschool level who might be interested inthese careers?” The Ford Foundationcame to me (I was at the EducationalTesting Service at the time) and askedme to look at all the math and scienceintervention programs in the countryfrom grades four through eight thatfocused on serving minority and femalestudents.
Through a referral system, we sent mail-ings to about 2,000 organizations anduniversities and schools. [Of them] wesurveyed 163 [intervention] programsand asked what their target populationswere. Thirteen percent targeted femalesonly, 33 percent targeted minorities only,and 54 percent targeted minorities andfemales. We asked them what subjectareas they focused on and the mostprevalent were the ones that focused onall three subject areas: math, science,and computer science. I thought that itwas interesting that there are many moremath intervention programs than scienceintervention programs, and I really don’tknow the reason for that.
We also asked them to give the distribu-tion of their students by grade level. Wefound that a lot of the students were inthe eighth grade and that the fourth gradehad the lowest percentage of partici-pants.
California had the most programs of alland some very, very notable programshave come out of California. Many of
Minority students and female students tended to say that they do not
understand the relevance of math and science to their lives, to the
future of humanity, or to society.

Chapter
13
Guest Speaker Presentations
the states that have very high AmericanIndian populations were not represented,so that means these students did not haveaccess. In the Northeast, New York hadthe highest number of programs, but theDistrict of Columbia did not do badly. Inthe Southeast we noticed that Georgiahad many more programs than the otherstates.
We also asked [the intervention programstaffs] what kinds of things they did withstudents, what their prevalent activitieswere. Hands-on experiences were themost prevalent and, unfortunately, directinstruction was also prevalent. I hopethat has changed. A lot of the counselingwas around career counseling and whatcourses to take in high school. Rolemodels were very big, and there wereguest speakers and a lot of field trips.
As a result of this [survey] we made rec-ommendations to the Ford Foundationon our findings. One of our recommen-dations was that they increase the num-ber of programs serving girls and minor-ity students. There were a lot of gaps inservice in intervention programs aroundthe country. In the South, where a largepercentage of the enrollment is African-American children, there were very fewprograms except for in Georgia. In theSouthwest, where there are a lot ofNative American children, there werevery few programs. So we recommendedto the Ford Foundation that they increasetheir funding for programs in thoseareas.
A second phase of this project resulted ina widely disseminated directory of pro-grams. It was something that projectdirectors could use to identify other pro-grams that were doing similar kinds ofthings or that schools could use to refertheir students to programs in their areas.The Ford Foundation asked us to do a
more in-depth study of the programs andwe identified 20 programs that had doneevaluations. We visited 20 and wepicked 10 of them to do in-depth casestudies. We spent about a week onsite atone point and then we went back in thesummer, talked to people, and observedclasses. We wrote about it in a book thatwas published a few years ago.
The study identified effective character-istics of intervention programs andtalked about some of the theory and theresearch that undergirded some of theapproaches and strategies. One of thethings that really bothered us after hav-ing done all this work on interventionprograms was the question of “Whatnext?” Intervention programs only canservice a few students. What about allthe other students who are not served?We really felt that we needed some wayof getting these wonderful strategies intoschools. But of course, along came thereform movement standards and a lot ofthe things that are happening now I feelreally good about.
I would like to go on now to the nextresearch project, which focuses onundergraduate students. This one is inprogress; we are actually just beginningand have not even collected the data yet.It is funded by the [Alfred P.] SloanFoundation and is called “Project TalentFlow.” The study objectives are to docu-ment why African-American and Latino[undergraduate] students of high abilitychoose non-science, engineering, andmath majors. We want to see the kinds ofexperiences that they had before going
One of the most significant indicators of minority students going
into math and science careers is whether or nor they know a
scientist personally.

Building Diversity in the Scientific Workforce
14
into college that led them to think thatmath and science might not be goodfields for them. We also want to look atgender differences and differencesbetween racial/ethnic groups. We wantto identify crucial barriers and learnabout factors that might encourage[underrepresented minority students] tochoose a math and science career ormajor and then, of course, recommendsteps that institutions might take toincrease the number of high-achievingminority students in these fields.
We are going to use the critical incidentmethod to do this study. [This method]asks people to identify incidents thatwere crucial in influencing their behav-ior. The critical incident is reallyfocused on a behavior. You [ask individ-uals to] think about the actual minutewhen something happened that changedtheir behavior. We have already donesome field tests, and I can tell you it isnot easy because people tend to answerin a very general way. Getting them tofocus in on a specific critical incidentthat affected their behavior subsequentlyis very difficult. We are looking forstudents, minority students—AfricanAmerican and Latino—who have made550 and above on the math SAT and whohave not gone into math and science.
I would like to go on to the next study,the study of doctoral persistence, and Ithink that this is probably close to thehearts of a lot of you. This study isfunded by the National ScienceFoundation. We are further along in this
study in that we have already collecteddata from one of the two graduateschools. We want to know how differenttypes of financial aid affect time todegree and completion of doctoraldegrees. We defined minority as AfricanAmerican and Latino. We also want toknow how the timing of different types offinancial aid affects degree completion.By timing I mean is it better to haveteaching assistantships first and then fel-lowships and then research assistant-ships—how is it best to package this aid?We want to know how these effects varyacross different types of fields.
This will be a qualitative and quantita-tive study. We have surveyed all studentswho have entered social sciences, nat-ural sciences, and engineering doctoralprograms since 1985, so there are severalcohorts of students. The qualitative partof the study really focuses on currentminority students, so we have held focusgroups with minority students in oneinstitution. We talked to chemistry, engi-neering, and psychology students. Wealso interviewed several faculty mem-bers in the department, the graduatechair, and several people at the graduateschool because we wanted to know whatthe policies were and their perspectivefrom the faculty and administrative side.
One of the things we asked [the doctoral]students about was what their expecta-tions were. Many of the students did notanticipate receiving a fellowship andthey did not apply [for one] before theyentered the university, which we foundkind of interesting. They assumed thatthey would be supported in some way,either by their major adviser orwhomever they picked to work with. Wealso found that many of the graduate stu-dents or doctoral students thought thattheir salaries were inadequate; that wasno surprise. We asked what they thought
Teaching assistant experiences introduced students to some other
faculty and, in some departments, to professors in areas that they
would not have known otherwise. . . .

Chapter
15
Guest Speaker Presentations
were the advantages of different kinds offinancial aid. The main advantage of fel-lowships that they gave us was that itgave time to concentrate on their studies.They also were eligible for in-statetuition and they felt that it helped them togain access to labs that they might nothave been able to have access to. Allthey did was go to a faculty member andsay, “I am supported. You don’t have todo anything. Can I join your lab?” [Thefaculty member] would say, “Sure.”[The students] also felt that it was a goodthing to put on their curriculum vitae,that they had had this fellowship. It wasprestigious.
There were some disadvantages [of fel-lowships. The students] felt that cost-of-living increases were not included in themulti-year fellowship, health benefitswere not included; they did not knowabout taxes. Some said that they feltsomewhat alienated from their otherclassmates because they had a fellow-ship. They felt that their white class-mates had the attitude that they got a fel-lowship because they were minority; thatwas very widespread.
We asked [the doctoral students] aboutresearch assistantships and one of thebiggest problems was faculty control ofresearch assistantships. [The studentsfelt that] if they had research assistant-ships they were totally dependent on thefaculty member. In some cases they gotmeaningful work and in other cases theydid not. They felt that they gained theopportunity to publish and attend confer-ences, that sometimes their dissertationtopics came out of research assistant-ships, and that they had concentratedtime in the labs. Some students indicatedthat it is nice to be paid to do somethingthey enjoy. Another advantage ofresearch assistantships was that [the stu-dents] got health benefits. Disadvantages
of research assistantships: They could bevery stressful if [the student is] beingpressured to get results. Another one thatI thought was interesting was that somestudents felt that research assistantshipsforced students to focus too soon on atopic rather than receive a broad expo-sure to what was out there so they mightbecome locked into a choice of disserta-tion topic too soon.
Teaching assistantships. We felt that peo-ple would be really against teachingassistantships but a number of advan-tages were mentioned. [The students]felt the primary advantage was that peo-ple gained experience in teaching, andsome students said that they actuallyrealized they wanted to be faculty mem-bers instead of researchers. They felt that[teaching] builds on academic skillsbecause when you teach someone youare also reinforcing your own knowledgeof something. Teaching assistant experi-ences introduced students to some otherfaculty and, in some departments, to pro-fessors in areas that they would not haveknown otherwise, and some of the stu-dents really enjoyed getting to know theundergraduates. The other side of thecoin is the amount of time that teachingassistantships demand.
We asked about the packaging of finan-cial aid—what was better up front andwhat was better later on. We got a wholerange of responses and there was con-sensus on only two points. Most studentsagreed that teaching assistant experienceshould be early in students’ studiesbefore they become too deeply involvedin research. The majority of students feltthat they needed fellowships at the dis-sertation phase. We concluded from thisthat the packaging depends on the fieldof study and a lot of different other vari-ables.

Building Diversity in the Scientific Workforce
16
who were well-supported were the mostsatisfied and were, according to them,the most productive.
So these are our preliminary findingsfrom this study. We still have to analyzethe survey data and to collect the datafrom the other graduate school, whichwe will be doing this fall.
We also asked about [students] who haddropped out. Most people did not dropout because of academics or because offinancial aid. It was usually a combina-tion of several factors and none of thestudents had ever considered leavingbecause of finances. Something weheard again and again was, “I haveinvested so much in this, I am not aboutto leave now.” We did find that students
■

Chapter
17
Guest Speaker Presentations
Iwant to take you on a journey with mefor the next couple of minutes. These
issues are very important to me. I’m surethey are important to you and, as youknow, in our discussion of these issueswe gain clarity and hopefully we canarrive at some solutions to solve some ofthe problems that I’ll be talking about.One of the questions that I continuallyask myself and I know other people haveasked this in the past is: Who is doingscience in the 1990s? Another questionis: Who will do science in the 21st cen-tury?
I’m going to talk a little bit about thedemographic characteristics of Latinopopulations because I think it isabsolutely critical that we clearly definepopulations. By keeping our definitionsbroad, we mask some real differencesbetween populations and within popula-tions. As a sociologist I want to talk a lit-tle bit about those issues. I then want totalk about the state of Chicana andChicano doctorate production in thephysical, life, and engineering sciences.Finally, I want to talk about the bac-calaureate origins of Chicanas andChicanos in the sciences.
I’d like to place this within a certain con-text and I think in 1996—in Septemberof 1996—you have to place minoritydoctorate production within the contextand politics of affirmative action, bothnationally as well as in my state,California. At my university, theUniversity of California, the regentspassed a resolution in July of 1995 thatchanges the admissions requirements forminorities and women. It was called
SP-1. Section 2 of the resolution statesthat “Effective January 1, 1997, theUniversity of California shall not userace, religion, sex, color, ethnicity, ornational origin as criteria for admissionto the university or any programs ofstudy.” This proposal is going to have adramatic effect on my undergraduate stu-dents as well as my doctoral students,and this concerns me.
The second political issue in my statethat is of great concern to me isProposition 209. In November of thisyear the state of California is going tovote on a proposition that will forbid theuse of race and gender in any sort of statefunction. It is troubling to say the least.I’d like to hope that the forces supportingaffirmative action would rally, wouldform coalitions, and would hopefullydefeat Proposition 209. It is a troublingproposition because I’m afraid that otherstates are looking at how Californiamoves on this issue. Once again,California—for better or for worse—istaking a position that is going to have anadverse affect on underrepresentedminorities and women in terms of allaspects of state policy. As you can tell, Iam a supporter of affirmative action. Ihave been a beneficiary of affirmativeaction and I have been a critic of affir-mative action. Some of the critics ofaffirmative action argue that it only ben-efits people in the middle class, but thedata do not support that position.
To give you a little bit of informationabout myself, I am the son of workingclass parents. My father was a baker. Hebaked Mexican bread for many, many
Production of Chicana and Chicano Doctoral Scientists: Status, Barriers, and Policy Recommendations
Dr. Daniel SolorzanoUniversity of California,Los Angeles

Building Diversity in the Scientific Workforce
18
years along with his father, my grandfa-ther, and his father, my great-grandfa-ther. All of my uncles were bakers and Iprobably would have gone into that veryhonorable profession but for a couple ofdifferent deviations in that pipeline. My
mom was a telephone operator at SearsRoebuck for many years. They were notfrom middle class origins. They werebasically working class from East LosAngeles.
I arrived at the university as an under-graduate in 1968 when affirmativeaction was just beginning. Universitieswere just opening up the doors to peoplelike myself who had previously had beenkept out. I use my older brother as anexample because my older brother is asheet metal worker. He puts in air condi-tioning systems in homes, offices, andbusinesses, and he is equally as bright asmyself if not more. He is a much harderworker than myself. He cares very muchabout the quality of his work. I learned
that from him. But in 1962, when hegraduated from high school, there wasvery little opportunity. But for a fluke ofbirth or timing he may have been up heremaking this presentation instead of me. Iarrived at a different time. I was able totake advantage of the doors that wereopened up by a small number of peoplewho came before me, and I would like tothink that I am trying to open up the doorfor people who are coming behind me.
Demographic Characteristics ofLatino Populations
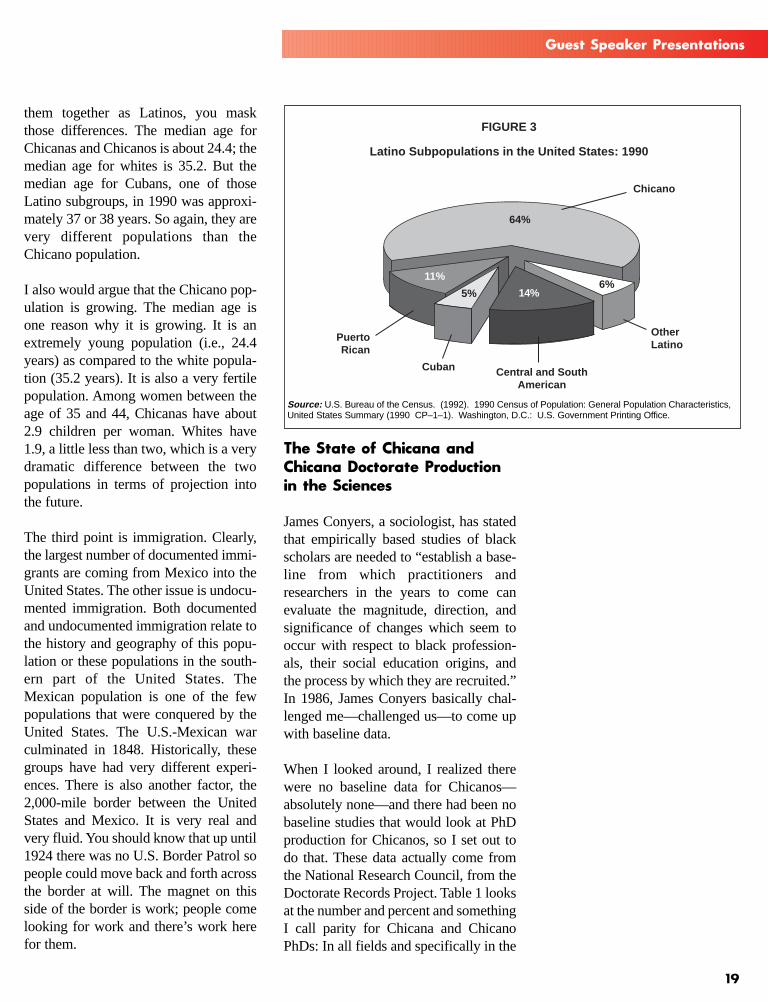
The next step [in my presentation] is thedemographic characteristics of Latinopopulations. One of the things that weneed to do is try to understand who thispopulation or who these groups are.Latinos make up about 9 percent of theoverall population, African Americansabout 12 percent, Native Americans about1 percent, Asian Americans approxi-mately 3 percent, and whites around 75percent (see Figure 2). However, withinthe Latino population, Chicanos, orMexican Americans, make up about 64percent, Puerto Ricans about 11 percent,Cubans about 5 percent, Central andSouth Americans about 14 percent, andother Latinos about 6 percent (see Figure3). Two out of every three Latinos are ofMexican origin—Mexican ancestry orwhat I call Chicano. (If I was making thispresentation 10 years ago, my grand-mother would just cringe because shewould never use that term. It is a term thatgoes back to the turn of the century and isused in a different context, but it is a termthat I choose to use in the context of myown research.)
The Chicano population is mainly con-centrated in the five southwestern states,although that is changing. There are veryreal differences [within Latino sub-groups] and I think that by aggregating
Racial and Ethnic Populations in the United States: 1990
FIGURE 2
75%
9%12%
1%Native
American
3%Asian
American AfricanAmerican
Latino
White
Source: U.S. Bureau of the Census. (1992). 1990 Census of Population: General Population Characteristics,United States Summary (1990 CP–1–1). Washington, D.C.: U.S. Government Printing Office.
Chapter
19
Guest Speaker Presentations
them together as Latinos, you maskthose differences. The median age forChicanas and Chicanos is about 24.4; themedian age for whites is 35.2. But themedian age for Cubans, one of thoseLatino subgroups, in 1990 was approxi-mately 37 or 38 years. So again, they arevery different populations than theChicano population.
I also would argue that the Chicano pop-ulation is growing. The median age isone reason why it is growing. It is anextremely young population (i.e., 24.4years) as compared to the white popula-tion (35.2 years). It is also a very fertilepopulation. Among women between theage of 35 and 44, Chicanas have about2.9 children per woman. Whites have1.9, a little less than two, which is a verydramatic difference between the twopopulations in terms of projection intothe future.
The third point is immigration. Clearly,the largest number of documented immi-grants are coming from Mexico into theUnited States. The other issue is undocu-mented immigration. Both documentedand undocumented immigration relate tothe history and geography of this popu-lation or these populations in the south-ern part of the United States. TheMexican population is one of the fewpopulations that were conquered by theUnited States. The U.S.-Mexican warculminated in 1848. Historically, thesegroups have had very different experi-ences. There is also another factor, the2,000-mile border between the UnitedStates and Mexico. It is very real andvery fluid. You should know that up until1924 there was no U.S. Border Patrol sopeople could move back and forth acrossthe border at will. The magnet on thisside of the border is work; people comelooking for work and there’s work herefor them.
The State of Chicana andChicana Doctorate Productionin the Sciences
James Conyers, a sociologist, has statedthat empirically based studies of blackscholars are needed to “establish a base-line from which practitioners andresearchers in the years to come canevaluate the magnitude, direction, andsignificance of changes which seem tooccur with respect to black profession-als, their social education origins, andthe process by which they are recruited.”In 1986, James Conyers basically chal-lenged me—challenged us—to come upwith baseline data.
When I looked around, I realized therewere no baseline data for Chicanos—absolutely none—and there had been nobaseline studies that would look at PhDproduction for Chicanos, so I set out todo that. These data actually come fromthe National Research Council, from theDoctorate Records Project. Table 1 looksat the number and percent and somethingI call parity for Chicana and ChicanoPhDs: In all fields and specifically in the
Latino Subpopulations in the United States: 1990
FIGURE 3
6%14%5%
11%
64%
Chicano
PuertoRican
Cuban Central and SouthAmerican
OtherLatino
Source: U.S. Bureau of the Census. (1992). 1990 Census of Population: General Population Characteristics,United States Summary (1990 CP–1–1). Washington, D.C.: U.S. Government Printing Office.

Building Diversity in the Scientific Workforce
20
physical sciences, life sciences, andengineering sciences. One of the prob-lems that I have with these data, and thereason why these data only look at theyears 1980 to 1990 is that prior to 1980the way we defined this population wasproblematic. In fact, up until 1980 therewas no uniform definition of Chicanos.
Seven hundred and fifty-one ChicanaPhDs were produced during the period1980 to 1990. They represented aboutseven-tenths of 1 percent of all womenPhDs produced during that time period.During that same decade they wereapproximately 4.5 percent of the femalepopulation. If you divide .7 by 4.5 youcome up with a ratio I call a Parity Index,the number one being parity and zerobeing no parity.
In the physical sciences only 33 ChicanaPhDs were produced in that 11-year
period. They represented about four-tenths of 1 percent of all female PhDs pro-duced in the physical sciences and a parityindex of .09. In the life sciences therewere 66, double the number in the physi-cal sciences, yet still they only representedfour-tenths of 1 percent, a parity index of.09. In engineering, there were 12 in that11-year period. They represented seven-tenths of 1 percent, a parity index of .16.You can actually use that parity to deter-mine how much we need to increase thenumbers to reach parity, how much effortwe need to put into our colleges toincrease the number of people who finishand receive PhDs in these science fields.For instance, in the physical and life sci-ences, we would have to increase Chicanadoctorate production 11-fold to reach par-ity. Quite a daunting task.
Although the numbers look a little bitbetter for males, they are not much bet-ter. Overall, 1,189 male Chicano PhDswere produced between 1980 and 1990.They represented seven-tenths of 1 per-cent of all male PhDs produced duringthat same period and a parity index of.14. In the physical sciences, there were105, in the life sciences there were 127,and in engineering there were 62.
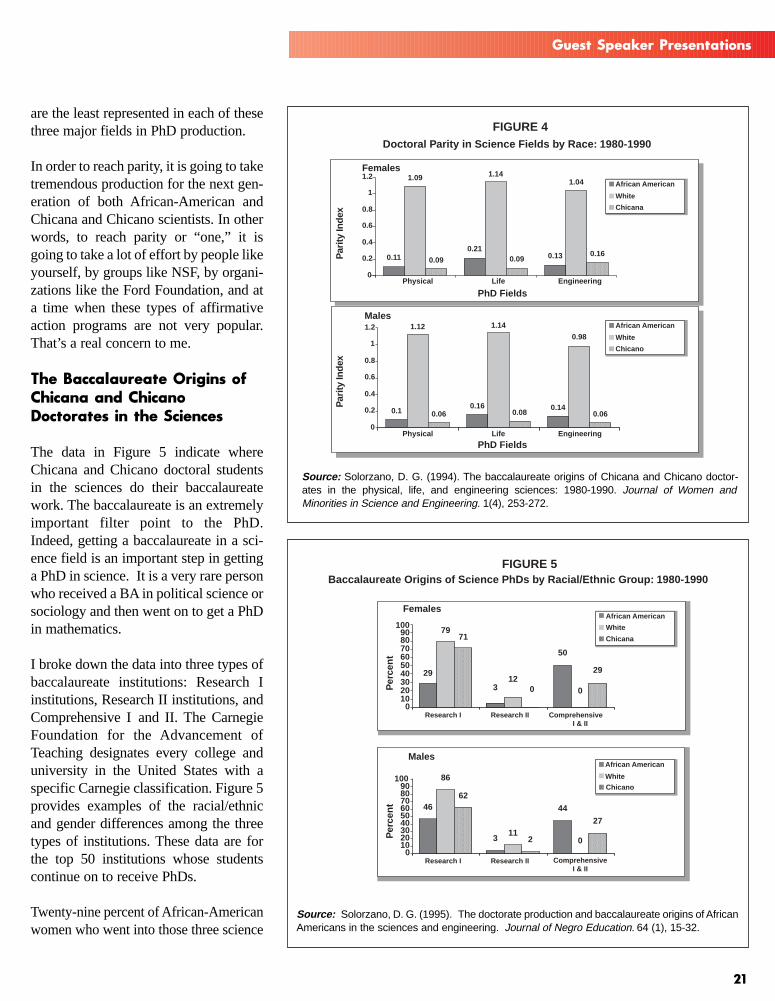
For purposes of my presentation, I showthe African-American, the white, and theChicano and Chicana parity numbers(see Figure 4). One can observe howAfrican-American women and Chicanasare attaining PhDs relative to whitewomen in terms of this Parity Index.White women in all of these differentareas are above parity relative to womenof color but not relative to white men.White females are above parity, andChicana and African-American femalesare well below parity in the physical,life, and engineering sciences. Whitemales fall below parity in only one field,engineering. However, Chicano males
TABLE 1
Number and Percent of Chicana and Chicano Doctorate Production by Science Fields: 1980-1990
FemalesNumber Percent Parity
Overall 751 0.7% 0.16Physical Science 33 0.4% 0.09Life Science 66 0.4% 0.09Engineering 12 0.7% 0.16
MalesNumber Percent Parity
Overall 1189 0.7% 0.14Physical Science 105 0.3% 0.06Life Science 127 0.4% 0.08Engineering 62 0.3% 0.06
Source: Solorzano, D. G. The baccalaureate origins of Chicana and Chicano doctorates inthe physical, life, and engineering sciences: 1980-1990. Journal of Women and Minorities inScience and Engineering. 1(4), 253-272.
21
Guest Speaker Presentations
are the least represented in each of thesethree major fields in PhD production.
In order to reach parity, it is going to taketremendous production for the next gen-eration of both African-American andChicana and Chicano scientists. In otherwords, to reach parity or “one,” it isgoing to take a lot of effort by people likeyourself, by groups like NSF, by organi-zations like the Ford Foundation, and ata time when these types of affirmativeaction programs are not very popular.That’s a real concern to me.
The Baccalaureate Origins ofChicana and ChicanoDoctorates in the Sciences
The data in Figure 5 indicate whereChicana and Chicano doctoral studentsin the sciences do their baccalaureatework. The baccalaureate is an extremelyimportant filter point to the PhD.Indeed, getting a baccalaureate in a sci-ence field is an important step in gettinga PhD in science. It is a very rare personwho received a BA in political science orsociology and then went on to get a PhDin mathematics.
I broke down the data into three types ofbaccalaureate institutions: Research Iinstitutions, Research II institutions, andComprehensive I and II. The CarnegieFoundation for the Advancement ofTeaching designates every college anduniversity in the United States with aspecific Carnegie classification. Figure 5provides examples of the racial/ethnicand gender differences among the threetypes of institutions. These data are forthe top 50 institutions whose studentscontinue on to receive PhDs.
Twenty-nine percent of African-Americanwomen who went into those three science
0
Physical Life Engineering
0.1
1.12
0.060.16
1.14
0.080.14
0.98
0.06
0
0.2
0.4
0.6
0.8
1
1.2Males
Females
Doctoral Parity in Science Fields by Race: 1980-1990
Par
ity In
dex
Par
ity In
dex
FIGURE 4
African American
White
Chicana
0.11
1.09
0.09
0.210.09 0.13
1.04
0.16
1.14
0.2
0.4
0.6
0.8
1
1.2
PhD Fields
Physical Life Engineering
PhD Fields
African American
White
Chicano
Baccalaureate Origins of Science PhDs by Racial/Ethnic Group: 1980-1990
Females
Males
Research I Research II
46
86
62
311
2
44
0
27
0102030405060708090
Research I Research II ComprehensiveI & II
29
7971
312
0
50
0
29
01020304050607080
African American
White
Chicana
African American
White
Chicano
FIGURE 5
Per
cent
Per
cent
I & IIComprehensive
100
90100
Source: Solorzano, D. G. (1994). The baccalaureate origins of Chicana and Chicano doctor-ates in the physical, life, and engineering sciences: 1980-1990. Journal of Women andMinorities in Science and Engineering. 1(4), 253-272.
Source: Solorzano, D. G. (1995). The doctorate production and baccalaureate origins of AfricanAmericans in the sciences and engineering. Journal of Negro Education. 64 (1), 15-32.

Building Diversity in the Scientific Workforce
22
fields did their baccalaureate work atResearch I institutions. Seventy-nine per-cent of white females and about 71 per-cent for Chicanas did their baccalaureatework at Research I institutions; althoughthe percentage of Chicanas is lower thanthat for whites, it is much higher than thatfor African Americans (29 percent). ForResearch II institutions it is 3 percent ofAfrican-American females, 4 percent ofwhite females, and 0 percent of Chicanas.Finally, 50 percent of African-Americanfemales did their undergraduate work atComprehensive I and II institutions. Also,if you look at the list of the top 50 institu-tions, for African-Americans, the top 23institutions are historically black collegesand universities. Clearly, historicallyblack colleges and universities haveplayed and continue to play a very impor-tant role in the production of African-American scientists.
As for males, about 86 percent of whites,46 percent of blacks, and 62 percent ofChicanos did their baccalaureate work atResearch I institutions. Again, this is asimilar pattern but slightly less inResearch II institutions. Finally, 44 per-cent of black males did their baccalaureatework at Comprehensive I or II institu-tions, while 27 percent of Chicanos andno whites received their baccalaureatesfrom these institutions.
David Goodstein made this comment in1993 in a journal called The AmericanScholar:“The PhD shortage is an illusion,a kind of mirage caused not by the hot sunbut by too much staring at statisticsunmoderated by serious thought. What weface instead is a chronic, systemic over-
supply of PhDs, a rising tide of PhDs thatwe seem helpless to stem.” I am not goingto argue that there is or is not generally anoverproduction of PhDs in science, butclearly for Chicanas and Chicanos, therewas not a shortage. In fact, it would takeanywhere from six to 17 times in produc-tion to increase the numbers to achieveparity.
Professor Goodstein goes on to argue thathe has a solution to this oversupply. Hesays, “What would be required for ZPG(zero population growth) in academic sci-ence? The answer is not hard to find:Each professor in a research universityshould produce, on average, during anentire career, no more than one studentwho would become another research pro-fessor.” Again, for those of us interested inincreasing the numbers of underrepre-sented minority PhDs in science, this isunrealistic and overly simplistic. Clearly,this is the sort of issue we need to deal with.
Policy Recommendations
I want to close with my policy recommendations.
Number 1: We need to understand thatK through 12 education has critical filterpoints in the production of the next gen-eration of scientists. Therefore, wemust support those programs that aretrying to increase the numbers of under-represented minorities who continue onin the science field. I sit on theUniversity of California (UC) task forcethat is looking at the eligibility ofCalifornia high school students foradmission to UC, and we have foundthat less than 4 percent of graduatingLatino high school students are eligiblefor the University of California, com-pared to 13 percent for whites, 5 per-cent for blacks, and 32 percent for AsianAmericans.
We need to understand that K through 12 education has critical filter
points in the production of the next generation of scientists.

Chapter
23
Guest Speaker Presentations
In studying the high schools inCalifornia, we found many schools thatservice mainly Latino and African-American students that did not offeradvanced placement (AP) courses, hon-ors courses, and what we in Californiacall the “A-F” required courses. Basically,these kids went to school with little or noopportunity to take these crucial coursesfor college admission. Yet we know thatif you take an AP course, it actually hasan inflating impact on your GPA.Clearly, if students haven’t been giventhe opportunity to take these courses,they are put at a disadvantage.
Number 2: We need incentives for boththe promotion and tenure of facultymembers who mentor underrepresentedminority students at the undergraduateand graduate levels.
Number 3: We need to increase the num-ber of underrepresented minority facultyin the sciences. These faculty can anddo serve as role models for the next gen-eration of scientists. They can also serveas members of admissions, fellowship,screening exam, and dissertation com-mittees. It is absolutely critical that youhave minority representatives at thattable when you look at files for admis-sions to your programs. If I had not beenon the admissions committees at myinstitutions as well as on fellowshipcommittees for the Ford Foundation,National Research Council, and NSF, Iam not sure minority students wouldhave gotten a fair read.
Screening exams are a critical filter pointat the doctoral level and it is reallyimportant that we sit on screening examcommittees and that we give a fair readto all students. Finally, dissertation com-mittees. I have had experiences in whichunderrepresented students in my depart-ment have a difficult time constituting
dissertation committees. It is really sadbut I think that there are good people atmy institution and at your institutionswho understand what is happening andsupport these students.
Number 4: We need to hold universitiesand departments accountable for the pro-duction of underrepresented minorityundergraduate and graduate students.
Number 5: We need to identify, support,and acknowledge those undergraduateand graduate institutions that are produc-
ing the next generation of minority sci-entists. I would also argue that there areimportant individuals who are doingmore than their fair share of producingthe next generation of Chicana andChicano scientists or minority scientists.Some of them are Faculty of Color, someof them are not, but we need to acknowl-edge them and support them. We alsoneed to support funding programs, suchas those sponsored by the FordFoundation and NSF, because they arehelping to produce the next generation ofminority scientists. I think at this partic-ular time, instead of backing down, weneed to be more bold in our support ofaffirmative action and affirmative actiontype programs like the NSF program.■
We need incentives for both the promotion and tenure of faculty
members who mentor underrepresented minority students at the
undergraduate and graduate levels.

Building Diversity in the Scientific Workforce
24
This is an examination of perceptionsthat faculty have regarding minori-
ties who participated in a summerresearch program at the University ofNorth Carolina. The program, theSummer Pre-Graduate ResearchExperience (SPGRE) Program, targetsminority students, of whom about 85percent to 95 percent have been AfricanAmericans. A number of Mexican-American students, Puerto Rican stu-dents, and American Indian studentshave also participated.
The program has been in existence since1988 and I have been involved in it fromits inception, and have been the directorsince 1989. From 1988 to 1996, 273 stu-dents have participated. Half a dozen ofthose students have participated twice,so we have had an approximate averageof 30 students per year who participatedin the program, but in the past severalyears, the number of participating stu-dents has been in the 40 to 50 range.This program came into existenceshortly after a large increase in suchsummer research programs whichoccurred in the late 1980s. Most of theprograms are funded by external sources.The National Science Foundation (NSF)has played a major role, as has theNational Institutes of Health and someprivate funding agencies.
SPGRE students come from a widerange of fields. When I set up the pro-gram, I noticed that students in the so-called non-science areas were prettymuch being ignored—non-science beingprimarily in such areas such as philoso-phy, English, history, and to some extent
the social sciences. For purposes of thispresentation, I categorized faculty intonon-science versus science. (With moredata collection, I am going to separatethe divisions into three: the humanities;the sciences which would [include] lifesciences, natural sciences, physical sci-ences, and engineering sciences; and thesocial sciences or behavioral sciences).The students apply to the program andthey are selected primarily by the facultywith whom they are going to work.Thus, instead of assigning students tofaculty or assigning faculty to studentswe try to set up a situation whereby thestudents and faculty communicate beforethe program actually starts.
There were 51 faculty for this particularstudy and they served as preceptors, ormentors, for SPGRE students. The fac-ulty were interviewed at the ninth and10th weeks of the [10-week] program.They were asked a series of questionsregarding their impressions of the pro-gram, some background information, andtheir assessment or perceptions of the stu-dents with whom they had worked.
One of the questions dealt with discern-ing the assessment of the faculty mem-bers’ initial expectation of the students,that is, what expectation did they have ofthe students before they arrived on cam-pus. To attain some quantitative mea-sures, I set up a scale from zero to 0.5.Then I set up what I called a positiveresponse index (PRI). The PRI for all ofthe faculty regarding their initial expec-tations of the students was 67 percent,which is fairly moderate. The next ques-tion dealt with the types of interactions
Dr. Henry T. Frierson, Jr.University of North Carolina, Chapel Hill
Perceptions of Faculty Research Preceptors Toward MinorityUndergraduates in a Summer Research Program

Chapter
25
Guest Speaker Presentations
the faculty had had with the students:“How would you describe [the interac-tions]? How often did you meet with thestudent? Were the interactions pleasant?What was your perception of the interac-tions?” The faculty had a PRI of 90 per-cent, which was quite high.
Perceptions of the students’ ability toconduct research: “Was your studentable to perform the research that wasexpected or that you had him or herengage in? Was he or she able to do it?”Again, a 90 PRI. Satisfaction with stu-dents’ performance: “Were you satisfiedwith the student’s performance?” ThePRI was 88 percent, again quite high.Perception of the students’ experiences:“Do you think that the student had posi-tive experiences during the time he orshe was here? How would you describethe experiences?” Based on interviewresults, there was a 90 PRI.
Perception of the students as prospectivegraduate students: “Based on whatyou’ve observed from your student thissummer, how do you think he or shewould perform as a graduate student at amajor research institution (i.e., ResearchI)?” The PRI was 84 percent, again quitehigh. The overall PRI mean, excludingthe initial expectation, was 88 percent.Thus, the overall perceptions of the fac-ulty of the students were quite positive.These students, for the most part, hadcompleted their junior year and were fin-ishing their last year and hopefullywould go to graduate school after theygraduate.
Seventy-five percent of the faculty indi-cated that they had served as a mentor tograduate students. We asked whetherthey had had minority graduate studentsas protégés, and 67 percent indicatedthat they had. Additionally, 75 percentindicated that they had served as mentors
to undergrads. We then asked the ques-tion, “Have you had minority undergrad-uate students for whom you served as amentor?,” and 57 percent indicated thatthey had. Forty-seven percent of precep-tors reported that they had participated inthe program in the past. When asked thequestion, “When you were an undergrad,did you have a mentor?,” 57 percent saidno, an interesting finding. To the ques-tion, “Did you have a mentor as a gradu-ate student?” Fifty-three percent saidthat they had not. To the question, “Hasthe experience that you had as anSPGRE preceptor been worthwhile?,”the PRI was 98 percent. When asked“Would you be willing to serve as a pre-ceptor again?,” the PRI was 95 percent.
There were 27 non-science preceptorswho worked with 42 students. A numberof the non-science faculty had more thanone student with whom they worked. Inthe sciences, there were 24 preceptorswho worked with 26 students. For theinitial expectations of the science fac-ulty, the PRI was 46 percent. An exam-ple of one science faculty member’sresponse, which typified the perceptionsof his colleagues was, “Well, I expectedthem to be able to do a few things butnothing major.” The non-science precep-tors had a different set of expectations,which were more positive. Perceptionsof student-faculty interactions werepretty much the same—quite positive.The two groups of faculty’s perceptionof the students’ ability to conductresearch was also fairly even.Perceptions of students as prospectivegraduate students: a PRI of 86 percent[non-science] versus 81 percent [sci-ence], again pretty much the same.Overall mean PRI: 91 percent [non-sci-ence] versus 85 percent [science].
A part that was of importance to me froman assessment standpoint were three cat-
Building Diversity in the Scientific Workforce
26
egories to which the faculty membersresponded: (1) “Had a worthwhile expe-rience as a preceptor”—the same PRI of98 percent was observed for both non-science and science preceptors; (2) “Wasthe effort as an SPGRE preceptor worthit?”—a PRI of 100 percent [non-science]versus 94 percent [science]; and (3)“Would you be willing to serve as anSPGRE preceptor again in the future”—96 percent PRI [non-science] versus 94percent PRI [science].
There were 39 white preceptors whoworked with 45 students, and there were11 black preceptors who worked with 21students. Notably, all but one of theblack preceptors were in non-scienceareas and they tended to work with morethan one student. The initial PRI relatedto expectations of the students was 60percent for the white preceptors versus88 percent for the black preceptors, sothe expectations of the black preceptorswere considerably higher. The PRIrelated to interaction with students wasessentially the same, 90 percent [whitepreceptors] versus 93 percent [black pre-ceptors].
The PRI related to the perception of thestudents’ ability to conduct research wasagain pretty much the same but again thePRI of the black preceptors washigher—95 percent compared to 89 per-cent. Related to satisfaction with the stu-dents’ performance, white preceptors’PRI was 82 percent, which was againquite positive, but that of the black pre-ceptors was considerably higher at 95percent. Related to perception of the stu-dent’s experience, the PRI was 91 per-cent for the white preceptors versus 88percent for the black faculty.
Regarding their perceptions of their stu-dents as prospective graduate students ata major research university, the PRI was
83 percent for white preceptors versus86 percent for black preceptors. Theoverall PRI mean was fairly close at 87percent versus 91 percent for white andblack faculty preceptors, respectively.
Again, looking at [preceptors’] back-ground. Served as mentors to undergradstudents: 91 percent of the black precep-tors versus 72 percent of the white precep-tors said they had. Most of the black pre-ceptors had been mentors, so they had hadthat experience. Then the question of inter-est to me would be “Was the experienceworthwhile?” Again, [the PRI] was veryhigh, both white and black. “Was it worthit?”: Again, quite high for both white andblack. “Would you be willing to serveagain?”: Again, there was pretty muchgeneral agreement that they would do it.
I then looked at underrepresented groups[of faculty] and the underrepresentedgroups, of course, would be women andminorities. In this case “minority” meantAfrican Americans; there were not reallyany other underrepresented ethnicgroups participating as faculty [during]the two years studied. The initial expec-tation of women and minority preceptorswas significantly higher than that ofwhite male preceptors. Perceptions ofinteraction with students was high forboth groups. Perceptions of the student’sability to conduct research was also highfor both groups, but higher for womenand minority preceptors.
Women and minority preceptors tendedto be more satisfied with the students’performance. Perceptions of the students’experiences was high for both groups, butregarding the perception of students asprospective graduate students, there was adiscernible difference between whitemale preceptors [79 percent PRI] com-pared to women and minority preceptors[89 percent PRI]. The overall mean PRI

Chapter
27
Guest Speaker Presentations
was 84 percent for white male preceptorscompared to 92 percent for women andminority preceptors.
Now we look at how the two groups[white male preceptors and minority/women preceptors] compared regardingexperiences. Perceptions of whether ornot the experience was worthwhile wasquite high for both white male precep-tors and women and minority preceptors.The PRI also was quite high for bothgroups regarding whether or not theyperceived the effort to be worth it, andthe PRI was also high regarding the fac-ulty members’ willingness to serve aspreceptors again.
The overall responses are quite positive.To me this is a very encouraging set ofresults because of the willingness offaculty to participate, the perception ofthe students, the perception of the work,and the overall view of the program werequite encouraging. Now there is a prob-lem because this program is one of about75 that received major support from theDepartment of Education (ED) forwomen and minority participation ingraduate studies. We initially receivedour funding finally in 1990 and aboutfive years later the money disappearedbecause the ED program from which thefunding emanated was terminated.
Both programs provided significantresearch experience for students.Moreover, the Department of Energy hadfunding that provided summer researchfor students, and the EnvironmentalProtection Agency has funding that pro-vided summer research for students; how-ever, these sources of funding, for themost part, are gone. If you look at theNational Research Council data for 1995,finally there had been a major increasein—or at least the number of African-American PhDs had finally surpassed—
the number that was produced in 1976.That has occurred 20 years later!
My contention is that one of the influen-tial factors in the increase of African-American doctoral recipients was thenumber of research programs that pro-
vided significant experiences for a con-siderable number of students who mightnot have really seriously considered doc-toral studies. What the SPGRE Programand other programs have done for stu-dents is to provide them with the knowl-edge that, “Yes, I can be quite successfulin graduate studies, and I can work quitewell with faculty, and faculty haveencouraged me and they respect me andso why not [pursue doctoral studies].”
The upshot in the termination of signifi-cant funding sources is that in order torun a major research [mentoring] pro-gram, you would have to really scramblefor funding. You can’t rely on one or twosources. You have to piece thingstogether and that of course, for someonewho is trying to start something new, isvirtually impossible. In reality, theseprograms have had a profound effect. Ifthe responses of SPGRE faculty are anyindication, the faculty are quite accept-ing of the programs, and they think [theprograms] are great. Moreover, theythink the students are fantastic, and theyare looking forward to and participatingas preceptors.■
“What the SPGRE Program and other programs have done for
students is to provide them with the knowledge that, “Yes, I can be
quite successful in graduate studies. . . .”

Building Diversity in the Scientific Workforce
28
My presentation is limited to a study thatI conducted with partial support from theNational Science Foundation. Let metake a moment to tell you somethingabout the background of this study.Several years ago, I had a chance to meetand talk with a number of minority menwho earned their PhDs in the 1930s and1940s. I was struck by the fact that manyattended the same graduate schools.These conversations represent the begin-nings of my interest in the history ofminorities in science.
This study focused exclusively on U.S.citizens who were African Americansand who finished high school in the U.S.A random sample was drawn from a listof 450 African-American PhD chemists.The sample comprised 47 persons, ofwhich 44 were personally interviewed (a94 percent response rate).
First, I will discuss some of the demo-graphic characteristics of the sample.Respondents ranged in age from 31 to 86years. Many of the older respondentswere semi-retired or retired, but veryactive in science education related activ-ities. The median age of the sample was56 years, and the largest percentage ofthe respondents was in the 55 to 64 agegroup. A large proportion of the respon-dents resided in the South, followed bythe North, East, and West.
Most of the respondents grew up in two-parent households. There were only afew who grew up in single parent house-holds—usually due to divorce. Onerespondent grew up in a family with nei-ther biological parent (i.e., raised bygrandparents). Nearly two in fiverespondents were first-borns and/or onlychildren. This finding is consistent withthe literature on birth order of scientists.In terms of parental education, approxi-mately two-fifths of both mothers andfathers were not high school graduates;however, fathers were considerablymore likely to hold a college degree, aca-demic doctorate, or professional degree.Ten of the respondents reported that theirmothers were housewives. A small pro-portion of the respondents reported thattheir mothers did not work outside of thehome. Of those who did work outside ofthe home, there was a range of occupa-tions—from sharecropper to physician.
Slightly more than half of the respon-dents were married. In fact, half of therespondents were married while pursu-ing their doctorates. The median age atfirst marriage was 26 years, while therange was from 18 to 48. Nearly one in10 chemists never married, and one-fifthwere divorced and unmarried at the timeof the interview. Slightly more than a10th were remarried; approximately 7percent were widowed.
Women were far more likely than men tohave never married and if married wereconsiderably more likely to have experi-enced a divorce. In contrast, men weremore likely to have reported experiencewith the death of a spouse. The number
Dr. Willie Pearson, Jr. Wake Forest University
Educational and Career Experiences of African-American PhD Scientists
Once being exposed to a chemistry course or chemistry experiment,
respondents were more likely to have a definite discipline of science
that they wanted to pursue.

Chapter
29
Guest Speaker Presentations
of children ranged from zero to five; thetypical family comprised two children.Generally, the first child was born whenthe respondent’s median age was 31years, while the range was 20 to 52years. Overall, few respondents reportedthat a child had been born during a criti-cal point in their careers.
Overall, respondents reported fondmemories of their elementary and sec-ondary school years. In particular, mostsingled out their math and sciencecourses; usually their interest in mathe-matics emerged prior to their interest inscience. This, of course, is due in largemeasure to earlier exposure to mathe-matics. By late middle school and earlyhigh school, most knew that they wanteda career in science. Once being exposedto a chemistry course or chemistryexperiment, respondents were morelikely to have a definite discipline of sci-ence that they wanted to pursue.Although a small minority reported thatprior to high school they wanted to pur-sue a career in chemistry, the vast major-ity made this decision while in highschool, usually around the junior year.Approximately a fourth made this deci-sion after high school, usually in college,and there were only one or two personswho had made the decision to pursue acareer in science or chemistry after col-lege.
An overwhelming number of respon-dents graduated in the top quarter of theirsenior classes. Roughly one in 10respondents graduated from private highschools, while the remainder earneddiplomas from public high schools.Whether private or public, the vastmajority of respondents graduated fromhigh schools where they were in theracial majority. Although this was moretypical in the South, the pattern was sub-stantially no different in other parts of
the country, particularly the North andthe East. A majority of respondentsreported that they had been encouragedby various persons to pursue studiesbeyond high school. Parents exerted themost influence on respondents’decisionsto attend college. The next most influen-tial person was likely to be a teacher.
A majority of the respondents enteredcollege with intentions to major in chem-istry, not always to pursue a career inchemistry. A substantial minorityintended to pursue careers in medicine.
Historically black college and universi-ties (HBCUs) produce more than theirproportional share of African-Americanscientists, especially those earning PhDs.These results confirm those findings.However, there were some gender differ-ences. Although six in 10 respondentshad their baccalaureate origin inHBCUs, there were marked differencesalong gender lines. For example, maleswere more likely than females to earn
their BS degrees at HBCUs. Overall,graduates of HBCUs expressed greatersatisfaction with their undergraduateeducation than graduates of predomi-nantly white colleges and universities(PWCUs), but there were a number ofpositive comments from those who fin-ished PWCUs.
For most respondents, the decision toattend graduate school was made whilein college. When asked who or whatinfluenced their decisions to attend grad-uate school, the top response was “self.”
When asked who or what influenced their decisions to attend graduate
school, the top response was “self.” However, a close second was a
“mentor.”

Building Diversity in the Scientific Workforce
30
However, a close second was a “men-tor.” The age at receipt of a PhD rangedfrom 25 years to 39 years (the medianage was 29 years). With respect toresearch specialties, the largest propor-tion of respondents concentrated inorganic chemistry, followed by physicalchemistry.
Few respondents reported the presenceof African Americans on the faculty oftheir PhD-granting departments. Norespondents in cohorts 1, 2, and 4reported African Americans on their fac-ulty. These data demonstrate the extentto which African Americans were under-represented on the graduate chemistryfaculties, particularly at PWCUs. In con-trast, respondents were more likely toreport the presence of African-Americanclassmates at some point during theirdoctoral studies.
A substantial majority of respondentsspent less than five years full time(enrolled time) to complete their doctor-ates. Few respondents completed theirPhDs in less than three years or in morethan six years. During the course of theirdoctoral studies, most respondentsattended at least one meeting of a scien-tific society.
In terms of geographic origins of PhD-granting institutions, most respondentsearned their degrees in the North, fol-lowed by the East, the South, and theWest. No respondents earned a doctoratefrom a Southern institution prior to 1965.A number of respondents earning theirBS degrees in the South prior to 1965stated that they were forbidden by law to
pursue doctoral studies in predominantlywhite schools in their states because ofracial segregation. They pointed to apractice of their states in providingfinancial assistance for them to pursuetheir doctoral studies outside of the state.A majority of the Southerners earnedtheir doctorates in the North. The vastmajority of respondents were very satis-fied or satisfied with the quality of theirdoctoral education. For many, the levelof satisfaction was tied to their relation-ships with “mentors” or “key facultymembers.”
Postdoctoral study became more promi-nent beginning with those who earneddoctorates in Cohort II (1965 to 1974).Most respondents pursuing postdoctoralstudy were pursuing careers outside ofHBCUs; those earning doctorates priorto the mid-1960s indicated that postdoc-toral study was uncommon for theircohort. By the 1980s, however, it wascommon for respondents to pursue post-doctoral study, usually to specialize fur-ther and to produce more publishedresearch in order to become more com-petitive in the job market.
Prior to the late 1960s, HBCUs, and to alesser extent government, were favoritesites for respondents to begin theircareers. Respondents in predominantlywhite employment settings more oftenreported a feeling of isolation and a feel-ing of being under a microscope becausethey were the only African Americans intheir units. Furthermore, most respon-dents reported direct experience with theglass ceiling. Nevertheless, a majority ofacademicians believed that the criteriafor tenure and promotion were reason-ably but often not specified in writing.All thought that criteria for tenure andpromotion should be in writing.Academicians, regardless of institutionalaffiliation, reported difficulty in securing
The “mentor” played a very strong role in the careers of the
respondents.

Chapter
31
Guest Speaker Presentations
external funding sufficient to sustaintheir labs.
Post-1980 graduates of some of thenation’s most prestigious PhD depart-ments expressed considerable disap-pointment that they began their careers insettings similar to those of graduates ofless prestigious PhD departments. Thosewho had attended some of the most selec-tive undergraduate and graduate schoolsexpressed a strong sense of disappoint-ment because the prestige of theirdegrees did not overcome disadvantagesassociated with their racial status.
The “mentor” played a very strong role inthe careers of the respondents. However,there are both positive and negativeaspects of mentoring. Some respondentsthought that their (white) “mentors”wanted to he helpful but were reluctant tobe critical of minority students. As a con-sequence, many respondents thought thattheir writing and analytical skills werenot critiqued strongly enough.
Regarding the distribution of Federalresearch funding, most subjects believedthat merit was not primarily the determi-nant of success. Nearly all respondentsbelieved that there is a need to expand thepool of African-American PhD chemists,regardless of employment trends. Also,most emphasized that all students shouldhave more exposure to the contributionsof African Americans to science and theimportance of those contributions to soci-ety. A majority of respondents called forimprovement in the quality of math andscience education, especially in schoolsserving large numbers of low-incomeand minority students.
Women respondents reported experi-ences similar to those reported by otherethnic women. Several women respon-dents indicated that the chemistry com-
munity in general is male-dominatedand sexist and that the most prominent,predominantly black chemistry organi-zation is no different. A majority of thewomen indicated that they were not
members of the so-called “invisible col-lege,” that is, the network of gatekeep-ers. Most women believed that they hadto overcome barriers related to both raceand gender. Some women reported thatthey were not taken seriously when pre-senting their research or asking ques-tions at professional scientific meetings.One woman noted that the women in herdepartment tended to have heavierteaching loads than the males and thatmale students (especially graduate stu-dents) did not take them seriously asthey did male professors.
Finally, a majority of respondentsemployed in predominantly white set-tings, especially universities and indus-try, described personal experiences withracial discrimination and prejudicial atti-tudes. However, only a few reportedbeing the object of overt racist commentsby their colleagues and/or supervisors.Most respondents believed that whilemuch progress has been made in reduc-ing overt discrimination in the work-place, race still matters. One thing thatwas striking was that regardless of per-sonal experiences, all loved chemistryand said that if they had it to do again,they would again choose chemistry.■
Most women believed that they had to overcome barriers related to
both race and gender.
Building Diversity in the Scientific Workforce
32
Annual Meeting AgendaSeptember 11-13, 1996Arlington, Virginia
WEDNESDAY, SEPTEMBER 11
1:00 - 1:10 p.m Welcome
Dr. James H. BrownDirector, Division of Biological Infrastructure
1:10 - 5:15 p.m. Chalk Talks by Current Fellows (Chalk talks are five-minute presentations without visual aids)
Introductions of Fellows by:
Mr. William P. ButzDirector, Division of Social, Behavioral, and Economic Research
Dr. Thomas E. BradyDirector, Division of Environmental Biology
Dr. Bruce L. UmmingerDirector, Division of Integrative Biology and Neuroscience
Dr. Julius H. JacksonDirector, Division of Molecular and Cellular Biosciences
5:30 p.m. Social Hour
THURSDAY, SEPTEMBER 12
8:30 - 9:00 a.m. Opening Comments
Dr. Cora B. MarrettAssistant Director, Social, Behavioral, and Economic Sciences
Dr. Mary E. ClutterAssistant Director, Biological Sciences
9:00 - 9:20 a.m. Diversity in the Scientific Workforce
Dr. William A. Lester, Jr.Senior Fellow, Office of the Director
9:20 - 10:30 a.m. Access to Mathematics and Science Careers for Underrepresented Minority Students: Research Findings and Explorations
Dr. Beatriz ClewellThe Urban Institute
1996 National Science Foundation Minority Postdoctoral Research Fellows and Mentors
Chapter
33
Annual Meeting Agenda
10:30 - 10:50 a.m. Break
10:50 - 11:40 a.m. Production of Chicana and Chicano Doctoral Scientists: Status, Barriers,and Policy Recommendations
Dr. Daniel SolorzanoUniversity of California, Los Angeles
11:40 a.m. - 12:30 p.m.Perceptions of Faculty Research Preceptors TowardMinority Undergraduates in a Summer Research Program
Dr. Henry Frierson, Jr.University of North Carolina, Chapel Hill
12:30 - 2:00 p.m. Lunch
2:00 - 2:30 p.m. Charge to Breakout Groups
2:30 - 4:30 p.m. Breakout Group Discussions
4:30 - 5:00 p.m. Group Report Writing
FRIDAY, SEPTEMBER 13, 1996
8:00 - 9:00 a.m. Breakout Groups Work Session
9:00 - 9:50 a.m. Educational and Career Experiences of African-American PhD Scientists
Dr. Willie Pearson, Jr.Wake Forest University
10:00 - 10:30 a.m. Comments from the Director
Dr. Neal LaneDirector, National Science Foundation
10:30 a.m. - Noon Reports from Groups and Recommendations to NSF
Wrap-Up and Dismissal
1:00 - 1:30 p.m. Briefing Session for 1995 BIO Fellows
Optional Session on FAQs about Fellowships
Ms. Opal Fenwick, Ms. Carter Kimsey, and Ms. Bonney Sheahan

Building Diversity in the Scientific Workforce
34
Claudia Arana, PhDDade International, Inc.Miami, Florida
Jonathan Arias, PhDDivision of Plant Biology Scripps Institute LaJolla, California
Kim Armstrong, PhDBeckman InstituteUniversity of IllinoisUrbana, Illinois
Avery August, PhDLaboratory of Immunology/MolecularOncologyRockefeller UniversityNew York, New York
Judith Becerra, PhD Department of Ecology & EvolutionUniversity of ArizonaTucson, Arizona
Marcos Betancourt, PhDInstitute for Physical Science &Technology University of MarylandCollege Park, Maryland
Phyllis Betts, PhDCenter for Research on WomenUniversity of MemphisMemphis, Tennessee
Norma Bond-Burgess, PhDDepartment of Child & Family StudiesSyracuse UniversitySyracuse, New York
Squire Booker, PhDInstitute for Enzyme StudiesMadison, Wisconsin
Antonio Botelho, PhDPolitical Science, History of ScienceDecanato do CTCPUC-RioRio de Janeiro, Brazil
Jeannette Brown, PhDNew Jersey Institute of TechnologyNewark, New Jersey
Jonathan Caguiat, PhDMicrobiologyUniversity of GeorgiaAthens, Georgia
Camilo Canel, PhDLeiden Institute of ChemistryLeiden UniversityLeiden, The Netherlands
Daniel Caprioglio, PhDYeast Molecular BiologyUniversity of Southern ColoradoPueblo, Colorado
Lucinda Carnell, PhDDepartment of Biological ScienceColumbia UniversityNew York, New York
Christian Clausen, PhDDepartment of ChemistryUniversity of Central FloridaOrlando, Florida
Beatriz Clewell, PhDEducation Policy ResearchThe Urban InstituteWashington, D.C.
Wilfredo Colon, PhDFox Chase Cancer CenterPhiladelphia, Pennsylvania
Adan Colon-Carmona, PhDPlant Molecular & Cellular BiologySalk InstituteLaJolla, California
Ricardo Cortez, PhDCourant InstituteNew York UniversityNew York, New York
Monica Driscoll, PhDRutgers UniversityPiscataway, New Jersey
Henry Frierson, PhDUniversity of North CarolinaChapel Hill, North Carolina
Cherie Geiger, PhDChemistry DepartmentUniversity of Central FloridaOrlando, Florida
Mariana Gerschenson, PhDNational Cancer InstituteNational Institutes of HealthBethesda, Maryland
Tyrone Hayes, PhDDepartment of Integrative BiologyUniversity of CaliforniaBerkeley, California
Alice Hempel, PhDDepartment of GeneticsUniversity of GeorgiaAthens, Georgia
Dennis Hernandez, PhDDepartment of EnzymologyBristol Myers SquibbWallingford, Connecticut
Elisabeth Arevalo Holder, PhDDepartment of Ecology & Evol. BiologyRice UniversityHouston, Texas
Sharon Horton, PhDUniversity of Texas SouthwesternMedical CenterDallas, Texas
Carter Hull, PhDGeothermal Geology, GeochemistryFlorida State UniversityTallahassee, Florida
National Science Foundation1996 National Science Foundation Minority PostdoctoralResearch Fellows and Mentors Annual Meeting Attendees
Chapter
35
Annual Meeting Attendees
Gavin Huntley-Fenner, PhDDepartment of Cognitive ScienceUniversity of California, DavisIrvine, California
Denise Jackson, PhD Psychology DepartmentNortheastern UniversityBoston, Massachusetts
Edward Katkin, PhDDepartment of PsychologyState University of New YorkStony Brook, New York
Debbie Laudencia-Chingcuanco, PhDPGEC-USDAAlbany, California
Steven L’Hernault, PhDDev. Genetics/Cell BiologyEmory UniversityAtlanta, Georgia
Jeffrey Macklis, PhDHarvard Medical SchoolChildren’s HospitalBoston, Massachusetts
Mark Melton, PhDDepartment of PhysiologyUniversity of North CarolinaChapel Hill, North Carolina
Ricardo Metz, PhDDepartment of ChemistryUniversity of MassachusettsAmherst, Massachusetts
Elizabeth Mezzacappa, PhDBehavioral Medicine ProgramColumbia-Presbyterian Medical CenterNew York, New York
Carlos Molina, PhDDepartment of Obstetrics & GynecologyUMDNJ-New Jersey Medical SchoolNewark, New Jersey
Benjamin Ortiz, PhDDepartment of Molecular &Cellular BiologyUniversity of CaliforniaBerkeley, California
Willie Pearson, PhDDepartment of SociologyWake Forest UniversityWinston-Salem, North Carolina
Peter Serrano, PhDDepartment of PsychologyNorthwestern UniversityEvanston, Illinois
Pamela Sharpe, PhDDepartment of Molecular Biology &GeneticsJohns Hopkins UniversityBaltimore, Maryland
Andrew Singson, PhDDepartment of BiologyEmory UniversityAtlanta, Georgia
Daniel Solorzano, PhDGraduate School of EducationUniversity of CaliforniaLos Angeles, California
Tracey Takeuchi-Miller, PhDJ. Walter Wilson LabsBrown UniversityProvidence, Rhode Island
Elizabeth Torres, PhDDepartment of BiologyUniversity of CaliforniaLos Angeles, California
Paul Turner, PhDDepartment of ZoologyUniversity of MarylandCollege Park, Maryland
William Yslas Velez, PhDDepartment of MathUniversity of ArizonaTucson, Arizona
Lucretia Monique Ward, PhDDev. PsychologyUniversity of MichiganAnn Arbor, Michigan
Leroy Worth, PhDLaboratory of Molecular GeneticsNational Institute of EnvironmentalHealth SciencesResearch Triangle Park, North Carolina
Annual Meeting Attendees
Building Diversity in the Scientific Workforce
36
The National Science Foundation Actof 1950 (Public Law 81-507) set forth
the National Science Foundation’s mis-sion and purpose: “To promote theprogress of science; to advance thenational health, prosperity, and welfare;to secure the national defense . . .” TheAct authorized and directed NSF to initi-ate and support:
• Basic scientific research and researchfundamental to the engineering process,
• Programs to strengthen scientific andengineering research potential,
• Science and engineering education pro-grams at all levels and in all of the var-ious fields of science and engineering,
• Programs that provide a source of infor-mation for policy formulation, and
• Other activities to promote these ends.
Over the years, NSF’s statutory authorityhas been modified in a number of signif-
icant ways. In 1968, authority to supportapplied research was added to theOrganic Act. In 1980, the Science andEngineering Equal Opportunities Actgave NSF standing authority to supportactivities to improve the participation ofwomen and minorities in science andengineering. Another major changeoccurred in 1986, when engineering wasaccorded equal status with science in theOrganic Act.
NSF has always dedicated itself to pro-viding the leadership and vision neededto keep the words and ideas embedded inits mission statement fresh and up-to-date. Even in today’s rapidly changingenvironment, NSF’s core purpose res-onates clearly in everything it does: pro-moting achievement and progress in sci-ence and engineering, and enhancing thepotential for research and education tocontribute to the Nation. While NSF’svision of the future and the mechanisms ituses to carry out its charges have evolvedsignificantly over the past four decades,its ultimate mission remains the same.
The National Science Foundation Mission
■

The National Science Foundation pro-vides awards for research and educa-
tion in the sciences and engineering. Theawardee is wholly responsible for theconduct of such research and preparationof the results for publication. TheFoundation, therefore, does not assumeresponsibility for the research findings ortheir interpretation.
The Foundation welcomes proposalsfrom all qualified scientists and engineersand strongly encourages women, minori-ties, and persons with disabilities to com-pete fully in any of the research and edu-cation related programs described here.In accordance with Federal statutes, reg-ulations, and NSF policies, no person ongrounds of race, color, age, sex, nationalorigin, or disability shall be excludedfrom participation in, be denied the bene-fits of, or be subject to discriminationunder any program or activity receivingfinancial assistance from the NationalScience Foundation.
Facilitation Awards for Scientists andEngineers with Disabilities (FASED)provide funding for special assistance orequipment to enable persons with disabil-ities (investigators and other staff, includ-ing student research assistants) to workon NSF projects. See the programannouncement or contact the programcoordinator at (703) 306-1636.
The National Science Foundation hasTDD (Telephonic Device for the Deaf)capability, which enables individualswith hearing impairment to communicatewith the Foundation about NSF pro-grams, employment, or general informa-tion. To access NSF TDD, dial (703)306-0090; for FIRS, 1(800) 877-8339.■

National Science Foundation4201 Wilson BoulevardArlington, VA 22230
NSF 98-37