Building a Stronger, Sustainable Oasis: Transforming into ...
27
A New Tomorrow, Today Nasdaq: OAS A New Tomorrow, Today May 2021 Building a Stronger, Sustainable Oasis: Transforming into Dominant Williston Basin Pure Play
Transcript of Building a Stronger, Sustainable Oasis: Transforming into ...

A New Tomorrow, TodayNasdaq: OAS
A New Tomorrow, Today
May 2021
Building a Stronger,
Sustainable Oasis:
Transforming into
Dominant Williston Basin
Pure Play
A New Tomorrow, TodayNasdaq: OAS 2
Forward-Looking / Cautionary Statements
Non-GAAP Financial MeasuresCash Interest, Adjusted EBITDA, E&P Cash G&A, Free Cash Flow, Adjusted Net Income (Loss) Attributable to Oasis, Adjusted
Diluted Earnings (Loss) Attributable to Oasis Per Share and Recycle Ratio are supplemental financial measures that are not
presented in accordance with generally accepted accounting principles in the United States (“GAAP”). These non-GAAP measures
should not be considered in isolation or as a substitute for interest expense, net income (loss), operating income (loss), net cash
provided by (used in) operating activities, earnings (loss) per share or any other measures prepared under GAAP. Because Cash
Interest, Adjusted EBITDA, Free Cash Flow, Adjusted Net Income (Loss) Attributable to Oasis, Adjusted Diluted Earnings (Loss)
Attributable to Oasis Per Share and Recycle Ratio exclude some but not all items that affect net income (loss) and may vary among
companies, the amounts presented may not be comparable to similar metrics of other companies. Reconciliations of these non-GAAP
financial measures to their most comparable GAAP measure can be found in the annual report on Form 10-K, quarterly reports on
Form 10-Q and on our website at www.oasispetroleum.com. Amounts excluded from these non-GAAP measure in future periods
could be significant.
Cautionary Statement Regarding Oil and Gas Quantities The Securities Exchange Commission (the “SEC”) requires oil and gas companies, in their filings with the SEC, to disclose proved
reserves, which are those quantities of oil and gas, which, by analysis of geoscience and engineering data, can be estimated with
reasonable certainty to be economically producible—from a given date forward, from known reservoirs, and under existing economic
conditions (using unweighted average 12-month first day of the month prices), operating methods, and government regulations—prior
to the time at which contracts providing the right to operate expire, unless evidence indicates that renewal is reasonably certain,
regardless of whether deterministic or probabilistic methods are used for the estimation. The accuracy of any reserve estimate
depends on the quality of available data, the interpretation of such data and price and cost assumptions made by reserve engineers.
In addition, the results of drilling, testing and production activities of the exploration and development companies may justify revisions
of estimates that were made previously. If significant, such revisions could impact the Company’s strategy and future prospects.
Accordingly, reserve estimates may differ significantly from the quantities of oil and natural gas that are ultimately recovered. The
SEC also permits the disclosure of separate estimates of probable or possible reserves that meet SEC definitions for such reserves;
however, we currently do not disclose probable or possible reserves in our SEC filings.
Our production forecasts and expectations for future periods are dependent upon many assumptions, including estimates of
production decline rates from existing wells and the undertaking and outcome of future drilling activity, which may be affected by
significant commodity price declines or drilling cost increases.
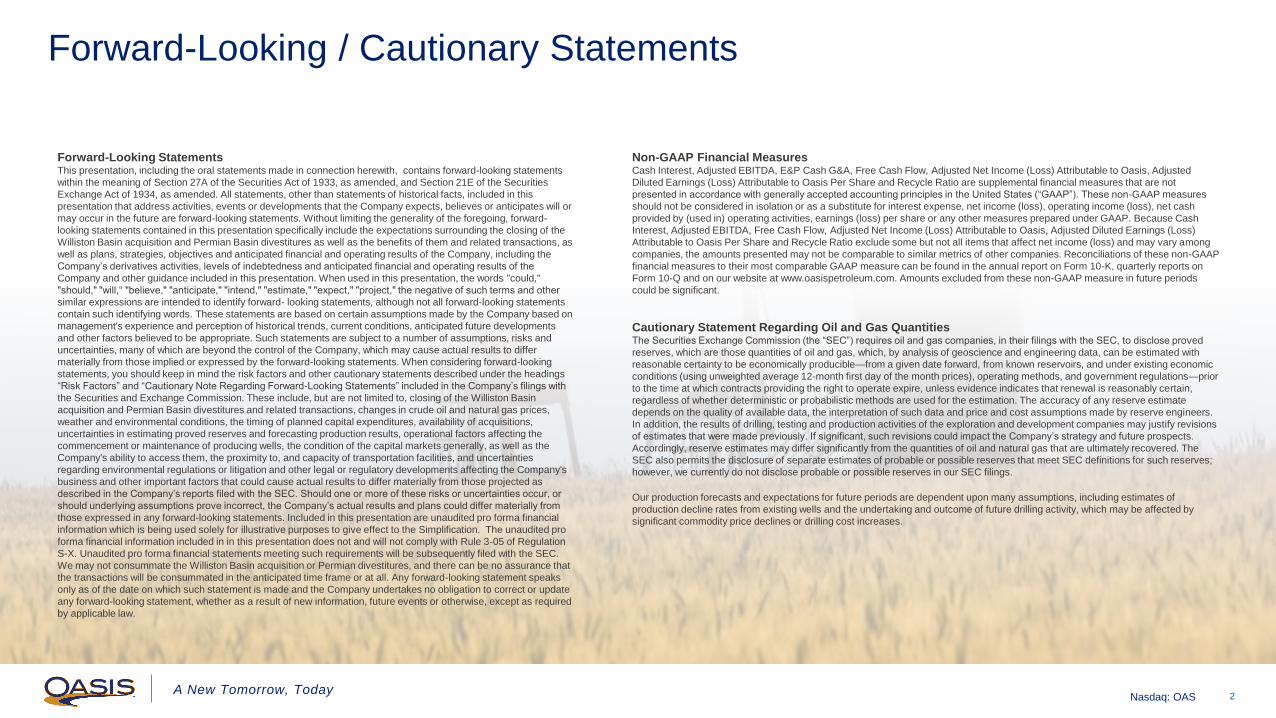
Forward-Looking StatementsThis presentation, including the oral statements made in connection herewith, contains forward-looking statements
within the meaning of Section 27A of the Securities Act of 1933, as amended, and Section 21E of the Securities
Exchange Act of 1934, as amended. All statements, other than statements of historical facts, included in this
presentation that address activities, events or developments that the Company expects, believes or anticipates will or
may occur in the future are forward-looking statements. Without limiting the generality of the foregoing, forward-
looking statements contained in this presentation specifically include the expectations surrounding the closing of the
Williston Basin acquisition and Permian Basin divestitures as well as the benefits of them and related transactions, as
well as plans, strategies, objectives and anticipated financial and operating results of the Company, including the
Company’s derivatives activities, levels of indebtedness and anticipated financial and operating results of the
Company and other guidance included in this presentation. When used in this presentation, the words "could,"
"should," "will,“ "believe," "anticipate," "intend," "estimate," "expect," "project," the negative of such terms and other
similar expressions are intended to identify forward- looking statements, although not all forward-looking statements
contain such identifying words. These statements are based on certain assumptions made by the Company based on
management's experience and perception of historical trends, current conditions, anticipated future developments
and other factors believed to be appropriate. Such statements are subject to a number of assumptions, risks and
uncertainties, many of which are beyond the control of the Company, which may cause actual results to differ
materially from those implied or expressed by the forward-looking statements. When considering forward-looking
statements, you should keep in mind the risk factors and other cautionary statements described under the headings
“Risk Factors” and “Cautionary Note Regarding Forward-Looking Statements” included in the Company’s filings with
the Securities and Exchange Commission. These include, but are not limited to, closing of the Williston Basin
acquisition and Permian Basin divestitures and related transactions, changes in crude oil and natural gas prices,
weather and environmental conditions, the timing of planned capital expenditures, availability of acquisitions,
uncertainties in estimating proved reserves and forecasting production results, operational factors affecting the
commencement or maintenance of producing wells, the condition of the capital markets generally, as well as the
Company's ability to access them, the proximity to, and capacity of transportation facilities, and uncertainties
regarding environmental regulations or litigation and other legal or regulatory developments affecting the Company's
business and other important factors that could cause actual results to differ materially from those projected as
described in the Company’s reports filed with the SEC. Should one or more of these risks or uncertainties occur, or
should underlying assumptions prove incorrect, the Company’s actual results and plans could differ materially from
those expressed in any forward-looking statements. Included in this presentation are unaudited pro forma financial
information which is being used solely for illustrative purposes to give effect to the Simplification. The unaudited pro
forma financial information included in in this presentation does not and will not comply with Rule 3-05 of Regulation
S-X. Unaudited pro forma financial statements meeting such requirements will be subsequently filed with the SEC.
We may not consummate the Williston Basin acquisition or Permian divestitures, and there can be no assurance that
the transactions will be consummated in the anticipated time frame or at all. Any forward-looking statement speaks
only as of the date on which such statement is made and the Company undertakes no obligation to correct or update
any forward-looking statement, whether as a result of new information, future events or otherwise, except as required
by applicable law.

A New Tomorrow, TodayNasdaq: OAS
Strategic Transactions Position Oasis as Premier Williston Producer
3
Purchase/Sales PriceWilliston Purchase: Permian Divestiture Transactions:
$745MM $481MM
Consideration for
Net Purchase Price
All cash (no dilution to shareholders)
Funded through combination of:
Cash on hand ($105.9MM at 3/31/21)
Revolver ($450MM ECA and $500MM BB pre-
acquisition, $0 drawn at 3/31/21)
Underwritten bridge at signing (expecting unsecured
notes offering to take out bridge)
Synergies & Upside
4Q21 production up by 20% vs Feb guide, G&A unchanged
Inventory arbitrage, extending Williston runway
By focusing on Williston Basin, able to leverage scale to
lower overall cost structure, including infrastructure options
Potential to improve realized pricing through marketing
contracts and negotiating of terms
Refrac opportunities
Timing Williston purchase expected to close in July
Permian sale expected to close end of June
Summary of Transactions1Highlights Williston acquisition adds size and scale to Cornerstone Asset at a compelling
valuation
Valued at ~$28k/Boepd / 3.0x 1Q21 annualized EBITDA1
1Q21 volumes of 27 Mboepd and ~95,000 net acres
Acquired highly free cash flow generative asset with incremental FCF
>$550MM through 2024 at strip1,2
Permian divestures - accretive move to rationalize portfolio at attractive price
Valued at ~$67k/Boepd / 4.6x 1Q21 annualized EBITDA1
Permian was no longer strategic to Oasis due to inability to add size and
scale around our 24k net acre position
Combined impact of transactions accretive to shareholder value
Largely PDP based valuation with free option on 2-3 years of top-tier
inventory in Williston, with potential for another 4+ years of upside locations
Brought forward value of Permian inventory – at $35k/Boepd for PDP,
effectively receiving $231MM for inventory
Net impact results in paying $264MM for ~$155MM of EBITDA (1.7x)3
Commitment to balance sheet strength - pro forma leverage of ~0.3x
Combined transactions highly accretive across all key metrics – near and
long-term: FCF per share, Cash Flow per share, Reinvestment ratio
OMP retains Panther DevCo and expects to benefit from incremental
activity on asset.
1) Diamondback acquired QEP on March 17th and Oasis has entered into a definitive agreement to acquire QEP’s Williston Basin assets. On May 18, 2021, Oasis announced a series of transactions to sell its Permian E&P asset for total gross potential consideration of $481MM,
consisting of $406MM at closing and up to three $25MM contingent earn-out payments for 2023, 2024 and 2025 if WTI averages over $60 per barrel for each respective calendar year. Flowing and EBITDA multiples based on total gross potential consideration.
2) FCF for acquisition defined as Field Level EBITDA less CapEx from Williston acquisition assumed close on June 30, 2021 to end of 2024; based on strip prices on 4/29/2021.
3) Based on $745MM purchase price for Williston assets and assumes $481MM potential consideration for Permian divestiture (includes three $25MM contingency payments)
Accretive transactions and dedication to shareholder returns supports ~33% increase in dividend post closing to
$0.50/share ($2.00 annualized)1

A New Tomorrow, TodayNasdaq: OAS
Overview Pro Forma for Strategic Transactions
4
Williston Statistics
1) Acquisition data, including 1Q21 EBITDA, is based on internally generated estimates and has not been reviewed by an independent registered accounting firm. Production is reported on a two-stream basis for both Oasis and Acquisition. Adjustments for volumes
are netted down by 5.8Mbo/d and 7.2Mboe/d for Permian divestiture.
2) 1Q21 Adjusted EBITDA to Oasis is pro forma for Midstream Simplification.
3) Net Debt and PF Leverage exclude transaction costs, potential earn-out payments of $75MM, and customary adjustments to purchase prices.
4) Based on $745MM purchase price for Williston assets and assumes $481MM potential consideration for Permian divestiture (includes three $25MM contingency payments)
Wild
BasinSouth
Nesson
Indian
Hills
Painted
Woods
North
AlgerRed Bank
Cottonwood
Montana
Focus Area
New Focus Area
Long-term Upside
South
Antelope
Fort
Berthold
Oasis Acreage Position
Aligned and focused on driving value from expanded
position in top US Oil Basin
Combined transactions result in paying ~$264MM for
~$155MM of EBITDA (1.7x EBITDA)4
Deep, long-lived inventory position with top-tier economics
Company StatisticsOAS Acquisition1 Divestiture Pro Forma
1Q21 Total Oil Production (Mbo/d) 36.8 17.7 -5.8 48.7
1Q21 Total Production (Mboe/d) 57.2 27.0 -7.2 77.0
1Q21 Adjusted EBITDA2 ($MM) $135 $63 - $68 -$26 $171 - $176
Annualized Adjusted EBITDA ($MM) $540 $250 - $270 -$105 $685 - $705
Net Debt3 ($MM) -$106 $745 -$406 $233
Pro Forma Leverage3 ~0.3x
OAS Acquisition1 Pro Forma
Net Williston Acres (000s) 402 95 497
Held by Production 98% 99% 98%
Average Working Interest 73% 84% 76%
1Q21 Williston Oil Production (Mbo/d) 31.0 17.7 48.7
1Q21 Williston Production (Mboe/d) 50.0 27.0 77.0

A New Tomorrow, TodayNasdaq: OAS
Today’s Oasis has an industry
leading financial profile tailored to
the new environment. We are
focused on generating free cash
flow and delivering competitive
shareholder returns with our low-
cost assets.
Transforming into Dominant Williston Basin Pure Play
5
Best-in-class balance sheet (p. 6)
New business model focused on
returns (p. 8)
New board of directors, with
enhanced governance, aligned
with shareholders (p. 20)
Quality asset base delivering
significant free cash flow (p. 13)
Material Midstream value &
optionality (p. 15, 16)
Generate free cash flow and
competitive shareholder returns (p. 10)
Understanding the energy transition
and its opportunities
Embracing environmental, social and
governance initiatives (p. 9)
Alignment of management incentives (p. 21)
Consolidation to build scale and
relevance (p. 3)
Pro Forma WILLISTON BASIN497k Net Acres | 77.0Mboepd1
Exiting PERMIAN BASIN24k Net Acres | 7.2Mboepd1
1) Production as of 1Q21 for OAS and recent for acquisition
New Oasis New Environment
Williston Acquisition Furthers Strategy
A New Tomorrow, TodayNasdaq: OAS
0.30.4
1.1
1.5
2.02.2
2.3 2.42.5
3.2
3.6
0.0
0.5
1.0
1.5
2.0
2.5
3.0
3.5
4.0
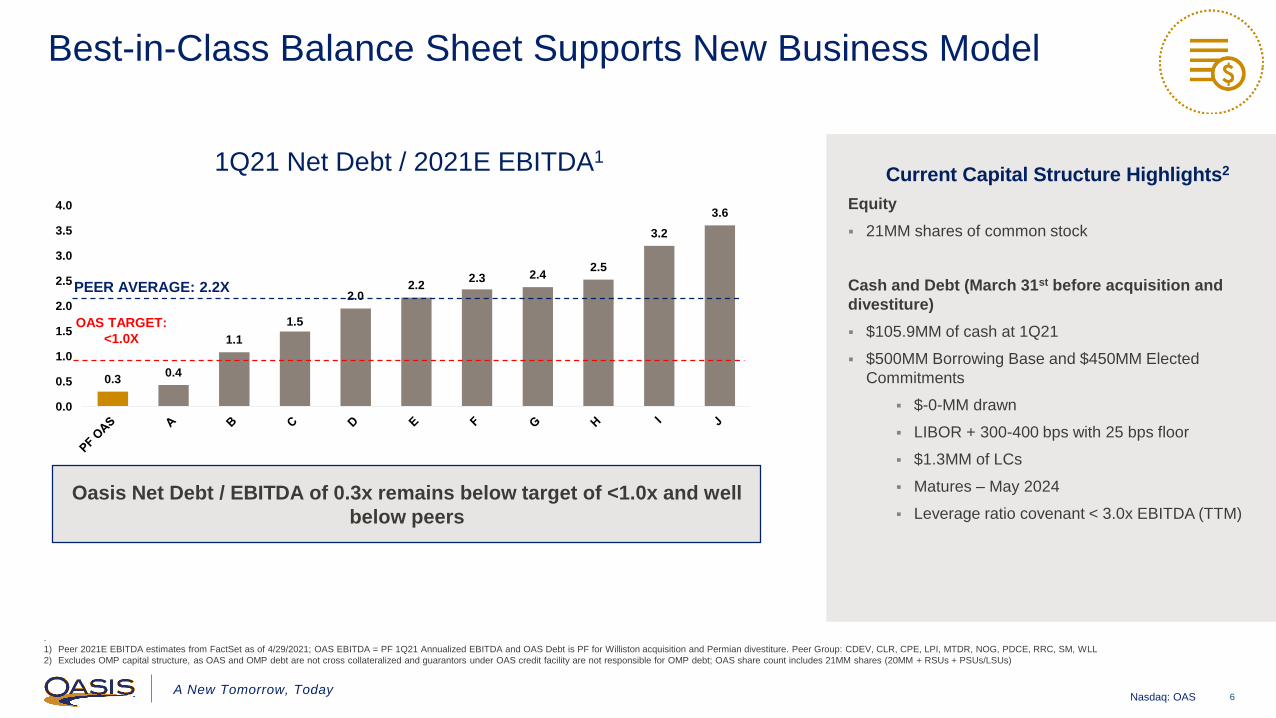
Best-in-Class Balance Sheet Supports New Business Model
6
.
1) Peer 2021E EBITDA estimates from FactSet as of 4/29/2021; OAS EBITDA = PF 1Q21 Annualized EBITDA and OAS Debt is PF for Williston acquisition and Permian divestiture. Peer Group: CDEV, CLR, CPE, LPI, MTDR, NOG, PDCE, RRC, SM, WLL
2) Excludes OMP capital structure, as OAS and OMP debt are not cross collateralized and guarantors under OAS credit facility are not responsible for OMP debt; OAS share count includes 21MM shares (20MM + RSUs + PSUs/LSUs)
1Q21 Net Debt / 2021E EBITDA1
PEER AVERAGE: 2.2X
Current Capital Structure Highlights2
Equity
21MM shares of common stock
Cash and Debt (March 31st before acquisition and
divestiture)
$105.9MM of cash at 1Q21
$500MM Borrowing Base and $450MM Elected
Commitments
$-0-MM drawn
LIBOR + 300-400 bps with 25 bps floor
$1.3MM of LCs
Matures – May 2024
Leverage ratio covenant < 3.0x EBITDA (TTM)
OAS TARGET:
<1.0X
Oasis Net Debt / EBITDA of 0.3x remains below target of <1.0x and well
below peers
A New Tomorrow, TodayNasdaq: OAS
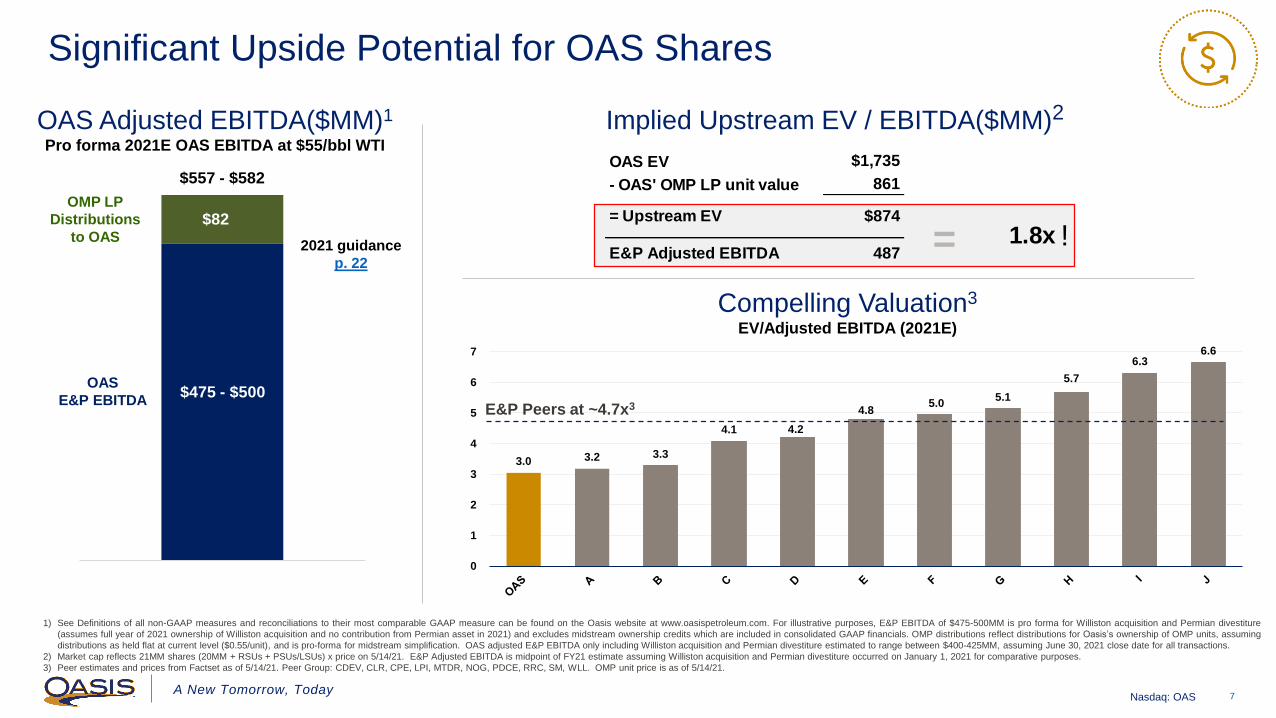
OAS EV $1,735
- OAS' OMP LP unit value 861
= Upstream EV $874
E&P Adjusted EBITDA 487 1.8x
3.0 3.2 3.3
4.1 4.2
4.8 5.0
5.1
5.7
6.3 6.6
0
1
2
3
4
5
6
7
2021E
OAS
E&P EBITDA
OMP LP
Distributions
to OAS
$557 - $582
$82
$475 - $500
7
Significant Upside Potential for OAS Shares
OAS Adjusted EBITDA($MM)1
Pro forma 2021E OAS EBITDA at $55/bbl WTI
1) See Definitions of all non-GAAP measures and reconciliations to their most comparable GAAP measure can be found on the Oasis website at www.oasispetroleum.com. For illustrative purposes, E&P EBITDA of $475-500MM is pro forma for Williston acquisition and Permian divestiture
(assumes full year of 2021 ownership of Williston acquisition and no contribution from Permian asset in 2021) and excludes midstream ownership credits which are included in consolidated GAAP financials. OMP distributions reflect distributions for Oasis’s ownership of OMP units, assuming
distributions as held flat at current level ($0.55/unit), and is pro-forma for midstream simplification. OAS adjusted E&P EBITDA only including Williston acquisition and Permian divestiture estimated to range between $400-425MM, assuming June 30, 2021 close date for all transactions.
2) Market cap reflects 21MM shares (20MM + RSUs + PSUs/LSUs) x price on 5/14/21. E&P Adjusted EBITDA is midpoint of FY21 estimate assuming Williston acquisition and Permian divestiture occurred on January 1, 2021 for comparative purposes.
3) Peer estimates and prices from Factset as of 5/14/21. Peer Group: CDEV, CLR, CPE, LPI, MTDR, NOG, PDCE, RRC, SM, WLL. OMP unit price is as of 5/14/21.
E&P Peers at ~4.7x3
Compelling Valuation3
EV/Adjusted EBITDA (2021E)
Implied Upstream EV / EBITDA($MM)2
=2021 guidance
p. 22
!
A New Tomorrow, TodayNasdaq: OAS
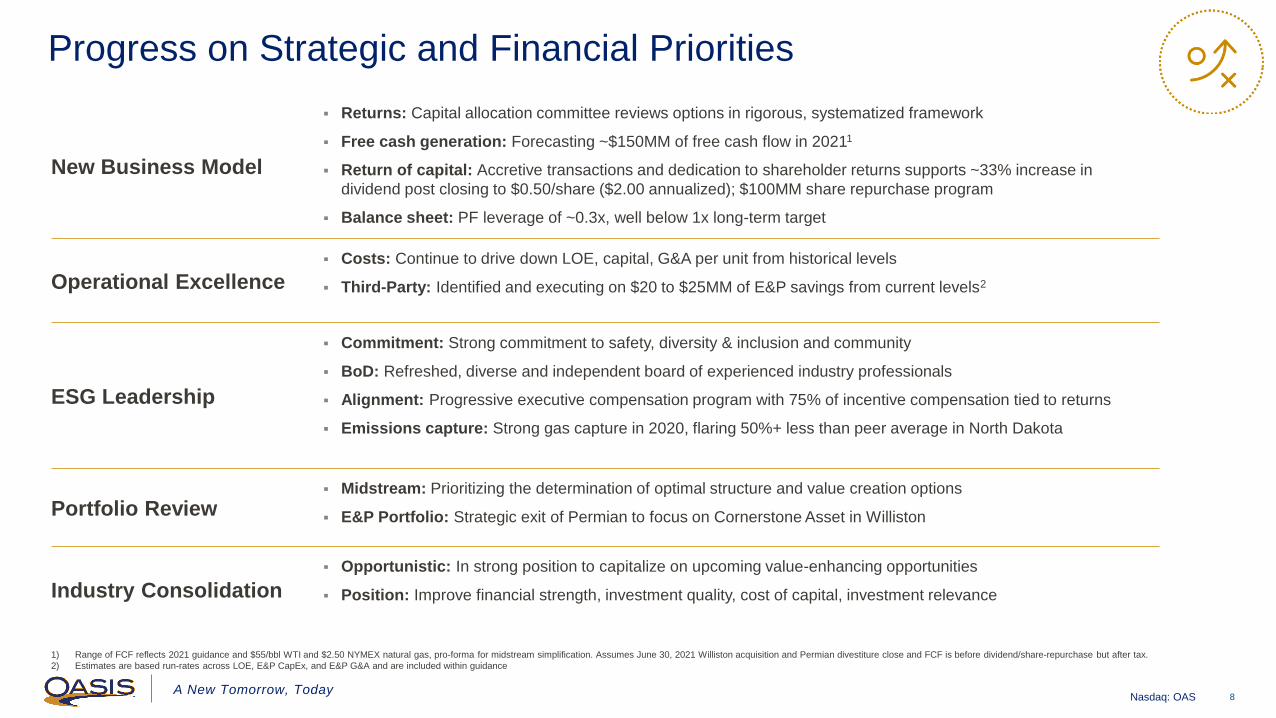
New Business Model
Returns: Capital allocation committee reviews options in rigorous, systematized framework
Free cash generation: Forecasting ~$150MM of free cash flow in 20211
Return of capital: Accretive transactions and dedication to shareholder returns supports ~33% increase in
dividend post closing to $0.50/share ($2.00 annualized); $100MM share repurchase program
Balance sheet: PF leverage of ~0.3x, well below 1x long-term target
Operational Excellence
Costs: Continue to drive down LOE, capital, G&A per unit from historical levels
Third-Party: Identified and executing on $20 to $25MM of E&P savings from current levels2
ESG Leadership
Commitment: Strong commitment to safety, diversity & inclusion and community
BoD: Refreshed, diverse and independent board of experienced industry professionals
Alignment: Progressive executive compensation program with 75% of incentive compensation tied to returns
Emissions capture: Strong gas capture in 2020, flaring 50%+ less than peer average in North Dakota
Portfolio Review Midstream: Prioritizing the determination of optimal structure and value creation options
E&P Portfolio: Strategic exit of Permian to focus on Cornerstone Asset in Williston
Industry Consolidation
Opportunistic: In strong position to capitalize on upcoming value-enhancing opportunities
Position: Improve financial strength, investment quality, cost of capital, investment relevance
Progress on Strategic and Financial Priorities
8
1) Range of FCF reflects 2021 guidance and $55/bbl WTI and $2.50 NYMEX natural gas, pro-forma for midstream simplification. Assumes June 30, 2021 Williston acquisition and Permian divestiture close and FCF is before dividend/share-repurchase but after tax.
2) Estimates are based run-rates across LOE, E&P CapEx, and E&P G&A and are included within guidance
A New Tomorrow, TodayNasdaq: OAS
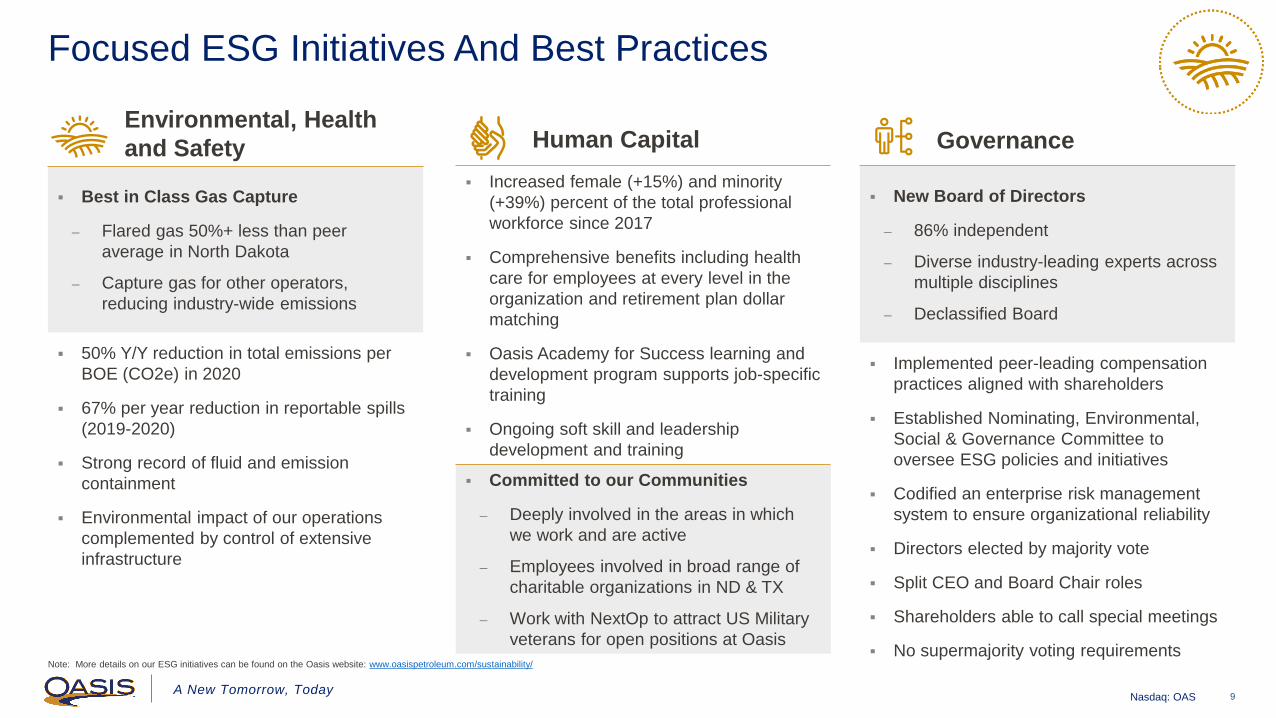
Focused ESG Initiatives And Best Practices
9
Note: More details on our ESG initiatives can be found on the Oasis website: www.oasispetroleum.com/sustainability/
Environmental, Health
and Safety
Best in Class Gas Capture
– Flared gas 50%+ less than peer
average in North Dakota
– Capture gas for other operators,
reducing industry-wide emissions
50% Y/Y reduction in total emissions per
BOE (CO2e) in 2020
67% per year reduction in reportable spills
(2019-2020)
Strong record of fluid and emission
containment
Environmental impact of our operations
complemented by control of extensive
infrastructure
Human Capital
Increased female (+15%) and minority
(+39%) percent of the total professional
workforce since 2017
Comprehensive benefits including health
care for employees at every level in the
organization and retirement plan dollar
matching
Oasis Academy for Success learning and
development program supports job-specific
training
Ongoing soft skill and leadership
development and training
Committed to our Communities
– Deeply involved in the areas in which
we work and are active
– Employees involved in broad range of
charitable organizations in ND & TX
– Work with NextOp to attract US Military
veterans for open positions at Oasis
Governance
New Board of Directors
– 86% independent
– Diverse industry-leading experts across
multiple disciplines
– Declassified Board
Implemented peer-leading compensation
practices aligned with shareholders
Established Nominating, Environmental,
Social & Governance Committee to
oversee ESG policies and initiatives
Codified an enterprise risk management
system to ensure organizational reliability
Directors elected by majority vote
Split CEO and Board Chair roles
Shareholders able to call special meetings
No supermajority voting requirements
A New Tomorrow, TodayNasdaq: OAS
21%
19%
15%
14%
11%
9% 9%
7% 7%
6%
4%4%
0%
5%
10%
15%
20%
25%
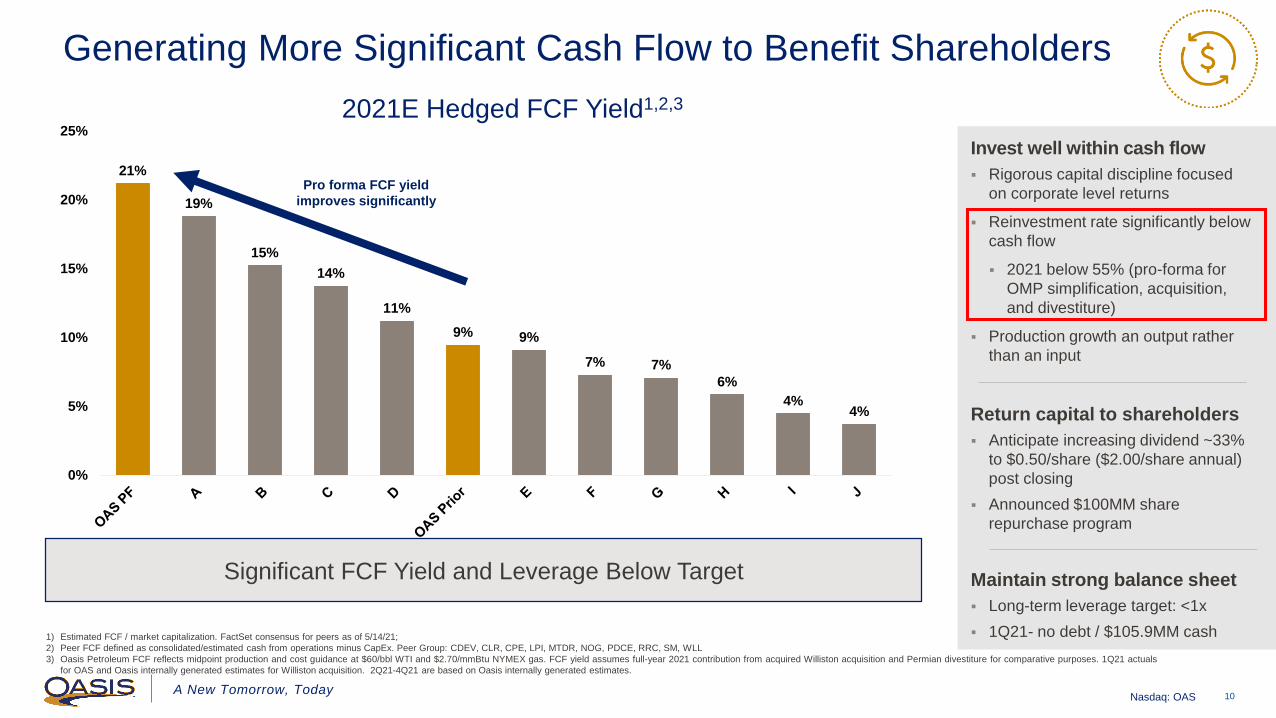
Significant FCF Yield and Leverage Below Target
10
Generating More Significant Cash Flow to Benefit Shareholders
1) Estimated FCF / market capitalization. FactSet consensus for peers as of 5/14/21;
2) Peer FCF defined as consolidated/estimated cash from operations minus CapEx. Peer Group: CDEV, CLR, CPE, LPI, MTDR, NOG, PDCE, RRC, SM, WLL
3) Oasis Petroleum FCF reflects midpoint production and cost guidance at $60/bbl WTI and $2.70/mmBtu NYMEX gas. FCF yield assumes full-year 2021 contribution from acquired Williston acquisition and Permian divestiture for comparative purposes. 1Q21 actuals
for OAS and Oasis internally generated estimates for Williston acquisition. 2Q21-4Q21 are based on Oasis internally generated estimates.
Invest well within cash flow
Rigorous capital discipline focused
on corporate level returns
Reinvestment rate significantly below
cash flow
2021 below 55% (pro-forma for
OMP simplification, acquisition,
and divestiture)
Production growth an output rather
than an input
Return capital to shareholders
Anticipate increasing dividend ~33%
to $0.50/share ($2.00/share annual)
post closing
Announced $100MM share
repurchase program
Maintain strong balance sheet
Long-term leverage target: <1x
1Q21- no debt / $105.9MM cash
2021E Hedged FCF Yield1,2,3
Pro forma FCF yield
improves significantly
A New Tomorrow, TodayNasdaq: OAS 11
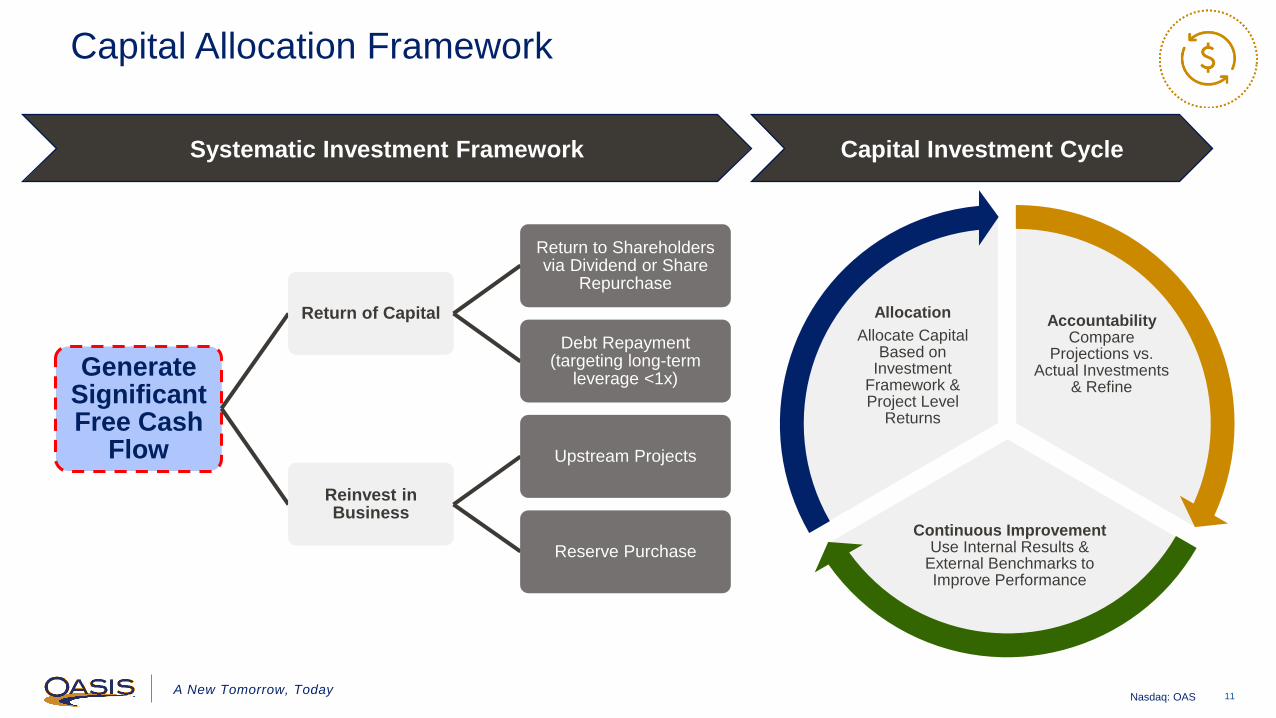
Capital Allocation Framework
Accountability Compare
Projections vs. Actual Investments
& Refine
Continuous ImprovementUse Internal Results &
External Benchmarks to Improve Performance
Allocation
Allocate Capital Based on
Investment Framework & Project Level
Returns
Systematic Investment Framework
Generate Significant Free Cash
Flow
Return of Capital
Return to Shareholders via Dividend or Share
Repurchase
Debt Repayment (targeting long-term
leverage <1x)
Reinvest in Business
Upstream Projects
Reserve Purchase
Capital Investment Cycle

A New Tomorrow, TodayNasdaq: OAS
$2.15
$1.40
$1.30
2020 Run Rate 4Q21 Run Rate
$10.50 $10.25
$9.25
Sep '20 Est for 2021 Current 2021Guidance
$585
$216
$230
$215
2020 Plan 2020 Actual 2021 Plan
Driving Better Margins And Increased Capital Productivity
12
1) E&P Costs do not include any benefit from midstream cash flows. Includes impact from Williston acquisition and Permian divestiture assuming both close on 6/30/21. See appendix for details.
2) Cash G&A excludes restructuring and professional fees as well as costs associated with RIFs
3) Reflects E&P & Other Capital (including Williston acquisition and Permian divestiture assuming close of 6/30/21). Other capital includes administrative capital, but excludes capitalized interest. E&P CapEx excludes acquisition and divestiture purchase/sale price.
4) Based on midpoint 4Q21 BOE guidance volumes
Improving E&P LOE per Boe1
PerformanceE&P Capital Budget Reductions
($MM)3
Proactive E&P Cash G&A Reductions2 ($ per Boe)
37%
~60%
7%
4

A New Tomorrow, TodayNasdaq: OAS
Bakken – Cornerstone Asset
13
1) Pro forma for recent acquisition
2) Percent operated is pro forma based on production (Acquisition is estimated to be 78% operated) and working interest is pro forma based on producing wells (Acquisition is estimated to be 84%).
Pure play operator with
contiguous core asset
Strong cash margins
One of the largest
producers and acreage
holders
Strong FCF from proven /
highly predictable asset
base
Peer leading well cost and
performance
Huge long-term upside
inventory
Competitive Advantages
A New Tomorrow, Today
497k Net Acres
77.0Mboepd1
87%
Operated2
76%Working
Interest2
Nasdaq: OAS
12+ Years of Top-Tier Inventory
Drives Sustainable Free Cash Flow Generation
Wild
BasinSouth
Nesson
Indian
Hills
Painted
Woods
North
Alger
Red Bank
Cottonwood
Montana
Focus Area
New Focus Area
Long-term Upside
South
Antelope
Fort
Berthold
A New Tomorrow, TodayNasdaq: OAS
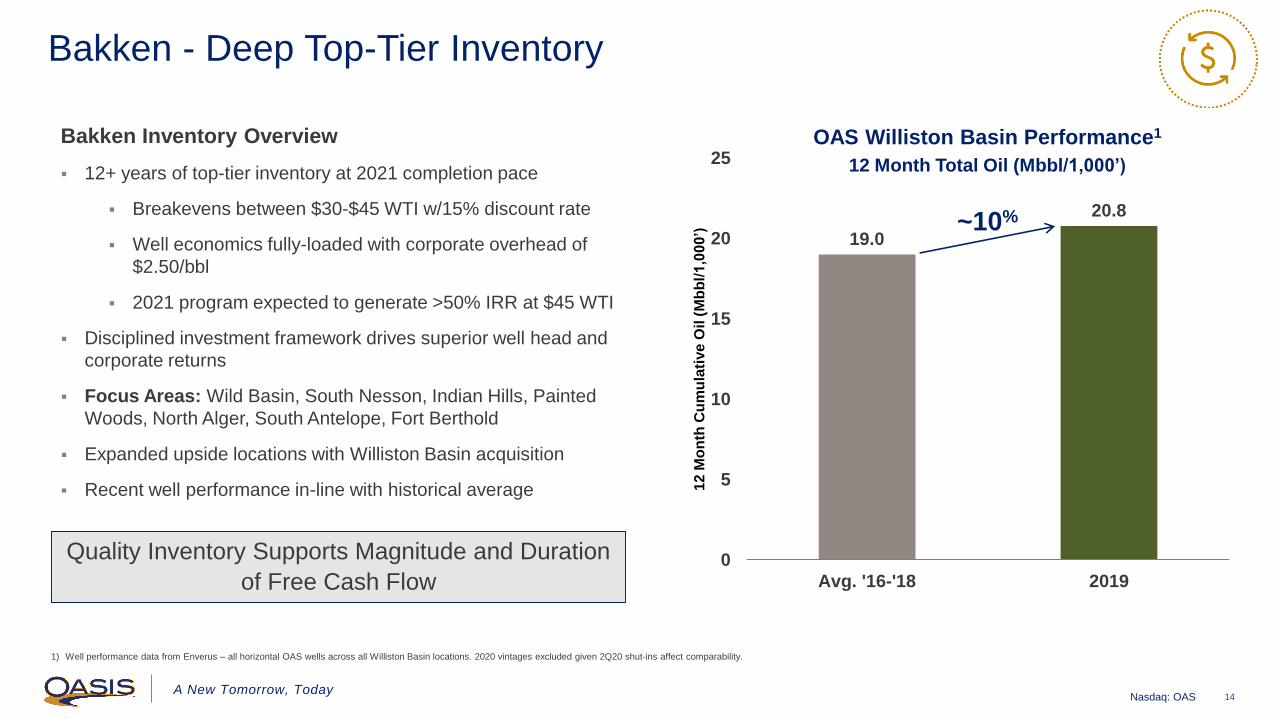
19.0
20.8
0
5
10
15
20
25
Avg. '16-'18 2019
Bakken - Deep Top-Tier Inventory
14
Bakken Inventory Overview
12+ years of top-tier inventory at 2021 completion pace
Breakevens between $30-$45 WTI w/15% discount rate
Well economics fully-loaded with corporate overhead of
$2.50/bbl
2021 program expected to generate >50% IRR at $45 WTI
Disciplined investment framework drives superior well head and
corporate returns
Focus Areas: Wild Basin, South Nesson, Indian Hills, Painted
Woods, North Alger, South Antelope, Fort Berthold
Expanded upside locations with Williston Basin acquisition
Recent well performance in-line with historical average
Quality Inventory Supports Magnitude and Duration
of Free Cash Flow
12 M
on
th C
um
ula
tive
Oil
(M
bb
l/1
,000
’)
1) Well performance data from Enverus – all horizontal OAS wells across all Williston Basin locations. 2020 vintages excluded given 2Q20 shut-ins affect comparability.
~10%
OAS Williston Basin Performance1
12 Month Total Oil (Mbbl/1,000’)

A New Tomorrow, TodayNasdaq: OAS 15
Midstream Simplification Created Significant Shareholder Value
1) Estimates reflect simplification transaction announced March 22, 2021
2) Simplification consideration at close included $231.5MM of cash and 14.8MM in OMP units, of which 155,780 are attributable to Class B Units
Simplification Highlights1
Cash Inflow & Debt Reduction
OAS received $231.5MM of cash before taxes and fees
1Q21 cash of $105.9MM and no borrowings
Transparency Improved
OAS midstream ownership now accounted for in OMP units
No longer need to model retained interests
Eliminated IDRs
OMP Ownership Increased
14.64MM units net issued to OAS in transaction2
OAS to own ~77.1% of OMP LP Units (68% prior)
Other Actions
$100MM Share Repurchase Program
Additional means to improve shareholder returns in addition
to existing annual dividend
Amended OAS Revolver
Increased flexibility around hedging
Increased ability to return cash to shareholders
Improved pricing
Midstream Optionality
Continue to evaluate alternatives to further enhance OAS
shareholder value

A New Tomorrow, TodayNasdaq: OAS
Midstream Position Generates FCF and Valuation Transparency
16
Oasis Midstream Partners (OMP) Position
Post simplification, Oasis’s significant midstream cash flow is
derived from OMP LP distributions
Significant (~77%1) ownership position in top tier midstream
company
OMP is a leading owner, developer, operator and acquirer of
a diversified portfolio of midstream assets in North America
Generates significant distributable cash flow with strong
coverage and balance sheet
Proven track record capturing third party customers with
strong backlog of new opportunities
OMP retains Panther DevCo in Permian with no contract
changes and expects incremental activity on asset from new
E&P operator
Continue to Evaluate Value Creation Options
1) Ownership is updated for simplification
OMP Capital
StructureUnits (MM) % of Total
2021 Distribution
per Unit
2021E PF
Distribution
($MM)
Public Units 11.2 22.9% 24.4
OAS Units 37.5 77.1% $2.19 82.1
Total Units 48.6 100.0% 106.5
OMP Distributions

A New Tomorrow, TodayNasdaq: OAS
A Stronger Oasis Aligned with Shareholder Interests
17
Best-in-Class
Balance Sheet
Returns-Focused
Business Model
High Quality Assets
Generating Significant
Free Cash Flow
ESG Leadership
Strong Strategic
Direction Aligned
with Shareholders
New CEO with
the Right Team
to Execute

A New Tomorrow, TodayNasdaq: OAS
Appendix
18
A New Tomorrow, TodayNasdaq: OAS
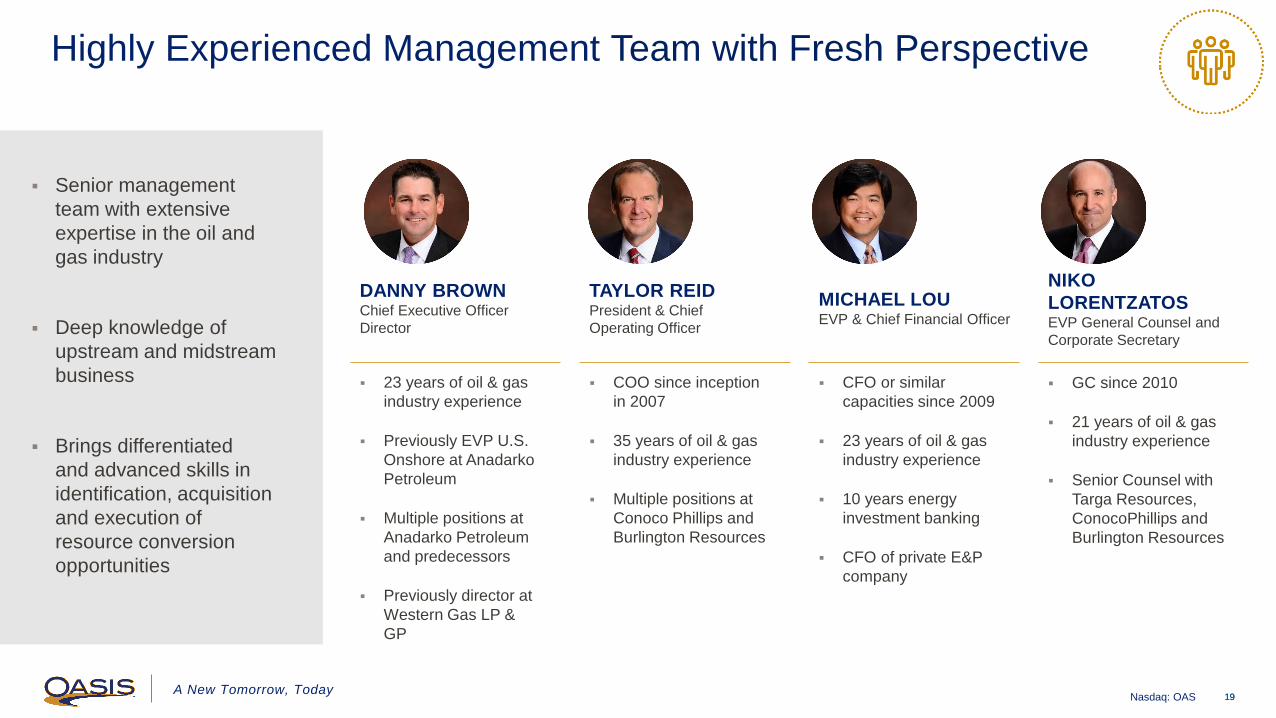
Highly Experienced Management Team with Fresh Perspective
1919
Senior management
team with extensive
expertise in the oil and
gas industry
Deep knowledge of
upstream and midstream
business
Brings differentiated
and advanced skills in
identification, acquisition
and execution of
resource conversion
opportunities
DANNY BROWNChief Executive Officer
Director
23 years of oil & gas
industry experience
Previously EVP U.S.
Onshore at Anadarko
Petroleum
Multiple positions at
Anadarko Petroleum
and predecessors
Previously director at
Western Gas LP &
GP
TAYLOR REIDPresident & Chief
Operating Officer
COO since inception
in 2007
35 years of oil & gas
industry experience
Multiple positions at
Conoco Phillips and
Burlington Resources
MICHAEL LOUEVP & Chief Financial Officer
CFO or similar
capacities since 2009
23 years of oil & gas
industry experience
10 years energy
investment banking
CFO of private E&P
company
NIKO
LORENTZATOSEVP General Counsel and
Corporate Secretary
GC since 2010
21 years of oil & gas
industry experience
Senior Counsel with
Targa Resources,
ConocoPhillips and
Burlington Resources

A New Tomorrow, TodayNasdaq: OAS
Board Driving Our Strategic Plan
20
Douglas E. Brooks
Daniel E.Brown
Samantha F. Holroyd
John D. Jacobi
N. John Lancaster, Jr.
Robert J. McNally
Cynthia L.Walker
OAS Roles / Committees1
Board Chair Director Chair of NESG;
A&R1
Chair of Comp;
NESG
Comp;
NESG
A&R;
Comp
Chair of A&R;
NESG
Industry Leadership - Marathon Oil
- Energy XXI
- Yates Petroleum
- Aurora Oil & Gas
- Anadarko - Golden Advisors
- Lantana Energy
- TPG Sixth Street
- Denham
- Royal Dutch Shell
- Javelin Energy
- Jacobi-Johnson
- Covey Park
- CEO Venado Oil &
Gas
- Oyster Creek
- Riverstone
- CSFB
- EQT
- EQM Midstream
- Precision Drilling
- Warrior Energy
- Simmons & Co
- Occidental
- Goldman Sachs
Current and Previous Board(s)
- California Resources
- Chaparral Energy
- Madalena Energy
- Energy XXI
- Yates
- Aurora Oil & Gas
- Beacon Offshore
- Western Midstream
- Guidon Energy
- Gulfport Energy - Pioneer Energy
Resources
- Comstock Resources
- Liberty Oilfield
- Magellan Midstream
- Cobalt International
- Warrior Energy
- Dalbo Holdings
- EQT
- Summit Midstream
- Sempra Energy
Current or past publiccompany CEO or C-suite
✓ ✓ ✓ ✓ ✓
E&P/Midstream Operations ✓ ✓ ✓ ✓ ✓ ✓ ✓
Capital Allocation/Investment ✓ ✓ ✓ ✓ ✓ ✓ ✓
Environmental, health and safety management
✓ ✓ ✓ ✓ ✓
Mergers and acquisitions ✓ ✓ ✓ ✓ ✓ ✓ ✓
Independent,
experienced and
aligned with
shareholders
86% Independent
Board provides
an updated perspective
29% of directors are
women
Average of 30+ years of industry experience
Leadership roles across
upstream, midstream,
oil services, investing,
banking, advising and
finance
1) NSEG - Nominating, Environmental, Social & Governance Committee, A&R – Audit and Reserves. Comp – Compensation
A New Tomorrow, TodayNasdaq: OAS
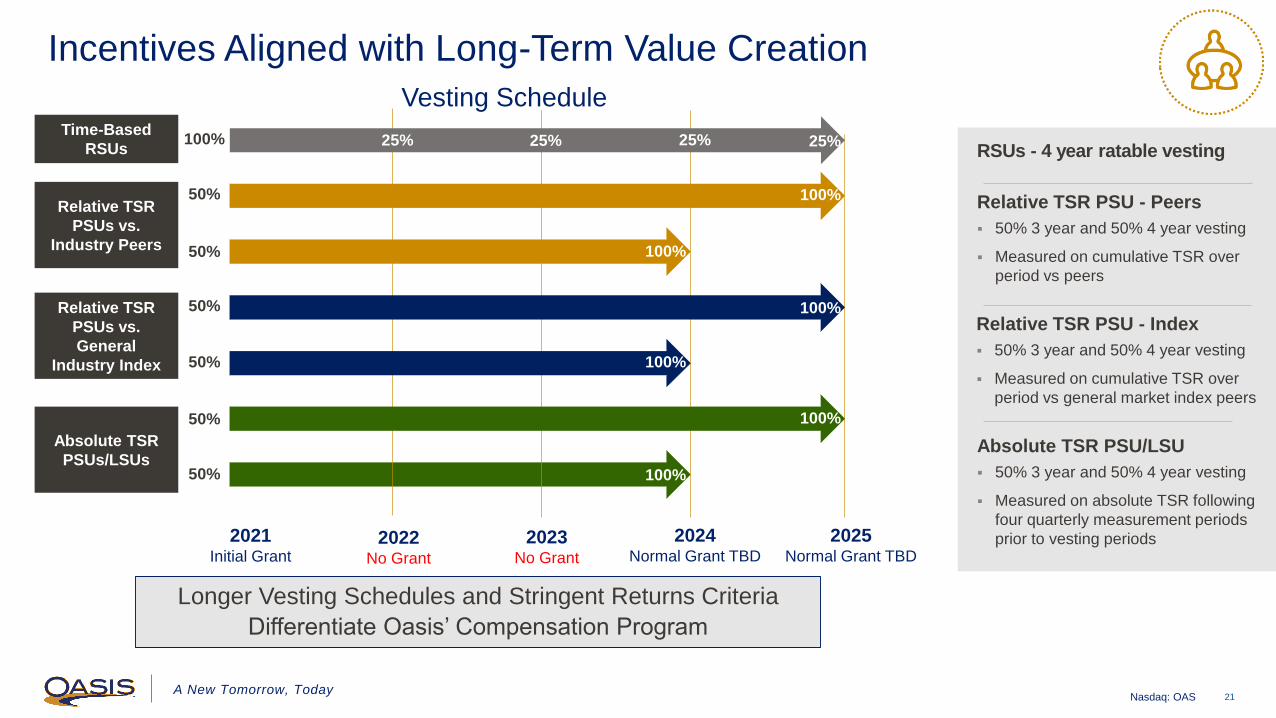
Incentives Aligned with Long-Term Value Creation
21
Longer Vesting Schedules and Stringent Returns Criteria
Differentiate Oasis’ Compensation Program
2021Initial Grant
2025Normal Grant TBD
2024Normal Grant TBD
2023No Grant
2022No Grant
25% 25% 25% 25%Time-Based
RSUs
Relative TSR
PSUs vs.
Industry Peers
Relative TSR
PSUs vs.
General
Industry Index
Absolute TSR
PSUs/LSUs
Relative TSR PSU - Peers
50% 3 year and 50% 4 year vesting
Measured on cumulative TSR over
period vs peers
Absolute TSR PSU/LSU
50% 3 year and 50% 4 year vesting
Measured on absolute TSR following
four quarterly measurement periods
prior to vesting periods
RSUs - 4 year ratable vesting
Relative TSR PSU - Index
50% 3 year and 50% 4 year vesting
Measured on cumulative TSR over
period vs general market index peers
100%
100%
100%
100%
100%
100%
Vesting Schedule
50%
50%
50%
50%
50%
50%
100%

A New Tomorrow, TodayNasdaq: OAS
2021 Guidance ($MM except per unit)
22
OMP Cash Flow Attributable to OAS
OMP Capital
StructureMM
2021
Distribution
per Unit
2021E PF
Distribution
($MM)
Public Units 11.2 $24.4
OAS Units 37.5 $2.19 $82.1
Total Units 48.6 $106.5
1) Updated full year guidance assuming June 30, 2021 close of Williston acquisition and primary Permian divestiture transaction. Smaller Permian divestiture packages impact 2Q21 volumes, which have been reduced to take transactions into consideration
2) Cash taxes reflects $50–$60/bbl WTI, $2.50/mmBtu NYMEX gas, 2Q21 guidance reflects expected cash taxes to be paid for 1H21 and includes approximately $6MM in cash taxes associated with the Midstream Simplification.
OAS E&P Metrics FY20211 2Q21
Oil Volumes (Mbbl/d) 41.5 - 43.5 33.0 - 35.0
Total Volumes (Mboe/d) 63.5 - 66.5 51.5 - 54.5
Oil Differential per Bbl $1.75 - $2.75 $1.75 - $2.75
Gas realization (% NYMEX) 120% 125%
LOE per Boe $9.25 - $10.25 $10.50 - $11.50
GP&T per Boe $4.10 - $4.40 $3.75 - $4.00
E&P cash G&A ($MM) $42.0 - $45.0 $9.5 - $11.5
Production taxes 7.4% - 7.6% 7.1% - 7.3%
E&P CapEx ($MM) $215 - $230 $75 - $90
Cash Interest ($MM) $21 - $24 $2.0 - $4.0
Cash Taxes ($MM)2 $15 - $29 $19 - $23
4Q21 highlights:
• Oil volumes: 49.5-51.5Mbbl/d
• Total volumes: 74.5-77.5Mboe/d
• G&A: $1.30-$1.40 per boe
A New Tomorrow, TodayNasdaq: OAS
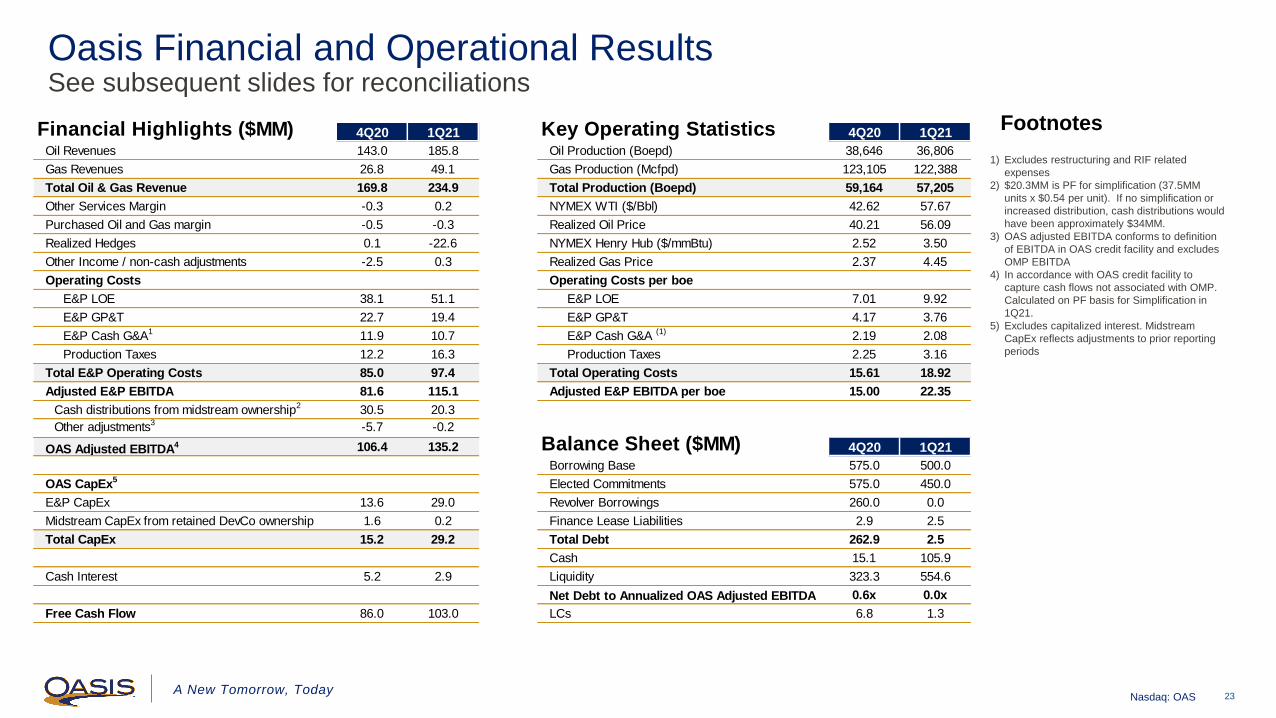
Oasis Financial and Operational ResultsSee subsequent slides for reconciliations
23
1) Excludes restructuring and RIF related
expenses
2) $20.3MM is PF for simplification (37.5MM
units x $0.54 per unit). If no simplification or
increased distribution, cash distributions would
have been approximately $34MM.
3) OAS adjusted EBITDA conforms to definition
of EBITDA in OAS credit facility and excludes
OMP EBITDA
4) In accordance with OAS credit facility to
capture cash flows not associated with OMP.
Calculated on PF basis for Simplification in
1Q21.
5) Excludes capitalized interest. Midstream
CapEx reflects adjustments to prior reporting
periods
Footnotes4Q20 1Q21 4Q20 1Q21
Oil Revenues 143.0 185.8 Oil Production (Boepd) 38,646 36,806
Gas Revenues 26.8 49.1 Gas Production (Mcfpd) 123,105 122,388
Total Oil & Gas Revenue 169.8 234.9 Total Production (Boepd) 59,164 57,205
Other Services Margin -0.3 0.2 NYMEX WTI ($/Bbl) 42.62 57.67
Purchased Oil and Gas margin -0.5 -0.3 Realized Oil Price 40.21 56.09
Realized Hedges 0.1 -22.6 NYMEX Henry Hub ($/mmBtu) 2.52 3.50
Other Income / non-cash adjustments -2.5 0.3 Realized Gas Price 2.37 4.45
Operating Costs Operating Costs per boe
E&P LOE 38.1 51.1 E&P LOE 7.01 9.92
E&P GP&T 22.7 19.4 E&P GP&T 4.17 3.76
E&P Cash G&A1
11.9 10.7 E&P Cash G&A (1)
2.19 2.08
Production Taxes 12.2 16.3 Production Taxes 2.25 3.16
Total E&P Operating Costs 85.0 97.4 Total Operating Costs 15.61 18.92
Adjusted E&P EBITDA 81.6 115.1 Adjusted E&P EBITDA per boe 15.00 22.35
Cash distributions from midstream ownership2
30.5 20.3
Other adjustments3
-5.7 -0.2
OAS Adjusted EBITDA4 106.4 135.2 4Q20 1Q21
Borrowing Base 575.0 500.0
OAS CapEx5
Elected Commitments 575.0 450.0
E&P CapEx 13.6 29.0 Revolver Borrowings 260.0 0.0
Midstream CapEx from retained DevCo ownership 1.6 0.2 Finance Lease Liabilities 2.9 2.5
Total CapEx 15.2 29.2 Total Debt 262.9 2.5
Cash 15.1 105.9
Cash Interest 5.2 2.9 Liquidity 323.3 554.6
Net Debt to Annualized OAS Adjusted EBITDA 0.6x 0.0x
Free Cash Flow 86.0 103.0 LCs 6.8 1.3
Balance Sheet ($MM)
Financial Highlights ($MM) Key Operating Statistics
A New Tomorrow, TodayNasdaq: OAS
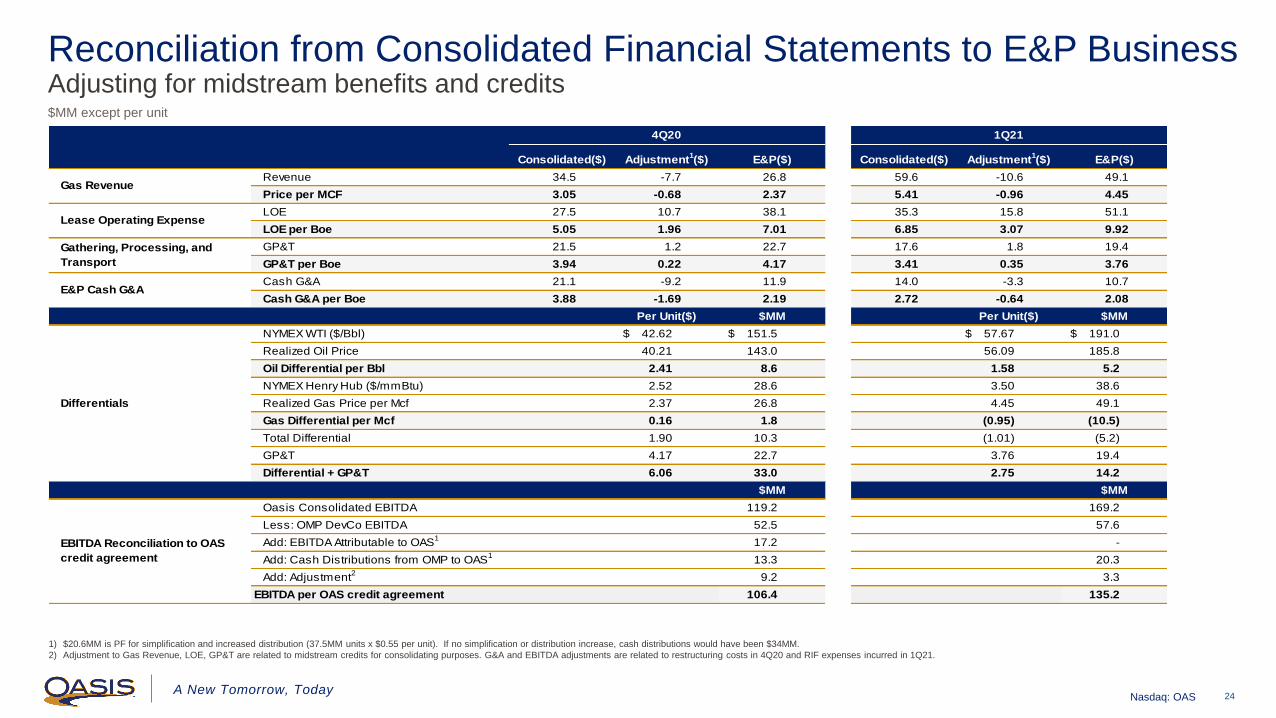
Reconciliation from Consolidated Financial Statements to E&P BusinessAdjusting for midstream benefits and credits
24
1) $20.6MM is PF for simplification and increased distribution (37.5MM units x $0.55 per unit). If no simplification or distribution increase, cash distributions would have been $34MM.
2) Adjustment to Gas Revenue, LOE, GP&T are related to midstream credits for consolidating purposes. G&A and EBITDA adjustments are related to restructuring costs in 4Q20 and RIF expenses incurred in 1Q21.
$MM except per unit
Consolidated($) Adjustment1($) E&P($) Consolidated($) Adjustment
1($) E&P($)
Revenue 34.5 -7.7 26.8 59.6 -10.6 49.1
Price per MCF 3.05 -0.68 2.37 5.41 -0.96 4.45
LOE 27.5 10.7 38.1 35.3 15.8 51.1
LOE per Boe 5.05 1.96 7.01 6.85 3.07 9.92
GP&T 21.5 1.2 22.7 17.6 1.8 19.4
GP&T per Boe 3.94 0.22 4.17 3.41 0.35 3.76
Cash G&A 21.1 -9.2 11.9 14.0 -3.3 10.7
Cash G&A per Boe 3.88 -1.69 2.19 2.72 -0.64 2.08
Per Unit($) $MM Per Unit($) $MM
NYMEX WTI ($/Bbl) $ 42.62 $ 151.5 $ 57.67 $ 191.0
Realized Oil Price 40.21 143.0 56.09 185.8
Oil Differential per Bbl 2.41 8.6 1.58 5.2
NYMEX Henry Hub ($/mmBtu) 2.52 28.6 3.50 38.6
Realized Gas Price per Mcf 2.37 26.8 4.45 49.1
Gas Differential per Mcf 0.16 1.8 (0.95) (10.5)
Total Differential 1.90 10.3 (1.01) (5.2)
GP&T 4.17 22.7 3.76 19.4
Differential + GP&T 6.06 33.0 2.75 14.2
$MM $MM
Oasis Consolidated EBITDA 119.2 169.2
Less: OMP DevCo EBITDA 52.5 57.6
Add: EBITDA Attributable to OAS1
17.2 -
Add: Cash Distributions from OMP to OAS1
13.3 20.3
Add: Adjustment2
9.2 3.3
EBITDA per OAS credit agreement 106.4 135.2
E&P Cash G&A
Differentials
EBITDA Reconciliation to OAS
credit agreement
1Q214Q20
Gas Revenue
Lease Operating Expense
Gathering, Processing, and
Transport

A New Tomorrow, TodayNasdaq: OAS
Predecessor Successor Non- GAAP1
10/1/20-11/19/20 11/19/20-12/31/20 4Q20 Combined
Oil Revenues 73.9 69.1 143.0
Gas Revenues 17.1 17.4 34.5
Total Oil & Gas Revenue 91.0 86.4 177.5
Other Services Margin -0.5 0.2 -0.3
Purchased Oil and Gas margin -1.4 -0.1 -1.5
Realized Hedges 0.0 0.1 0.1
Other Income / non-cash adjustments -2.1 -0.4 -2.5
Operating Costs
E&P LOE 9.6 17.8 27.5
E&P GP&T 12.4 9.1 21.5
E&P Cash G&A 9.1 12.0 21.1
Production Taxes 6.3 5.9 12.2
Total E&P Operating Costs 37.5 44.8 82.3
OAS CapEx2
E&P CapEx -1.4 15.0 13.6
Midstream CapEx from retained DevCos 0.5 0.4 0.9
Total CapEx -0.9 15.4 14.5
Cash Interest 3.2 2.0 5.2
Consolidated EBITDA 64.1 55.1 119.2
Select Consolidated Financial Statistics
4Q20 Consolidated Financial Metrics ($MM)
25
1) On November 19, 2020 (the “Emergence Date”) Oasis emerged from voluntary bankruptcy under
Chapter 11 of the Bankruptcy Code. Beginning on the Emergence Date, the Company applied
fresh start accounting, which resulted in a new basis of accounting, and became a new entity for
financial reporting purposes. As a result of the application of fresh start accounting and the
effects of the implementation of the Company’s Chapter 11 plan of reorganization, the
consolidated financial statements after November 19, 2020 are not comparable with the
consolidated financial statements on or prior to that date. References to “Successor” refer to the
Oasis entity after emergence from bankruptcy on the Emergence Date. References to
“Predecessor” refer to the Oasis entity prior to emergence from bankruptcy. References to
“Successor Period” refer to the period from November 20, 2020 through December 31, 2020.
Although GAAP requires that we report on results for the Successor Period and the Current
Predecessor Quarter separately, the Company’s operating results are displayed for the three
months ended December 31, 2020 by combining the results of the applicable Predecessor and
Successor period in order to provide the most meaningful comparison of the Company’s current
results to prior periods. Accordingly, references to “4Q20 Combined” refer to the three months
ended December 31, 2020.
2) Negative amount reflects differences between the estimated capital expenditures accrued in a
reporting period and actual capital expenditures recognized in a subsequent reporting period.

A New Tomorrow, TodayNasdaq: OAS
Bighorn Bobcat Beartooth Panther Total
Gross Operating Income 16.9$ 23.5$ 7.1$ 1.2$ 48.7$
Gross Depreciation 2.5$ 4.0$ 2.3$ 0.2$ 9.0$
Gross Midstream EBITDA 19.4$ 27.5$ 9.4$ 1.4$ 57.7$
OMP Ownership (b/f simplification) 100% 35% 70% 100%
Net OMP EBITDA 19.4$ 9.8$ 6.6$ 1.4$ 37.2$
OMP Ownership (PF simplification) 100% 100% 100% 100%
OMP EBITDA 19.4$ 27.5$ 9.4$ 1.4$ 57.7$
less: Cash PubCo Expenses 1.2
PF OMP EBITDA (net of PubCo expenses) 56.5$
less: Cash interest 11.0
less: PF Maintenance CapEx 0.3
Distributable Cash Flow 45.2$
Declared Distribution - LP 26.7
Coverage 1.7x
Guided Coverage (Implied) 1.4x
Net Debt to annualized PF 1Q21 EBITDA 3.0x
Oasis and OMP Financial Highlights
26
1) Debt is calculated in accordance with respective credit facility definitions, which were modified with simplification amendments. OAS and OMP debt are not cross collateralized and guarantors under OAS credit facility are not responsible for OMP debt.
2) Pro Forma include cash interest associated with $450MM bond at 8% for the entire quarter.
OAS & OMP Leverage ($MM)1 OMP Financial Highlights – 1Q21 PF Actuals ($MM)2
OAS Hedging Program (05/19/2021)
OAS (E&P) OMP
Borrowing Base/Capacity 500.0 450.0
Elected Commitments 450.0 450.0
Revolver Borrowings 0.0 234.0
Bonds 0.0 450.0
Finance Lease Liabilities 2.5 0.6
Total Debt 2.5 684.6
Cash 105.9 7.2
Liquidity 554.6 217.7
Net Debt -103.4 677.4
Net Debt to Annualized Adjusted EBITDA 0.0x 3.0x
LCs 1.3 5.5
Revolving Credit Facility
WTI Oil Hedging 2Q21 2H21 1H22 2H22 1H23 2H23
Swap volume (mbopd) 29.0 29.0 19.0 19.0 14.0 14.0
Swap price $42.09 $42.09 $50.00 $50.00 $50.00 $50.00
2-way collar volume (mbopd) 8.0 15.0 12.0 12.0 12.0
Floor price $51.25 $49.00 $50.00 $45.00 $45.00
Ceiling price $68.24 $66.28 $66.90 $64.88 $64.88
HH Gas Hedging 2Q21 2H21 1H22 2H22 1H23 2H23
Swap volume (MMBtu/d) 40,000 40,000 30,000
Swap price $2.84 $2.84 $2.82

A New Tomorrow, TodayNasdaq: OAS27
Contact Information
Oasis
1001 Fannin Street, Suite 1500
Houston, Texas, 77002
Main: (281) 404-9500
Owner Relations (Toll Free): (855) 209-8370
Investor Relations:
Danny Brown (CEO)
Michael Lou (CFO)
Bob Bakanauskas (Director, IR)
(281) 404-9600
www.OasisPetroleum.com
27