Building a Comprehensive Picture of Stellar Evolution
56
Building a Comprehensive Picture of Stellar Evolution Natalie M. Gosnell Assistant Professor, Colorado College September 28, 2018 St. Olaf College Physics Colloquium AIDA: R. Chromik
Transcript of Building a Comprehensive Picture of Stellar Evolution
Building a Comprehensive Picture of Stellar Evolution
Natalie M. Gosnell Assistant Professor, Colorado College
September 28, 2018 St. Olaf College
Physics Colloquium
AIDA: R. Chromik

What am I going to talk about today?
A large fraction of stars don’t evolve as they “should”
N. M. Gosnell September 28, 2018
Current understanding of stellar evolution is incomplete, so we need observations to improve our models
Blue straggler stars provide the largest handle on this population of stars
My work on mass transfer formation of blue straggler stars with the Hubble Space Telescope is helping fill in the gaps

Open clusters are the ideal laboratory for studying stellar evolution
APOD
Group of hundreds to thousands of stars • born at the same time • made from the same
material • all at the same distance
Jewel Box Cluster (NGC 4755)
N. M. Gosnell September 28, 2018

VLT Telescopes, ESO/Y. Beletsky
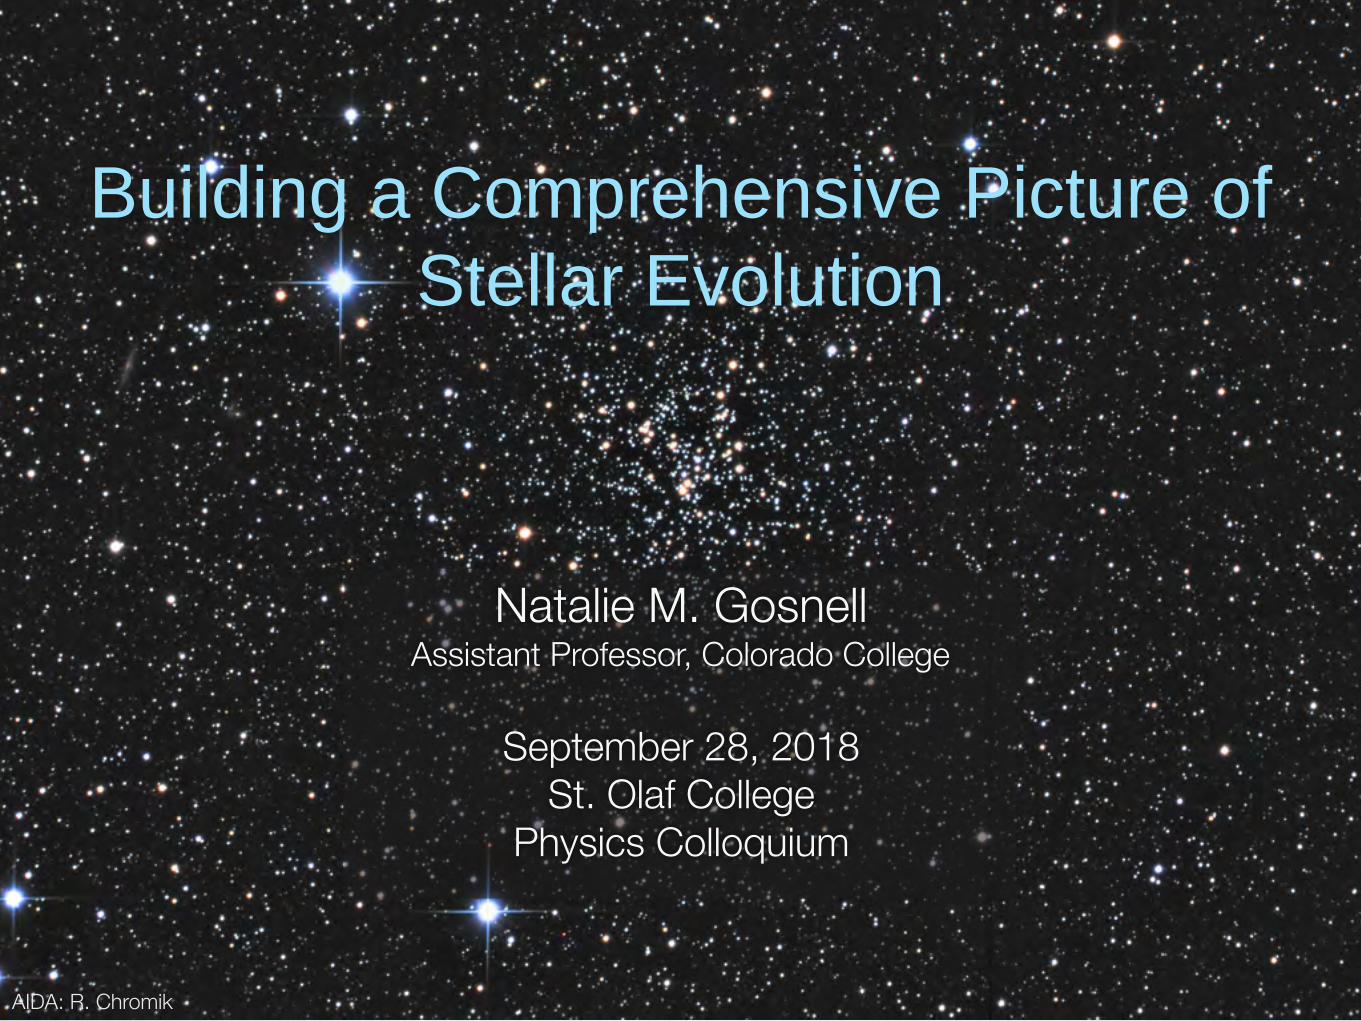
Open clusters exist in the disk of our galaxy
N. M. Gosnell September 28, 2018
NGC 6819
DSS
APOD
NGC 290
www.robgendlerastropics.com
NGC 188
Open clusters exist in the disk of our galaxyM67
Xanadu Observatory
VLT Telescopes, ESO/Y. Beletsky
N. M. Gosnell September 28, 2018

Created by A. Geller, Northwestern University
N. M. Gosnell September 28, 2018
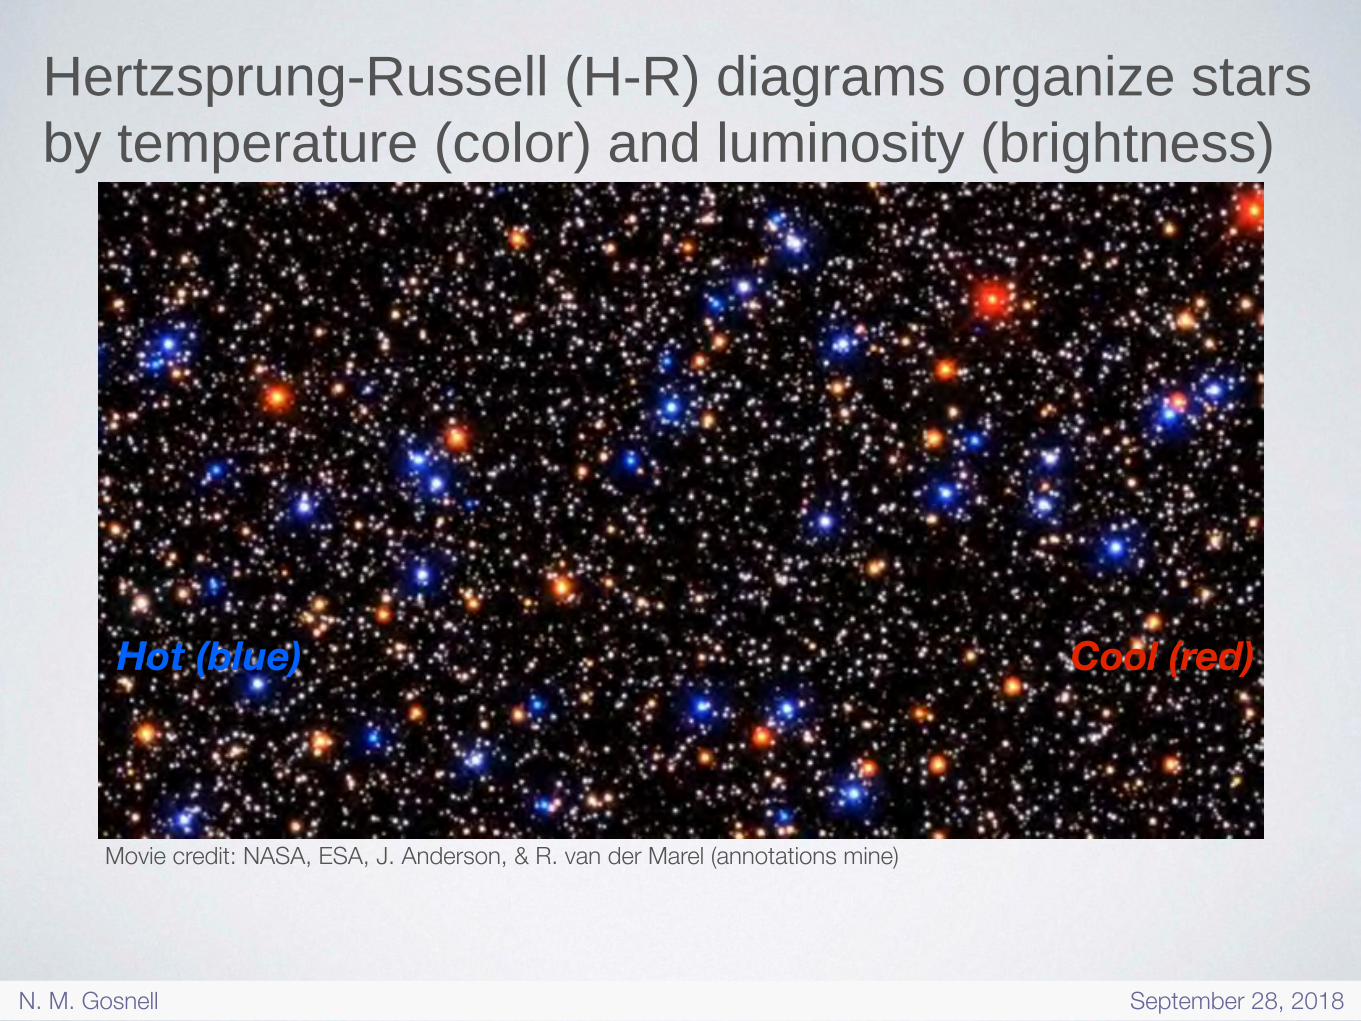
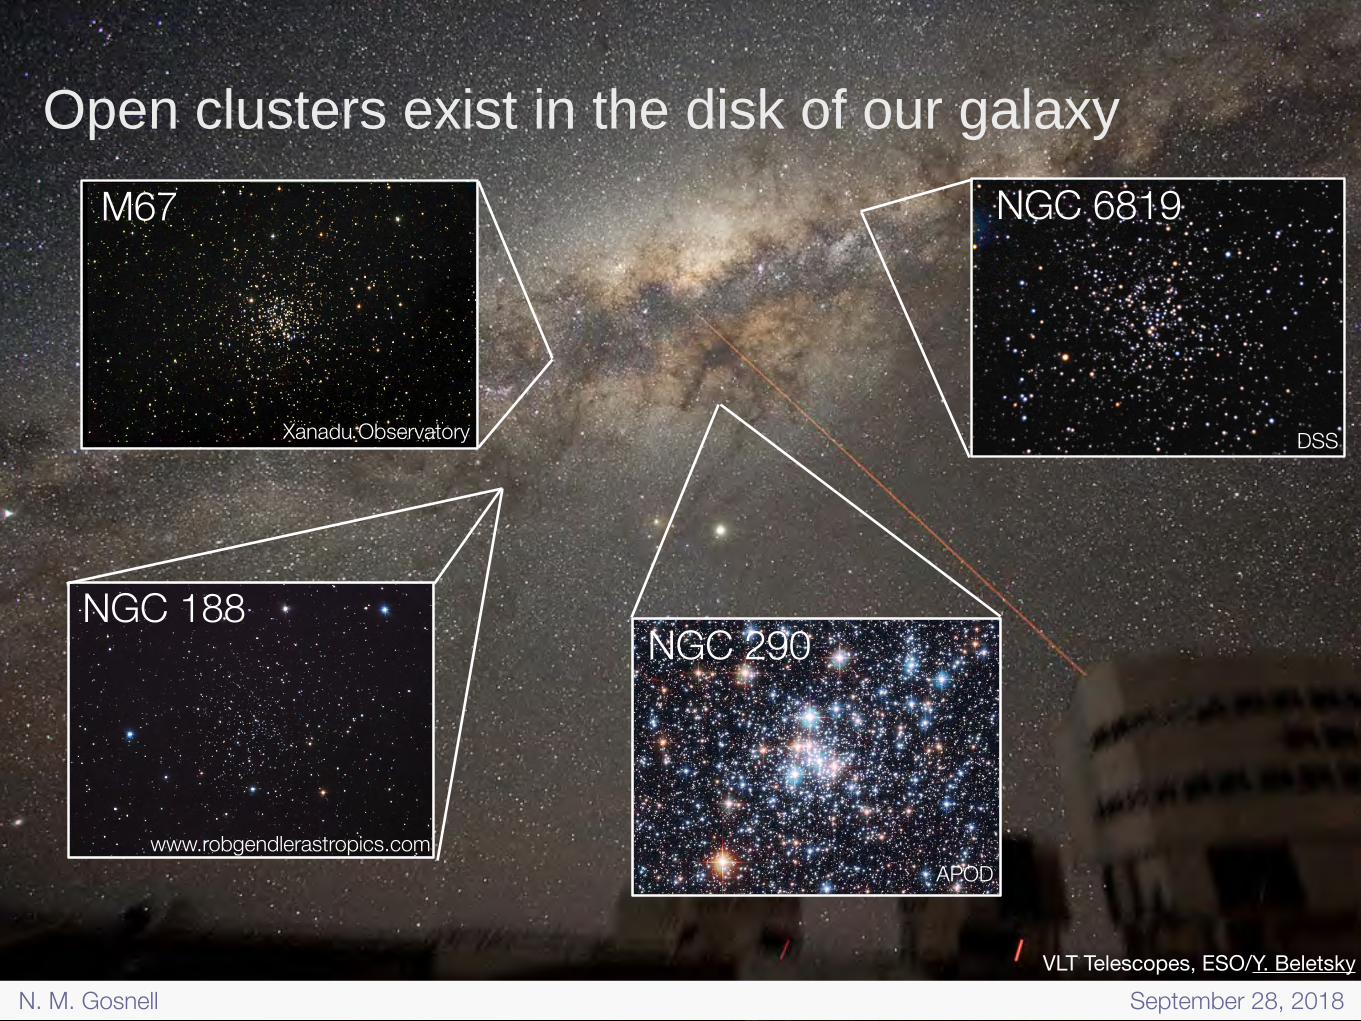
Hot (blue) Cool (red)
Hertzsprung-Russell (H-R) diagrams organize stars by temperature (color) and luminosity (brightness)
Movie credit: NASA, ESA, J. Anderson, & R. van der Marel (annotations mine)
N. M. Gosnell September 28, 2018

Hertzsprung-Russell (H-R) diagrams organize stars by temperature (color) and luminosity (brightness)
Hot (blue) Cool (red)
faint (small)
Bright (large)
Movie credit: NASA, ESA, J. Anderson, & R. van der Marel (annotations mine)
N. M. Gosnell September 28, 2018

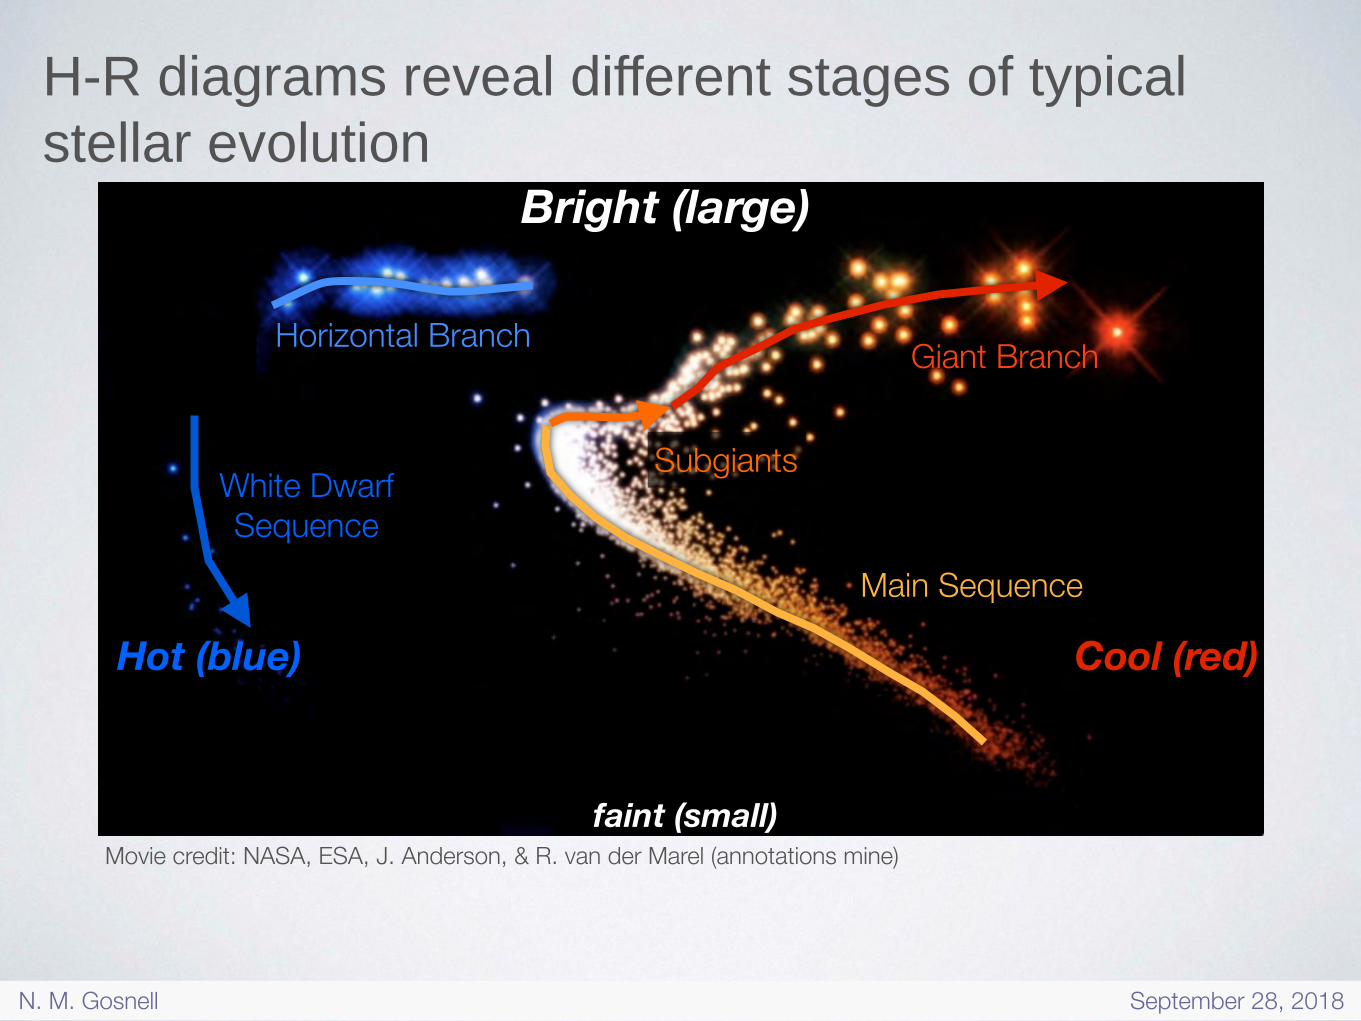
H-R diagrams reveal different stages of typical stellar evolution
Main Sequence
faint (small)
Bright (large)
Hot (blue) Cool (red)
Subgiants
Giant BranchHorizontal Branch
Movie credit: NASA, ESA, J. Anderson, & R. van der Marel (annotations mine)
White Dwarf Sequence
N. M. Gosnell September 28, 2018
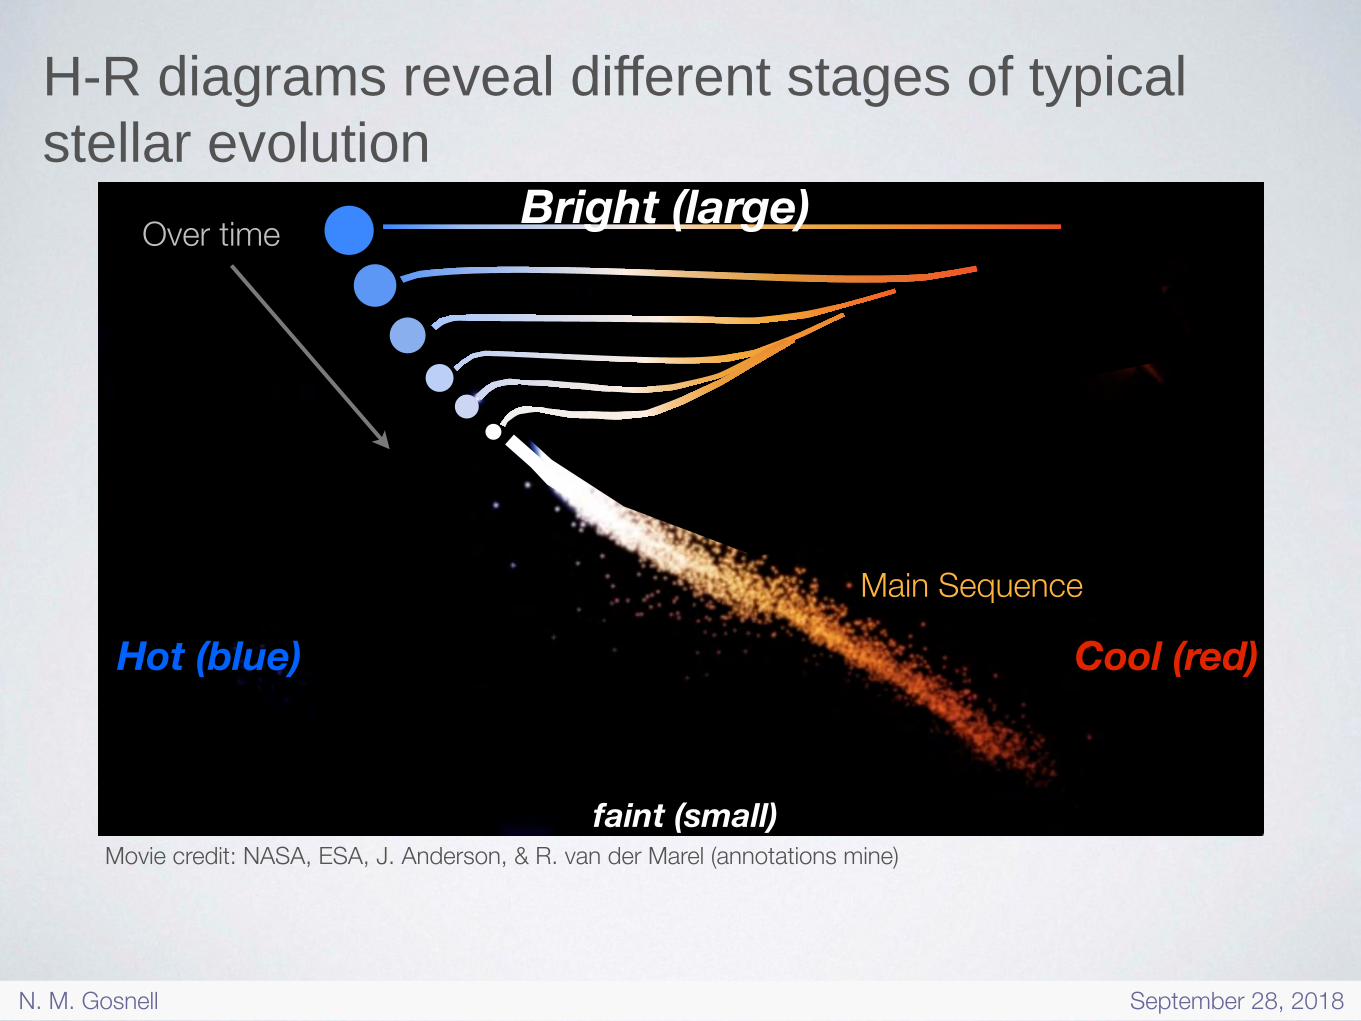
H-R diagrams reveal different stages of typical stellar evolution
Main Sequence
Over time
faint (small)
Bright (large)
Hot (blue) Cool (red)
Movie credit: NASA, ESA, J. Anderson, & R. van der Marel (annotations mine)
N. M. Gosnell September 28, 2018
H-R diagrams reveal different stages of typical stellar evolution
Main Sequence
Subgiants
Giant Branch
faint (small)
Bright (large)
Hot (blue) Cool (red)
White Dwarf Sequence
Horizontal Branch
Movie credit: NASA, ESA, J. Anderson, & R. van der Marel (annotations mine)
N. M. Gosnell September 28, 2018

H-R diagrams reveal different stages of typical stellar evolution
Main Sequence
Subgiants
Giant Branch
faint (small)
Bright (large)
Hot (blue) Cool (red)
White Dwarf Sequence
We have reliable models for how a single star will evolve
Horizontal Branch
Movie credit: NASA, ESA, J. Anderson, & R. van der Marel (annotations mine)
N. M. Gosnell September 28, 2018
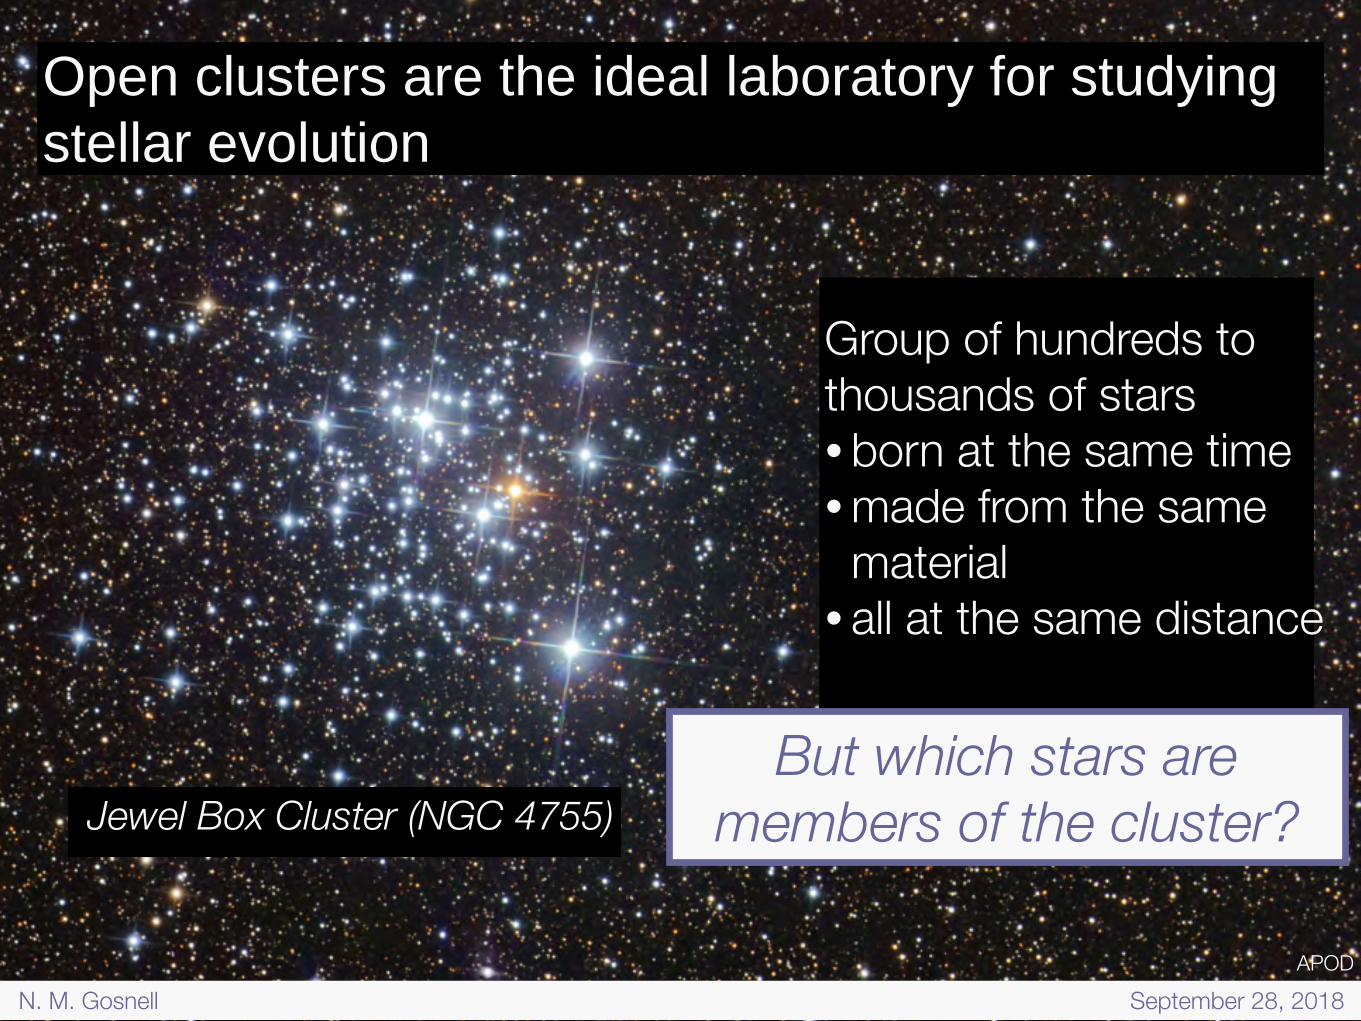
Open clusters are the ideal laboratory for studying stellar evolution
APOD
Group of hundreds to thousands of stars • born at the same time • made from the same
material • all at the same distance
Jewel Box Cluster (NGC 4755)But which stars are
members of the cluster?
N. M. Gosnell September 28, 2018

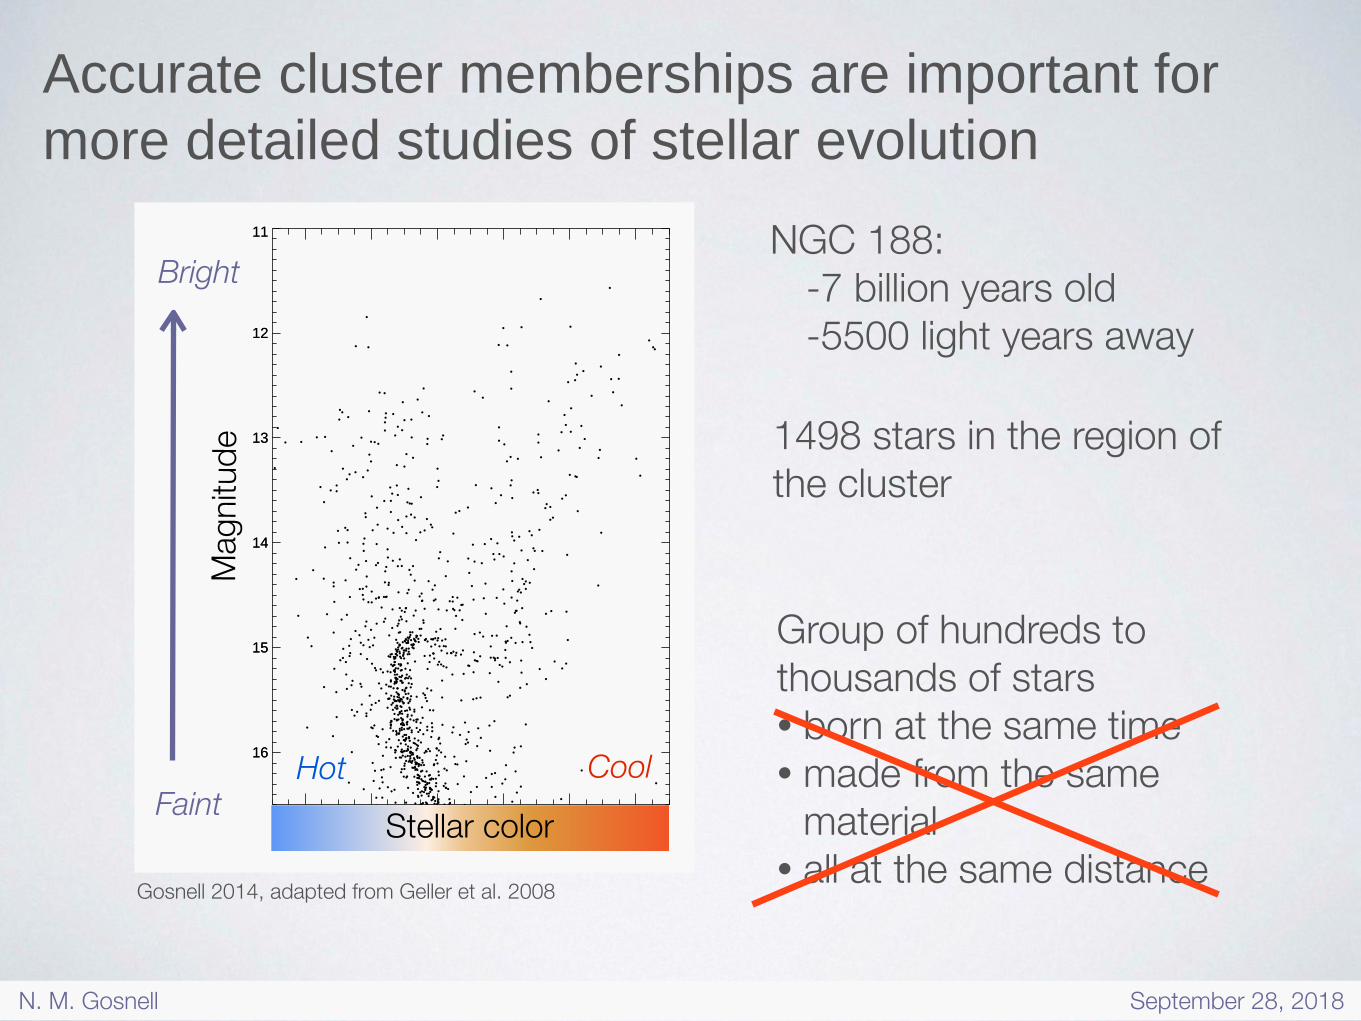
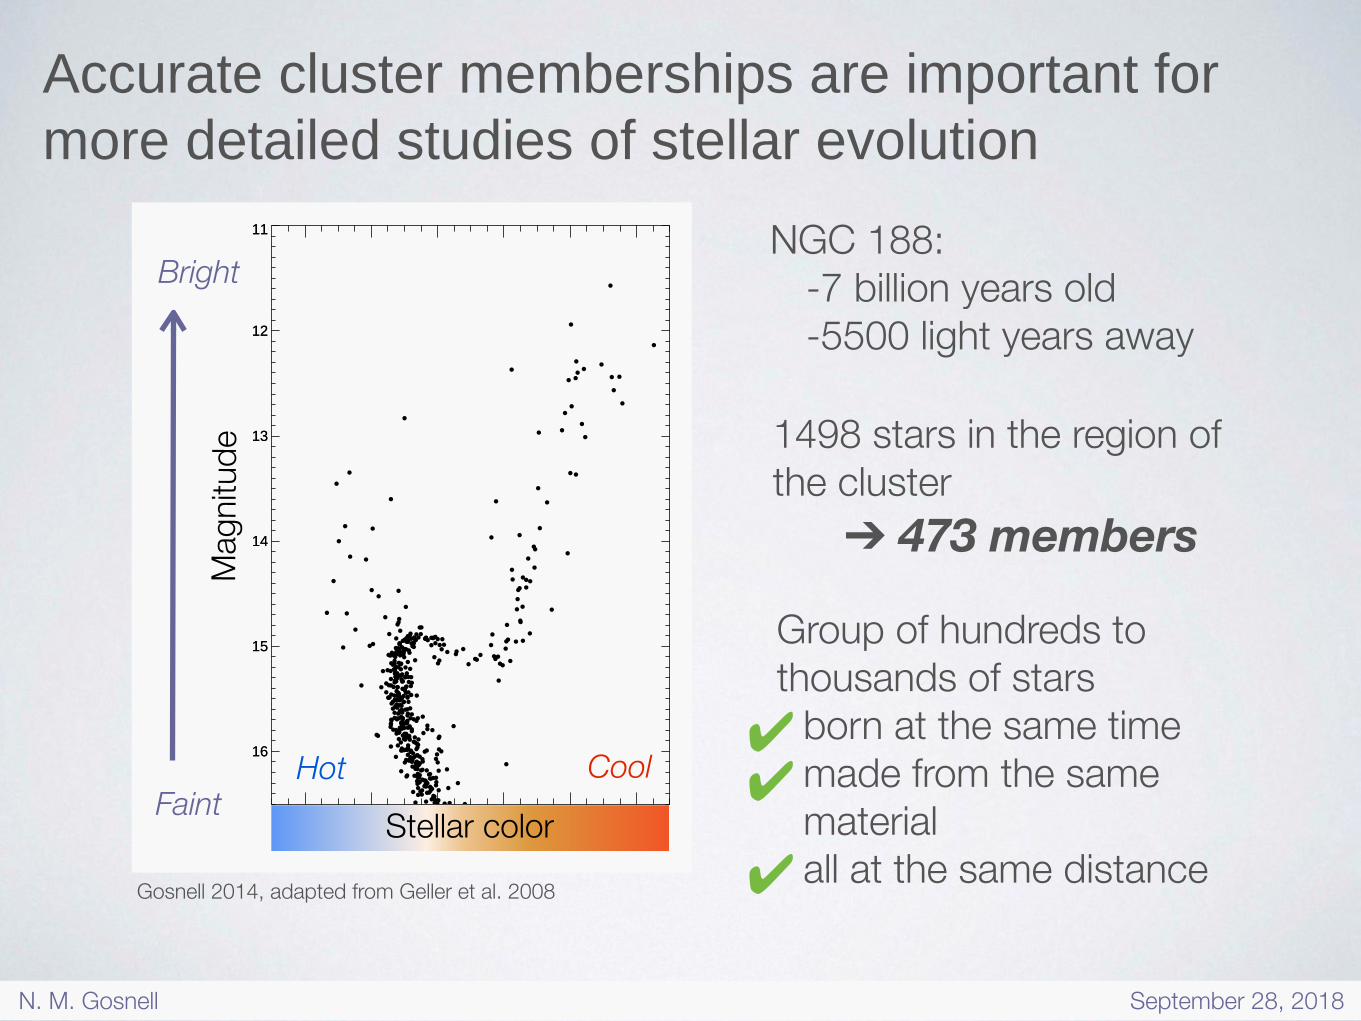
Accurate cluster memberships are important for more detailed studies of stellar evolution
NGC 188: -7 billion years old -5500 light years away
0.4 0.6 0.8 1.0 1.2 1.4
16
15
14
13
12
11
0.4 0.6 0.8 1.0 1.2 1.4B - V
16
15
14
13
12
11V
Stellar color
Bright
Faint
Mag
nitud
e 1498 stars in the region of the cluster
Group of hundreds to thousands of stars • born at the same time • made from the same
material • all at the same distance
Hot Cool
Gosnell 2014, adapted from Geller et al. 2008
N. M. Gosnell September 28, 2018
Group of hundreds to thousands of stars • born at the same time • made from the same
material • all at the same distance
Accurate cluster memberships are important for more detailed studies of stellar evolution
0.4 0.6 0.8 1.0 1.2 1.4
16
15
14
13
12
11
0.4 0.6 0.8 1.0 1.2 1.4B - V
16
15
14
13
12
11V
Stellar color
Bright
Faint
Mag
nitud
eNGC 188:
-7 billion years old -5500 light years away
1498 stars in the region of the cluster
Hot Cool
Gosnell 2014, adapted from Geller et al. 2008
N. M. Gosnell September 28, 2018
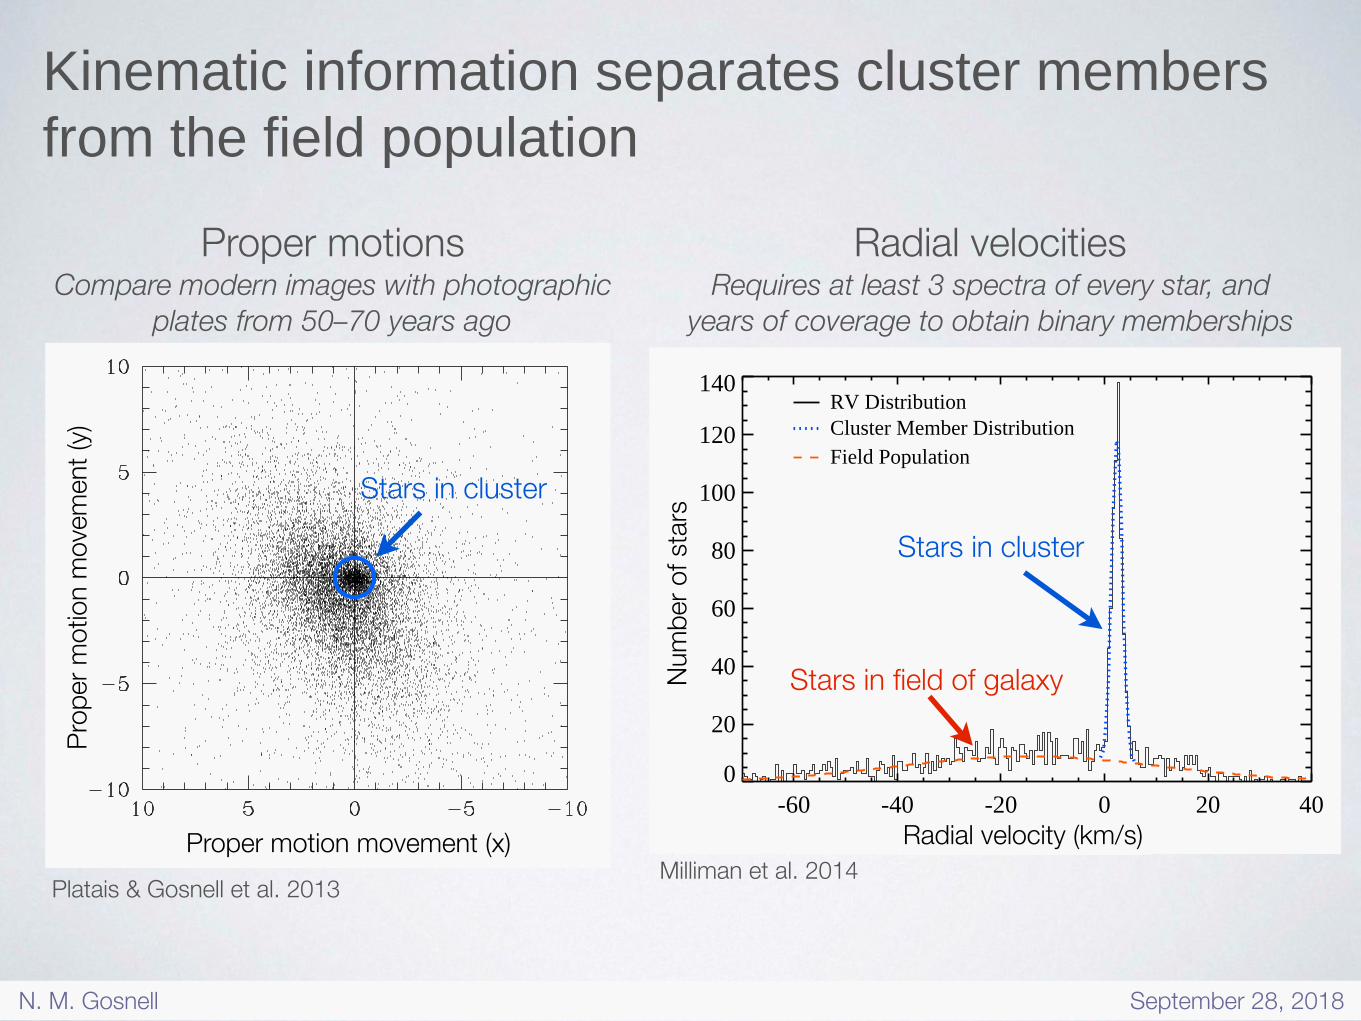
Kinematic information separates cluster members from the field population
The Astronomical Journal, 148:38 (20pp), 2014 August Milliman et al.
0 5 10 15 20 25 30Radius (arcmin)
0
20
40
60
80
100
Com
plet
enes
s (%
)
11 12 13 14 15 16V
0
20
40
60
80
100
Com
plet
enes
s (%
)
Figure 4. Percentage of stars in our sample that have three or more RV observations and either no Pµ information or a Pµ ! 4% with respect to distance from thecluster center (left) and V magnitude (right).
-60 -40 -20 0 20 40RV (km/s)
0
20
40
60
80
100
120
140
Num
ber o
f Obj
ects
RV DistributionCluster Member DistributionField Population
Figure 5. Histogram of the RV distribution of single stars, e/i < 4, withthree or more RV observations. Also plotted are the Gaussian distributionssimultaneously fit to the cluster, the large peak at a mean velocity of 2.4 km s−1
(blue dotted line), and the field (orange dashed line).(A color version of this figure is available in the online journal.)
because they require better observing conditions (clearer skies,dimmer moon, etc.) and longer exposures to meet our signal-to-noise requirements.
4.4. RV Membership Probabilities
The RV membership probability of a given star, PRV, listedin Table 2 is calculated using the equation:
PRV (v) = Fcluster(v)Ffield(v) + Fcluster(v)
, (3)
where Fcluster and Ffield are separate Gaussian functions fit to thecluster and field-star populations using our sample of single starswith three or more RV observations (Figure 5). The parametersfor these Gaussian fits are shown in Table 3. With the observationand completion of more single stars these values have shiftedonly slightly from the numbers published in Hole et al. (2009)and we continue to use the membership threshold of PRV ! 50%adopted by Hole et al. (2009) to identify cluster members. We
Table 3Gaussian Fit Parameters for Cluster and Field RV Distributions
Parameter Cluster Field
Ampl. (number) 112.99 8.81RV (km s−1) 2.45 −14.59σ (km s−1) 1.02 25.79
Table 4Number of Stars Within Each Classification
Classification N Stars
SM 566SN 1381BM 93BN 79BLM 20BLN 172BU 22U 1562
estimate from the cluster and field Gaussian functions a field starcontamination of 13% at this membership threshold (Figure 5).Interestingly, using Pµ < 4% as a criterion for non-membership,we find a field-star contamination of 12% ± 2% among starswith PRV ! 50%.
4.5. Membership Classification of Stars
Stars in our RV survey of NGC 6819 can fall into one of eightdifferent membership classifications determined by membershipprobability, number of observations, and variability. The numberof stars in each membership classification is listed in Table 4. Forsingle stars and velocity variable stars without completed orbitalsolutions we calculate PRV from the mean velocity, RV, and forbinary stars with completed orbital solutions we use the center-of-mass velocity, γ , from the orbital solution. For stars withoutPµ information, membership is determined by PRV alone.
Single member (SM). Stars that have e/i < 4, PRV ! 50%,and Pµ ! 4%.
Single non-member (SN). Stars that have e/i < 4, and PRV <50% or Pµ < 4%.
6
Milliman et al. 2014
Proper motions Compare modern images with photographic
plates from 50–70 years ago
Radial velocities Requires at least 3 spectra of every star, and
years of coverage to obtain binary memberships
The Astronomical Journal, 146:43 (12pp), 2013 August Platais et al.
Table 4A Sample of the Catalog of Positions and Proper Motions in NGC 6819
ID R.A. (J2000) Decl. (J2000) g′ g′ − r ′ µxa µy
a σµxa σµy
a σesta Pµ
b Xtc Yt
c Platesd ndele
155298 294.890863 39.818837 14.272 0.510 10.61 9.19 0.75 0.75 0.75 0 −19.908 −22.605 00001 0159195 294.936317 39.821684 13.905 1.128 7.55 0.39 0.82 0.82 0.82 0 −17.812 −22.444 00001 0160120 295.124249 39.822393 16.125 1.336 −10.94 −0.75 0.70 0.70 0.70 0 −9.151 −22.430 00001 0162002 295.053344 39.823850 15.594 0.799 6.94 −4.22 0.70 0.70 0.70 0 −12.418 −22.334 00001 0162175 294.948913 39.823970 15.238 0.425 6.30 −1.14 0.70 0.70 0.70 0 −17.231 −22.309 00001 0
Notes.a Units in mas yr−1.b Proper-motion membership probability in percent.c Tangential coordinates in arcmin with zeropoint at the center of NGC 6819.d Encoded number of plates, tuuvz, where t is McDonald; uu is Yale; v is Hale; z is Mt. Wilson (see Table 1).e Number of rejected datasets.
(This table is available in its entirety in machine-readable and Virtual Observatory (VO) forms in the online journal. A portion is shown here for guidance regardingits form and content.)
Figure 3. Vector-point diagram in the area of NGC 6819. A tight clumpat µx = µy = 0.0 mas yr−1 indicates the location of cluster members, closelysurrounded by a slightly offset and slanted distribution of field stars.
stars, Φf , which adequately represent the chosen local sample.The parameters of these distributions can be estimated in situand prior to calculating:
Pµ = Φc
Φc + Φf
. (3)
For technical details, we refer the reader to Kozhurina-Plataiset al. (1995) and Platais et al. (2003). There are, however, acouple of simplifications in the case of NGC 6819. In terms ofradial distance, the entire inner area of r < 10′ was consideredas a local sample for all targets within this area. For the outerarea with r > 10′, membership probabilities were calculated forstars with g′ < 17 and their local sample confined to the outerarea. In both cases we used a 2 mag window, centered on thetarget’s magnitude, to constrain the local sample. Thus, a localsample can include around one hundred stars up to more than onethousand, depending on target’s spatial location and brightness.The division of the inner and outer local samples is dictated bya sharp decrease in the accuracies of proper motions beyondr = 10′ and a reduced limiting magnitude (see Table 1). Priorto finding the distribution parameters, the VPD was rotated by
Figure 4. Distribution of Pµ as a function of magnitude. The decline ofmaximum Pµ toward fainter magnitudes is a consequence of steadily growingluminosity function of field stars and an increase of proper motion errors. Atg′ > 20.5 the separation between the cluster and field stars is poor and that isindicated by a flat and unrealistically high distribution of Pµ. The secondarydistribution peaking at g′ ∼16 (max Pµ = 63%) is for the stars outside theradius r = 10′.
−30◦ to align the field distribution along the R.A. and decl. axes.At g′ = 16, the center of field-star distribution in the VPD is only0.8 mas yr−1 away from the center of the cluster distribution.The corresponding Gaussian dispersions are 2.5 mas yr−1 forfield stars along the minor axis and 3.6 mas yr−1 along themajor axis, but only 0.4 mas yr−1 in either axis for cluster stars,illustrating how unlike the two distributions are. We note thatat fainter magnitudes (g′ = 20) the distributions are separatedby 2.5 mas yr−1, but the cluster dispersion also grows up to∼1 mas yr−1.
The formal sum of membership probabilities indicates a totalof ∼2500 cluster members down to g′ = 22.5 (V ∼ 22) with theaforementioned qualification on the outer sample. The reliabilityof our proper motions is shown by comparing the maximumPµ as a function of magnitude (Figure 4). The maximum Pµ
remains above 90% at g′ < 18 but then steadily drops to∼40% at g′ = 20 for the stars with r < 10′. For the outerstars, the maximum Pµ is only 63% at g′ = 16.3 and drops to40% at g′ = 18. In the outer parts of cluster the membershipprobabilities are only useful for identifying additional clustermembers on the main sequence, which in a CMD is the mostdensely populated feature of a cluster.
The integrity of our new cluster memberships are bestillustrated by provisional CMDs of stars separated into the likely
6
Platais & Gosnell et al. 2013
Proper motion movement (x)
Prop
er m
otio
n m
ovem
ent (
y)
Radial velocity (km/s)
Num
ber o
f sta
rs
Stars in cluster
Stars in field of galaxy
Stars in cluster
N. M. Gosnell September 28, 2018

Group of hundreds to thousands of stars • born at the same time • made from the same
material • all at the same distance
Accurate cluster memberships are important for more detailed studies of stellar evolution
0.4 0.6 0.8 1.0 1.2 1.4
16
15
14
13
12
11
0.4 0.6 0.8 1.0 1.2 1.4B - V
16
15
14
13
12
11V
Stellar color
Bright
Faint
Mag
nitud
eNGC 188:
-7 billion years old -5500 light years away
1498 stars in the region of the cluster
Hot Cool
Gosnell 2014, adapted from Geller et al. 2008
N. M. Gosnell September 28, 2018
Group of hundreds to thousands of stars • born at the same time • made from the same
material • all at the same distance
Accurate cluster memberships are important for more detailed studies of stellar evolution
Bright
Faint 0.4 0.6 0.8 1.0 1.2 1.4
16
15
14
13
12
11
0.4 0.6 0.8 1.0 1.2 1.4B - V
16
15
14
13
12
11V
Stellar color
Mag
nitud
eNGC 188:
-7 billion years old -5500 light years away
1498 stars in the region of the cluster
➔ 473 members
✔✔
✔
Hot Cool
Gosnell 2014, adapted from Geller et al. 2008
N. M. Gosnell September 28, 2018

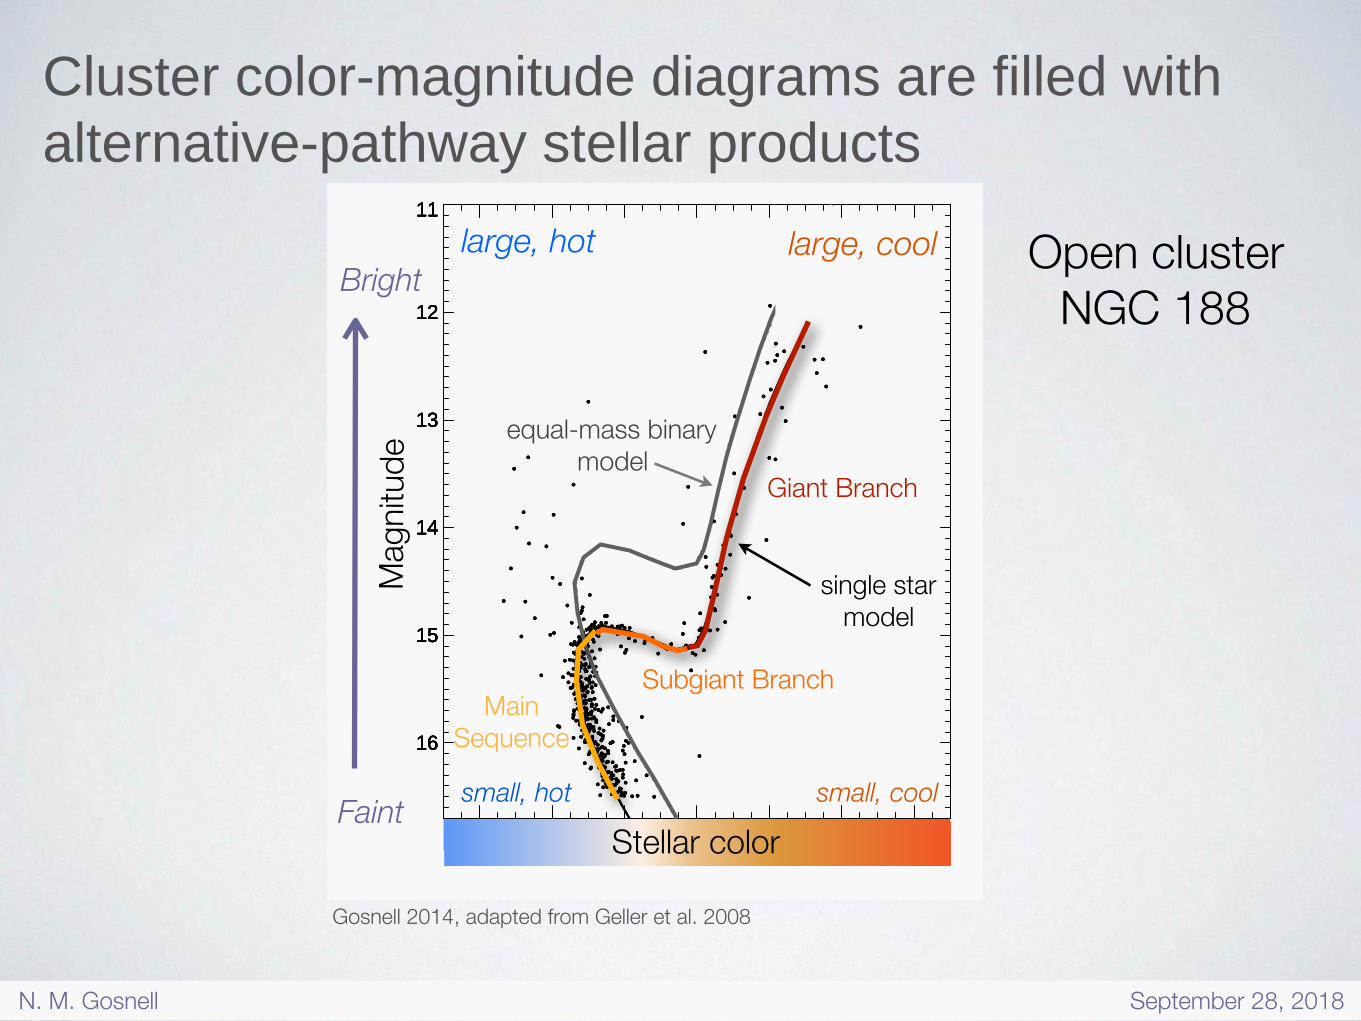
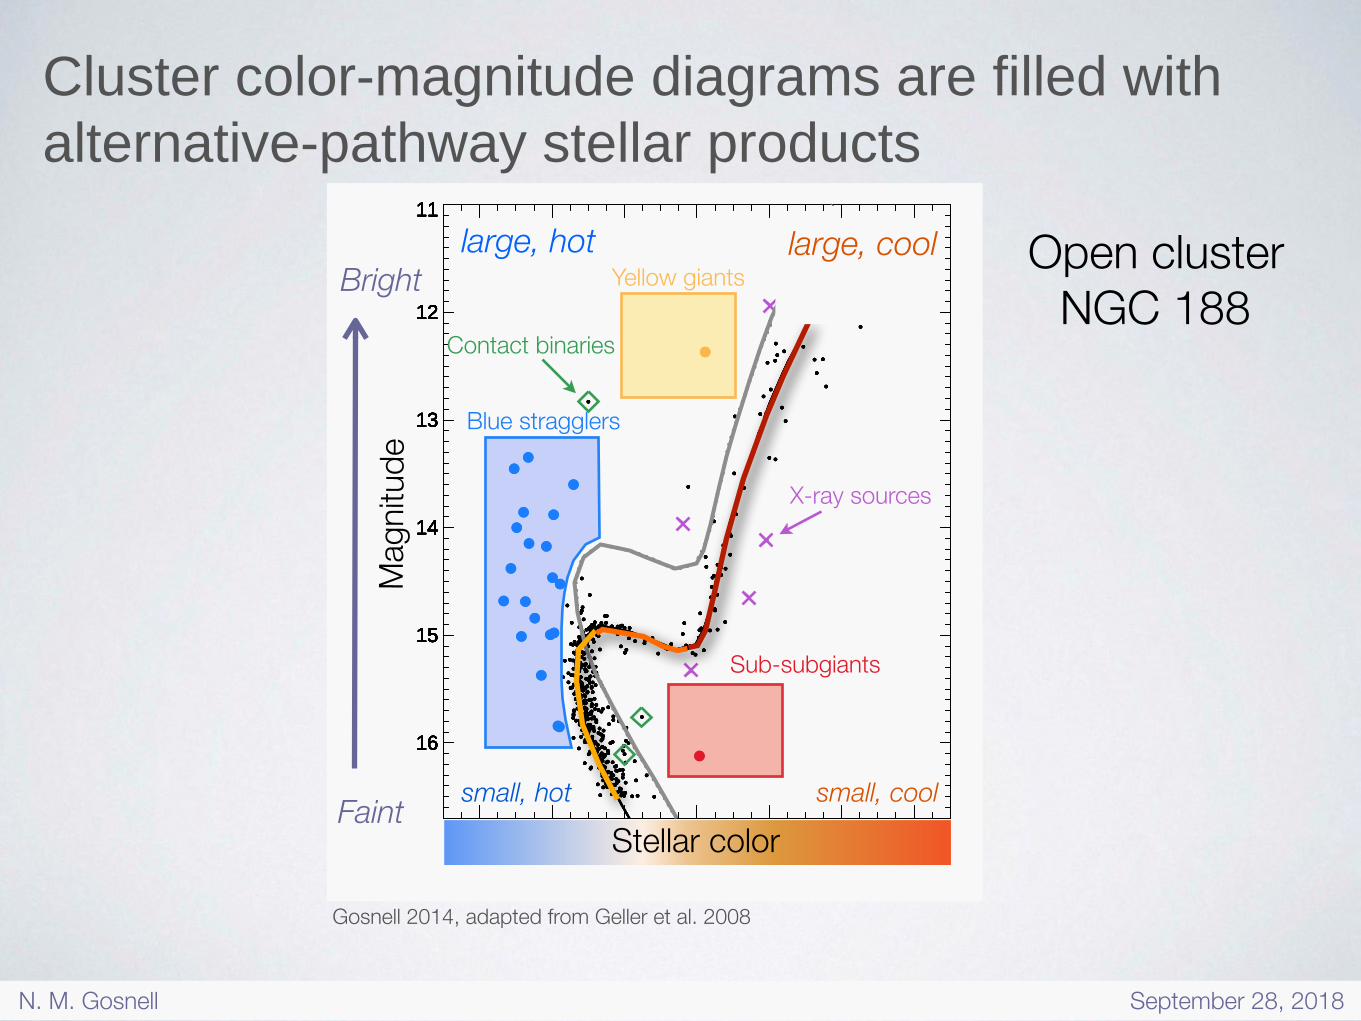
Cluster color-magnitude diagrams are filled with alternative-pathway stellar products
0.4 0.6 0.8 1.0 1.2 1.4 1.6
16
15
14
13
12
11
0.4 0.6 0.8 1.0 1.2 1.4 1.6B - V
16
15
14
13
12
11
V
0.4 0.6 0.8 1.0 1.2 1.4 1.6
16
15
14
13
12
11
0.4 0.6 0.8 1.0 1.2 1.4 1.6B - V
16
15
14
13
12
11
V
0.4 0.6 0.8 1.0 1.2 1.4 1.6
16
15
14
13
12
11
0.4 0.6 0.8 1.0 1.2 1.4 1.6B - V
16
15
14
13
12
11
V V
single star model
Bright
Faint Stellar color
Main Sequence
Subgiant Branch
Giant Branch
small, coolsmall, hot
large, hot large, cool Open cluster NGC 188
Mag
nitud
e
Gosnell 2014, adapted from Geller et al. 2008
N. M. Gosnell September 28, 2018
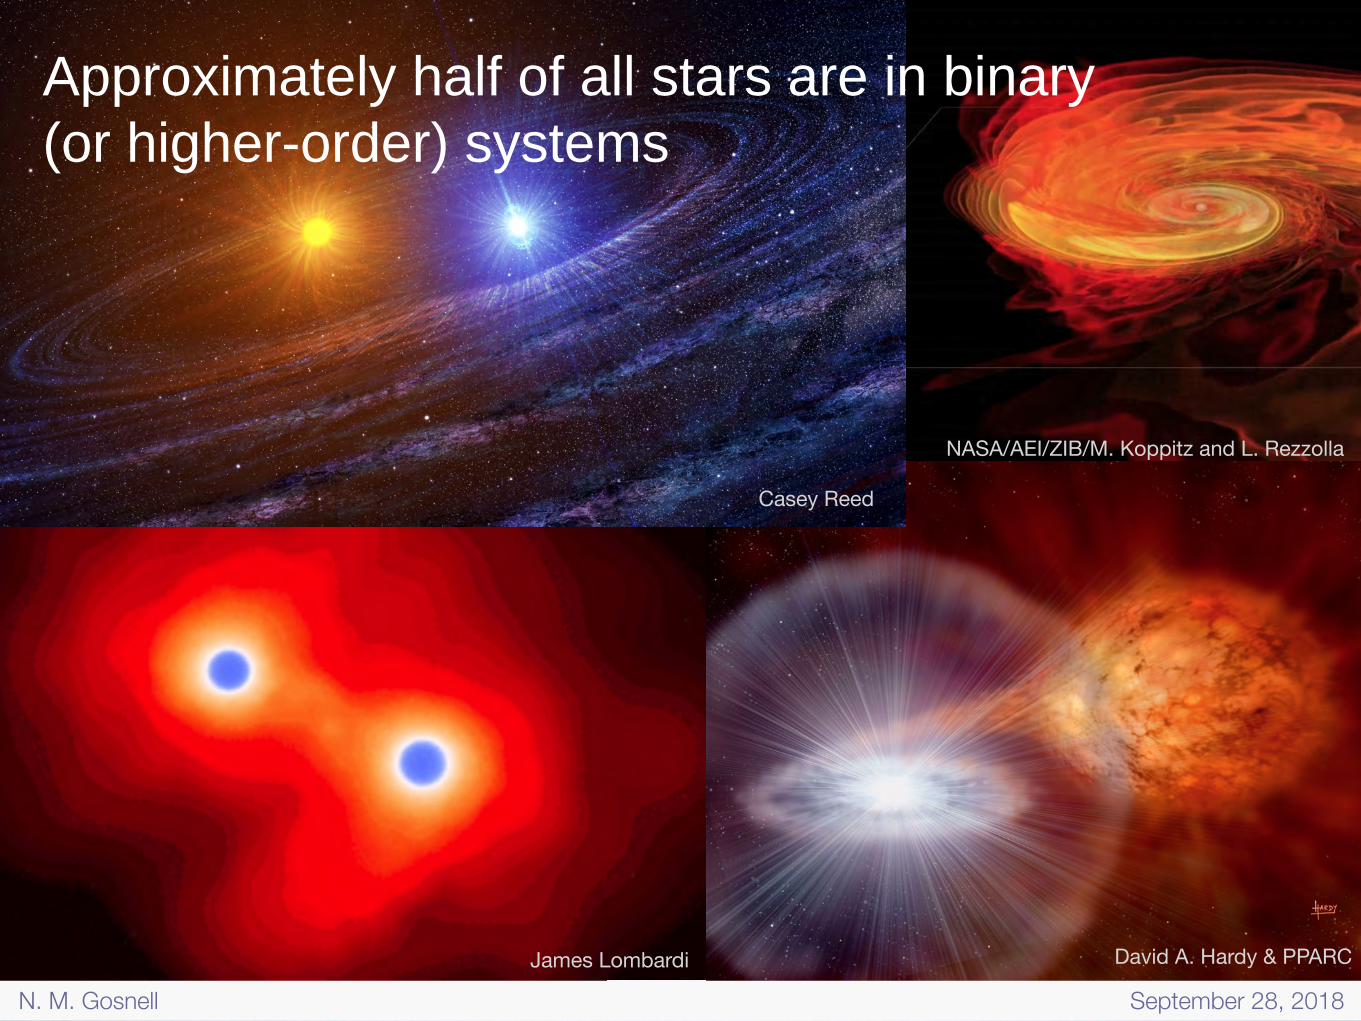
James Lombardi
NASA/AEI/ZIB/M. Koppitz and L. Rezzolla
David A. Hardy & PPARC
Casey Reed
Approximately half of all stars are in binary (or higher-order) systems
N. M. Gosnell September 28, 2018
Cluster color-magnitude diagrams are filled with alternative-pathway stellar products
0.4 0.6 0.8 1.0 1.2 1.4 1.6
16
15
14
13
12
11
0.4 0.6 0.8 1.0 1.2 1.4 1.6B - V
16
15
14
13
12
11
V
0.4 0.6 0.8 1.0 1.2 1.4 1.6
16
15
14
13
12
11
0.4 0.6 0.8 1.0 1.2 1.4 1.6B - V
16
15
14
13
12
11
V
0.4 0.6 0.8 1.0 1.2 1.4 1.6
16
15
14
13
12
11
0.4 0.6 0.8 1.0 1.2 1.4 1.6B - V
16
15
14
13
12
11
V V
single star model
Bright
Faint Stellar color
Main Sequence
Subgiant Branch
Giant Branch
small, coolsmall, hot
large, hot large, cool Open cluster NGC 188
Mag
nitud
e
Gosnell 2014, adapted from Geller et al. 2008
equal-mass binary model
N. M. Gosnell September 28, 2018
Cluster color-magnitude diagrams are filled with alternative-pathway stellar products
0.4 0.6 0.8 1.0 1.2 1.4 1.6
16
15
14
13
12
11
0.4 0.6 0.8 1.0 1.2 1.4 1.6B - V
16
15
14
13
12
11
V
0.4 0.6 0.8 1.0 1.2 1.4 1.6
16
15
14
13
12
11
0.4 0.6 0.8 1.0 1.2 1.4 1.6B - V
16
15
14
13
12
11
V
0.4 0.6 0.8 1.0 1.2 1.4 1.6
16
15
14
13
12
11
0.4 0.6 0.8 1.0 1.2 1.4 1.6B - V
16
15
14
13
12
11
V
0.4 0.6 0.8 1.0 1.2 1.4 1.6
16
15
14
13
12
11
0.4 0.6 0.8 1.0 1.2 1.4 1.6B - V
16
15
14
13
12
11
V
0.4 0.6 0.8 1.0 1.2 1.4 1.6
16
15
14
13
12
11
0.4 0.6 0.8 1.0 1.2 1.4 1.6B - V
16
15
14
13
12
11
V VBlue stragglers
Yellow giants
Sub-subgiants
Contact binaries
X-ray sources
NGC 188Bright
Faint Stellar color
small, coolsmall, hot
large, hot large, cool Open cluster NGC 188
Mag
nitud
e
Gosnell 2014, adapted from Geller et al. 2008
N. M. Gosnell September 28, 2018
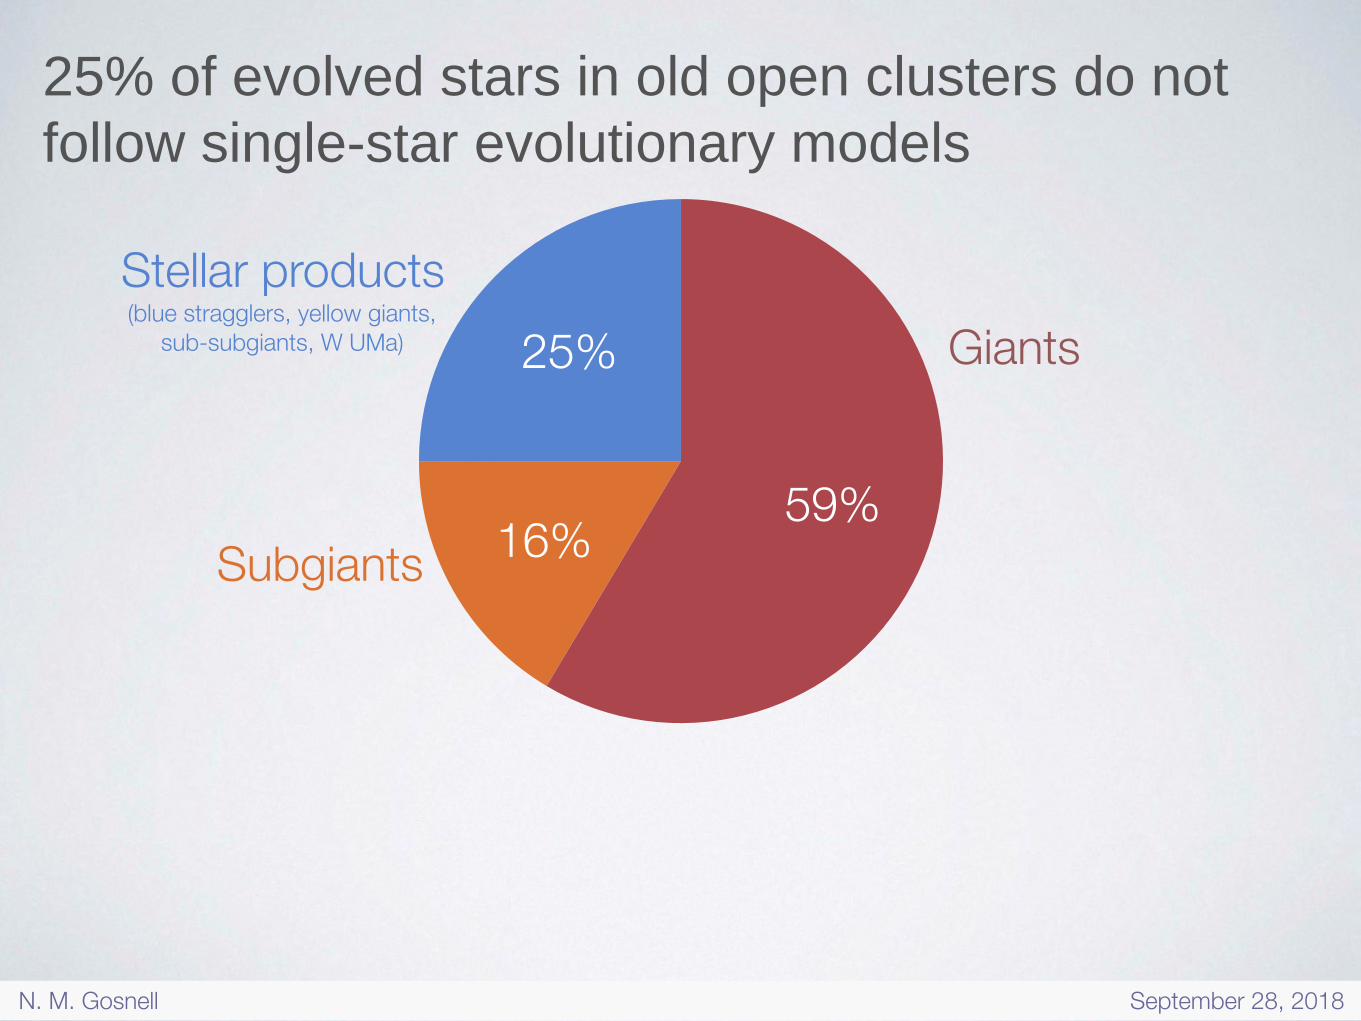
25% of evolved stars in old open clusters do not follow single-star evolutionary models
25%
16%59%
Giants
Subgiants
Stellar products (blue stragglers, yellow giants,
sub-subgiants, W UMa)
N. M. Gosnell September 28, 2018

25%
16%59%
25% of evolved stars in old open clusters do not follow single-star evolutionary models
Giants
Stellar products excluded from stellar evolution studies for many years • Possible field contamination • Thought to be rare or anomalous
Subgiants
Stellar products (blue stragglers, yellow giants,
sub-subgiants, W UMa)
N. M. Gosnell September 28, 2018
25%
16%59%
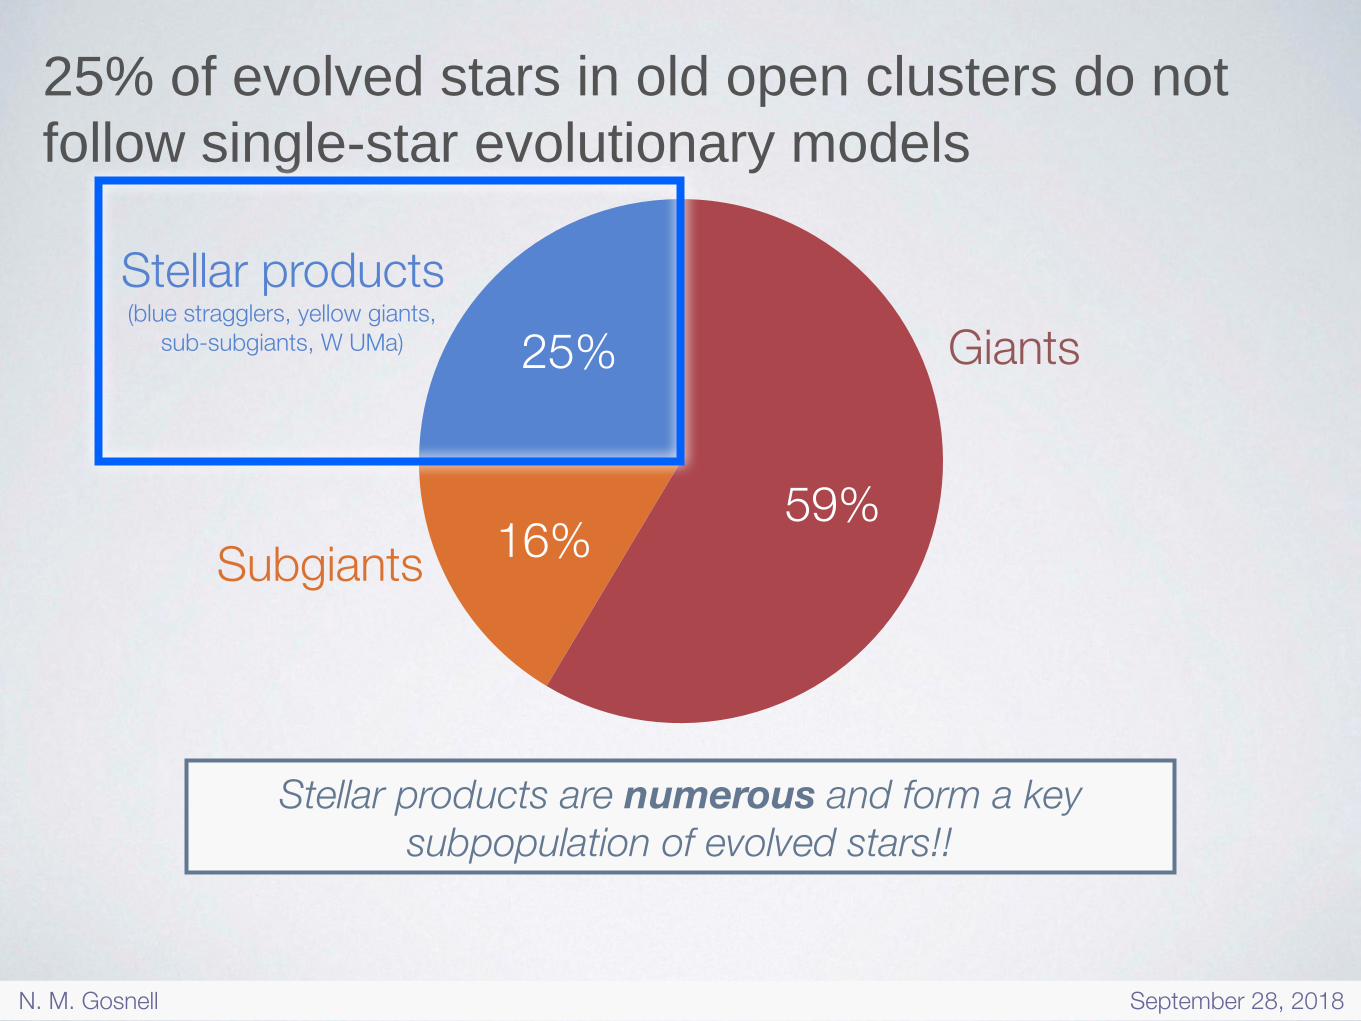
25% of evolved stars in old open clusters do not follow single-star evolutionary models
Giants
Stellar products are numerous and form a key subpopulation of evolved stars!!
Subgiants
Stellar products (blue stragglers, yellow giants,
sub-subgiants, W UMa)
N. M. Gosnell September 28, 2018

25%
16%59%
25% of evolved stars in old open clusters do not follow single-star evolutionary models
Giants
My work focuses on this 25% of stars in order to build a more comprehensive picture of stellar evolution
Subgiants
Stellar products (blue stragglers, yellow giants,
sub-subgiants, W UMa)
N. M. Gosnell September 28, 2018
Current theoretical models of stellar populations cannot make accurate stellar products
Many areas of astrophysics rely on stellar population models.
In order to match theory and reality we need to fix the physics in these models that creates stellar products.
Evolved populations in these models (the most luminous stars and easiest to observe) are inaccurate and incomplete.
N. M. Gosnell September 28, 2018
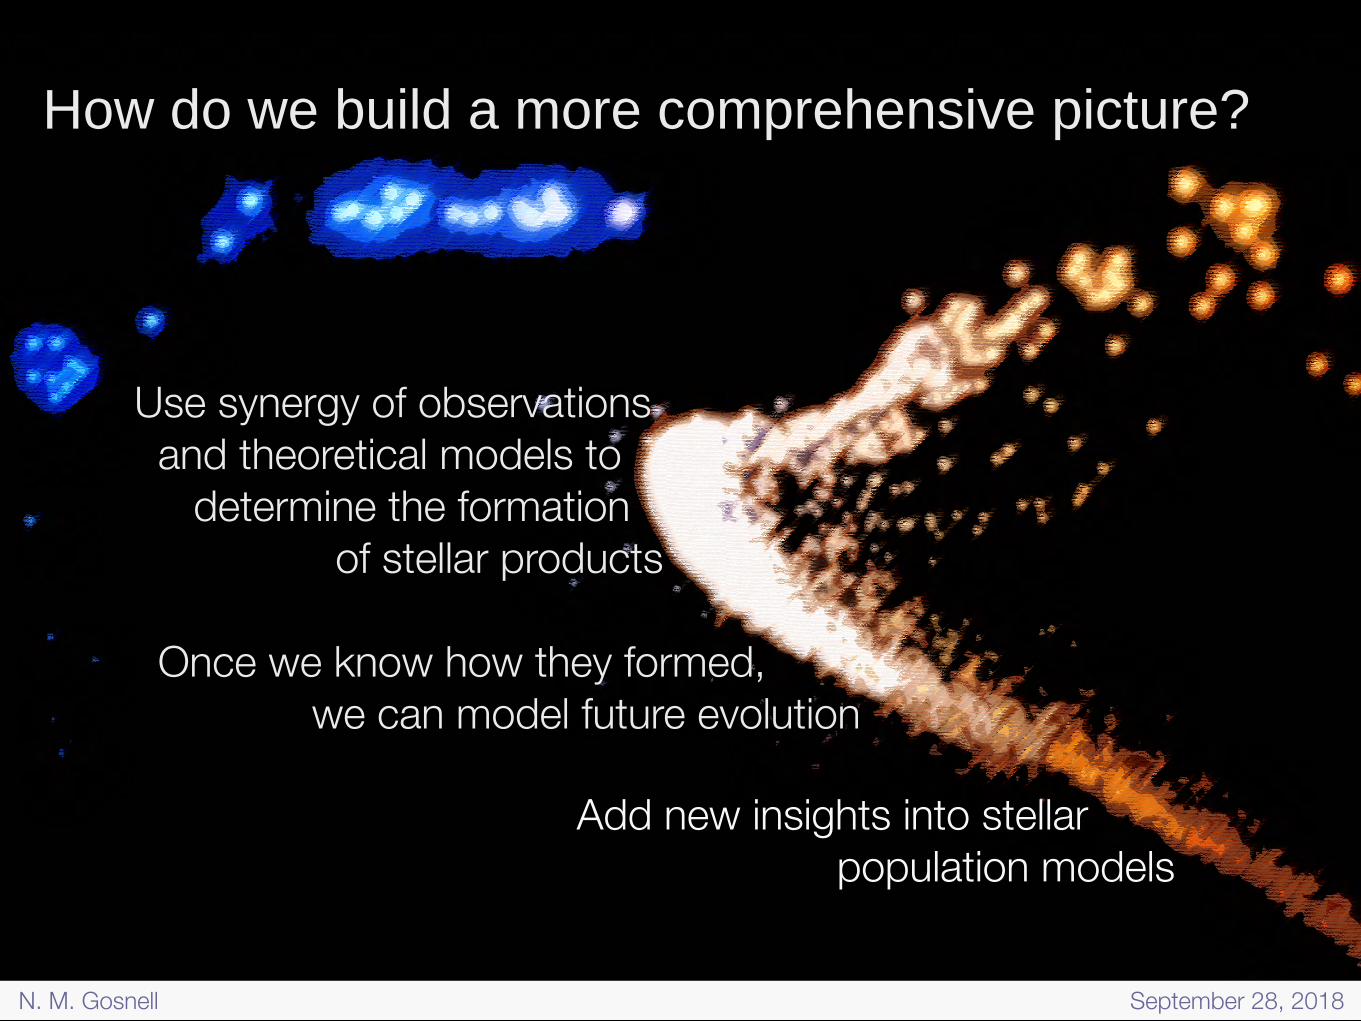
How do we build a more comprehensive picture?
Use synergy of observations and theoretical models to determine the formation of stellar products
Once we know how they formed, we can model future evolution
Add new insights into stellar population models
N. M. Gosnell September 28, 2018
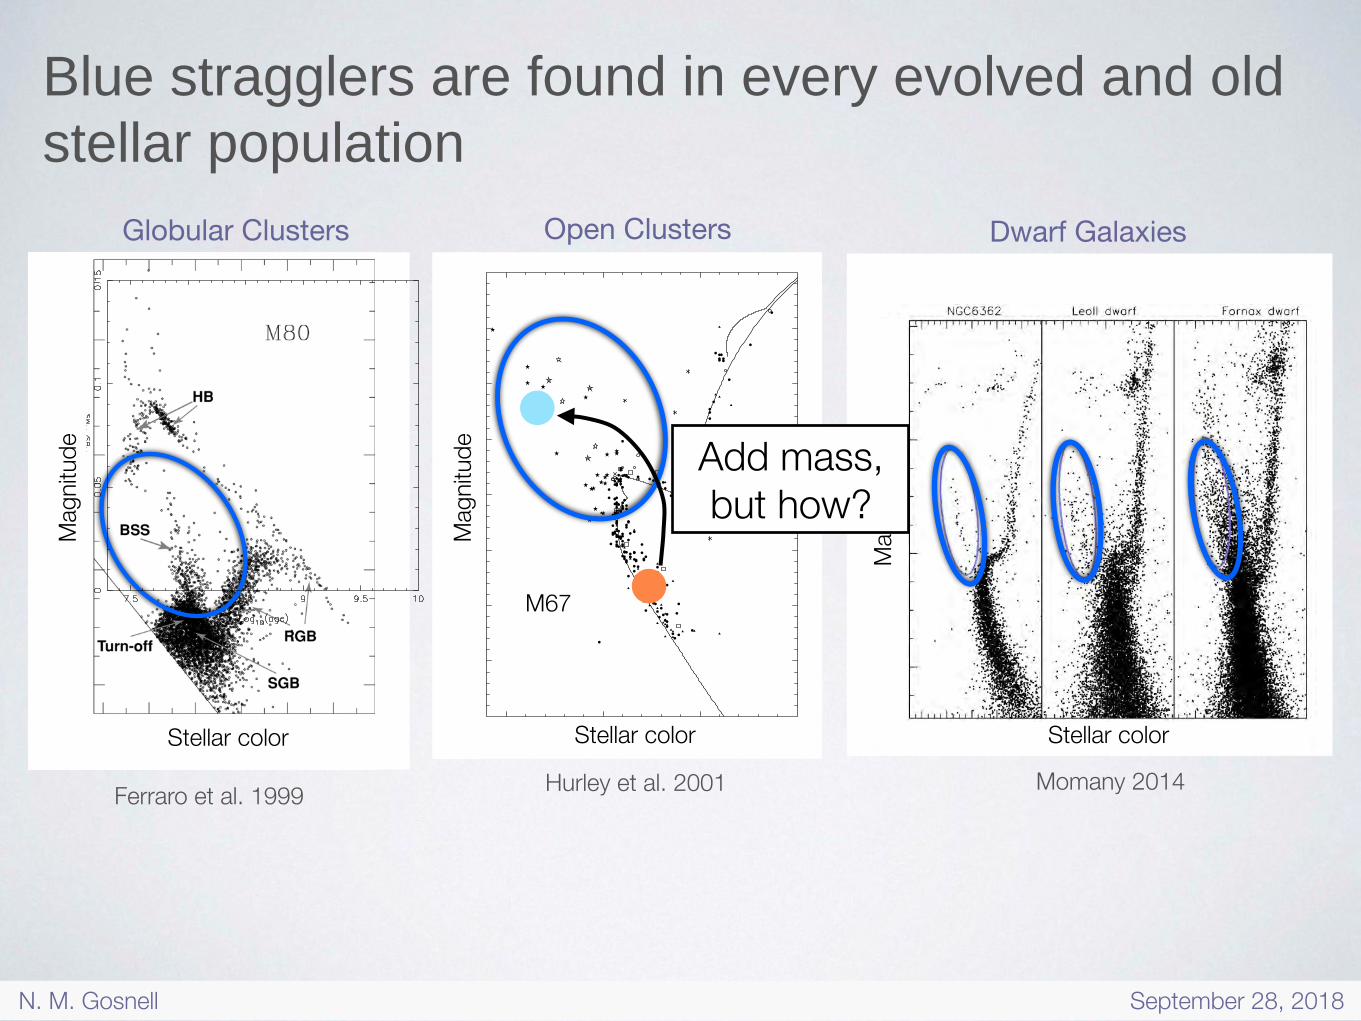
Blue stragglers are found in every evolved and old stellar population
Ferraro et al. 1999
Globular Clusters
Hurley et al. 2001!"# $%&! %'()%*& &+#,-.)%& ),(%/(),0 '),-.1 #(%/*!)%,2 3 +-&# 3
$-&& !.-,&4#. &+#,-.)% 56)77#,"-",8 9#)0#.! : ;%44$#)&!#. <=>?@
),(%/(#& - $-),A&#B*#,+# &!-. 4)//),0 )!& C%+"# /%'# -,D
!.-,&4#..),0 $-&& !% )!& +%$7-,)%,8 - /#&& $-&&)(# $-),A&#B*#,+#
&!-.8 4%//%E#D '1 +%-/#&+#,+# %4 !"# !E% &!-.& -& !"# %.')! &".),F&
%E),0 !% -,0*/-. $%$#,!*$ /%&&2 G"# .#&*/! )& - $%.# $-&&)(#
$-),A&#B*#,+# &!-. !"-! )& .#H*(#,-!#D .#/-!)(# !% %!"#. &!-.& %4 !"#
&-$# $-&& -,D !"*& #(%/(#& !% '#+%$# - '/*# &!.-00/#.2 G")& )& -,
#44)+)#,! $#!"%D %4 7.%D*+),0 &),0/# '/*# &!.-00/#.&8 7.%()D#D !"-!
- /-.0# 7%7*/-!)%, %4 +/%&# '),-.)#& #I)&!& ), !"# +/*&!#.2 J-&# K
$-&& !.-,&4#. ),(%/(#& - $-),A&#B*#,+# &!-. -++.#!),0 $-!#.)-/
4.%$ - $%.# #(%/(#D +%$7-,)%, -,D !"*& +%*/D '# - /)F#/1
#I7/-,-!)%, 4%. '/*# &!.-00/#.& ), &"%.!A7#.)%D &7#+!.%&+%7)+
'),-.)#&8 &*+" -& L<=M2 K/*# &!.-00/#.& ), /%,0A7#.)%D '),-.)#&
+%*/D '# 7.%D*+#D '1 +-&# J $-&& !.-,&4#. E"#, !"# 7.)$-.1 )& -,
-&1$7!%!)+ 0)-,! '.-,+" 53NK@ &!-. !"-! "-& /%&! $*+" %4 )!& $-&&2
9),D -++.#!)%, ), '),-.)#& !"-! ),)!)-//1 "-(# 4-)./1 /-.0# 7#.)%D&
+%*/D -/&% '# .#&7%,&)'/# 4%. &*+" &1&!#$&2
O, -// !"#&# +-&#&8 #I+#7! 7#."-7& E),D -++.#!)%,8 !"# '),-.1
%.')!& &"%*/D '# +).+*/-.)P#D '1 !)D#& '#4%.# -,D D*.),0 $-&&
!.-,&4#.2 Q!"#. &+#,-.)%& -.# ,##D#D !% #I7/-), !"# '),-.)#& ),
#++#,!.)+ %.')!&8 -,D !")& )& E"#.# !"# #44#+!& %4 D1,-$)+-/
),!#.-+!)%,& ), - +/*&!#. #,().%,$#,! '#+%$# )$7%.!-,!2 R"1&)+-/
&!#//-. +%//)&)%,& D*.),0 '),-.1S'),-.1 -,D '),-.1S&),0/# ),!#.A
-+!)%,& +-, 7.%D*+# '/*# &!.-00/#.& ), #++#,!.)+ %.')!&8 -& E#// -&
-//%E),0 !"# 7%&&)')/)!1 %4 -, #I)&!),0 '/*# &!.-00/#. '#),0
#I+"-,0#D ),!% -, #++#,!.)+ '),-.12 3++%.D),0 !% T-()#& 5<==>@8
#,+%*,!#.& '#!E##, '),-.)#& -,D &),0/# &!-.& '#+%$# )$7%.!-,!
E"#, !"# '),-.1 4.-+!)%, ), !"# +%.# #I+##D& -'%*! U 7#. +#,! -,D
'),-.1S'),-.1 #,+%*,!#.& D%$),-!# )4 !"# 4.-+!)%, )& 0.#-!#. !"-,
VM 7#. +#,!2 3DD)!)%,-//18 !"# 7.%'-')/)!1 %4 #,+%*,!#.& D#7#,D& %,
!"# D#,&)!1 %4 !"# +/*&!#.2 O! )& -/&% 7%&&)'/# !"-! 7#.!*.'-!)%,& 4.%$
7-&&),0 &!-.& $-1 ),D*+# -, #++#,!.)+)!1 ), - 7.#()%*&/1 +).+*/-.
%.')!2 3& D)&+*&&#D '1 W#%,-.D 5<==>@8 )! )& *,/)F#/1 !"-! -,1 %,#
4%.$-!)%, $#+"-,)&$ D%$),-!#&8 -,D ), !"# +-&# %4 !"# D)(#.&#
'/*# &!.-00/#. 7%7*/-!)%, %4 X>? )! &##$& 7.%'-'/# !"-! -// !"#
-'%(# &+#,-.)%& 7/-1 - .%/#2
G"# -)$ %4 !")& 7-7#. )& !% +%$7-.# !A'%D1 $%D#/& E)!"
%'&#.(-!)%,& %4 X>? !% ),(#&!)0-!# !"# ),+)D#,+# -,D D)&!.)'*!)%,
%4 '/*# &!.-00/#.& 5KY&@8 -,D ), &% D%),0 !% +%,&!.-), !"# ,-!*.# %4
!"# 7.)$%.D)-/ '),-.1 7%7*/-!)%,2 O, Y#+!)%, Z E# 0)(# -,
%(#.()#E %4 !"# %'&#.(-!)%,-/ D-!-8 ), !#.$& %4 ),D)()D*-/ &!#//-.
7%7*/-!)%,& -,D %(#.-// +/*&!#. 7-.-$#!#.&2 9# D#&+.)'# !"# D#!-)/&
%4 %*. '),-.1 7%7*/-!)%, &1,!"#&)& ), Y#+!)%, V -,D *&# )! !%
+%,&!.-), !"# 7-.-$#!#.& %4 !"# (-.)%*& D)&!.)'*!)%,& ),(%/(#D8 E)!"
- ()#E !% $-I)$)P),0 !"# ,*$'#. %4 '/*# &!.-00/#.& 7.%D*+#D2 G"#
!"#$%& '( G"# ,*$'#. %4 '/*# &!.-00/#.& .#/-!)(# !% !"# ,*$'#. %4 XY &!-.&
), !"# !E% $-0,)!*D#& '#/%E !"# !*.,A%44 -& - 4*,+!)%, %4 !"# 7%7*/-!)%,
-0#2 G"# &!-.& .#7.#&#,! !"# %7#, +/*&!#. D-!- %4 3"*$-D- : W-7-&&#!
5<==U@8 E)!" !"# X>? 7%),! -, %7#, &1$'%/2 G"# D-&"#D /),# .#7.#&#,!& %*.
7%7*/-!)%, &1,!"#&)& E)!" - UM 7#. +#,! '),-.1 7%7*/-!)%,8 *&),0 !"# 7-.-A
$#!#.& %4 RY> 5&## Y#+!)%, V@2 G"# &%/)D /),# .#7.#&#,!& %*. X>? !A'%D1
&)$*/-!)%, 5&## Y#+!)%, >[ ,%!# !"-! !"# /%0A&+-/# D%#& ,%! +/#-./1 ),D)+-!#
!"# /#,0!" %4 !"# &)$*/-!)%,@2
!"#$%& )( JXT 4%. X>? 5\NJZ>]Z@ *&),0 7"%!%$#!.)+ D-!- !-F#, 4.%$
!"# Q7#, J/*&!#. T-!-'-&# 5QJT[ X#.$)//)%D <==>@2 J).+/#& &"%E
7.%'-'/# $#$'#.& !"$' ! ]M 7#. +#,!@ -& ),D)+-!#D '1 7.%7#. $%!)%,
&!*D)#&8 -,D !.)-,0/#& &"%E &!-.& %4 /#&& +#.!-), $#$'#.&")72 Q7#, &1$'%/&
-.# &7#+!.%&+%7)+ '),-.)#&2 Y!-.& )D#,!)4)#D -& '/*# &!.-00/#.& ), !"# QJT
-.# 7/%!!#D -& &!-.&2 Q7#, &B*-.#& .#7.#&#,! !"# &#(#, CYJ^, +-,D)D-!#&
)D#,!)4)#D '1 K#//%,)8 #̂.'*,! : X-!")#* 5<==]8 "#.#-4!#. K^X@2
3&!#.)&F& -.# !"# &)I _A.-1 &%*.+#& #I-$),#D '1 (-, D#, K#.08 #̂.'*,!
: X-!")#* 5<===8 "#.#-4!#. X^K@8 #I+/*D),0 Y<M]Z E")+" "-& -/.#-D1
'##, 7/%!!#D -& - '/*# &!.-00/#.2 G"# +.%&& .#7.#&#,!& !"# !.)7/# &1&!#$
%'&#.(#D '1 X-!")#*8 W-!"-$ : N.)44), 5<==M8 "#.#-4!#. XWN@2 3// !"#
&7#+)-/ &!-.& !"-! E# "-(# ")0"/)0"!#D "-(# "$' ! ]M 7#. +#,!2 3/&% 7/%!!#D
54*// /),#@ )& -, )&%+".%,# -! # " `<>MX1. E)!" $ " M!MZ" %"& " =!?-,D '!(" )# " M!M<U!
*+,-.# !/0123 %12-44+56 17 8#-449, :1:;49#+158 >V<
! ZMM< C3Y8 X\C3Y *)*8 >VMS>UM
Open Clusters
M67
Momany 2014
Dwarf Galaxies
Fig. 6.2 From left to right the panels show the colour-magnitude diagram of NGC 6362 [57], LeoIIdwarf galaxy [25], and Fornax dwarf galaxy [28]. The ellipse approximately traces the BSS regionin NGC 6362 and LeoII, whereas for the Fornax dwarf contamination by the young stars forbidsreliable BSS estimates.
blue plume population falls within the BSS limits in globular clusters. On the otherhand, the right panel of Fig.6.2 summarises the BSS–young stars ambiguity in dwarfgalaxies. The Fornax dwarf galaxy is known to host a recent star formation episode,that occurred some 200 Myr ago [69], and the diagram from the HST survey [28]shows that in such cases one cannot properly reach the ancient MS turn-off levelwithout the inclusion of contaminant young stars. Thus, the selection of a dwarfgalaxies sample for BSS studies must filter out all those galaxies that do not allow aclear detection of the ancient MS turn-off level.
In this regards, one should bear in mind that the fainter end of the BSS sequenceextends to ⇠ 0.6 magnitude below the ancient MS turn-off level (e.g. the case ofM55 by [34]). Given the small number statistics of the BSS stars in dwarf galaxies,
Stellar color Stellar color Stellar color
Mag
nitud
e
Mag
nitud
e
Mag
nitud
eAdd mass, but how?
N. M. Gosnell September 28, 2018

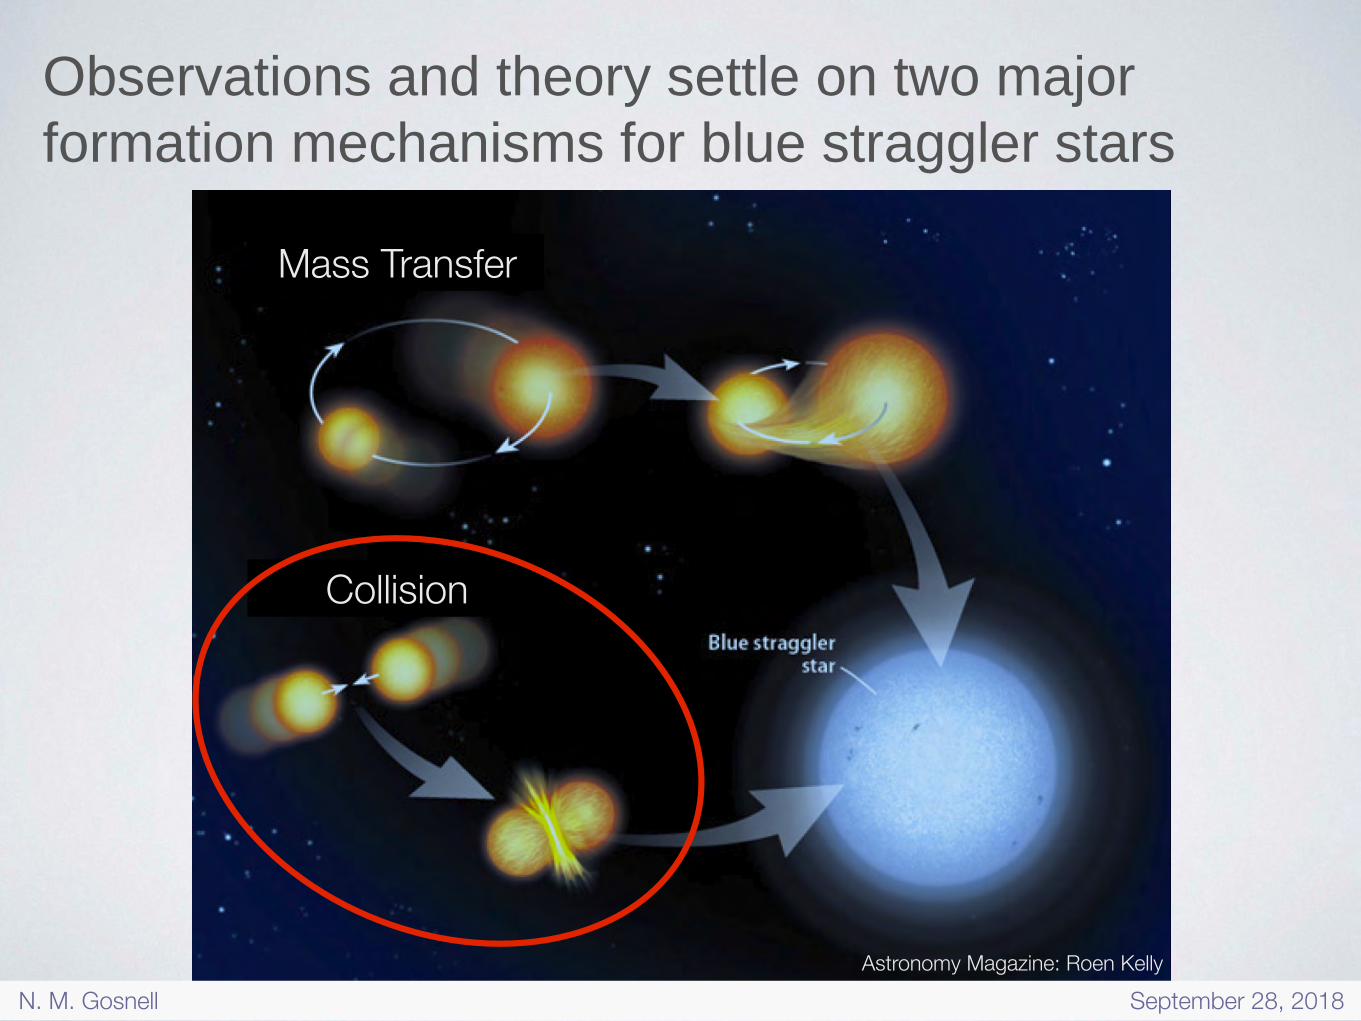
Observations and theory settle on two major formation mechanisms for blue straggler stars
Astronomy Magazine: Roen Kelly
Mass Transfer
Collision
N. M. Gosnell September 28, 2018
Observations and theory settle on two major formation mechanisms for blue straggler stars
Astronomy Magazine: Roen Kelly
Mass Transfer
Collision
N. M. Gosnell September 28, 2018
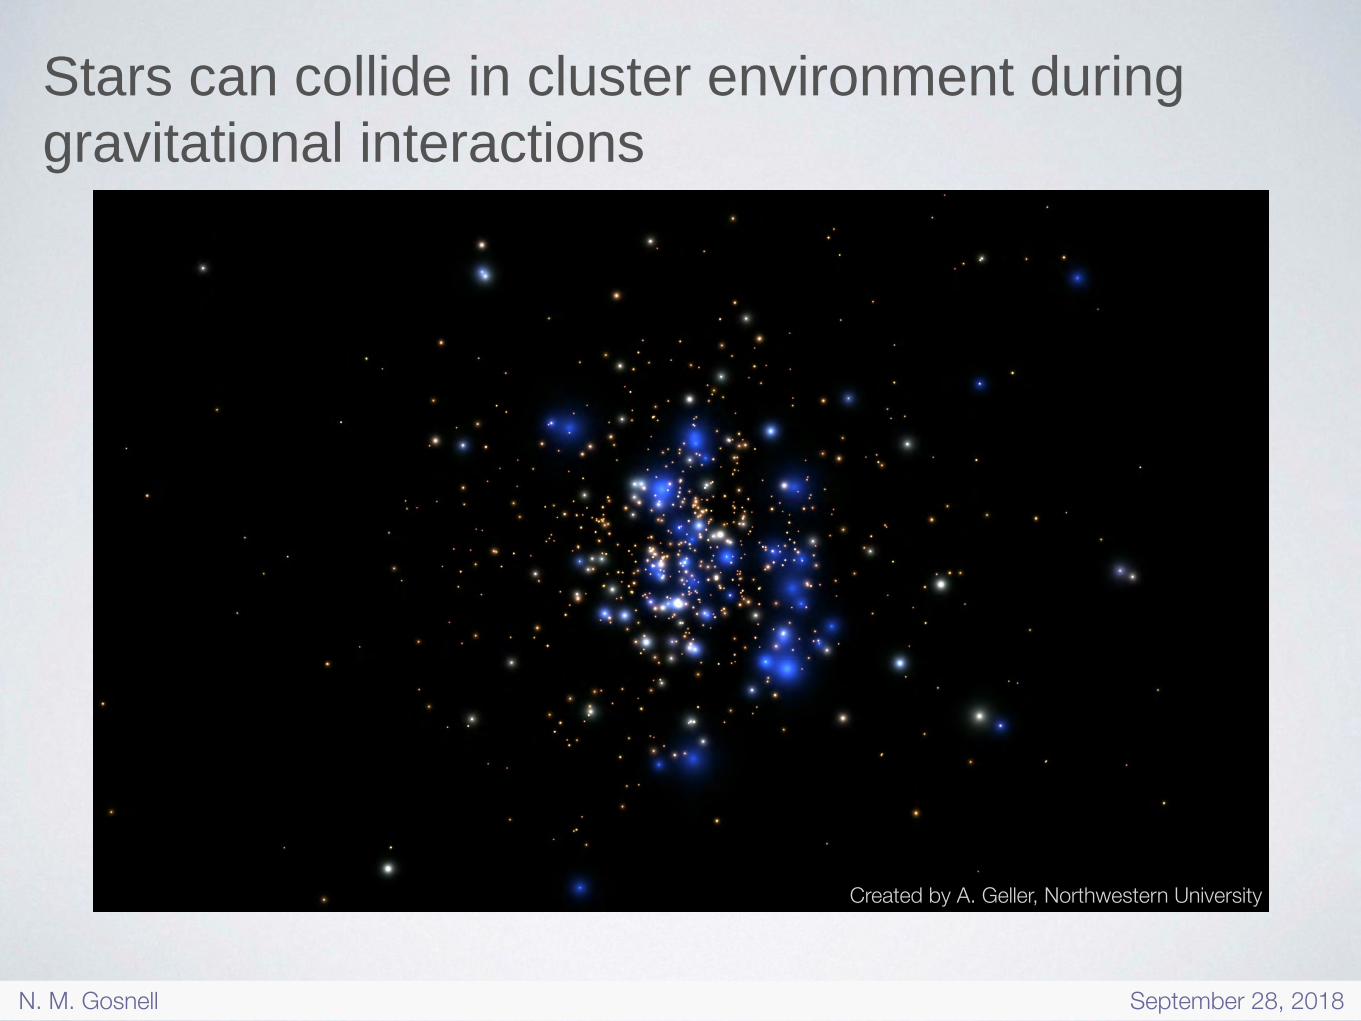
Stars can collide in cluster environment during gravitational interactions
Created by A. Geller, Northwestern University
N. M. Gosnell September 28, 2018

Stars can collide in a cluster environment during dynamical encounters
Courtesy of Aaron Geller
triple system
binary system
N. M. Gosnell September 28, 2018
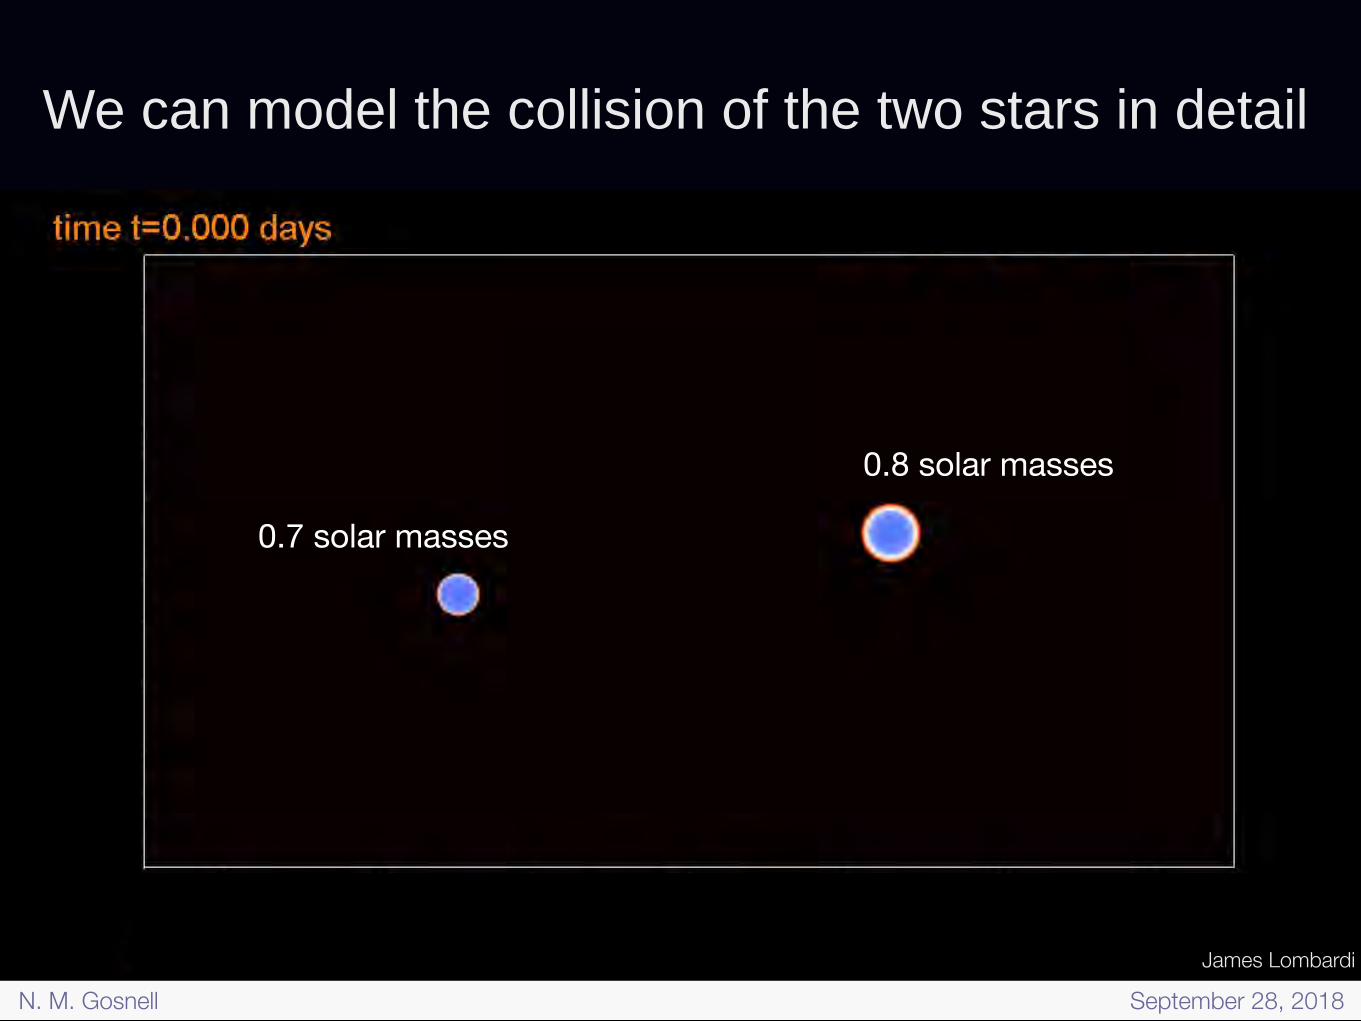
We can model the collision of the two stars in detail
0.8 solar masses
0.7 solar masses
James Lombardi
N. M. Gosnell September 28, 2018

Observations and theory settle on two major formation mechanisms for blue straggler stars
Astronomy Magazine: Roen Kelly
Mass Transfer
Collision
N. M. Gosnell September 28, 2018

Main sequence companion
Mass transfer occurs when one star overflows its sphere of
gravitational influence
These stars have similar masses, but the slightly more massive one evolves faster and becomes a red giant
Main sequence primary
Red Giant primary
(to approximate scale)N. M. Gosnell September 28, 2018

Mass transfer occurs when one star overflows its sphere of
gravitational influence Red Giant
primary
White dwarfBlue straggler
The red giant transfers its envelope to the companion, which gains mass
(to approximate scale)
The companion becomes a blue straggler, and the red giant leaves behind a white dwarf
Main sequence companion
N. M. Gosnell September 28, 2018
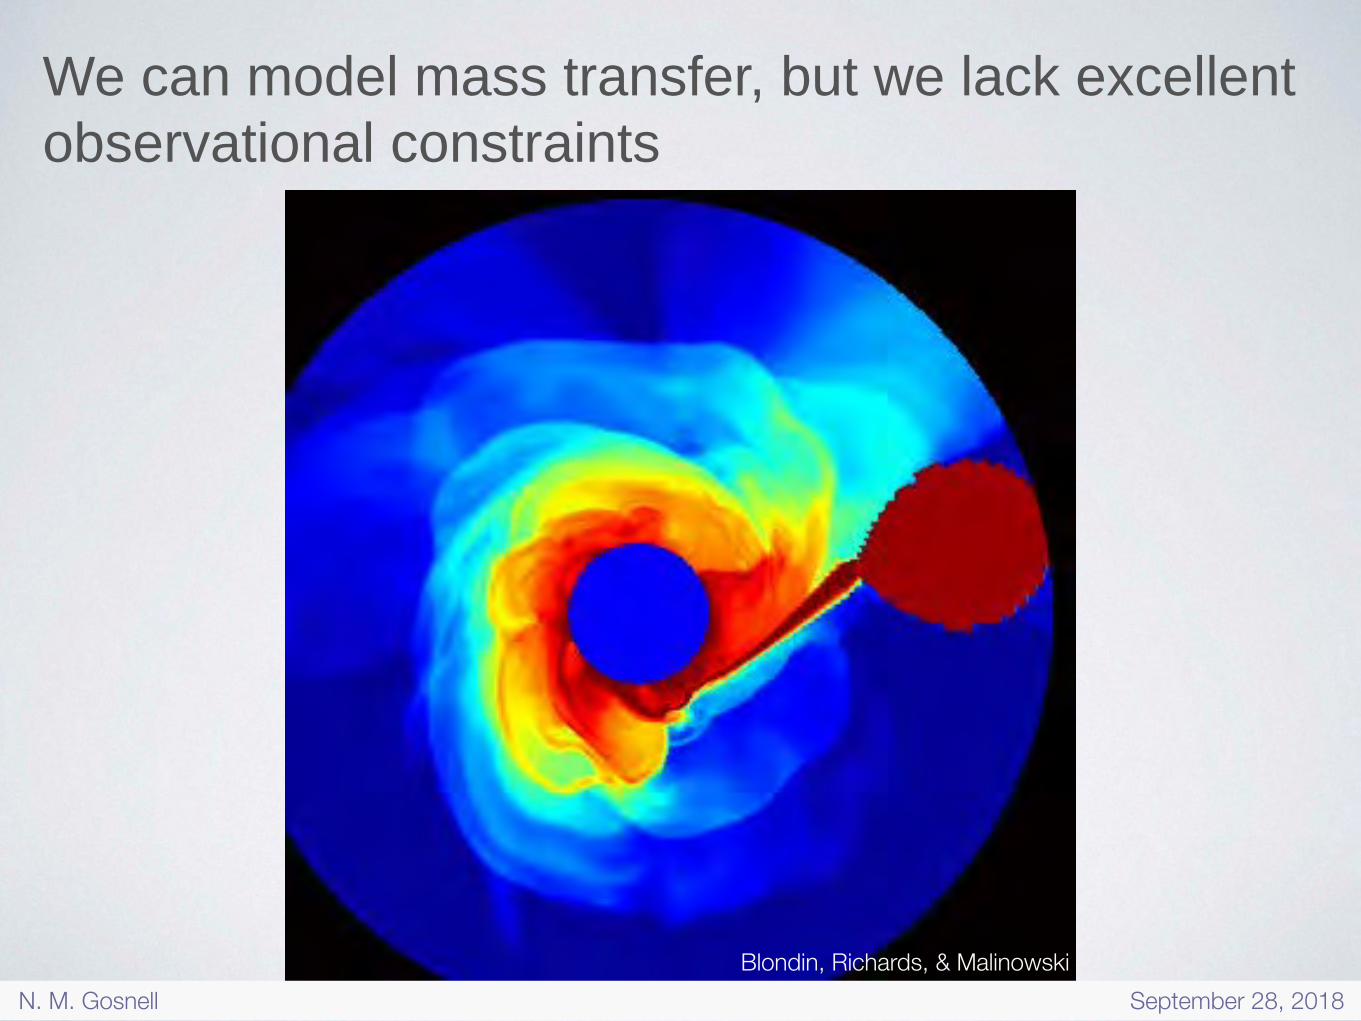
We can model mass transfer, but we lack excellent observational constraints
Blondin, Richards, & MalinowskiN. M. Gosnell September 28, 2018
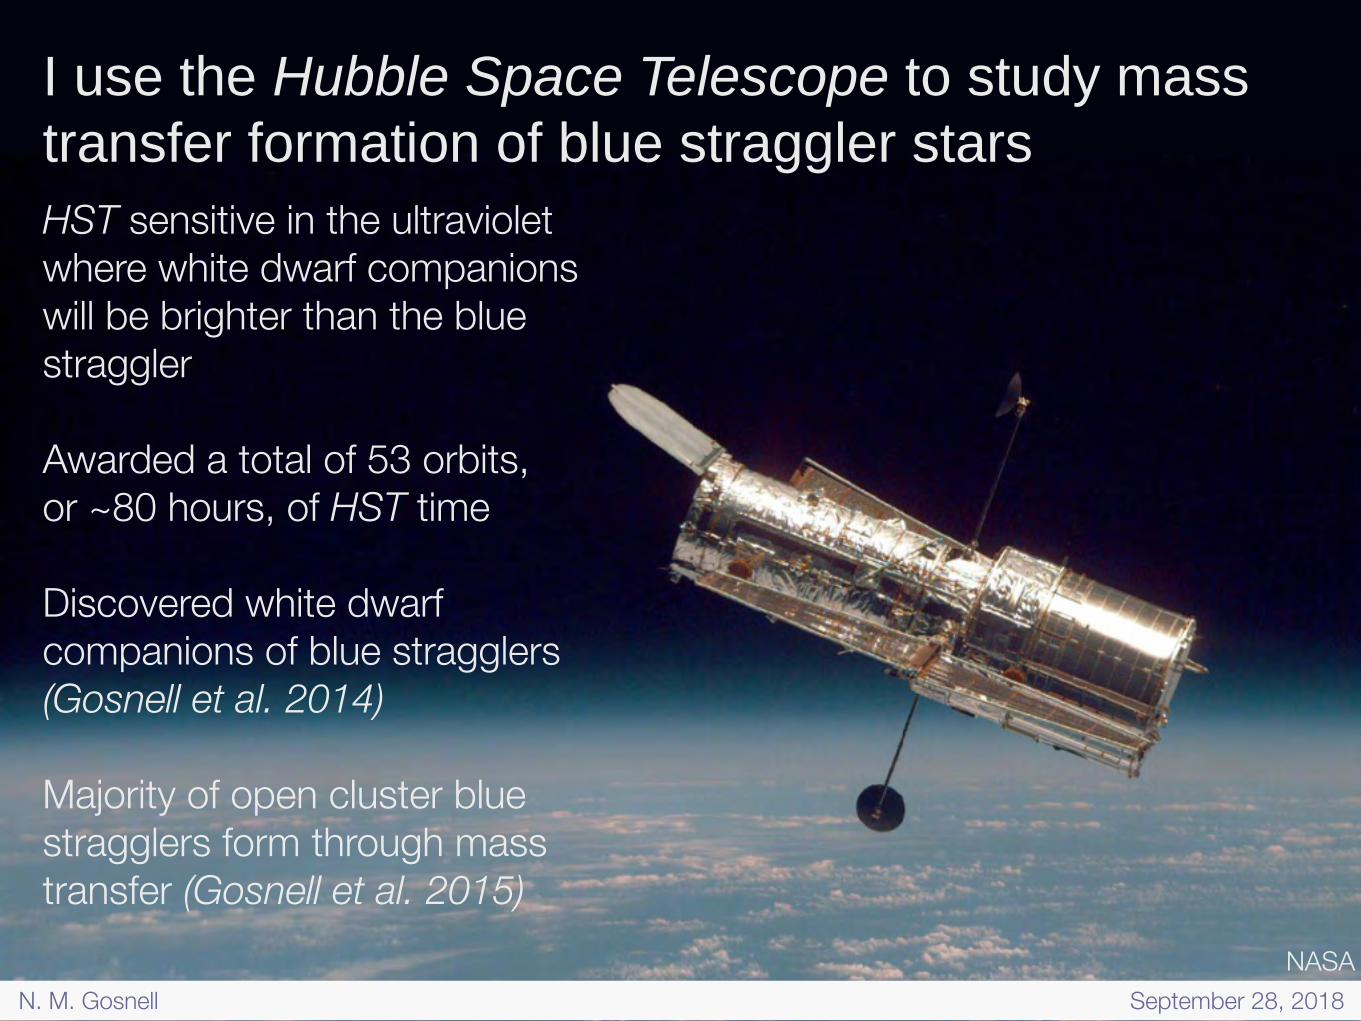
I use the Hubble Space Telescope to study mass transfer formation of blue straggler stars
NASA
HST sensitive in the ultraviolet where white dwarf companions will be brighter than the blue straggler
Awarded a total of 53 orbits, or ~80 hours, of HST time
Discovered white dwarf companions of blue stragglers (Gosnell et al. 2014)
Majority of open cluster blue stragglers form through mass transfer (Gosnell et al. 2015)
N. M. Gosnell September 28, 2018

•Relatively close (5500 light years away) •Very evolved (7 billion years old) •Extremely well-studied (Platais et al. 2003; Sarajedini et al. 1999; Geller et al. 2008, 2009, 2013; Mathieu & Geller 2009; Geller & Mathieu 2011, 2012, Gosnell et al. 2014, 2015)
Digitized Sky Survey
Open cluster NGC 188 provides an ideal environment for studying blue straggler stars
N. M. Gosnell September 28, 2018
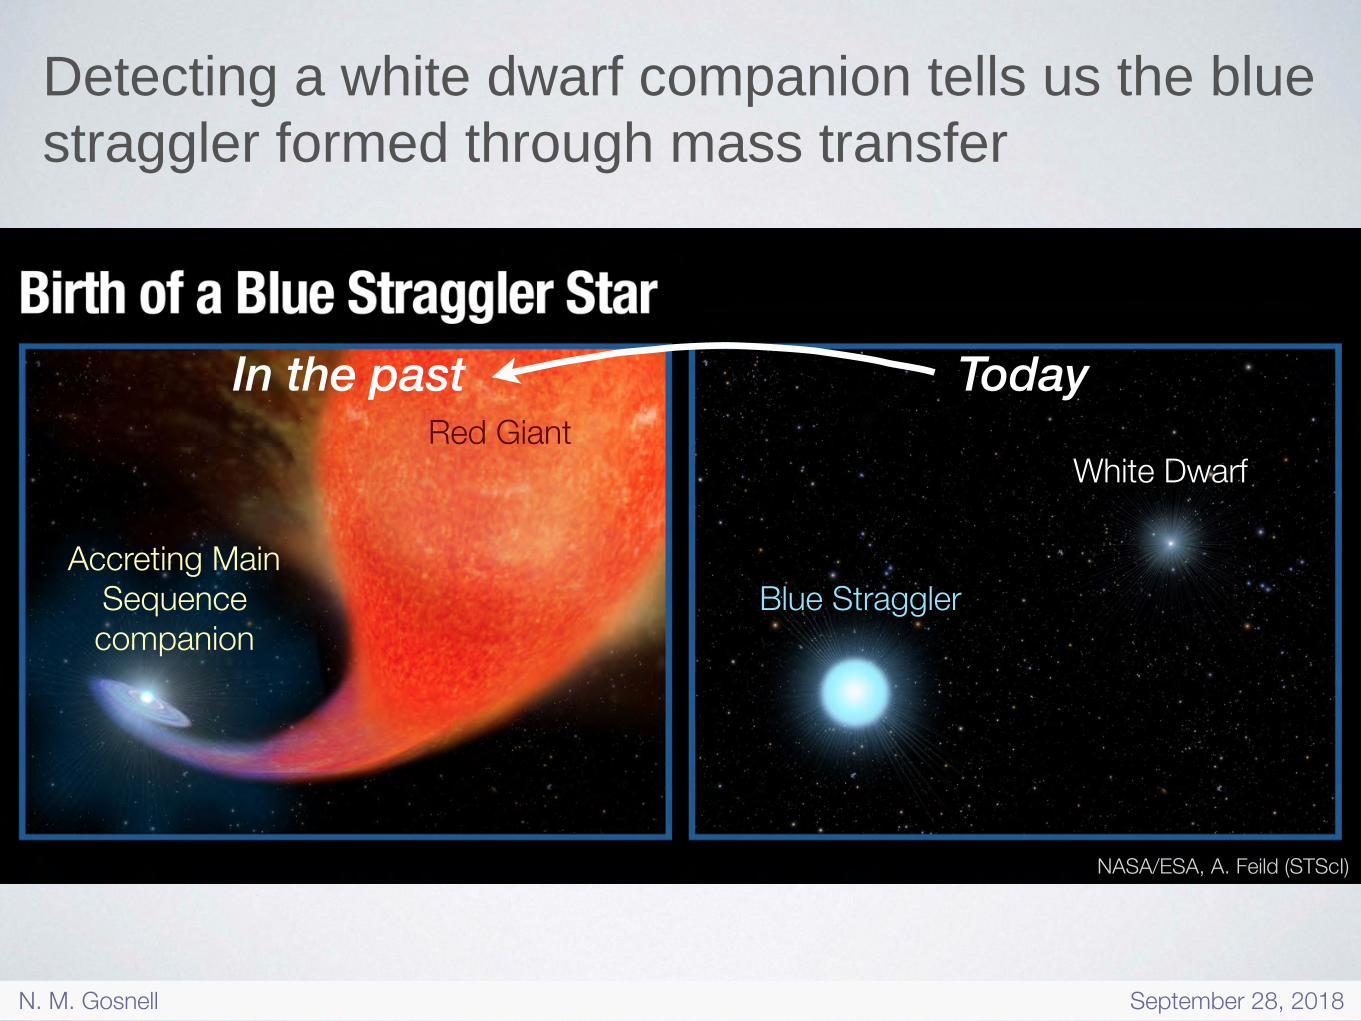
Detecting a white dwarf companion tells us the blue straggler formed through mass transfer
NASA/ESA, A. Feild (STScI)
Red Giant
Accreting Main Sequence companion
Blue Straggler
White Dwarf
TodayIn the past
N. M. Gosnell September 28, 2018
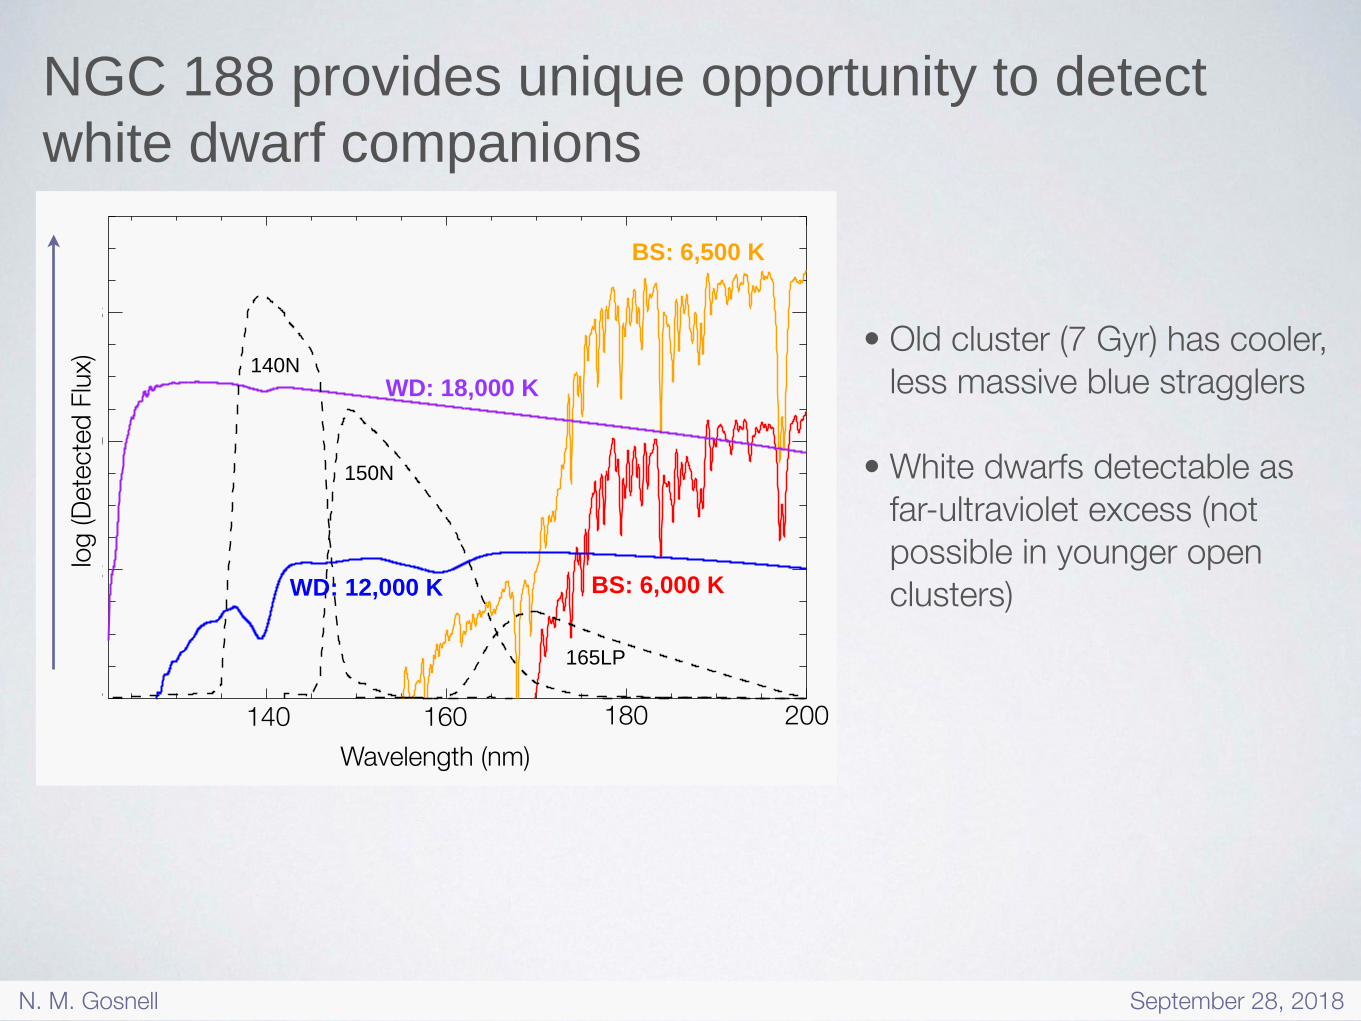
NGC 188 provides unique opportunity to detect white dwarf companions
1400 1600 1800 200024
22
20
18
1400 1600 1800 2000Wavelength
24
22
20
18
STM
AG
BS: 6,500 K
BS: 6,000 K
WD: 18,000 K
WD: 12,000 K
140N
150N
165LP
• Old cluster (7 Gyr) has cooler, less massive blue stragglers
• White dwarfs detectable as far-ultraviolet excess (not possible in younger open clusters)
140 160 180 200Wavelength (nm)
log
(Det
ecte
d Flu
x)
N. M. Gosnell September 28, 2018
0 1 2 3 424
23
22
21
20
19
0 1 2 3 4F150N - F165LP
24
23
22
21
20
19F1
50N
99.73%
99.73%
99.73%
95.45
%
95.45%
68%
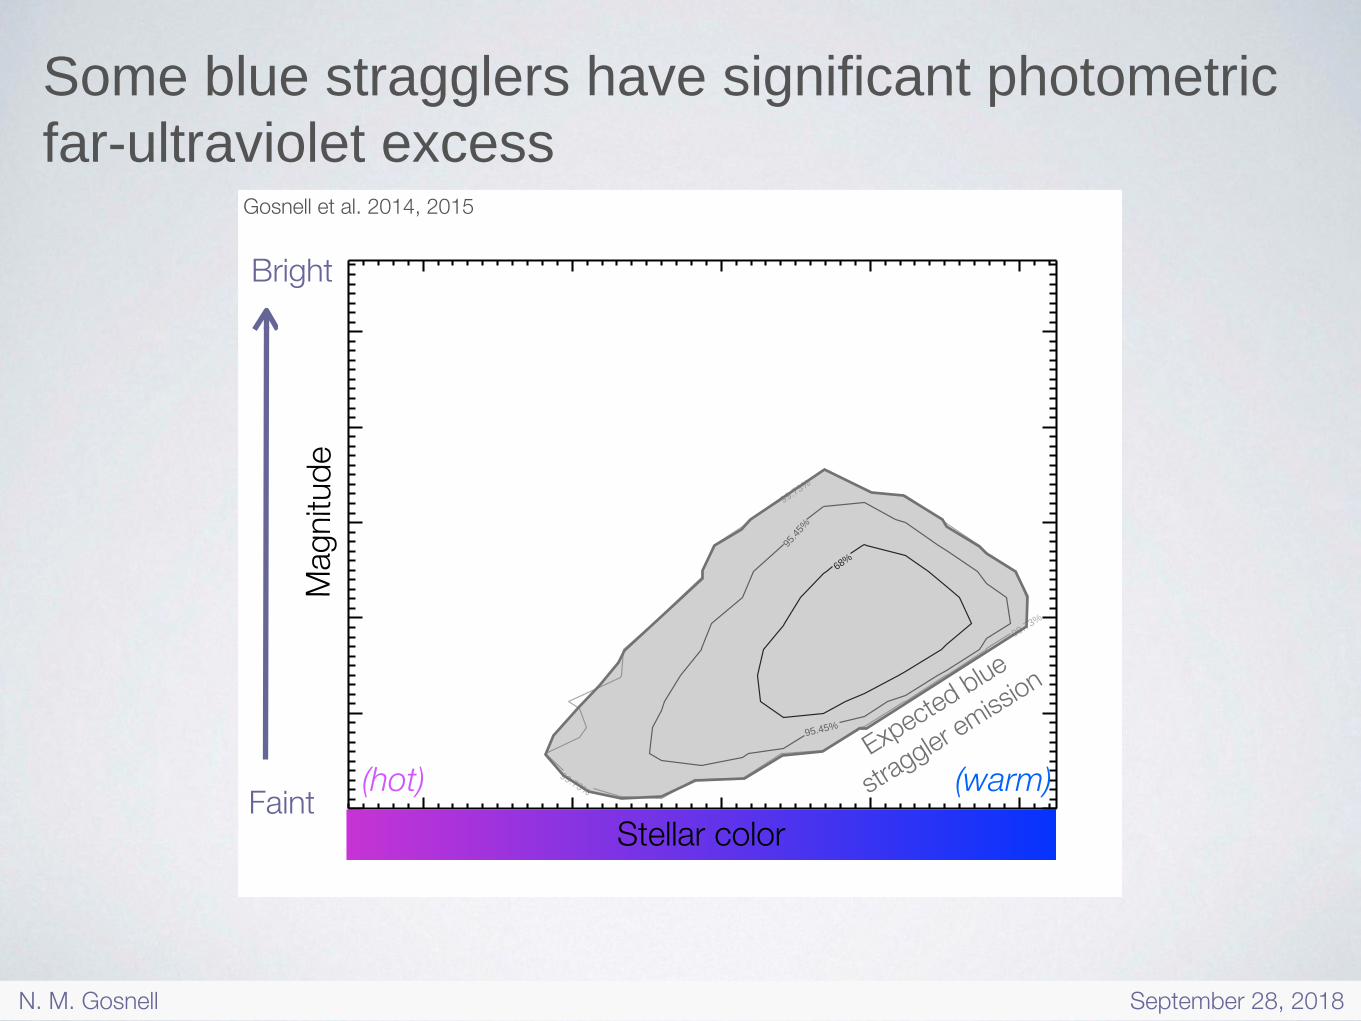
Expected blue
straggler emissio
n
Gosnell et al. 2014, 2015
Bright
Faint
Mag
nitud
e
Stellar color
Some blue stragglers have significant photometric far-ultraviolet excess
(warm)(hot)
N. M. Gosnell September 28, 2018
0 1 2 3 424
23
22
21
20
19
0 1 2 3 4F150N - F165LP
24
23
22
21
20
19F1
50N
99.73%
99.73%
99.73%
95.45
%
95.45%
68%
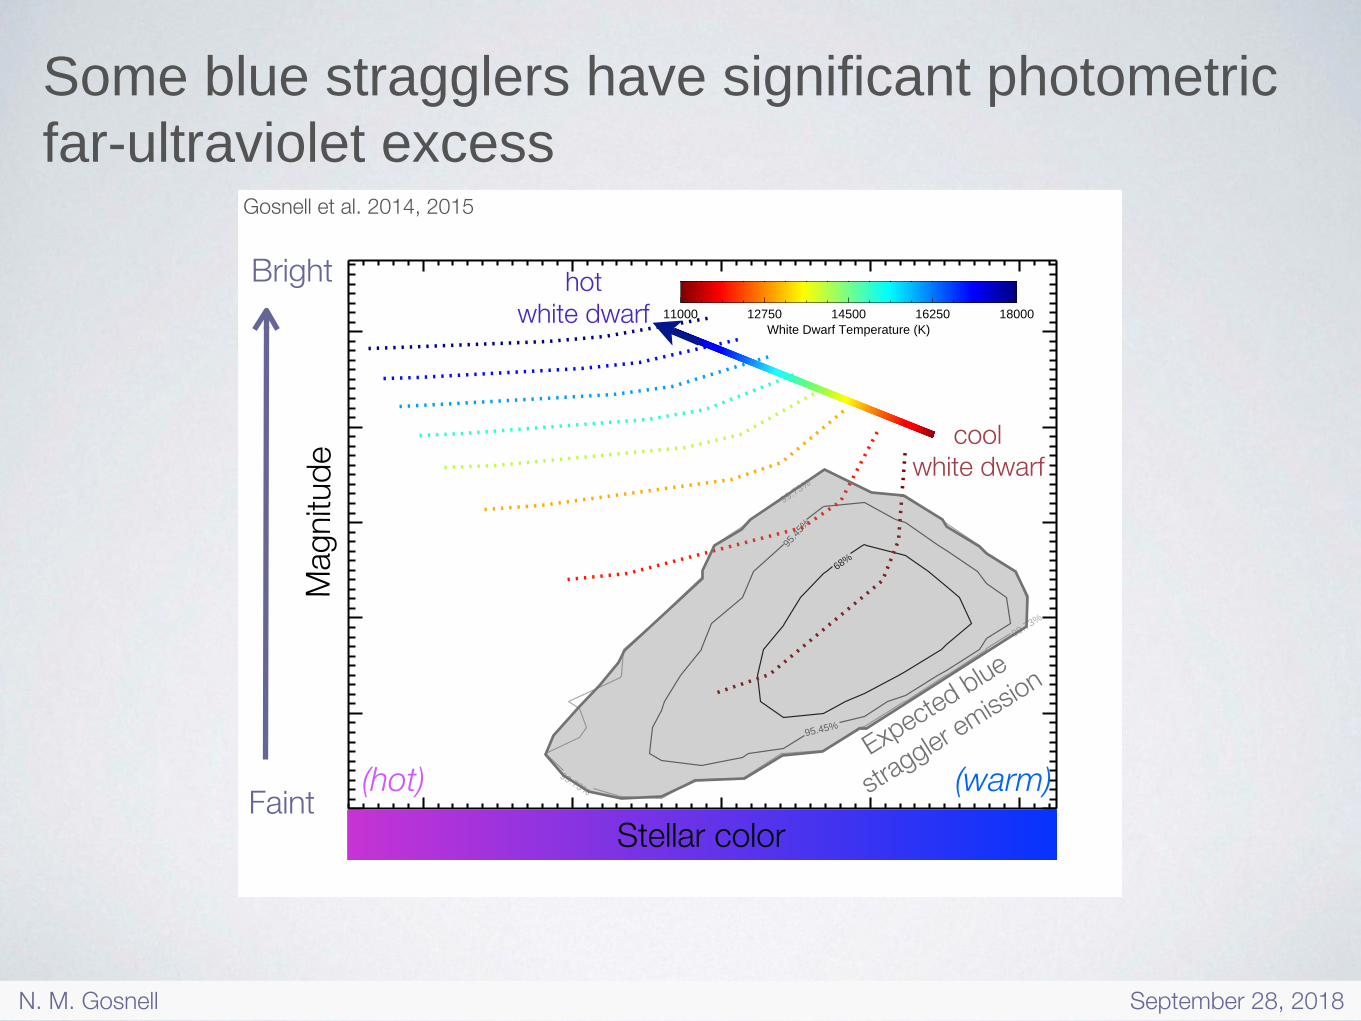
11000 12750 14500 16250 18000White Dwarf Temperature (K)
Expected blue
straggler emissio
n
cool white dwarf
hot white dwarf
Gosnell et al. 2014, 2015
Bright
Stellar colorFaint
Mag
nitud
e
Some blue stragglers have significant photometric far-ultraviolet excess
(warm)(hot)
N. M. Gosnell September 28, 2018

0 1 2 3 424
23
22
21
20
19
0 1 2 3 4F150N - F165LP
24
23
22
21
20
19F1
50N
99.73%
99.73%
99.73%
95.45
%
95.45%
68%
11000 12750 14500 16250 18000White Dwarf Temperature (K)
cool white dwarf
hot white dwarf
Expected blue
straggler emissio
n
Gosnell et al. 2014, 2015
Bright M
agnit
ude
Stellar colorFaint
Some blue stragglers have significant photometric far-ultraviolet excess
(warm)(hot)
N. M. Gosnell September 28, 2018
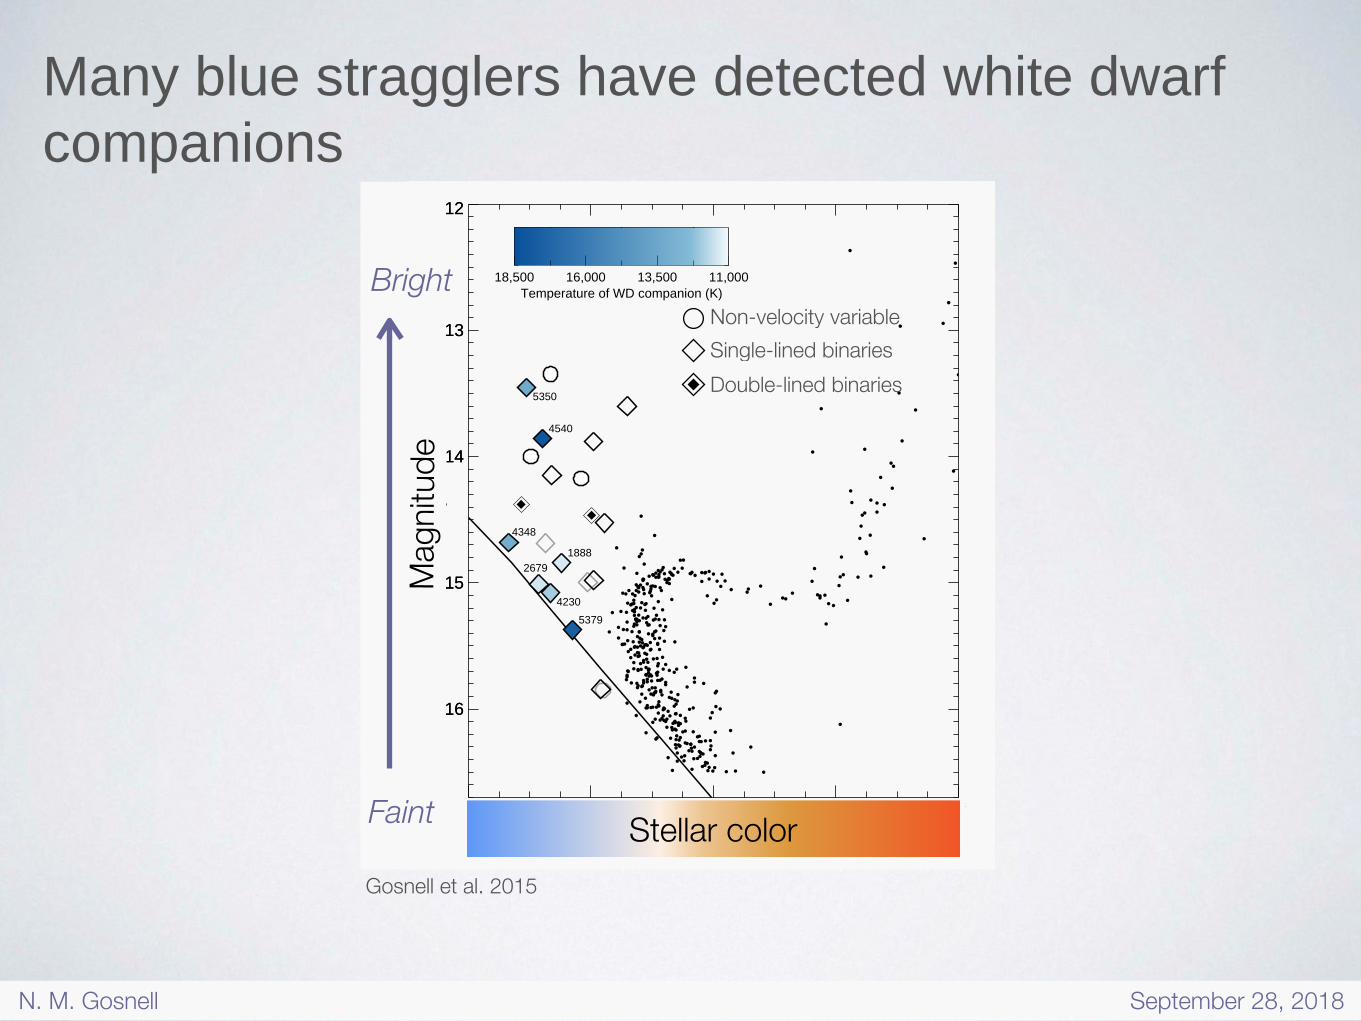
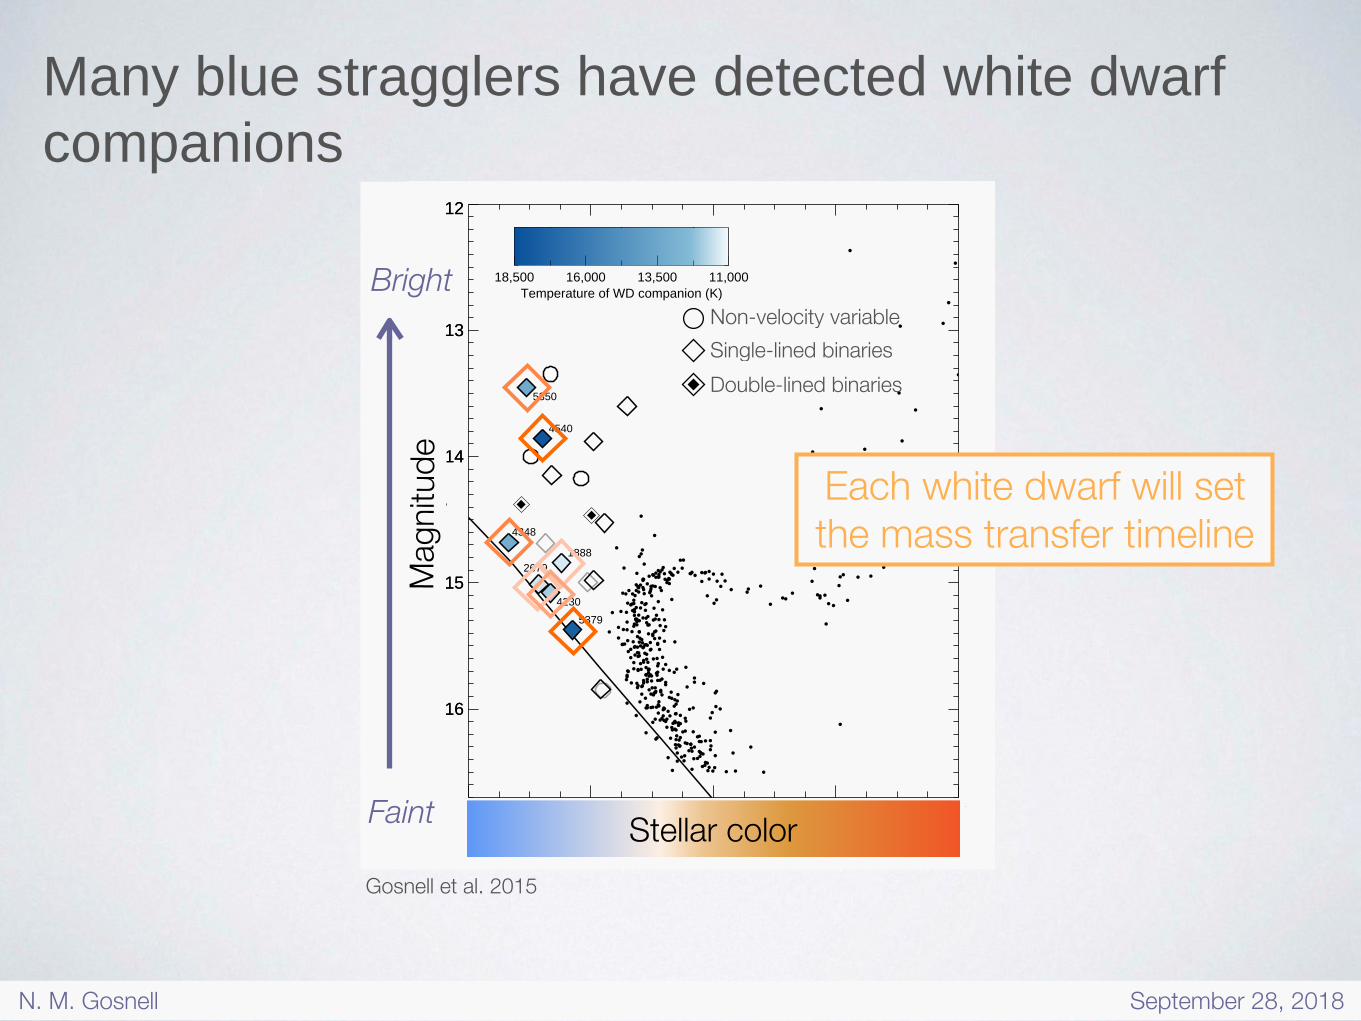
Many blue stragglers have detected white dwarf companions
Gosnell et al. 2015
0.4 0.6 0.8 1.0 1.2
16
15
14
13
12
0.4 0.6 0.8 1.0 1.2B - V
16
15
14
13
12
V
18,500 16,000 13,500 11,000Temperature of WD companion (K)
18882679
4230
4348
4540
5350
5379
B – V
V
Non-velocity variableSingle-lined binariesDouble-lined binaries
Stellar color
Mag
nitud
e
Bright
Faint
N. M. Gosnell September 28, 2018
Many blue stragglers have detected white dwarf companions
Gosnell et al. 2015
0.4 0.6 0.8 1.0 1.2
16
15
14
13
12
0.4 0.6 0.8 1.0 1.2B - V
16
15
14
13
12
V
18,500 16,000 13,500 11,000Temperature of WD companion (K)
18882679
4230
4348
4540
5350
5379
B – V
V
Non-velocity variableSingle-lined binariesDouble-lined binaries
Stellar color
Mag
nitud
e
Bright
Faint
Each white dwarf will set the mass transfer timeline
N. M. Gosnell September 28, 2018
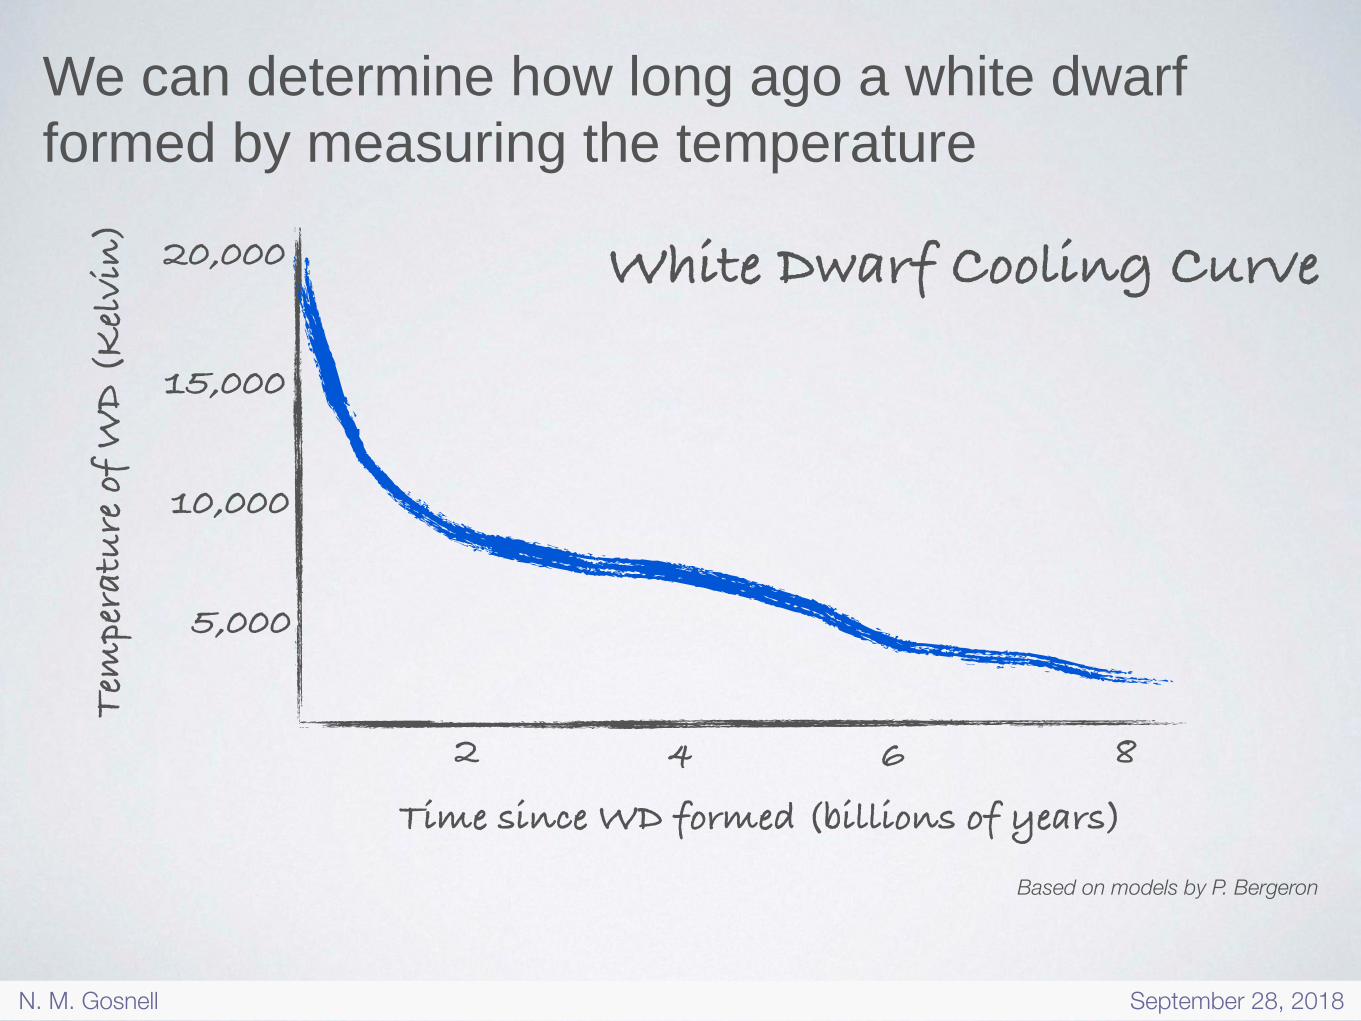
We can determine how long ago a white dwarf formed by measuring the temperature
Based on models by P. Bergeron
White Dwarf Cooling Curve
Time since WD formed (billions of years)
2 4 6 8
20,000
15,000
10,000
5,000
Tem
pera
ture
of
WD
(K
elvi
n)
N. M. Gosnell September 28, 2018
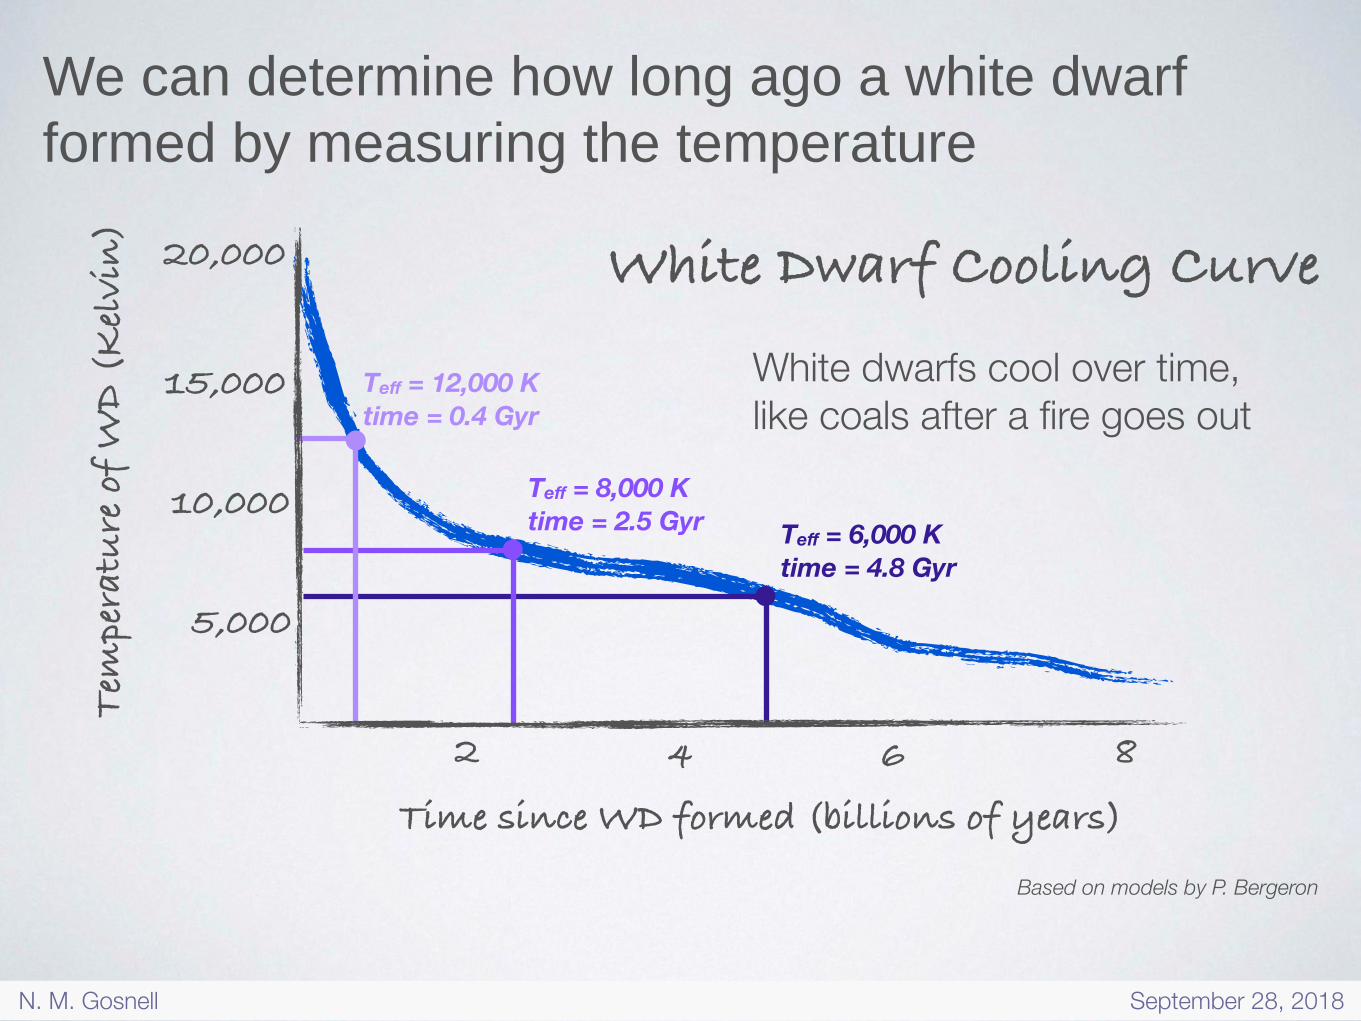
We can determine how long ago a white dwarf formed by measuring the temperature
Teff = 12,000 K time = 0.4 Gyr
Teff = 8,000 K time = 2.5 Gyr Teff = 6,000 K
time = 4.8 Gyr
White dwarfs cool over time, like coals after a fire goes out
Based on models by P. Bergeron
White Dwarf Cooling Curve
Time since WD formed (billions of years)
2 4 6 8
20,000
15,000
10,000
5,000
Tem
pera
ture
of
WD
(K
elvi
n)
N. M. Gosnell September 28, 2018
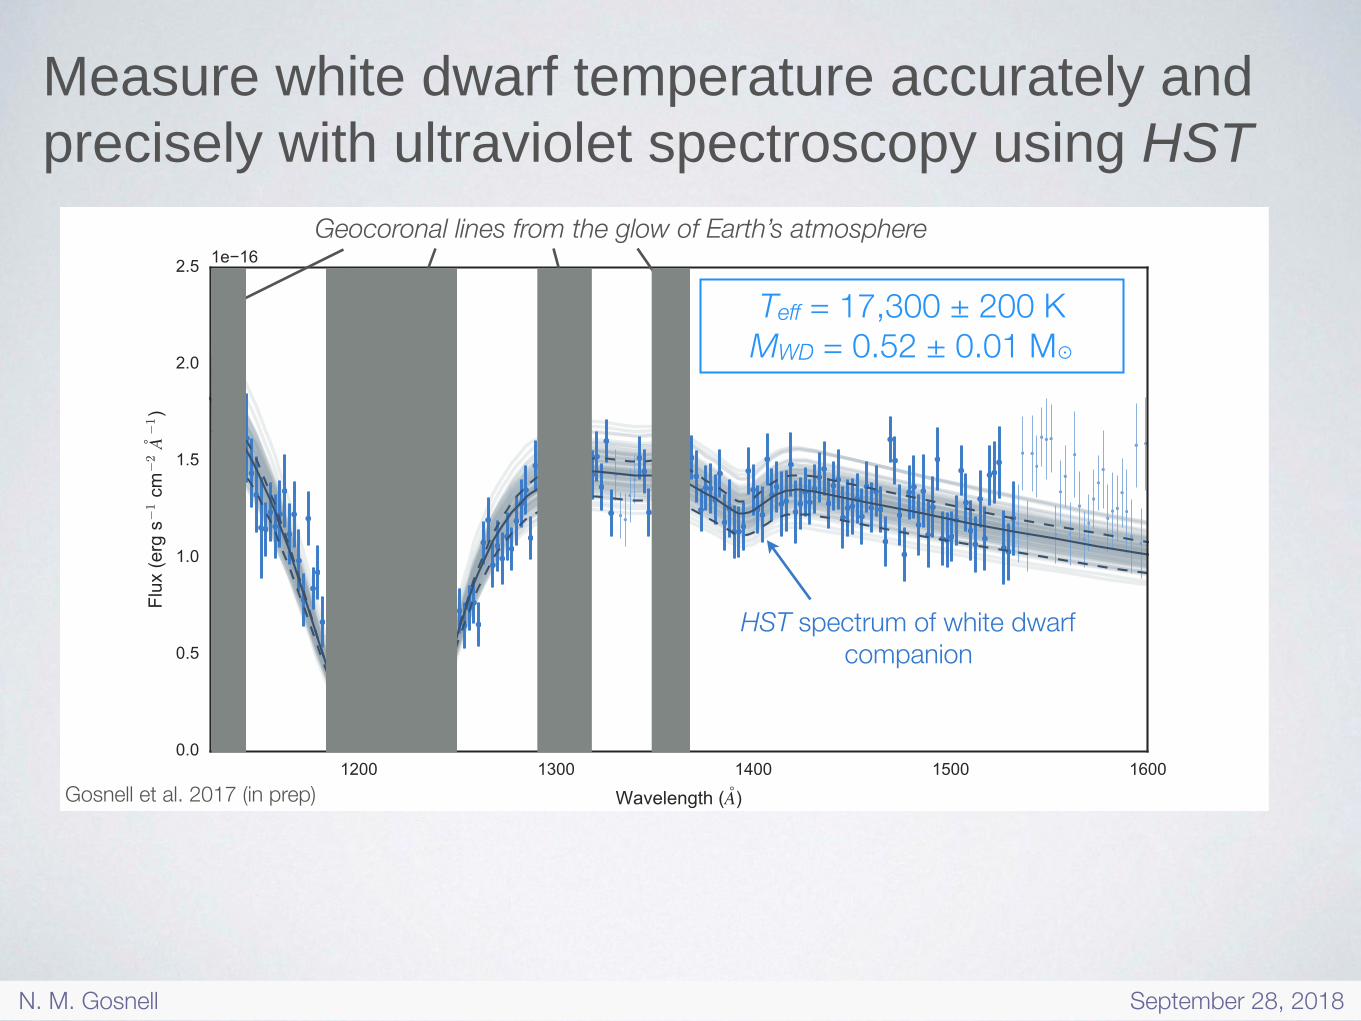
Measure white dwarf temperature accurately and precisely with ultraviolet spectroscopy using HST
Geocoronal lines from the glow of Earth’s atmosphere
Teff = 17,300 ± 200 K MWD = 0.52 ± 0.01 M⊙
HST spectrum of white dwarf companion
Gosnell et al. 2017 (in prep)
N. M. Gosnell September 28, 2018

We can determine how long ago a white dwarf formed by measuring the temperature
Time since WD formed (billions of years)
2 4 6 8
20,000
15,000
10,000
5,000
This white dwarf formed only 100 million years ago!
➔ mass transfer ended 100 Myr ago
Tem
pera
ture
of
WD
(K
elvi
n)
Based on models by P. Bergeron
White Dwarf Cooling Curve
N. M. Gosnell September 28, 2018

Observationally-established mass transfer histories constrain models of mass transfer physics
Mass of primary star: 1.2 M⊙
Mass of secondary star:
1.0 M⊙
Mass of WD: 0.5 M⊙
Mass of blue straggler: 1.3 M⊙
Amount of mass
transferred: 0.3 M⊙
Today110 Myr ago
Binary period: 1600 days
Binary period: 1100 days
???
NASA/ESA, A. Feild (STScI)
We know starting and ending points, now we need to fix the mass transfer physics in the middle
N. M. Gosnell September 28, 2018

Observationally-established mass transfer histories constrain models of mass transfer physics
Today110 Myr ago
NASA/ESA, A. Feild (STScI)
We know starting and ending points, now we need to fix the mass transfer physics in the middle, using MESA (Paxton et al. 2010)
Mass of primary star: 1.2 M⊙
Mass of secondary star:
1.0 M⊙
Mass of WD: 0.52 M⊙
Mass of blue straggler: 1.3 M⊙
Amount of mass
transferred: 0.3 M⊙
Binary period: 1600 days
Binary period: 1100 days
N. M. Gosnell September 28, 2018
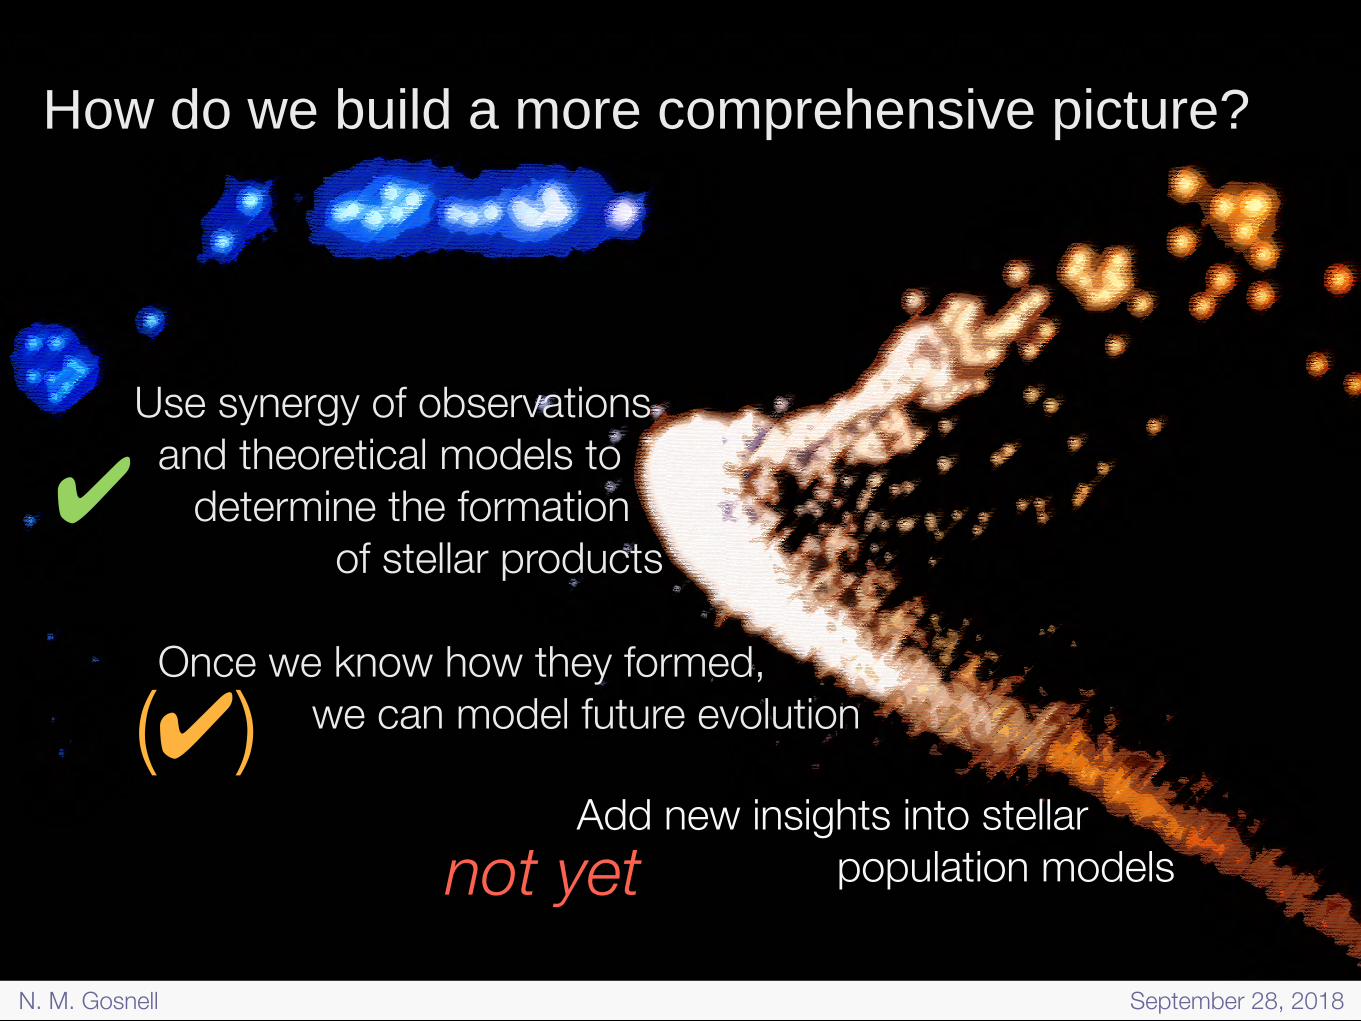
How do we build a more comprehensive picture?
Use synergy of observations and theoretical models to determine the formation of stellar products
Once we know how they formed, we can model future evolution
Add new insights into stellar population models
✔
(✔)not yet
N. M. Gosnell September 28, 2018
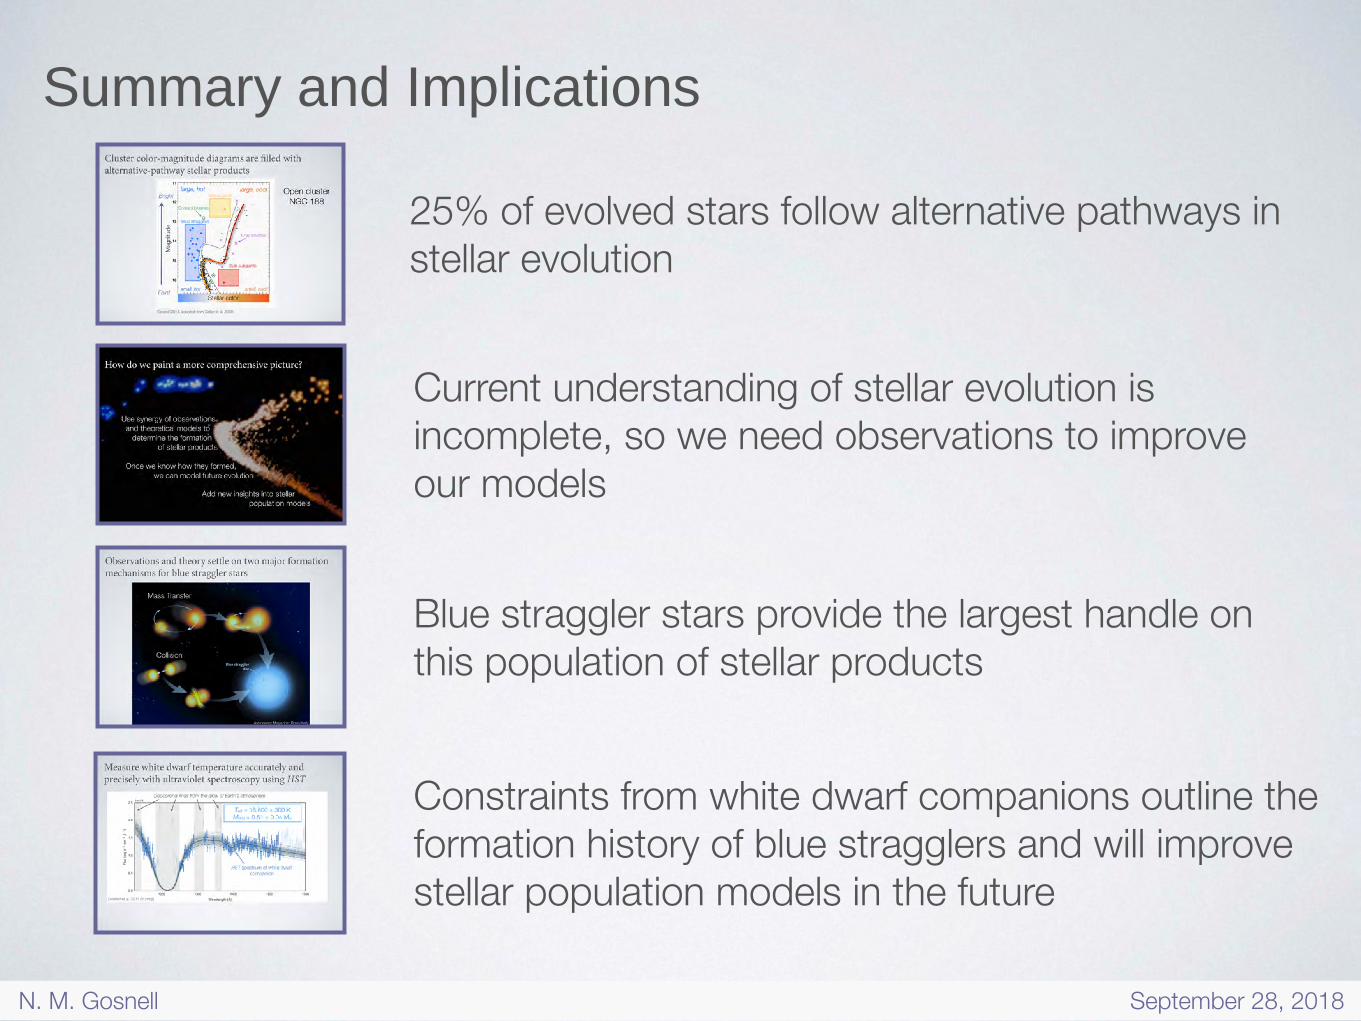
Summary and Implications
25% of evolved stars follow alternative pathways in stellar evolution
Current understanding of stellar evolution is incomplete, so we need observations to improve our models
Blue straggler stars provide the largest handle on this population of stellar products
Constraints from white dwarf companions outline the formation history of blue stragglers and will improve stellar population models in the future
N. M. Gosnell September 28, 2018