Budgeting & Capital Investment -...
68
1 Budgeting & Capital Investment Cost Control & Reduction Management Priorities in Eye Care Delivery G.Balasubramanian IFMR [email protected] 12/01/2007
Transcript of Budgeting & Capital Investment -...

1
Budgeting & Capital InvestmentCost Control & Reduction
Management Priorities in Eye Care DeliveryG.Balasubramanian
12/01/2007

2
Agenda
• Budgeting and Capital Investment[1 hour 30 minutes]
• Cost Control & Reduction [1 hour 30 minutes]
• Underlying theme is Finance, Cost and performance
metrics and current thinking in management
• An interactive session
3
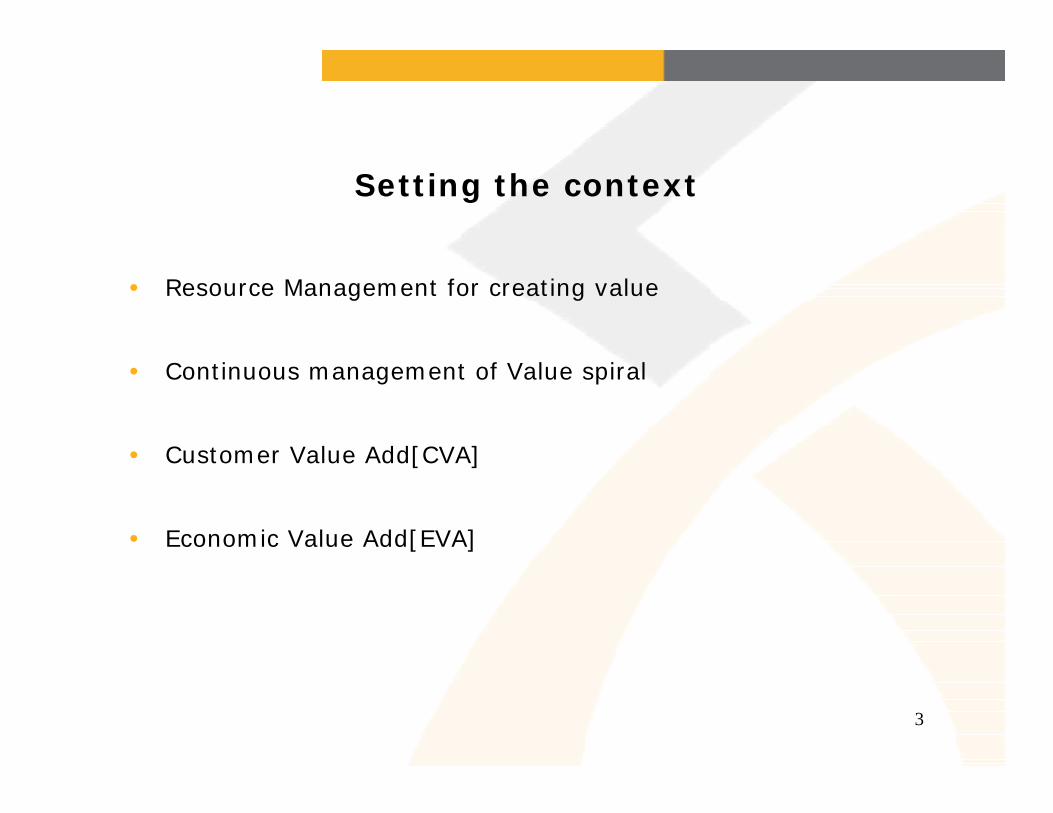
Setting the context
• Resource Management for creating value
• Continuous management of Value spiral
• Customer Value Add[CVA]
• Economic Value Add[EVA]

4
Value Network
Value of the Hospital
Strategy Financing
Resource focus Cost of capital
Performance Monitoring and Control

5
6
Value is a Spiral Value is a Spiral …… not a Chain!not a Chain!
Market InteractionsMarket Interactions
DesignDesign DevelopDevelop
DiscoverDiscover
RedefineRedefine
DeliverDeliver
Customer ValueCustomer ValueMarket Market InsightsInsights

6
Pre-requisites for success
• Define customer value[price/performance ratio]
• Balanced score card approach
• Use of Metrics and alignment
• Process centric approach[scale and consistency]
• Activity based costing and management
• Use of Technology[scale and consistency]
• Knowledge Management

7
The Five Critical C’s
• Customer
• Competition
• Competence
• Cost
• Change
• Know your customer, Know your product and Know your
competitor and know your cost

8
Role of Finance & Accounting
• Accounting cycle, income statement and Balance sheet
• Cost accounting and management

9
Year 1 Year 2Shareholders funds 7692 12193Long term debt 2750 3056Total 10442 15249Next fixed assets 4073 5160Current assets Inventories 4032 8220 Accounts receivable 5227 7380 Cash 1617 2020
10876 17620Current liabilities Creditors 2479 4033 Accrued expenses 2028 3498
4507 7531Net current assets 6369 10089Total 10442 15249
Balancesheet as onJackson Hospitals
(Rupees Lakhs)

10
Year 1 Year 2Net sales 32513 48769Cost of goods sold 19183 29700
Gross profit 13330 19069operating expenses 10758 16541Interest expenses 361 517
Profit before tax 2211 2011tax 1040 704Profit after tax 1171 1307
Profit and Loss accountJackson Hospitals
(Rupees Lakhs)

11
Performance Summary
ROS 3.60% 2.68%ATO 3.11 3.20Leverage 1.36 1.25RON 15% 11%

12
Understanding Cost behavior
Cataract Surgical Fixed cost per Variable cost Total cost perVolume per year cataract per cataract cataract
500 1000 160 11601000 500 160 6601500 333 160 4932000 250 160 410
Cost per cataract Surgery at different performance levels

13
Understanding Cost behavior and management
Annual performance:Out-patient visits 20000Admissions 600Cataract/IOL surgery 500Other surgeries 50

14
Understanding Cost behavior and management
Annual expenditure(Based on costs in India expressed in US$)Fixed costs:Salary 35200Electricity 1330Maintenance 1250Other fixed costs 2220Total fixed costs 40000Variable costs(for cataract surgery only)Suture,drugs 2660IOLs(450 at US $ 6 per IOL) 2700Instruments replacement 750Stationery 230Other variable costs 660Total variable costs 7000
15
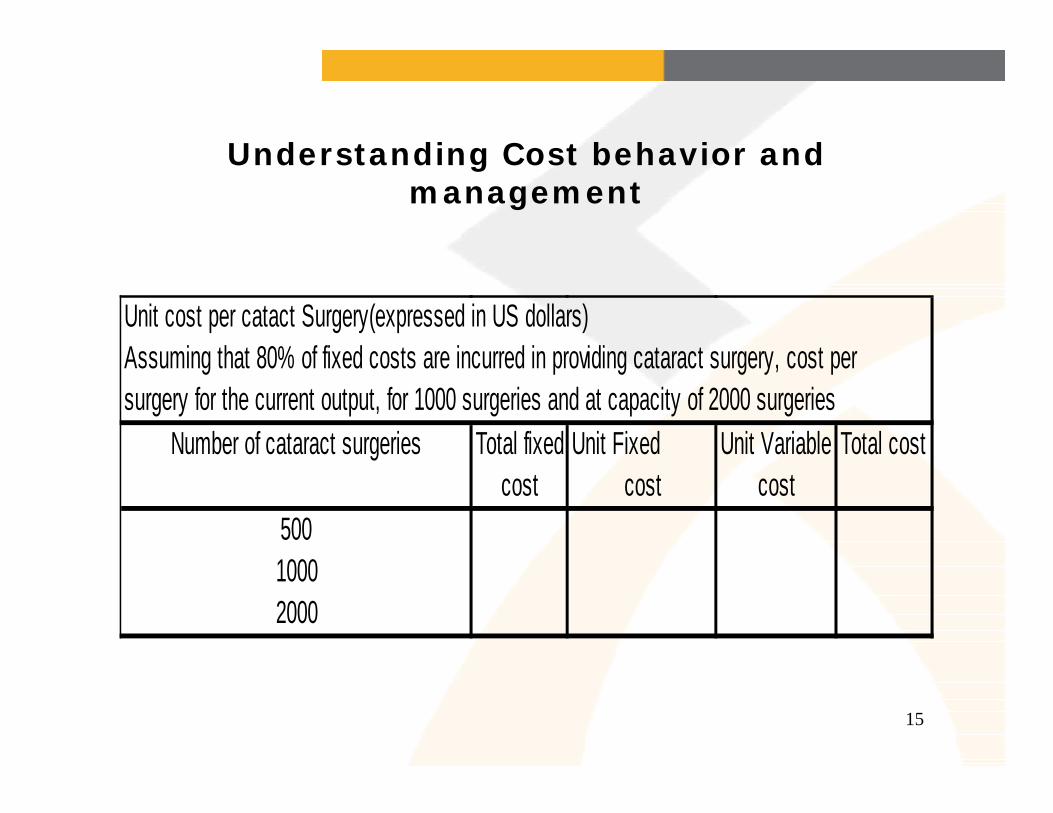
Understanding Cost behavior and management
Unit cost per catact Surgery(expressed in US dollars)Assuming that 80% of fixed costs are incurred in providing cataract surgery, cost persurgery for the current output, for 1000 surgeries and at capacity of 2000 surgeries
Number of cataract surgeries Total fixed Unit Fixed Unit Variable Total costcost cost cost
50010002000

16
Understanding Cost behavior and management
Number of cataract surgeries Total fixed Unit Fixed Unit Variable Total costcost cost cost
500 32000 64 14 781000 32000 32 14 462000 32000 16 14 30

17
Understanding Cost behavior and Profit planning
Salary 420000Maintenance 1700000Electricity 380000Rent 60000Overheads 24000Depreciaiton @20% 4000000Interest @12% 2400000Fixed cost 8984000
Lasik surgical proceduresFixed expenses

18
Understanding Cost behavior and Profit planning
Mocrokeratome blade 1000Gas 220Disposables 50Medical supplies 50Variable cost per procedure 1320Procedure per year 800Variable cost per year 1056000
Total Variable expenses
19
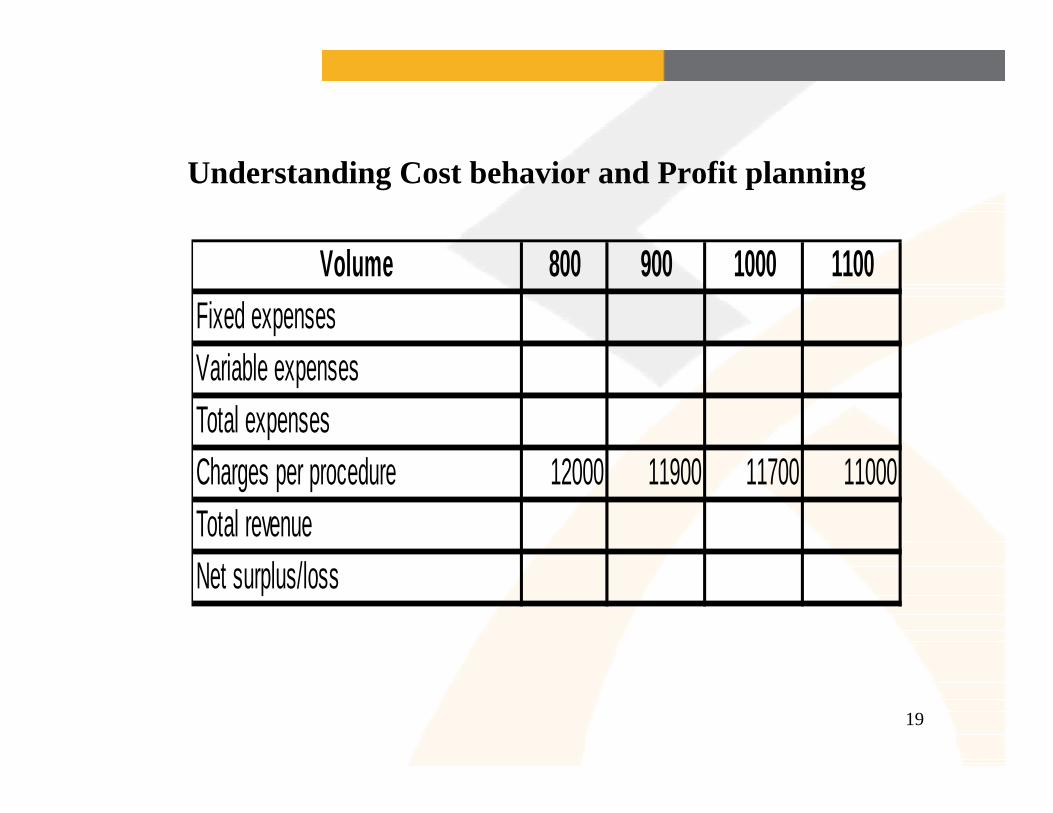
Understanding Cost behavior and Profit planning
Volume 800 900 1000 1100Fixed expensesVariable expensesTotal expensesCharges per procedure 12000 11900 11700 11000Total revenueNet surplus/loss

20
Understanding Cost behavior and Profit planning
Volume 800 900 1000 1100Fixed expenses 8984000 8984000 8984000 8984000Variable expenses 1056000 1188000 1320000 1452000Total expenses 10040000 10172000 10304000 10436000Charges per procedure 12000 11900 11700 11000Total revenue 9600000 10710000 11700000 12100000Net surplus/loss -440000 538000 1396000 1664000

21
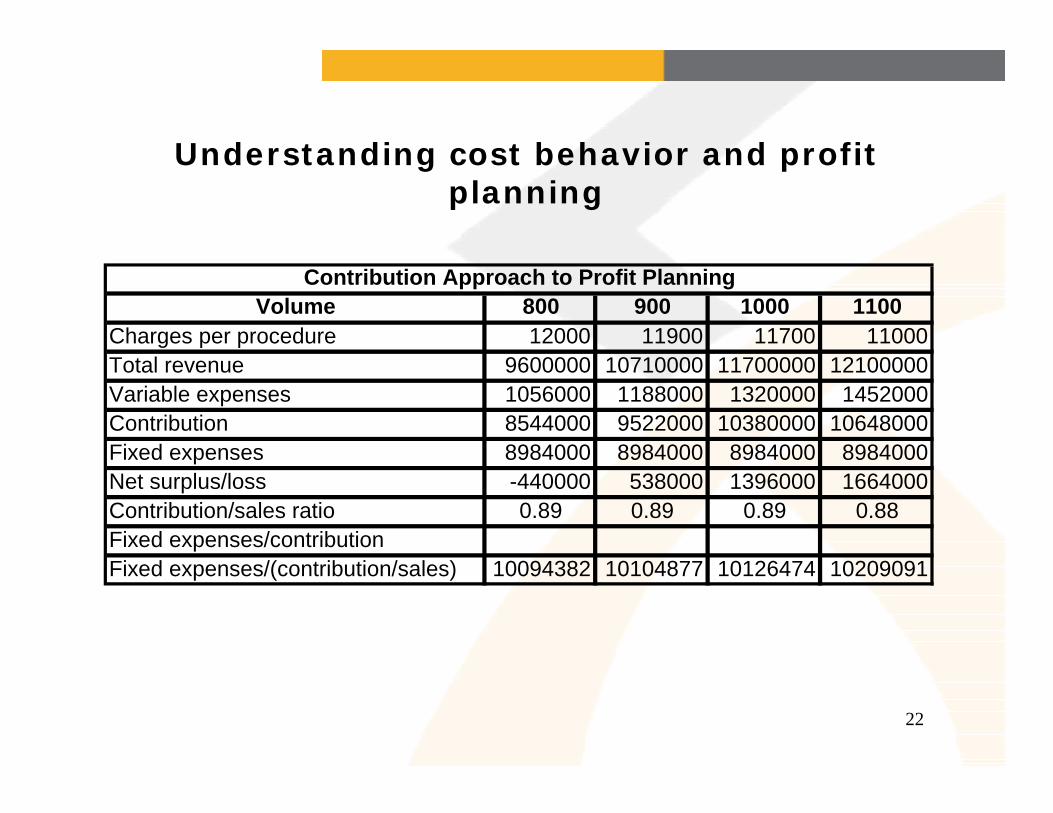
Understanding Cost behavior and Profit planning
Volume 800 900 1000 1100Charges per procedure 12000 11900 11700 11000Total revenueVariable expensesContributionFixed expensesNet surplus/lossContribution/sales ratioFixed expenses/contribution Fixed expenses/(contribution/sales)
Contribution Approach to Profit Planning
22
Understanding cost behavior and profit planning
Volume 800 900 1000 1100Charges per procedure 12000 11900 11700 11000Total revenue 9600000 10710000 11700000 12100000Variable expenses 1056000 1188000 1320000 1452000Contribution 8544000 9522000 10380000 10648000Fixed expenses 8984000 8984000 8984000 8984000Net surplus/loss -440000 538000 1396000 1664000Contribution/sales ratio 0.89 0.89 0.89 0.88Fixed expenses/contribution Fixed expenses/(contribution/sales) 10094382 10104877 10126474 10209091
Contribution Approach to Profit Planning

23
Test-1
• Charges per procedure-10000
• Variable cost per procedure-4000
• Fixed Expenses-8000000
• What is the number of procedures to be performed to break
even?
• What is the number of procedures to be performed to make a
profit of 1000000
• What is the next logical question?

24
Test-2
• St.Vincent Hospital has overall variable cost of 30% of
total revenue and fixed cost of 42 million per year
• Compute the breakeven point in revenue terms
• If the capacity is 50000 patient days, what is the
average daily revenue per patient to breakeven

25
Test-3
Period-1 Period-2Revenue 1000000 1400000Profits 50000 130000
What is the contribution/sales ratio?
What is the contribution at sales of 1500000
What is the Fixed cost?
What is the break even point?

26
Profit Planning approach
Resources:Facilities:Beds 50Equipped Operation Theater 1IOL Surgery sets 2Staff:Opthalmologists 2Paramedics 9Housekeeping staff 6Office & Security staff 6Capacity of the above resources:From bed capacity perspective: 4000 surgeries 80 surgeries per bedFrom Staff perspective: 2000 surgeries 1000 surgeries per surgeon

27
Budgeting nuances
• Incremental budgeting
• Performance budgeting
• Zero base budgeting
• Activity based budgeting
• Target costing

28

29

30

31
Capital Budgeting
• Long term investment decisions which provides the base
for revenue generation
• Examples-investment in technology, building,
equipments etc
• Decisions result in cash flows over a period of time and
hence analysis of time value of money is the basis

32
TIME VALUE OF MONEY

33
What is Time value of money?
• Business transactions results in cash flows
• Cash flows can mean cash-inflows or cash-outflows
• Cash flows occurring at different points of time have
different values today
• Todays value is known as present value
• Hence, timing and magnitude becomes important
criteria for evaluating alternatives

34
How do we measure time value of money?
Underlying principle
Earlier the cash flow higher its present value

35
How do we measure time value of money?
• Underlying concepts– Future value Compounding– Present value Discounting– Discount rate– Time
36
What is future value?
• You are investing Rs. 10000 today in a bond for 5 years
at 14 % rate of interest compounded annually. How
much will you receive after five years?

37
How to compute future value?
Future value (FV)= P(1+r)n
P=Present value
r= rate of interest or discount
n= number of periods

38
How to compute future value?
P=10000, r=.14,n=5
FV=10000(1+.14)5

39
How do we measure time value of money?
• What is the amount of cash flow involved?
• When is it occurring?
• What is the discount rate?(cost of capital)

40
How to compute future value? Contd..
• In the same example, if the compounding is done every half
year, what is the future value?
If ‘m’ is the number of compounding Change r to r/m and n to nm

41
How to compute future value? Contd..
• FV=P(1+(r/m))nm
• FV=10000(1+(.14/2))(5*2)
• FV=10000(1+.07)10

42
What is the underlying principle in future value?
The underlying principle is the compound interest concept
Can you distinguish between simple and compound interest?
43
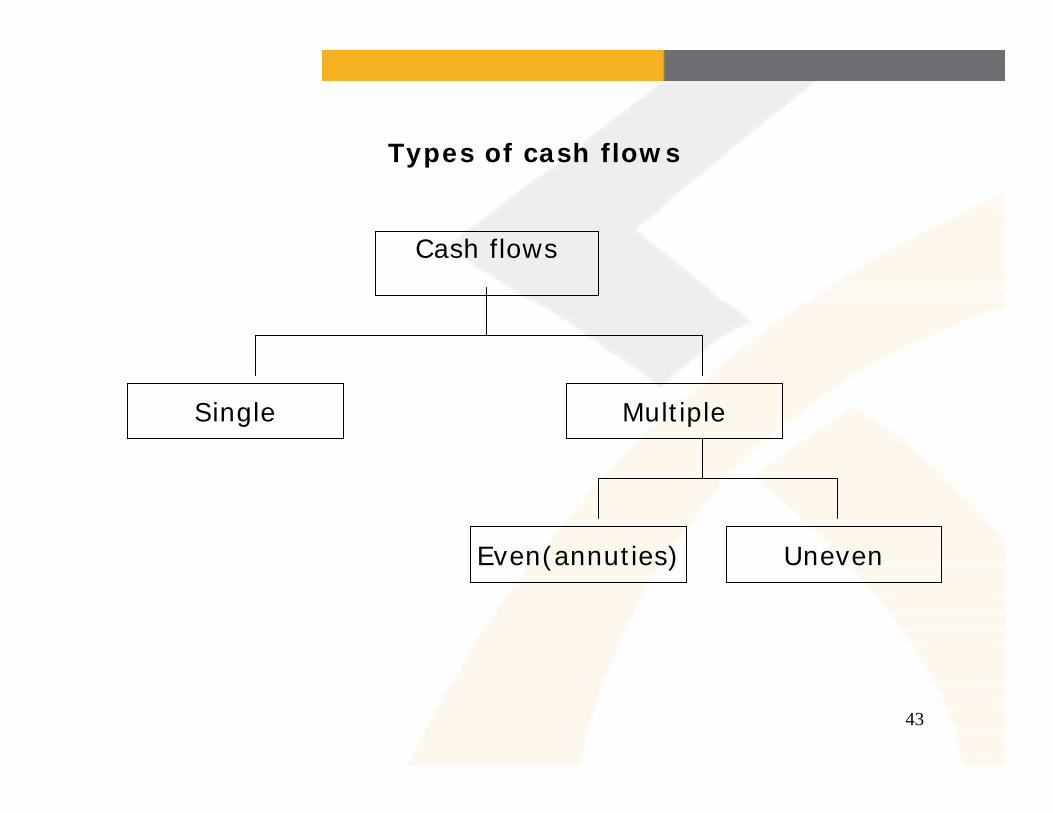
Types of cash flows
Cash flows
Single Multiple
Even(annuties) Uneven

44
Even cash flows
0 1 2 3 4 5 6
100 100 100 100 100 100
Can you think of two examples of even cash flows?

45
What is present value?
Recall future value formula
Future value(FV) = P(1+r)n
P=Present value
r= rate of interest or discount
n= number of periods?
Can we derive present value formula from future value formula?
46
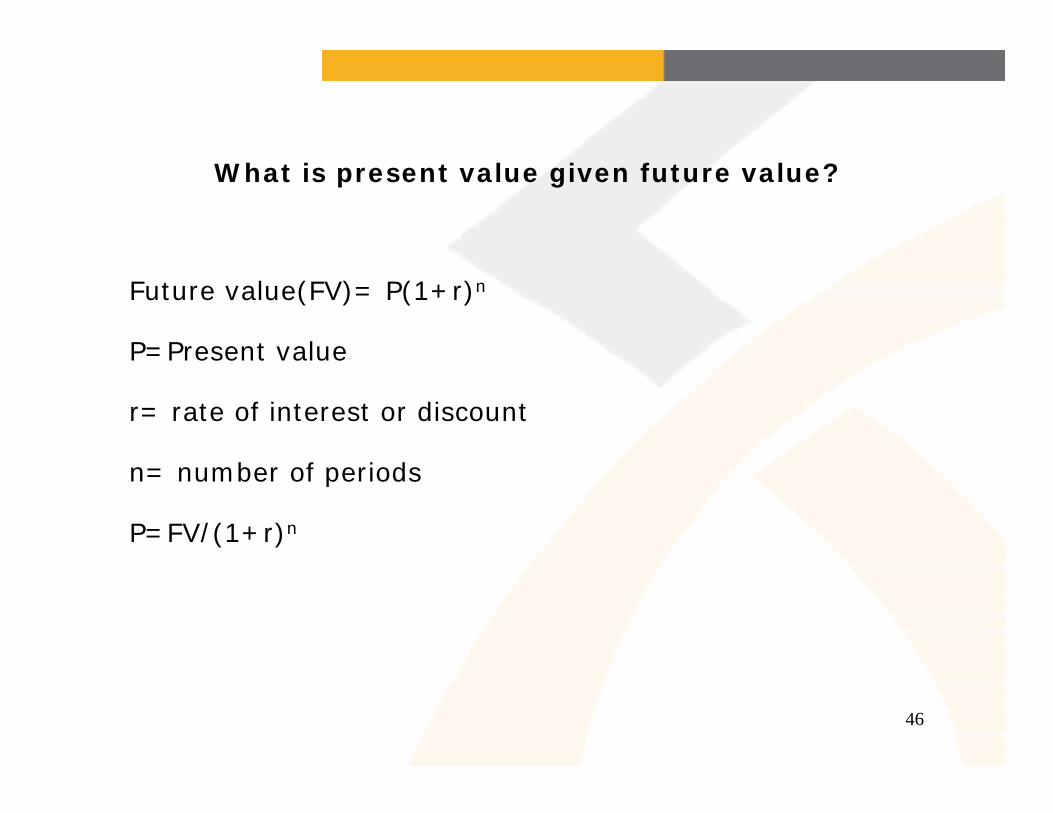
What is present value given future value?
Future value(FV)= P(1+r)n
P=Present value
r= rate of interest or discount
n= number of periods
P=FV/(1+r)n

47
What is present value?
• Your friend approaches you for a loan of Rs.10000 and
promises to repay 30000 after 5 years. How will you
evaluate your friend’s proposal?

48
What is present value?
• What is your time preference rate?
– The best return that you can get for your
investments commensurate with your risk taking
abilities
• Assume that it is 15%, you can ask what is the present
value of Rs.30000 to be received after 5 years, today.

49
What is present value?
• FV=30000, r=.15,n=5, then
• PV=FV/(1+r)n
• PV=30000/(1+.15)5

50
Future and present values
Future value
0 (10000) n
Present value
0 n
51
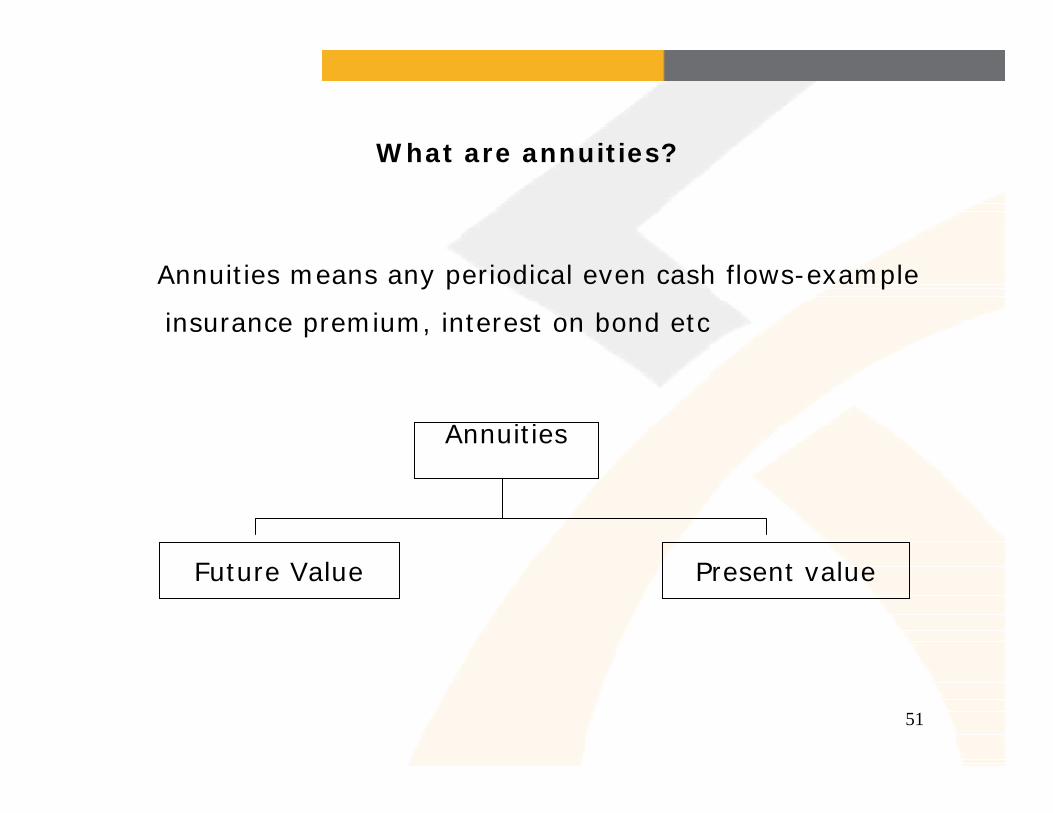
What are annuities?
Annuities means any periodical even cash flows-example
insurance premium, interest on bond etc
Annuities
Future Value Present value
52
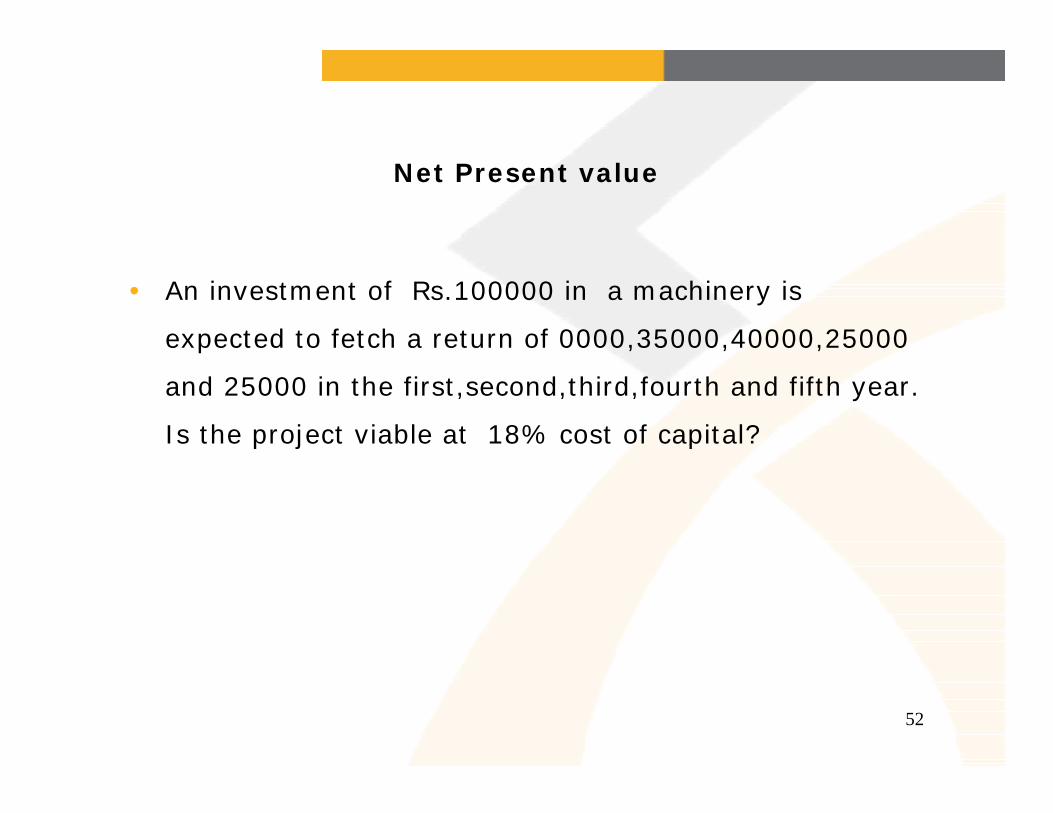
Net Present value
• An investment of Rs.100000 in a machinery is
expected to fetch a return of 0000,35000,40000,25000
and 25000 in the first,second,third,fourth and fifth year.
Is the project viable at 18% cost of capital?

53
Net Present value
Cash flow pattern
0 -100000
1 30000
2 35000
3 40000
4 25000
5 25000

54
Net present value
Decision rule
Net present value>0, project is financially viable

55
Internal rate of return(IRR)
• For the same project, what is the rate of interest at
which the project is repaying the original investment? In
other words, what is the inherent rate of interest in the
cash flow of the project? This is known as IRR.This must
be more than the cost of capital
56
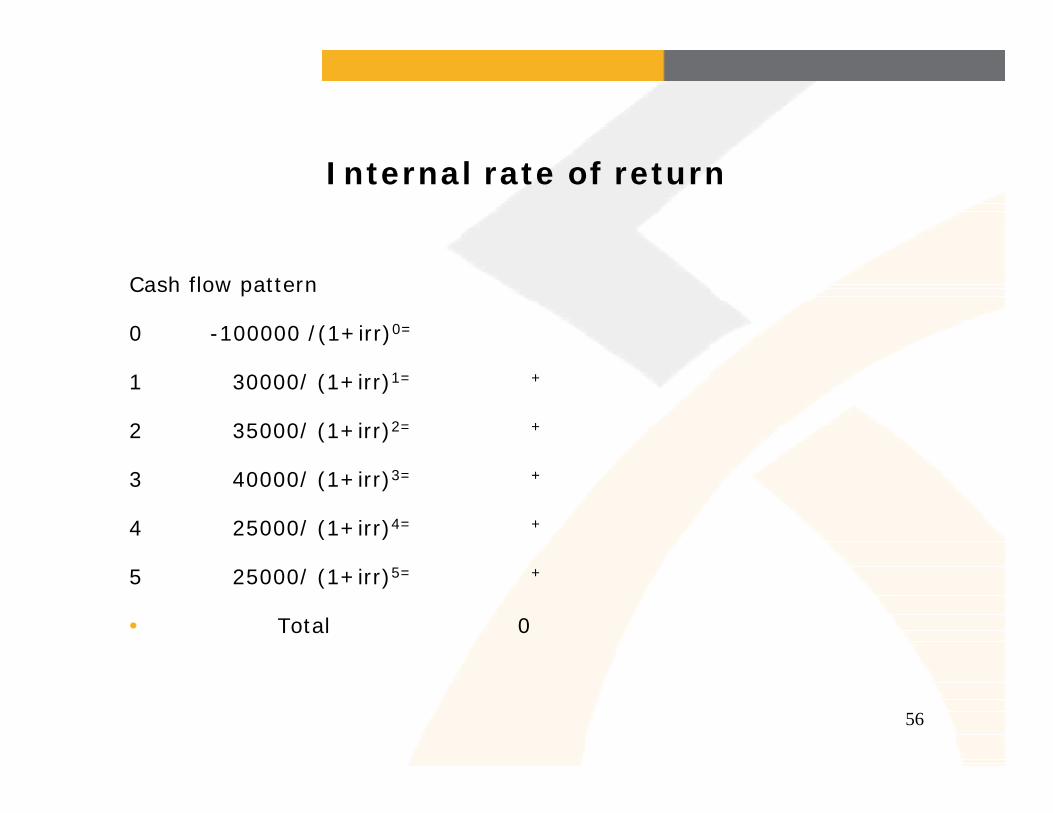
Internal rate of return
Cash flow pattern
0 -100000 /(1+irr)0=
1 30000/ (1+irr)1= +
2 35000/ (1+irr)2= +
3 40000/ (1+irr)3= +
4 25000/ (1+irr)4= +
5 25000/ (1+irr)5= +
• Total 0

57
Applications of NPV and IRR
• NPV and IRR are used to evaluate capital investment
proposals. A capital investment project will be accepted
if its NPV is positive or its IRR is greater than the cost of
capital.

58
Summary
• Are you clear about
– Compounding
– Discounting
– Discount factor,cost of capital,time pref rate
– Future value of single cash flow
– future value of annuity
– Present value of single cash flow
– Present value of annuity
– NPV and IRR

59
Capital Budgeting-illustration
Cost Details 0 1 2 3 4 5Initial costEximer laser 16555000Microkeratome 2365000Instrument sets 50000Sterliser 225000Topography m/c 946000Total investment 20141000
Capital Investment Analysis-lasik equipmentEconomics of Ophthalmic Equipment
60
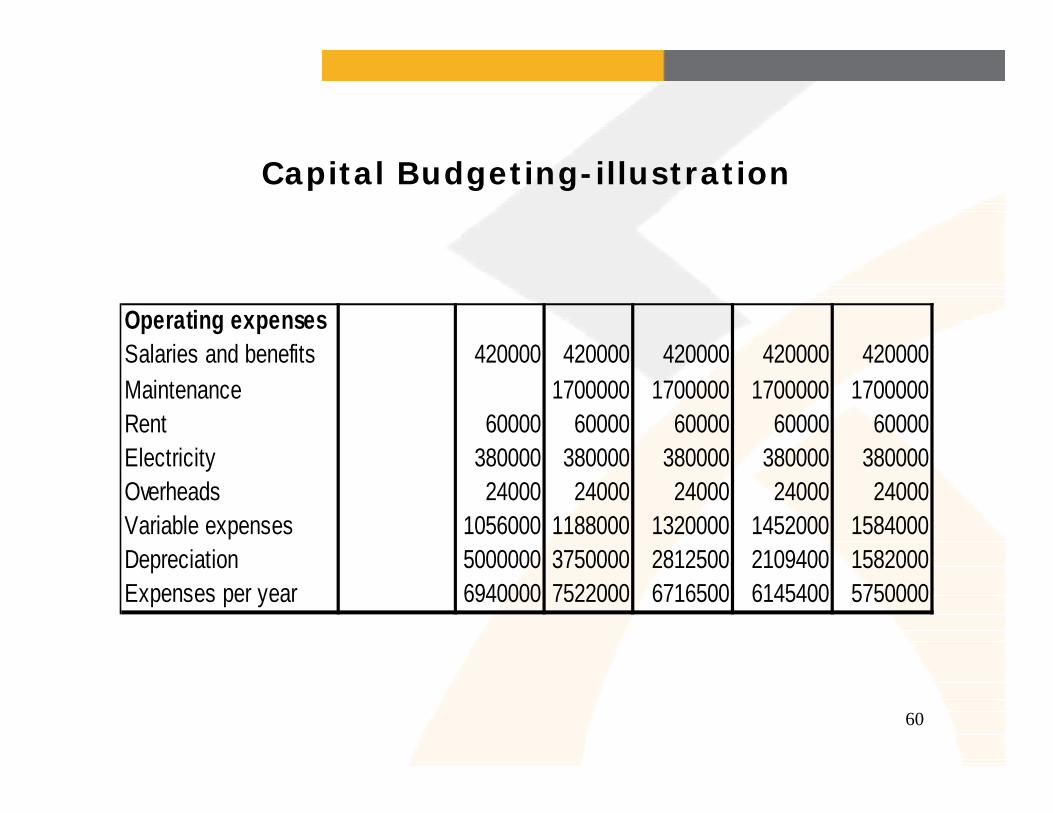
Capital Budgeting-illustration
Operating expensesSalaries and benefits 420000 420000 420000 420000 420000Maintenance 1700000 1700000 1700000 1700000Rent 60000 60000 60000 60000 60000Electricity 380000 380000 380000 380000 380000Overheads 24000 24000 24000 24000 24000Variable expenses 1056000 1188000 1320000 1452000 1584000Depreciation 5000000 3750000 2812500 2109400 1582000Expenses per year 6940000 7522000 6716500 6145400 5750000
61
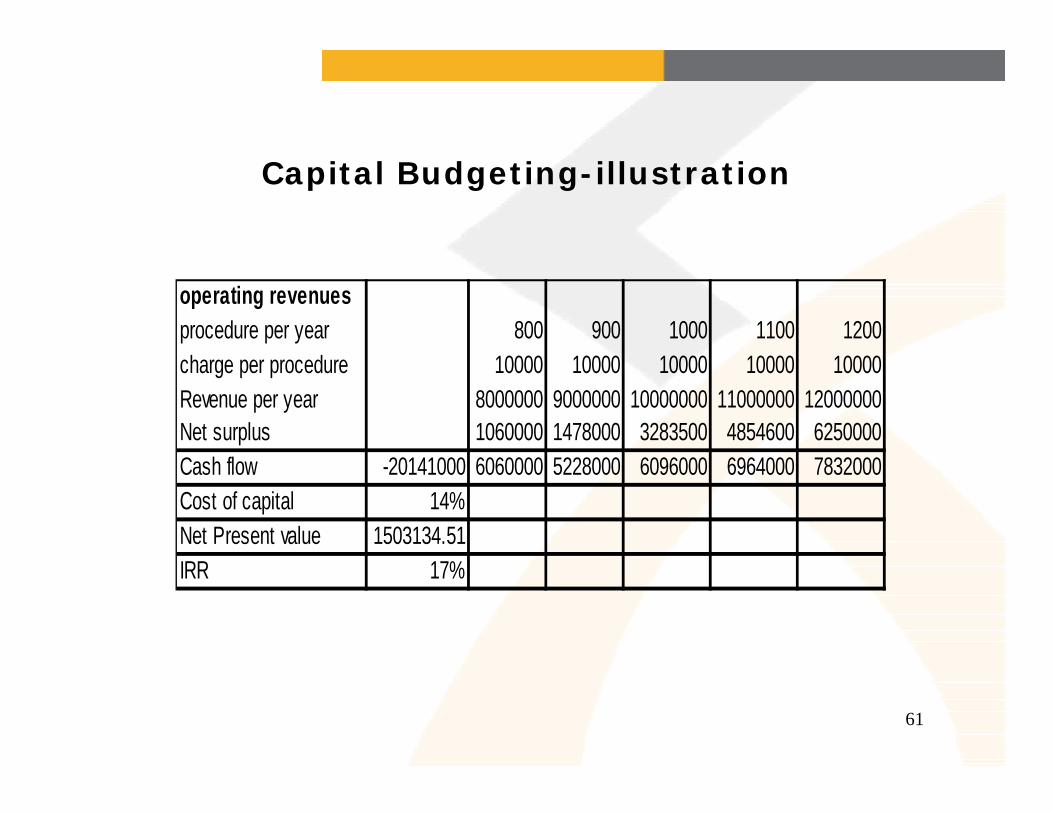
Capital Budgeting-illustration
operating revenuesprocedure per year 800 900 1000 1100 1200charge per procedure 10000 10000 10000 10000 10000Revenue per year 8000000 9000000 10000000 11000000 12000000Net surplus 1060000 1478000 3283500 4854600 6250000Cash flow -20141000 6060000 5228000 6096000 6964000 7832000Cost of capital 14%Net Present value 1503134.51IRR 17%

62
Cost Details 0 1 2 3 4 5Initial costEximer laser 16555000Microkeratome 2365000Instrument sets 50000Sterliser 225000Topography m/c 946000Total investment 20141000Operating expensesSalaries and benefits 420000 420000 420000 420000 420000Maintenance 1700000 1700000 1700000 1700000Rent 60000 60000 60000 60000 60000Electricity 380000 380000 380000 380000 380000Overheads 24000 24000 24000 24000 24000Variable expenses 1056000 1188000 1320000 1452000 1584000Depreciation 5000000 3750000 2812500 2109400 1582000Expenses per year 6940000 7522000 6716500 6145400 5750000operating revenuesprocedure per year 800 900 1000 1100 1200charge per procedure 10000 10000 10000 10000 10000Revenue per year 8000000 9000000 10000000 11000000 12000000Net surplus 1060000 1478000 3283500 4854600 6250000Cash flow -20141000 6060000 5228000 6096000 6964000 7832000Cost of capital 14%Net Present value 1503134.51IRR 17%
Capital Investment Analysis-lasik equipmentEconomics of Ophthalmic Equipment

63
Thank you

64
ABC in Healthcare
Case of Western Dialysis
• Independent non profit full service renal dialysis clinic
• Services offered-Hemo dialysis[HD] and Peritoneal
dialysis[PD]
• HD requires patients to visit the clinic
• PD allows patients to administer treatment at home

65
Revenues Total HD PD Number of patients 164 102 62
Number of treatments 34067 14343 20624Charge Per treatment 129.7 55.59Total revenue 3006775 1860287 1146488
Supply costsStandard supplies 664900 512619 152281 DirectEpisodic Supplies 310695 98680 212015Total supply costs 975595 611299 364296
Service costsGeneral overheads 785825Depreicaiton 137046 RCC methodNursing services 883280Total 1806151 1101752 704398.9Total operating expenses 2781746Net income 225029.3
Income Statement

66
HD PDAverage revenue 129.70 55.59Average cost 119.43 51.82Profit per treatment 10.27 3.77
Treatment wise Profitability

67
Total Cost DriverFacility cost 233226 square footAdministration 354682 Number of patientsCommunication system 157219 Number of treatmentsUtilities 40698 KWH
785825HD PD Total
Squarefoot 18900 11100 30000Number of patients 102 62 164Number of treatments 14343 20624 34967KWH 563295 99405 662700
HD PD TotalFacility cost 146932.4 86293.62 233226Administration 220594.9 134087.1 354682Communication system 64489.15 92729.85 157219Utilities 34593.3 6104.7 40698Depreciation 83598.06 53447.94 137046Nursing(85% :15%) 750788 132492 883280Total Operating cost 1300996 505155.2 1806151Total cost 1912295 869451.2 2781746
Phase-I ABC

68
Revised Profitability
Revised Profit statement HD PDAverage revenue 129.70 55.59Average cost 133.33 42.16Profit per treatment -3.63 13.43