Budget Strategy and Outlook 2017-18 · • net operating deficits across the budget and forward...
134
Budget Strategy and Outlook 2017-18 Budget Paper No. 2
Transcript of Budget Strategy and Outlook 2017-18 · • net operating deficits across the budget and forward...

Budget Strategy and Outlook
2017-18
Budget Paper No. 2


1
In this book, the term ‘state’ or ‘states’ includes the Australian Capital Territory and the Northern Territory, unless the context indicates otherwise.
ContentsUnder Treasurer’s Certification 3
Chapter 1 Overview 5
Chapter 2 Fiscal Outlook 9
Chapter 3 Fiscal Strategy Statement 25
Chapter 4 Risks and Contingent Liabilities 33
Chapter 5 Budget Initiatives 43
Chapter 6 Intergovernmental Financial Relations Issues 55
Chapter 7 Territory Taxes and Royalties 75
Chapter 8 The Territory Economy 93
Chapter 9 Uniform Presentation Framework 103
Appendices 123
Appendix A Classification of Entities in the Northern Territory 125
Appendix B Glossary 126

2
2017-18 Budget

3
Under Treasurer’s CertificationIn accordance with provisions of the Fiscal Integrity and Transparency Act, I certify that the financial projections included in the May 2017 Budget documentation were based on Government decisions that I was aware of or that were made available to me by the Treasurer before 25 April 2017. The projections presented here are in accordance with the Uniform Presentation Framework.
Craig GrahamUnder Treasurer26 April 2017

4
2017-18 Budget

Overview 5
Budget Strategy and Outlook
Chapter 1Overview
Budget Paper No. 2 presents whole of government financial information and related issues, and consolidates information from other Budget papers. It also meets the requirements of the Fiscal Integrity and Transparency Act and complies with the Uniform Presentation Framework, as agreed by all Australian jurisdictions.
Fiscal OutlookThe 2017‑18 Budget has been influenced by challenging fiscal and economic conditions. By far the biggest influence on the 2017‑18 Budget has been the reduction in the Northern Territory’s largest revenue source, the GST. This estimated decrease is driven by a reduction in all three parameters that affect its distribution across jurisdictions, namely a fall in the Territory’s relativity from 5.28 to 4.66, a reduction in the Territory’s share of the national population and lower estimates of growth in the national GST pool. When compared to the August 2016 Pre‑Election Fiscal Outlook (PEFO), this reduction has resulted in projected GST revenue to be $397 million less in 2017‑18 and an estimated $525 million less on average per annum over the forward estimates.
In addition to the reduction in revenue estimates, the 2017‑18 Budget continues to focus on supporting the Territory economy by investing heavily in infrastructure.
The Territory’s high reliance on the GST revenue, together with the increased investment in infrastructure and the need to maintain frontline government services, although offset by a range of budget improvement measures, has resulted in significant deficits across the Budget and forward estimates. In the absence of the reductions in GST revenue, for which the Territory has no control over, the forecast fiscal aggregates would be materially improved on those presented in this Budget Paper. Except for GST and associated borrowing costs, surpluses would have been achieved by 2019‑20 at both the general government and non financial public sectors.
In light of these challenges, the Territory Government has deferred its stated fiscal target of returning the Budget to surplus by 2019‑20 and, as foreshadowed in the 2016‑17 Mid‑Year Report, has substantially revised the fiscal strategy in the 2017‑18 Budget. The Territory’s new strategy has been developed with both a short‑term and medium‑term focus that takes into account current subdued national and Territory economic conditions. The short‑term strategy is aimed at supporting the economy in the current period of transition and the medium‑term strategy sets the Budget on a pathway back to balance and reduced debt levels once revenues and economic activity return to historical levels of growth. Against this backdrop the updated fiscal projections in the 2017‑18 Budget include:
• net operating deficits across the budget and forward estimates, with a deficit of $50 million in 2016‑17 and deficits averaging $532 million over the budget year and forward estimates;
• a non financial public sector fiscal deficit of $552 million in 2016‑17 increasing to $1.3 billion in 2017‑18. Although trending to improvement from the budget year, the fiscal balance is projected to be in significant deficit across all years;
• substantial infrastructure investment in 2017‑18 of $1.75 billion;
• net debt at the non financial public sector to increase to $5.5 billion by 2020‑21, largely as a result of the significant reductions in GST revenue and increased interest payments associated with additional borrowings required as a result of the reductions in GST revenue; and
• consistent with the increase in net debt, the net debt to revenue ratio increases from 58 per cent in 2017‑18 to 87 per cent in 2020‑21.

6 Overview
2017-18 Budget
Table 1.1 highlights the key fiscal aggregates for the general government sector and the non financial public sector for the 2017‑18 Budget.
Table 1.1: Key Fiscal Indicators and Aggregates
2016‑17 2017‑18 2018‑19 2019‑20 2020‑21
Estimate Budget Forward Estimate
$M $M $M $M $M
General government sector
Net operating balance ‑ 50 ‑ 503 ‑ 509 ‑ 561 ‑ 556
Non financial public sector
Fiscal balance ‑ 552 ‑ 1 312 ‑ 859 ‑ 611 ‑ 572
Net debt 2 358 3 604 4 404 4 939 5 479
Net debt to revenue (%) 36 58 73 80 87
Source: Department of Treasury and Finance
Further information on the comparison between the estimates contained in the 2017‑18 Budget and those projected at the time of the August 2016 PEFO is provided in Chapter 2.
Economic Outlook The Territory’s key economic forecasts for the 2017‑18 Budget are detailed in Table 1.2.
Table 1.2: Territory Key Economic Indicators (%)
2015‑16 2016‑17e 2017‑18f 2018‑19f 2019‑20f 2020‑21f
Gross state product1 2.7 1.0 1.0 5.1 2.0 2.1
State final demand1 ‑ 12.5 0.2 ‑ 2.8 ‑ 5.0 0.1 1.5
Population2 0.5 0.3 ‑ 0.3 0.3 0.8 1.2
Employment3 1.4 2.9 0.5 0.6 0.8 1.2
Unemployment rate4 4.2 3.6 4.0 4.2 4.3 4.3
Consumer price index3 0.1 0.1 0.4 1.3 1.9 2.4
Wage price index3 2.2 2.1 1.9 2.0 2.3 2.6
e: estimate; f: forecast1 Year ended June, year‑on‑year percentage change, inflation adjusted.2 As at December, annual percentage change.3 Year ended June, year‑on‑year percentage change.4 Year average.Source: Department of Treasury and Finance, Australian Bureau of Statistics
Economic growth in the Territory is forecast to moderate in 2016‑17 and 2017‑18 as the Territory transitions from investment‑led growth to predominantly export‑related growth. The relatively modest rate of growth in the short term reflects a return to more historical levels of private investment compared to the record levels experienced in recent years.
Investment has been driven by a number of major projects, particularly the Ichthys liquefied natural gas (LNG) project. As construction of the Ichthys LNG project nears completion and the project commences production in 2017‑18, the balance of Territory economic activity is expected to shift towards underlying levels of consumption and investment accompanied by strengthening net exports. Economic growth in 2016‑17 and 2017‑18 will be supported by an increase in public investment, including the significant Territory Government infrastructure spend in both years.
Economic growth in the outer years is expected to be driven by a significant increase in exports, reflecting full production at the Ichthys LNG project, as well as a moderate increase in consumption

Overview 7
Budget Strategy and Outlook
growth. Growth will peak at 5.1 per cent in 2018‑19, while in 2019‑20 and 2020‑21 the Territory economy is expected to stabilise, with growth forecast to be 2.0 per cent and 2.1 per cent, respectively. This is generally in line with improving forecasts for the Territory’s population and employment in the outer years, which will underpin growth in household consumption and dwelling investment.
The Territory’s state final demand (SFD), which is economic activity excluding net exports, is expected to grow moderately in 2016‑17, increasing by just 0.2 per cent, primarily driven by improvements in public investment and consumption. SFD is expected to contract by 2.8 per cent in 2017‑18 and 5.0 per cent in 2018‑19, primarily due to significant reductions in private investment. From 2019‑20, SFD is expected to recover, mainly due to recovering levels of household consumption and improved levels of private investment.
Population growth over 2016 is expected to remain subdued, continuing the trend from 2015 and weakening to 0.3 per cent as a consequence of historically high levels of migration outflows as the economy adjusts to a general slowdown in the resources sector. Population is expected to decline in 2017, with a forecast change of ‑0.3 per cent, as a significant proportion of resident construction workers are expected to depart the Territory with the Ichthys LNG project transitioning from the construction to operational phase during the year. These departures are expected to continue into 2018, albeit to a lesser extent, resulting in a small recovery in annual population growth to 0.3 per cent. Population growth is then forecast to steadily increase to 1.2 per cent in 2020.
Employment growth in the Territory is estimated to be 2.9 per cent in 2016‑17 reflecting the continuation of peak workforce on the Ichthys LNG project. Employment growth is forecast to be 0.5 per cent in 2017‑18 as the Ichthys LNG project completes construction during this period. It is the largest project in the Territory’s history and the employment loss caused by its transition to the operational and export phase will be a one‑off impact. From 2018‑19 onwards, employment is forecast to increase due to a recovery in investment. The unemployment rate is estimated at 3.6 per cent in 2016‑17, which is consistent with full employment, before increasing and stabilising at 4.3 per cent in 2019‑20, which is slightly above the 10‑year average of 4.0 per cent.
The Darwin consumer price index is forecast to remain near flat in 2016‑17 at 0.1 per cent with modest growth over the forecast period of 0.4 per cent in 2017‑18 and trending upwards to 2.4 per cent through the outer years as key household consumer goods are forecast to return to moderate levels of price growth, but nevertheless remaining below the historical trend. This growth in the outer years is forecast to be mainly driven by growth in transport prices (due to oil prices), alcohol and tobacco (mainly tobacco excise) and the housing category as it begins to contribute to growth.
Wage growth is expected to continue to moderate to 2.1 per cent in 2016‑17, reflecting excess capacity in the national labour market. The Territory wage price index is forecast to remain subdued over the medium term, primarily driven by soft labour market conditions in the private sector and tightening wages policies across all levels of government.
Although the Territory economy is forecast to continue to face challenging economic conditions, the economy has grown by about 40 per cent since 2006‑07, following a sustained period of record growth across many key industries, to be worth over $23.6 billion in 2015‑16, reflecting a broader and more diversified economy compared to the mid‑2000s.
Despite the current and forecast challenges, the Territory is well positioned to take advantage of a number of opportunities likely to reshape the structure of the Territory economy throughout the forecast period and into the next decade. The Territory’s position as a gateway to Asia, a key defence hub, home to world‑renowned tourist attractions and a rich diversity of mineral, gas,

8 Overview
2017-18 Budget
petroleum and agricultural resources, all provide the strategic opportunities required to support a sustainable economy.
The Territory Government’s Economic Development Strategy provides a plan focused on unlocking economic opportunities for all Territorians, with policies that support growth and investment strategies to build a strong economy for the future. There are also a number of defence projects along with private sector projects in the pipeline, including agriculture and resource opportunities subject to final investment approvals. If realised, these projects have the potential to provide significant upside to the Territory’s economic forecasts.

Fiscal Outlook 9
Budget Strategy and Outlook
Chapter 2 Fiscal Outlook
Overview The information provided in this chapter meets the requirement under section 10(1)(a) of the Fiscal Integrity and Transparency Act (FITA) for each fiscal outlook report to contain updated financial projections for the budget year and the following three financial years for the general government and non financial public sectors.
Fiscal Outlook Highlights• The updated financial outcome projections contained in the 2017‑18 Budget have been
revised substantially since the August 2016 Pre‑Election Fiscal Outlook Report (PEFO) and the 2016‑17 Mid‑Year Report. These significant revisions are largely the result of unprecedented reductions in revenue estimates, most notably lower estimates of GST revenue of around $2 billion across the Budget cycle.
• These revenue reductions, together with associated borrowing costs and, to a lesser extent, spending decisions aimed at stimulating the Territory economy, have resulted in significant operating and fiscal deficits across the forward estimates.
• In the absence of the reductions in GST revenue, for which the Territory has no control over, the forecast fiscal aggregates would be materially improved on those presented in this Budget Paper. Except for GST and associated borrowing costs, surpluses would have been achieved by 2019‑20 at both the general government and non financial public sectors.
• The general government net operating balance is projected to be a deficit of $503 million in 2017‑18 and remains in a similar deficit position across all forward years.
• The non financial public sector fiscal balance deficit is projected to be $1.3 billion in 2017‑18 and, while improving, remains in a deficit position across all forward years.
• Revenue in 2017‑18 is forecast to decline by 4.0 per cent at the non financial public sector when compared to 2016‑17. Across the forward years to 2020‑21, revenue is estimated to increase at an annual average rate of 0.29 per cent off the lower 2017‑18 base.
• Non financial public sector expenses in 2017‑18 are expected to grow by 3.2 per cent from 2016‑17. However, in light of projected reductions in revenue, the Government has introduced a number of Budget improvement measures to fund new decisions and limit the impact on net debt. As a result, general government and non financial public sector expenses are expected to grow by just 0.1 and 0.5 per cent, respectively on average over the forward estimates.
• The 2017‑18 Budget includes a significant infrastructure spend of around $1.75 billion to drive economic recovery and employment.
• The projected operating deficits (primarily the result of lower GST revenue), combined with increased infrastructure investment, will see net debt rise to $5.5 billion by 2020‑21.
• The net debt to revenue ratio is also projected to increase over the forward estimates period reaching 87 per cent in 2020‑21 compared to 58 per cent in 2017–18, as a result of the increased deficits and lower revenue base.

10 Fiscal Outlook
2017-18 Budget
The full set of financial statements are presented in Chapter 9, with this chapter providing a comparison of the projections in the 2017‑18 Budget with those provided in the August 2016 PEFO and 2016‑17 Mid‑Year Report. It also provides a discussion of the forward estimates and the assumptions that underpin them.
General Government Sector Net Operating BalanceTable 2.1 highlights the movements in the general government net operating balance and compares the updated projections with those published at the time of the August 2016 PEFO and 2016‑17 Mid‑Year Report.
Table 2.1: General Government Sector – Net Operating Balance
2016‑17 2017‑18 2018‑19 2019‑20 2020‑21
Estimate Budget Forward Estimate
$M $M $M $M $M
2016 PEFO 5 ‑ 34 ‑ 87 23 n.a.
2016‑17 Mid‑Year Report 1 ‑ 64 ‑ 72 67 n.a.
2017‑18 Budget ‑ 50 ‑ 503 ‑ 509 ‑ 561 ‑ 556
Variation from 2016 PEFO ‑ 55 ‑ 469 ‑ 422 ‑ 584 n.a.
n.a.: not available at the time of publishing the 2016 PEFO and 2016‑17 Mid‑Year ReportSource: Department of Treasury and Finance
As shown in Table 2.1 the net operating balance in 2016‑17 is projected to be a deficit of $50 million compared to the $5 million surplus projected at the time of the PEFO. The worsening in 2016‑17 is primarily due to:
• a reduction in GST revenue of $80 million, largely related to reduced growth in national collections;
• an additional $67 million in new funding decisions primarily related to ongoing demand pressures for government services; offset by
• savings measures and revised timing of expenditure from 2016‑17 to 2017‑18 totalling $90 million.
From 2017‑18, the reduction in GST revenue is around $2 billion compared to PEFO estimates. As a small jurisdiction with a limited tax base, the Territory is unable to absorb such revenue shocks in the short term without undermining service standards or economic conditions. The Territory therefore has committed to a large borrowing program to support investment in infrastructure and maintain the delivery of core government services. Consequently, the substantial reductions in revenue combined with additional interest payments required to service new borrowings are likely to result in significant operating deficits in all years in excess of $500 million.
In addition to the reduction in GST revenue, there have been some increases to expenditure across the forward estimates when compared to PEFO. These increases are the result of new Government decisions aimed at stimulating the economy and meeting demand for government services.
However, as shown in Table 2.2, the new recurrent policy decisions from 2017‑18 are fully offset by savings and revenue measures and drawdown of the contingency reserve. This also demonstrates that without the lower GST revenue, the operating balance would have returned to a surplus position by 2019‑20. Further analysis of policy decisions of government are explained later in this chapter and in more detail in Chapter 5: Budget Initiatives.

Fiscal Outlook 11
Budget Strategy and Outlook
Table 2.2 Effect of Recurrent Commitment, Savings and Revenue Measures
2016‑17 2017‑18 2018‑19 2019‑20 2020‑21
Estimate Budget Forward Estimate
$M $M $M $M $M
Recurrent commitments ‑ 67 ‑ 219 ‑ 171 ‑ 163 ‑ 150
Savings, revenue and contingency measures 26 218 188 203 164
Net impact ‑ 41 ‑ 1 17 40 14
Source: Department of Treasury and Finance
Non Financial Public Sector Fiscal BalanceThe general government sector excludes public non financial corporations, such as the Power and Water Corporation, Territory Generation and Jacana Energy. Therefore the fiscal balance measure is assessed at the non financial public sector to ensure the financial performance of these entities is incorporated in Government’s fiscal targets and outcomes.
Table 2.3 Non Financial Public Sector – Fiscal Balance
2016‑17 2017‑18 2018‑19 2019‑20 2020‑21
Estimate Budget Forward Estimate
$M $M $M $M $M
2016 PEFO ‑ 876 ‑ 431 ‑ 154 1 n.a.
2016‑17 Mid‑Year Report ‑ 875 ‑ 459 ‑ 183 29 n.a.
2017‑18 Budget ‑ 552 ‑ 1 312 ‑ 859 ‑ 611 ‑ 572
Variation from 2016 PEFO 324 ‑ 881 ‑ 705 ‑ 612 n.a.
n.a.: not available at the time of publishing the 2016 PEFO and 2016‑17 Mid‑Year Report Source: Department of Treasury and Finance
As shown in Table 2.3, the fiscal balance, which includes net investment in capital spending, is now projected to be a $552 million deficit in 2016‑17, an improvement of $324 million when compared to the August 2016 PEFO. The improved outcome is largely due to the transfer of expenditure, from 2016‑17 into 2017‑18, for both operational and capital expenditure largely related to Remote Indigenous Housing and various Commonwealth‑funded road programs. However, the transfer has contributed to an increase in the deficit for 2017‑18, with significant deficits now projected for all forward years.
The increased deficits from 2017‑18 incorporate the changes affecting the lower operating results, however, the worsening is more pronounced in 2017‑18 and 2018‑19 as a result of both the change in timing described above, together with a number of stimulus packages announced by the Government aimed at supporting economic activity by investing in infrastructure.
In contrast to the trend in the net operating balance, the fiscal balance is improving over the forward estimates reflecting the Territory’s counter‑cyclical approach to infrastructure investment by increasing spending in 2017‑18 and 2018‑19.
Reconciliation with Previous Fiscal ProjectionsThis section addresses the requirement under section 10(1)(f) of FITA that each fiscal outlook report is to contain an explanation of the factors and considerations that contributed to any material differences between the updated financial projections and the equivalent projections published in the last fiscal outlook report.

12 Fiscal Outlook
2017-18 Budget
While the most recent fiscal outlook report published under FITA is the 2016‑17 Mid‑Year Report, for completeness the analysis in the remainder of the chapter reflects policy and non‑policy changes since the August 2016 PEFO. Policy variations are the result of Government decisions to implement new, or expand existing agency programs and savings measures. Non‑policy variations are due to either influences outside the Government’s control, such as the timing of receipts from the Commonwealth, or changes in economic parameters.
Policy and Non‑policy Changes since PEFOTable 2.4 summarises the effect of policy and non‑policy changes on the non financial public sector’s fiscal balance since PEFO.
Table 2.4: Non Financial Public Sector Fiscal Balance – Policy and Non‑Policy Changes since PEFO
2016‑17 2017‑18 2018‑19 2019‑20
Estimate Budget Forward Estimate
$M $M $M $M
2016 PEFO ‑ 876 ‑ 431 ‑ 154 1
Policy changes ‑ 13 ‑ 312 ‑ 126 ‑ 11
Non‑policy changes 337 ‑ 569 ‑ 579 ‑ 601
2017‑18 Budget ‑ 552 ‑ 1 312 ‑ 859 ‑ 611
Source: Department of Treasury and Finance
As outlined in Table 2.4, the major impact on the Budget and forward estimates is the effect of non‑policy changes, largely GST revenue and timing changes. The worsening in 2017‑18 and 2018‑19 is exacerbated by policy measures related to infrastructure stimulus. Details on policy and non‑policy changes are discussed in further detail below.
Policy Changes since PEFOTable 2.5 highlights the effect of policy changes on the non financial public sector’s fiscal balance since PEFO.
Table 2.5: Non Financial Public Sector Fiscal Balance – Policy Changes since PEFO
2016‑17 2017‑18 2018‑19 2019‑20 2020‑21
Estimate Budget Forward Estimate
$M $M $M $M $M
Policy decisions
Recurrent commitments ‑ 67 ‑ 219 ‑ 171 ‑ 163 ‑ 150
Capital commitments 28 ‑ 60 ‑ 43 ‑ 51 ‑ 23
Infrastructure stimulus ‑ 250 ‑ 100
Savings and contingency measures 29 217 185 199 159
Revenue measures ‑ 3 1 3 4 5
2017‑18 Budget ‑ 13 ‑ 312 ‑ 126 ‑ 11 ‑ 9
Source: Department of Treasury and Finance
As demonstrated in Table 2.5, recurrent commitments total $770 million across the forward estimates. These recurrent initiatives are more than offset by savings and revenue measures and the use of the contingency reserve, which total $799 million over the same period and therefore improve the fiscal aggregates.
The overall worsening, predominantly in 2017‑18 and 2018‑19, is mainly due to Government’s decision to fund a number of infrastructure stimulus packages, together with capital commitments

Fiscal Outlook 13
Budget Strategy and Outlook
primarily related to large information and communications technology (ICT) projects across government. Policy decisions are discussed in more detail below.
Recurrent Commitments Recurrent commitments include election commitments made in the lead up to the 2016 Election and additional policy decisions since the 2016‑17 Mid‑Year Report. Election commitments remain largely unchanged from those incorporated in the 2016‑17 Mid‑Year Report. Combined, these total $67 million in 2016‑17, rising to $150 million ongoing from 2020‑21, with key commitments including:
• $20 million ongoing from 2017‑18 for repairs and maintenance on remote Aboriginal housing as part of the Government’s 10‑year Remote Housing Investment Package;
• around $17 million per annum ongoing from 2017‑18 to implement, provide assessment, withdrawal and specialised treatment services for the reintroduction of the Banned Drinker Register;
• $15.5 million in 2016‑17 rising to $31 million ongoing from 2017‑18 for additional school resourcing;
• additional funding of $15 million in 2016‑17 and $8.9 million ongoing from 2017‑18 to meet increased demand pressures for out of home care services and youth justice reform;
• $5 million in 2017‑18 rising to $15.2 million ongoing from 2019‑20 for police resourcing and recruitment;
• around $10 million ongoing from 2017‑18 to improve the youth justice diversion system;
• $6.2 million per annum ongoing from 2017‑18 for the Domestic and Family Violence Reduction Strategy;
• $8 million in 2017‑18 to encourage visitors to the Territory including product development, event sponsorship and opportunities to promote the Territory both nationally and internationally;
• $5 million in 2017‑18 and $3.1 million ongoing from 2018‑19 for various programs in the justice and correctional services system including court support services and community support work programs;
• $5.5 million in 2016‑17 and $10.8 million in 2017‑18 for the Home Improvement Scheme;
• $3 million ongoing from 2017‑18 to establish an Independent Commission Against Corruption to the Territory;
• $9.9 million over five years to accelerate land resource mapping, to identify potential productive land; and
• $1 million in 2017‑18 rising to $5 million ongoing from 2019‑20 to expand the Nurse‑Family Partnership Program – nurse home visits.
Other policy decisions of Government include funding of $27 million to meet the Territory’s commitment to contribute up to 50 per cent of the Commonwealth’s total cost of conducting the Royal Commission into the Protection and Detention of Children in the Northern Territory.
Supplementing these commitments are a number of additional election commitments required to be funded from within existing resources and consequently do not affect the projections in this report.

14 Fiscal Outlook
2017-18 Budget
Capital Commitments Capital commitments total $149 million across the budget cycle. These commitments primarily relate to two major ICT projects currently underway:
• $44.9 million to implement a new police management system to replace PROMIS; and
• additional funding of $73.2 million over five years to continue the delivery of the $259 million Health Core Clinical System Renewal program.
Infrastructure Stimulus As foreshadowed in the 2016‑17 Mid‑Year Report, the Government announced $50 million in both 2017‑18 and 2018‑19 to fund an infrastructure stimulus package using part of the proceeds from the long‑term lease of the Port of Darwin previously set aside in the Northern Territory Infrastructure Development Fund.
The Government built on this commitment and has provided an additional $250 million towards an economic stimulus program across 2017‑18 and 2018‑19, bringing the total investment to $350 million over the two years. The additional $250 million includes a suite of strategic programs to create jobs for Territorians, including:
• $129 million to fast‑track major infrastructure projects across the Territory;
• $14 million for additional minor infrastructure projects;
• $10 million to commence works on the $120 million City Deal projects for revitalising the Darwin and Alice Springs central business districts;
• an additional $20 million, to a total of $30 million overall, for Immediate Work Grants to provide funding for incorporated not‑for‑profit and community organisations to carry out repairs, maintenance and improvements to their facilities;
• $5 million in business Security Systems Assistance Grants;
• $60 million for additional repairs and maintenance works across the Territory, including $5 million for urban social housing;
• $10 million incentive funding for social housing headleasing projects in Darwin, Palmerston and Alice Springs; and
• $2 million to increase the Urban and Regional Oval Lights Program, to provide a total of $3.5 million in 2017‑18 and 2018‑19.
Savings and Contingency MeasuresSavings and contingency measures include commitments made in the lead up to the 2016 Election and additional Budget improvement measures made since the 2016‑17 Mid‑Year Report. Combined, savings and contingency measures total $789 million across the budget cycle. Savings measures are being achieved through a number of operational and program efficiencies and whole of government savings without compromising the delivery of core government services.
Operational efficiencies relate to initiatives delivering savings through more efficient use of existing administrative resources, rationalising administration tasks to focus on core agency functions.
Program efficiencies and rationalisation relate to initiatives delivering savings through more efficient use of existing program resources and increased focus on efficient delivery of priority programs and functions.
This also incorporates structural reforms that achieve savings through the realignment of functions and programs to better meet current needs and provide savings where resources are surplus to requirements.

Fiscal Outlook 15
Budget Strategy and Outlook
Other savings measures include:
• reducing the wages indexation in agency budgets from 3 per cent to 2.5 per cent, consistent with the Government’s wages policy;
• savings arising from agencies not filling vacant positions in targeted areas;
• savings arising from reducing consumer price index (CPI) indexation in agency budgets to zero per cent in 2017‑18, 1.5 per cent in 2018‑19 and 2.5 per cent thereafter, consistent with updated economic forecasts; and
• a reduction in the efficiency dividend discount for frontline agencies from 75 per cent to 67 per cent from 2017‑18 reflecting productivity improvement in back office functions.
In addition to the savings measures, Government has utilised a proportion of the contingency amount included in the forward estimates to fund new recurrent decisions. In isolation, savings measures and the drawdown of contingency more than offset recurrent decisions and have improved the projected outcomes, as highlighted earlier in the chapter.
Revenue MeasuresThe revenue‑related policy changes since the 2016 PEFO are:
• adjusting community gaming machine tax rates and thresholds to return closer to pre‑1 January 2009 levels, which will mean a reduction in thresholds for clubs and hotels from 1 July 2017, along with a further rate and threshold change for hotels from 1 July 2018;
• a new stamp duty rate of 5.75 per cent for conveyances where the unencumbered value of the property or the consideration payable is $3 million or more but less than $5 million and a rate of 5.95 per cent where it is $5 million or more, effective from 1 July 2017; and
• an increase in motor vehicle registration fees for light vehicles, effective from 1 July 2017; offset by
• Government’s election commitment to introduce a first home buyers stamp duty discount, which provides for no stamp duty to be paid on the first $500 000 of the purchase on established homes for eligible first home owners. The purchase price is capped at $650 000. As a result stamp duty collections are projected to be lower by $4.8 million in 2016‑17, increasing to $13.2 million ongoing from 2017‑18.
In total these revenue measures will generate net additional revenues of $1 million in 2017‑18, rising to $5 million per annum by 2020‑21. Further information on these revenue measures is outlined in Chapter 5 of this Budget Paper.
The effect on individual agencies for 2016‑17 and 2017‑18 of new initiatives and savings measures is included in more detail in Chapter 5 of this Budget Paper.

16 Fiscal Outlook
2017-18 Budget
Non‑Policy Changes since the Pre‑Election Fiscal OutlookTable 2.6 highlights the effect of non‑policy changes on the non financial public sector’s fiscal balance since PEFO.
Table 2.6: Non‑Policy Changes since PEFO
2016‑17 2017‑18 2018‑19 2019‑20 2020‑21
Estimate Budget Forward Estimate
$M $M $M $M $M
GST revenue ‑ 80 ‑ 397 ‑ 444 ‑ 549 ‑ 581
Taxation and mining royalties 34 56 ‑ 12 ‑ 11 ‑ 11
Interest expense variations 3 ‑ 4 ‑ 26 ‑ 56 ‑ 85
Interest revenue variations ‑ 3 ‑ 18 ‑ 19 ‑ 19 ‑ 17
Government owned corporations1 51 ‑ 63 5 ‑ 1 7
Commonwealth and agency‑related adjustments
333 ‑ 143 ‑ 82 35 60
2017‑18 Budget 337 ‑ 569 ‑ 579 ‑ 601 ‑ 627
1 Government owned corporations includes Indigenous Essential Services Pty Ltd, the subsidiary company of the Power and Water Corporation.
Source: Department of Treasury and Finance
The non‑policy variations since PEFO result in an improvement in the fiscal balance in 2016‑17 of $337 million, primarily related to the revised timing of Commonwealth‑funded programs. From 2017‑18 the non‑policy changes have resulted in a significant worsening to the fiscal projections in all forward years, predominantly related to lower GST revenue. Key variations include:
• $2 billion reduction in GST revenue forecasts across the budget cycle;
• increases in taxation and royalty revenue in 2016‑17 and 2017‑18 primarily relate to increased mineral royalties. The increase in mineral royalties flow through to the forward estimates but is more than offset by lower payroll tax collections in forward years, largely as a result of the Ichthys liquefied natural gas (LNG) project moving from the peak of construction to the operational phase during 2017‑18;
• higher than anticipated interest expenses over the forward estimates due to increased borrowing requirements as a result of the reduction in GST revenue;
• lower than anticipated interest received on investments reflecting revised market conditions;
• revised revenue and expense assumptions and capital requirements incorporated into the Territory’s government owned corporations’ statements of corporate intent, including revised timing of capital projects for Indigenous Essential Services Pty Ltd, a subsidiary company of the Power and Water Corporation; and
• Commonwealth and other agency‑related adjustments, resulting in an improvement in 2016‑17 and a corresponding worsening in 2017‑18 and 2018‑19, largely related to the revised timing of tied Commonwealth‑funded programs including Remote Indigenous Housing and various road programs.

Fiscal Outlook 17
Budget Strategy and Outlook
Consolidated Table of Changes since August 2016 PEFOTable 2.7 sets out the consolidated changes in the fiscal balance for the non financial public sector since PEFO.
Table 2.7: Policy and Non‑Policy Changes to the Fiscal Balance since PEFO
2016‑17 2017‑18 2018‑19 2019‑20
Estimate Budget Forward Estimate
$M $M $M $M
2016 PEFO ‑ 876 ‑ 431 ‑ 154 1
Effect of policy decisions
Revenues ‑ 3 1 3 4
Expenses ‑ 38 ‑ 168 10 55
Capital 28 ‑ 145 ‑ 139 ‑ 70
Total policy decisions ‑ 13 ‑ 312 ‑ 126 ‑ 11
Effect of non‑policy decisions and other variations
Revenues ‑ 82 ‑ 251 ‑ 468 ‑ 606
Expenses 75 ‑ 54 48 ‑ 38
Capital 343 ‑ 265 ‑ 158 42
Total non‑policy decisions and other variations 337 ‑ 569 ‑ 579 ‑ 601 Total variations 324 ‑ 881 ‑ 705 ‑ 612
2017‑18 Budget ‑ 552 ‑1 312 ‑ 859 ‑ 611
Source: Department of Treasury and Finance
2017‑18 Budget and 2018‑19 to 2020‑21 Forward Estimates Basis of Forward Estimates
In accordance with FITA, five years of forward estimates are maintained and used by Government, both as a policy and an operational tool. The Budget and forward estimates provides the framework within which agencies plan, and also forms the basis for the Government’s fiscal strategy.
Agency forward estimates vary in line with the application of parameters (inflators and deflators) to the Budget year on a no‑policy‑change basis. New policy and funding decisions linked to demand or cost growth also adds to each agency’s budget and forward estimates. The main parameters used to adjust forward estimates are:
• wages – inflator;
• CPI – inflator; and
• efficiency dividend – deflator.
Consistent with the wages policy, the wage inflator applied to employee costs in all years is 2.5 per cent.
A CPI factor of zero per cent has been applied to operational costs in 2017‑18, consistent with the year‑on‑year to December 2016 CPI outcome, with 1.5 per cent estimated for 2018‑19 and 2.5 per cent ongoing from 2019‑20. However property management, undertaken on behalf of government by the Department of Corporate and Information Services, receives a higher parameter in line with contractual arrangements.

18 Fiscal Outlook
2017-18 Budget
An additional growth parameter of 4 per cent is applied to wage and non‑wage expenditure for the Top End and Central Australia Health services in recognition that hospital services and primary health care costs are generally demand driven.
An efficiency dividend is applied to operational and employee costs premised on agencies improving processes and technology and delivering services more efficiently over time, as is the case with private sector enterprises. An efficiency dividend of 3 per cent has been applied in 2017‑18, reducing to 2 per cent in 2018‑19 and 2019‑20, with 1 per cent applied ongoing from 2020‑21. Efficiency dividends are not applied to grants and some contractual obligations.
For agencies, such as the Department of Education, Territory Families, Northern Territory Police, Fire and Emergency Services, the correctional services component of the Department of the Attorney‑General and Justice, and the hospital networks, a 67 per cent discount is applied to the efficiency dividend in recognition that a majority of their costs relate to frontline services, which are fixed in nature.
For Territory‑funded grants and subsidies, a composite factor is applied based on 75 per cent of the wages factor and 25 per cent of the CPI factor.
Operating Revenue – Forward EstimatesAs shown in Table 2.8 compared to 2016‑17, there is a significant decrease in total Territory revenue from 2017‑18 onwards, primarily due to the reduced estimates of GST revenue. As a result, it is projected that total revenue will not return to 2016‑17 levels in any year over the Budget cycle, with average growth over the forward estimates almost flat at 0.2 per cent.
Table 2.8: Non Financial Public Sector – Revenue
2016‑17 2017‑18 2018‑19 2019‑20 2020‑2021
Estimate Budget Forward Estimate
$M $M $M $M $M
Revenue
Taxation revenue 589 558 557 576 592
GST revenue 3 183 2 909 3 030 3 150 3 302
Current grants 1 056 978 853 877 823
Capital grants 356 373 115 53 15
Sales of goods and services 965 1 022 1 120 1 177 1 205
Interest income 70 65 67 69 71
Dividend and income tax equivalent income 14 19 18 23 21
Mining royalties income 170 225 175 175 175
Other 89 80 67 66 71
Total revenue 6 492 6 229 6 002 6 166 6 275
Year‑on‑year percentage increase (%) ‑ 4 ‑ 4 ‑ 4 3 2
Source: Department of Treasury and Finance
Taxation RevenueTaxation revenue is the most significant component of the Territory’s own‑source revenue and has been revised upwards by $12 million in 2016‑17 when compared to PEFO projections.
This increased estimate in taxation revenue within 2016‑17 is largely attributable to a one‑off increase in payroll tax ($17 million) offset by lower than anticipated collections on gambling taxes, motor vehicle fees and stamp duty.
Fiscal Outlook 19
Budget Strategy and Outlook
In terms of year‑on‑year variations, the overall reduction in taxation revenue of $31 million in 2017‑18 and $1 million in 2018‑19 is primarily due to an expected moderation in payroll tax. With a range of potential major projects not included in forecasts given the uncertainty around final investment decisions and timing, payroll tax collections are expected to decline over the next two financial years. This is mainly due to compositional changes in the payroll tax base as the Ichthys LNG project transitions from the peak of construction to a much smaller ongoing production workforce. These reduced payroll tax estimates are partially offset by the net effect of the revenue measures outlined earlier in the chapter that improve the forecasts from 2017‑18. The growth from 2018‑19 onwards largely reflects normal growth across all categories, albeit from a lower base.
GST RevenueThe parameters that influence the amount of GST revenue the Territory receives are growth in national GST collections, GST relativities as assessed by the Commonwealth Grants Commission and the Territory’s share of the national population.
In 2016‑17 the Territory is expected to receive $3183 million in GST, a reduction of $80 million from that projected at the time of the August 2016 PEFO. This predominantly relates to reduced growth in the national GST pool as outlined in the Commonwealth’s 2015‑16 Final Budget Outcome and 2016‑17 Mid‑Year Fiscal and Economic Outlook.
In 2017‑18 the Territory’s estimated GST revenue has declined by $397 million from that forecast at the time of PEFO. This is primarily due to a significant reduction in the Territory’s GST relativity (5.28 in 2016‑17 to 4.66 in 2017‑18) combined with a decline in the Territory’s share of the national population and lower estimates of growth in the national GST pool. This reduction, compared to previous forecasts, flows through to all forward years resulting in an overall reduction in GST revenue of around $2 billion over the Budget cycle, compared to those contained in PEFO.
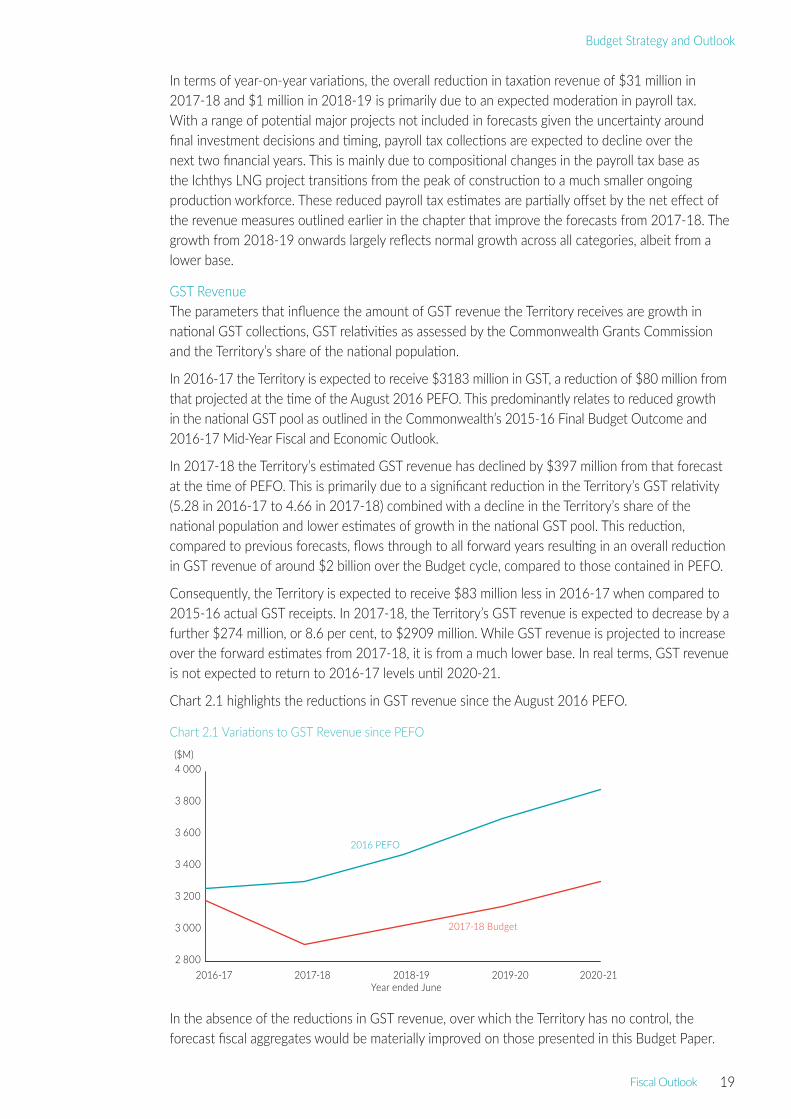
Consequently, the Territory is expected to receive $83 million less in 2016‑17 when compared to 2015‑16 actual GST receipts. In 2017‑18, the Territory’s GST revenue is expected to decrease by a further $274 million, or 8.6 per cent, to $2909 million. While GST revenue is projected to increase over the forward estimates from 2017‑18, it is from a much lower base. In real terms, GST revenue is not expected to return to 2016‑17 levels until 2020‑21.
Chart 2.1 highlights the reductions in GST revenue since the August 2016 PEFO.
Chart 2.1 Variations to GST Revenue since PEFO
In the absence of the reductions in GST revenue, over which the Territory has no control, the forecast fiscal aggregates would be materially improved on those presented in this Budget Paper.
2 800
3 000
3 200
3 400
3 600
3 800
4 000
2016-17 2017-18 2018-19 2019-20 2020-21
2016 PEFO
2017-18 Budget
($M)
Year ended June

20 Fiscal Outlook
2017-18 Budget
Table 2.9 demonstrates that, except for GST and associated borrowing costs, surpluses would have been achieved by 2019‑20 at both the general government and non financial public sectors.
Table 2.9 Underlying Fiscal Aggregates with GST Reductions and Associated Borrowing Costs Removed
2016‑17 2017‑18 2018‑19 2019‑20 2020‑21
Estimate Budget Forward Estimate
$M $M $M $M $M
General government sector
Net operating balance 30 ‑ 92 ‑ 26 53 119
Non financial public sector
Fiscal balance ‑ 472 ‑ 902 ‑ 376 2 103
Net debt 2 278 3 114 3 430 3 353 3 217
Net debt to revenue (%) 35 47 53 50 47
Source: Department of Treasury and Finance
Tied Commonwealth FundingDuring each budget year there are significant changes in tied Commonwealth funding estimates as funding agreements are finalised. These adjustments tend not to affect the fiscal outcome as increases in revenue are generally matched by a corresponding increase in expenditure. However, timing differences in the receipt of tied revenue and associated expenditure introduce a degree of volatility affecting the budgeted and actual outcomes in a given year.
When compared to the August 2016 PEFO, estimates of current and capital grants are projected to increase by $54 million in 2016‑17 and $186 million in 2017‑18, mainly due to the revised timing and increased funding for various road and health‑related agreements.
In absolute year‑on‑year terms from 2016‑17 current and capital grants are decreasing over the forward estimates as a result of the scheduled expiry of funding agreements with the Commonwealth. The most significant of which is Remote Housing, which concludes in 2017‑18 resulting in a reduction in current and capital grants in excess of $100 million in 2018‑19. This reduction is somewhat offset in 2019‑20 by an expected $42 million increase in assistance payments to the Territory from the Disability Care Australia Fund.
Sales of Goods and ServicesRevenue from the sales of goods and services has been revised down in all years since PEFO, largely a result of revised revenue assumptions incorporated into the government owned corporations’ statements of corporate intent. However, revenue from the sales of goods and services is still projected to increase on average by 5.7 per cent over the forward estimates from the lower 2017‑18 base.
Mining RoyaltiesThe remainder of own‑source revenue is mainly attributable to mining royalties. Mining and petroleum revenue forecasts are reliant on advice from mining companies and petroleum producers for estimated liability and related company estimates of commodity price movements, production levels and the value of the Australian dollar. Based on advice from royalty payers, it is expected that the Territory will receive $169.5 million in mining and petroleum revenue in 2016‑17, $16 million higher than forecast in the August 2016 PEFO.
The forecast for royalty revenue in 2017‑18 is $225 million and is based on forecasts from royalty payers of improved profitability. For 2018‑19 and the outer years, mining royalty forecasts have been forecast at slightly above current‑year levels.

Fiscal Outlook 21
Budget Strategy and Outlook
Operating ExpensesTable 2.10 sets out the revised expense projections for total expenditures for 2016‑17 and the forward estimates.
Table 2.10: Non Financial Public Sector – Expenditure
2016‑17 2017‑18 2018‑19 2019‑20 2020‑2021
Estimate Budget Forward Estimate
$M $M $M $M $M
Expenses
Employee expenses 2 349 2 384 2 380 2 434 2 485
Superannuation expenses 356 355 355 357 354
Depreciation and amortisation 518 541 544 547 550
Other operating expenses 1 836 2 004 1 884 1 973 2 019
Interest expenses 270 289 325 365 393
Current grants 923 906 839 872 847
Capital grants 114 104 28 22 17
Subsidies and personal benefit payments 152 148 149 154 157
Total expenses 6 519 6 730 6 505 6 724 6 821
Year‑on‑year percentage increase (%) 2 3 ‑ 3 3 1
Net capital 1 026 1 291 880 580 552
Total expenditure 7 545 8 021 7 386 7 304 7 373
Year‑on‑year percentage increase (%) 3 6 ‑ 8 ‑ 1 1
Source: Department of Treasury and Finance
The Government remains committed to returning the Budget to surplus, however recent reductions in revenue estimates has meant this would not be achieved by 2019‑20 without significant cuts to both core services and infrastructure expenditure, which would have a detrimental effect on the Territory’s economy.
As mentioned earlier in this chapter, additional budget improvement measures have been applied to the Budget year and all forward years to assist with partially offsetting the effect of lower revenues and additional policy decisions made by Government.
Operating expenses in 2017‑18 are expected to grow by 3.2 per cent from 2016‑17. As a result of the savings and efficiency measures incorporated in the 2017‑18 Budget, total expenses are expected to grow by on average 0.5 per cent per annum over the forward estimates.
Employee expenses continue to account for about one third of total expenses over the forward estimate period and are estimated to increase on average from the budget year by 1.4 per cent per annum consistent with Government’s wages policy, which limits growth in wages to 2.5 per cent, offset by efficiency measures.
The revised operating expenditure over the forward estimates incorporates the effect of government’s policy decisions that are largely offset by savings measures and the application of the contingency reserve as described earlier in this chapter. While the effect on total operating expenses varies between years, these budget improvement measures contribute to the moderation in growth in expenses over the forward estimates.
Consistent with the practices in other jurisdictions, included in expenditure estimates from 2018‑19 is a contingency reserve of around 1 per cent per annum. The reserve provides capacity to meet one‑off unforeseen expenditure requirements, minor revenue variations and provide some limited

22 Fiscal Outlook
2017-18 Budget
capacity for new and expanded initiatives. Overall the underlying growth from the budget year in other operating expenses is estimated at around 0.4 per cent per annum on average, lower than the 0.9 per cent estimated at PEFO.
When compared to PEFO, interest expenses are on average $47 million higher per annum over the forward estimates and are reflective of the increased borrowing program required to offset the effect of the reductions in GST revenue.
The fluctuation in current and capital grants expense across the forward estimate period is in line with the timing of tied Commonwealth funding agreements, in particular, the revised funding arrangements under the National Partnership Agreements on Remote Aboriginal Investment and Remote Housing.
There have also been variations to net capital spending resulting in a reduction of $366 million in 2016‑17 and increases of $384 million in 2017‑18 and $315 million in 2018‑19. The variations reflect the revised timing of tied Commonwealth‑funded programs and Government’s counter‑cyclical approach to infrastructure investment to support the Territory economy. This is reflected in the significant investment in 2016‑17 through to 2018‑19.
Key Fiscal Indicators – Balance SheetThe key measures for the balance sheet are net debt and the resulting net debt to revenue ratio.
As shown in Table 2.11, net debt is now projected to be $2.4 billion in 2016‑17, rising to $5.5 billion by 2020‑21. In addition, the net debt to revenue ratio is projected to increase to 58 per cent in 2017‑18 and rise to 87 per cent by 2020‑21.
Table 2.11: Non Financial Public Sector – Net Debt and Net Debt to Revenue Ratio
2015‑161 2016‑17 2017‑18 2018‑19 2019‑20 2020‑21
Outcome Estimate Budget Forward Estimate
$M $M $M $M $M $M
Net debt
2016 PEFO 1 847 2 665 3 023 3 118 3 094 na
2016‑17 Mid‑Year Report 1 850 2 669 3 059 3 182 3 134 na
2017‑18 Budget 1 850 2 358 3 604 4 404 4 939 5 479
Variation from 2016 PEFO 3 ‑ 307 581 1 286 1 845 na
Net debt to revenue (%)
2016 PEFO 28 41 47 48 46 na
2016‑17 Mid‑Year Report 27 40 47 49 46 na
2017‑18 Budget 27 36 58 73 80 87
Variation from 2016 PEFO ‑ 1 ‑ 5 11 25 34 na
n.a.: not available at the time of publishing the August 2016 PEFO and 2016‑17 Mid‑Year Report1 2016‑17 Mid‑Year Report and 2017‑18 Budget reflect actual outcome.Source: Department of Treasury and Finance
The improved position compared to PEFO in 2016‑17 reflects the $121 million improved outcome in 2015‑16, combined with the improved fiscal position in 2016‑17. The significant increases in net debt, when compared to PEFO estimates and year‑on‑year over the budget cycle, are the consequence of the projected fiscal balance deficits largely resulting from non‑policy changes, predominantly GST, as shown in Table 2.12.

Fiscal Outlook 23
Budget Strategy and Outlook
Table 2.12 summarises the effect of policy and non‑policy variations on net debt since PEFO.
Table 2.12: Non Financial Public Sector – Effect of Policy and Non‑Policy variations to Net Debt
2016‑17 2017‑18 2018‑19 2019‑20 2020‑21
Estimate Budget Forward Estimate
$M $M $M $M $M
Variations
Policy 13 325 451 462 470
Non‑policy ‑ 320 256 835 1 384 1 970
Net impact ‑ 307 581 1 286 1 845 2 440
Source: Department of Treasury and Finance
Table 2.13 provides details on the factors that have contributed to the deterioration in net debt over the forward estimates since PEFO.
Table 2.13: Non Financial Public Sector – Detailed variations to Net Debt
2016‑17 2017‑18 2018‑19 2019‑20 2020‑21
Estimate Budget Forward Estimate
$M $M $M $M $M
Variations
GST Revenue 80 477 921 1 470 2 051
Taxation, mining royalties and revenue measures
‑ 31 ‑ 89 ‑ 80 ‑ 72 ‑ 67
Recurrent commitments 67 286 457 620 770
Capital commitments ‑ 28 33 76 126 149
Infrastructure stimulus 250 350 350 350
Savings and contingency measures ‑ 29 ‑ 246 ‑ 430 ‑ 630 ‑ 789
Government owned corporations ‑ 51 12 7 8
Interest expense variations ‑ 3 2 28 84 169
Timing and other variations ‑ 313 ‑ 145 ‑ 43 ‑ 112 ‑ 195
Net impact ‑ 307 581 1 286 1 845 2 440
Source: Department of Treasury and Finance
As demonstrated in Table 2.13, variations to net debt total $2.4 billion by 2020‑21, of which in excess of $2 billion can be attributed to the reduction in GST revenue.

24
2017-18 Budget

Fiscal Strategy Statement 25
Budget Strategy and Outlook
Chapter 3 Fiscal Strategy Statement Overview
In the lead up to the 2016 election campaign the Territory Government announced a number of commitments that underpin its policy platform. The budgetary effects of these commitments were incorporated in the 2016‑17 Mid‑Year Report. The overall net cost of the Government’s election commitments contained in the Mid‑Year Report resulted in outcomes consistent with that provided in the Pre‑Election Fiscal Outlook (PEFO) published prior to the August 2016 Election. Both reports highlighted an improvement in most fiscal measures across the budget cycle, including a projected return to surplus in 2019‑20.
Since the publication of the 2016‑17 Mid‑Year Report however, the Government has been presented with a number of immediate fiscal challenges, namely:
• a significant reduction in estimated GST revenue totalling $2 billion over the forward estimates;
• ongoing demand pressures for government services; and
• slowing economic conditions in the Territory.
Against this backdrop, the Territory Government has taken the responsible step of deferring its stated fiscal target of returning the Budget to surplus by 2019‑20. In addition, as foreshadowed in the Mid‑Year Report, the Government has substantially revised the Territory’s fiscal strategy in the 2017‑18 Budget. The new strategy takes into account current subdued national and Territory economic conditions, falling GST revenue and the Government’s commitment to increase investment spending to support jobs and stimulate the Territory economy.
While the drop in revenues and the Government’s strategic response to these emerging fiscal challenges will result in a deterioration in fiscal outcomes in the short term, the revised strategy has been developed with both a short‑term and a medium‑term focus. The short‑term strategy is aimed at supporting the economy in the current period of transition and the medium‑term strategy sets the Budget on a pathway back to surplus and reduced debt levels once revenues and economic activity return to historical levels of growth.
The remainder of this chapter outlines the Territory government’s fiscal strategy, including medium‑term fiscal objectives and financial targets.
2017‑18 Fiscal StrategyThe Fiscal Integrity and Transparency Act (FITA) requires the Treasurer to publicly release and table the first fiscal strategy statement for a new Government at or before the time of the Government’s first Budget.
The Territory’s fiscal strategy is an essential element of budget planning and accountability and outlines the Government’s short and medium‑term fiscal objectives in the context of prevailing economic conditions and provides the basis against which policy decisions can be assessed.
Under FITA, the fiscal strategy statement must be based on principles of sound fiscal management where the Government must:
• formulate and apply spending and taxation policies having regard to the effect of these policies on employment, economic prosperity and the development of the Territory economy;

26 Fiscal Strategy Statement
2017-18 Budget
• formulate and apply spending and taxing policies so as to give rise to a reasonable degree of stability and predictability;
• ensure funding for services is provided by the current generation; and
• prudently manage financial risks faced by the Territory (having regard to economic circumstances), including the maintenance of Territory debt at prudent levels.
These financial management principles underpin the Territory’s fiscal strategy that consists of the following four components:
• sustainable service provision;
• infrastructure for economic and community development;
• competitive tax environment; and
• prudent management of debt and liabilities.
Sustainable Service Provision The Government’s overarching target in sustainable service provision is to achieve a general government sector net operating surplus. The decline in revenue growth and softening in economic conditions since the 2016‑17 Mid‑Year Report presents a significant challenge for government to maintain a pattern of improving operating results over the budget cycle. It is for this reason that short and medium‑term targets have been set to achieve this key fiscal target.
Short‑term target: Maintain an improving operating position over the budget cycle by ensuring growth in general government operating expenses is declining in real termsWhen compared to other jurisdictions, the Territory has a limited own‑source revenue base and therefore remains heavily reliant on Commonwealth revenues, which represent around 76 per cent of total revenues. Accordingly, the Territory has little control or influence over the level of revenue it is able to generate, it can however, directly influence the level of expenditure.
To assist in achieving this target, the 2017–18 Budget contains a number of measures. These measures are:
• introduction of a wages policy that limits wages growth to 2.5 per cent across the forward estimates;
• budget improvement measures including operational reforms, program rationalisation and productivity improvements; and
• reduction in discretionary spending such as advertising, communications, marketing and travel costs.
As foreshadowed in the 2016‑17 Budget, the efficiency dividend increases from 2 per cent in 2016‑17 to 3 per cent in 2017‑18 placing further downward pressure on the growth in expenses.
As seen in Table 3.1 the Territory’s total expenses are projected to grow on average by 0.1 per cent per annum over the forward estimates from the Budget year, lower than the average agency‑funded consumer price index (CPI) of 2.2 per cent over the same period. The estimated annual average growth in operating expenses is also lower than the 0.5 per cent projected at the time of the PEFO and 1.0 per cent forecast in the 2016‑17 Mid‑Year Report.

Fiscal Strategy Statement 27
Budget Strategy and Outlook
Table 3.1: General Government Sector – Expenditure Growth
2017‑18Budget
2018‑19 2019‑20 2020‑21AverageForward Estimate
Total operating expenses ($M) 6 109 5 847 6 021 6 108
Year‑on‑year percentage increase (%) 2.5 ‑ 4.3 3.0 1.4 0.1
Consumer price index funded (%) 0.0 1.5 2.5 2.5 2.2
Source: Department of Treasury and Finance
The estimated reduction in the Territory’s GST revenue, the Territory’s largest source of untied revenue, has made operating deficits unavoidable over the budget cycle. Yet, the Territory Government is committed to delivering services and investing in infrastructure. The short‑term strategy of ensuring general government operating expenses growth is declining in real terms, will assist in ensuring the operating deficit is kept to a minimum until the economy recovers.
Medium‑term target: Achieve a general government sector net operating surplus that ensures new general government capital investment is funded through revenues rather than borrowings The economy and associated revenue growth returning to long‑term conditions, combined with continual focus on limiting expenditure growth, will enable the Territory Budget to return to an operating surplus over the medium term and provide the capacity to invest in infrastructure without the need for additional borrowings. This in turn, will enable government to embark on the medium to long‑term strategy of retiring debt incurred during the current economic downturn.
Table 3.2 highlights the impact of reduced GST revenue on the forward estimates, with operating deficits now projected in all years. As described in Chapter 2, in the absence of these revenue reductions the operating balance would have returned to surplus in 2019‑20 and 2020‑21.
Table 3.2: General Government Sector – Net Operating Balance
2016‑17 2017‑18 2018‑19 2019‑20 2020‑21
Estimate Budget Forward Estimate
$M $M $M $M $M
2016 PEFO 5 ‑ 34 ‑ 87 23 n.a.
2016‑17 Mid‑Year Report 1 ‑ 64 ‑ 72 67 n.a.
2017‑18 Budget ‑ 50 ‑ 503 ‑ 509 ‑ 561 ‑ 556
Variation from 2016 PEFO ‑ 55 ‑ 469 ‑ 422 ‑ 584 n.a.
n.a.: not available at the time of publishing the August 2016 PEFO and 2016‑17 Mid‑Year ReportSource: Department of Treasury and Finance
28 Fiscal Strategy Statement
2017-18 Budget
Infrastructure for Economic and Community Development Short‑term target: Stimulate the economy by maintaining general government sector infrastructure spending to at least twice the level of depreciation on average over the immediate Budget cycle to 2020Capital investment is essential to meet the Territory’s social and economic needs. This is particularly relevant in periods of economic downturn, where short‑term, counter‑cyclical increases in infrastructure spending provides a stimulus to support economic recovery and sustain jobs in the Territory.
Accordingly, the Territory’s short‑term strategy in relation to infrastructure spending will be general government capital investment equivalent to at least twice the level of depreciation charges, over the immediate economic cycle to 2019‑20.
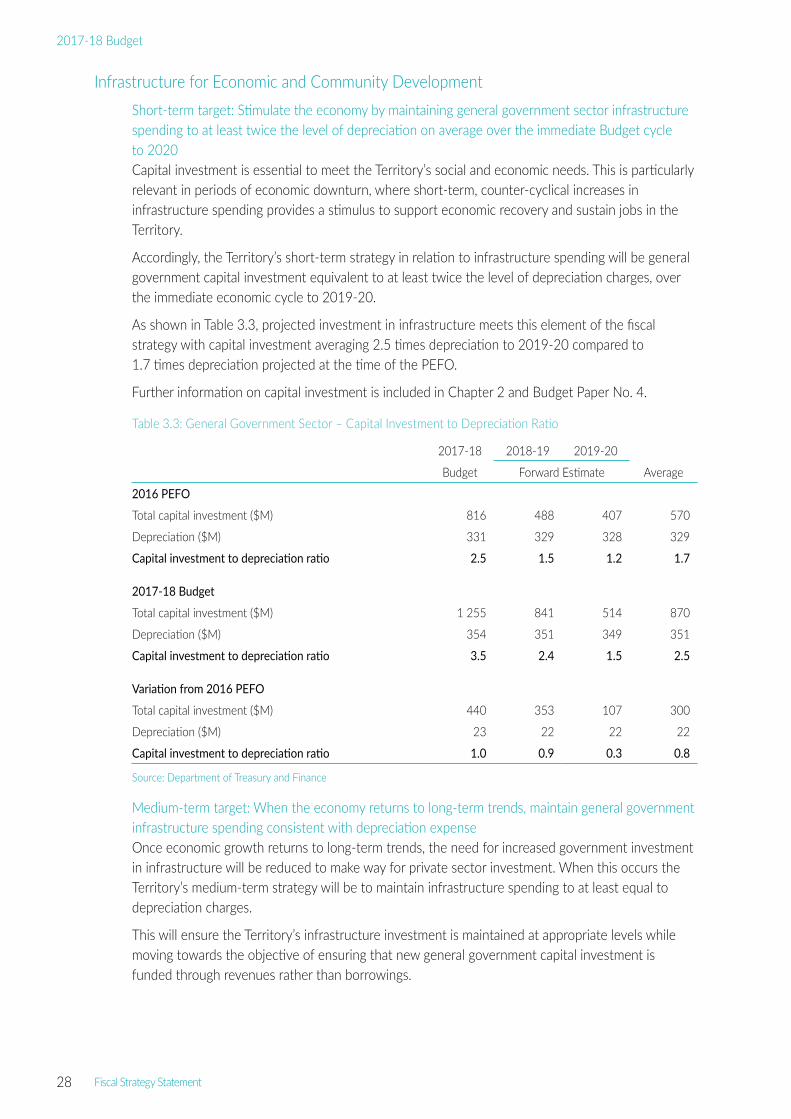
As shown in Table 3.3, projected investment in infrastructure meets this element of the fiscal strategy with capital investment averaging 2.5 times depreciation to 2019‑20 compared to 1.7 times depreciation projected at the time of the PEFO.
Further information on capital investment is included in Chapter 2 and Budget Paper No. 4.
Table 3.3: General Government Sector – Capital Investment to Depreciation Ratio
2017‑18 2018‑19 2019‑20
Budget Forward Estimate Average
2016 PEFO
Total capital investment ($M) 816 488 407 570
Depreciation ($M) 331 329 328 329
Capital investment to depreciation ratio 2.5 1.5 1.2 1.7
2017‑18 Budget
Total capital investment ($M) 1 255 841 514 870
Depreciation ($M) 354 351 349 351
Capital investment to depreciation ratio 3.5 2.4 1.5 2.5
Variation from 2016 PEFO
Total capital investment ($M) 440 353 107 300
Depreciation ($M) 23 22 22 22
Capital investment to depreciation ratio 1.0 0.9 0.3 0.8
Source: Department of Treasury and Finance
Medium‑term target: When the economy returns to long‑term trends, maintain general government infrastructure spending consistent with depreciation expenseOnce economic growth returns to long‑term trends, the need for increased government investment in infrastructure will be reduced to make way for private sector investment. When this occurs the Territory’s medium‑term strategy will be to maintain infrastructure spending to at least equal to depreciation charges.
This will ensure the Territory’s infrastructure investment is maintained at appropriate levels while moving towards the objective of ensuring that new general government capital investment is funded through revenues rather than borrowings.
Fiscal Strategy Statement 29
Budget Strategy and Outlook
Competitive Tax Environment Target: Maintain a competitive tax environment that encourages investment, creates jobs and attracts business to the Territory, while raising sufficient revenue to contribute to funding government’s service delivery requirementsIrrespective of the short to medium‑term fiscal outlook, the Government is committed to maintaining taxation at levels that are competitive with the other jurisdictions, encourages increased levels of business activity in the Territory and raises a sufficient level of own‑source revenue to contribute to government service delivery.
Comparisons of relative tax competitiveness across states are complex due to inherent differences in respective economies and taxation regimes. Chapter 7 describes the representative taxpayer model and compares the main Territory taxes using this model. Another measure of the competitiveness of the Territory’s tax system is taxation effort as assessed by the Commonwealth Grants Commission (CGC).
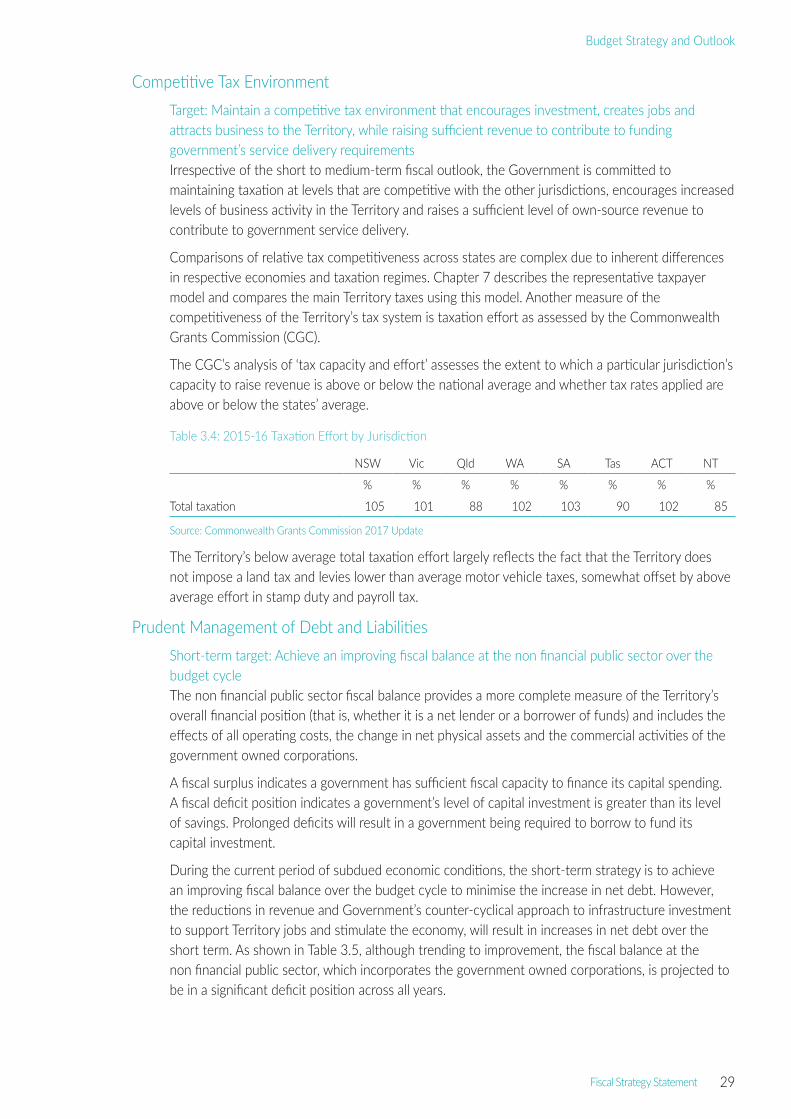
The CGC’s analysis of ‘tax capacity and effort’ assesses the extent to which a particular jurisdiction’s capacity to raise revenue is above or below the national average and whether tax rates applied are above or below the states’ average.
Table 3.4: 2015‑16 Taxation Effort by Jurisdiction
NSW Vic Qld WA SA Tas ACT NT
% % % % % % % %
Total taxation 105 101 88 102 103 90 102 85
Source: Commonwealth Grants Commission 2017 Update
The Territory’s below average total taxation effort largely reflects the fact that the Territory does not impose a land tax and levies lower than average motor vehicle taxes, somewhat offset by above average effort in stamp duty and payroll tax.
Prudent Management of Debt and LiabilitiesShort‑term target: Achieve an improving fiscal balance at the non financial public sector over the budget cycleThe non financial public sector fiscal balance provides a more complete measure of the Territory’s overall financial position (that is, whether it is a net lender or a borrower of funds) and includes the effects of all operating costs, the change in net physical assets and the commercial activities of the government owned corporations.
A fiscal surplus indicates a government has sufficient fiscal capacity to finance its capital spending. A fiscal deficit position indicates a government’s level of capital investment is greater than its level of savings. Prolonged deficits will result in a government being required to borrow to fund its capital investment.
During the current period of subdued economic conditions, the short‑term strategy is to achieve an improving fiscal balance over the budget cycle to minimise the increase in net debt. However, the reductions in revenue and Government’s counter‑cyclical approach to infrastructure investment to support Territory jobs and stimulate the economy, will result in increases in net debt over the short term. As shown in Table 3.5, although trending to improvement, the fiscal balance at the non financial public sector, which incorporates the government owned corporations, is projected to be in a significant deficit position across all years.

30 Fiscal Strategy Statement
2017-18 Budget
Table 3.5: Non Financial Public Sector – Fiscal Balance
2016‑17 2017‑18 2018‑19 2019‑20 2020‑21
Estimate Budget Forward Estimate
$M $M $M $M $M
2016 PEFO ‑ 876 ‑ 431 ‑ 154 1 n.a.
2016‑17 Mid‑Year Report ‑ 875 ‑ 459 ‑ 183 29 n.a.
2017‑18 Budget ‑ 552 ‑ 1 312 ‑ 859 ‑ 611 ‑ 572
Variation from 2016 PEFO 324 ‑ 881 ‑ 705 ‑ 612 n.a.
n.a.: not available at the time of publishing the August 2016 PEFO and 2016‑17 Mid‑Year ReportSource: Department of Treasury and Finance
Medium to long‑term target: The Territory’s non financial public sector net debt as a percentage of revenue is returning towards the long‑term average of 40 per cent Over the medium to long term, this element of the strategy is for the Territory’s non financial public sector net debt as a percentage of revenue to return to the long‑term average of 40 per cent. This strategy will be dependent on achieving operating surpluses at the general government sector to provide capacity to invest in infrastructure without requiring additional borrowings, combined with improvements in the government owned corporations’ commercial sustainability. This element of the fiscal strategy aims to ensure debt is prudently managed, taking into consideration service delivery needs and capital investment in infrastructure to promote social wellbeing and economic growth.
Given the focus on the Territory’s government owned corporations following structural separation, it is considered prudent to incorporate these entities in government debt targets to monitor continued improvement in their financial performance. In addition, Moody’s Investor Services, the credit rating agency that publishes an independent assessment of the Territory’s financial position, considers the Territory’s debt burden at the non financial public sector. For these reasons it is more appropriate to focus on the non financial public sector for this element of the strategy, as it includes both general government and the public non financial corporations. In the Territory context, the non financial public sector encompasses the Territory’s government owned corporations, including the Power and Water Corporation (PWC), Jacana Energy and Territory Generation.
The Territory’s net debt position is projected to increase as a consequence of increased operating deficits and increased investment in infrastructure coupled with low commercial rates of return realised by PWC and Territory Generation.
Table 3.6: Non Financial Public Sector – Net Debt
2016‑17 2017‑18 2018‑19 2019‑20 2020‑21
Estimate Budget Forward Estimate
$M $M $M $M $M
2016 PEFO 2 665 3 023 3 118 3 094 n.a.
2016‑17 Mid‑Year Report 2 669 3 059 3 182 3 134 n.a.
2017‑18 Budget 2 358 3 604 4 404 4 939 5 479
Variation from 2016 PEFO ‑ 307 581 1 286 1 845 n.a.
n.a.: not available at the time of publishing the August 2016 PEFO and 2016‑17 Mid‑Year ReportSource: Department of Treasury and Finance
The aforementioned fiscal strategies aimed at improving operating and fiscal deficits will ensure debt levels are kept to a minimum until the economy recovers. Once revenues return to more normal levels, the government’s strategy is to apply any excess revenues to retiring debt accumulated as a result of the subdued economic conditions.

Fiscal Strategy Statement 31
Budget Strategy and Outlook
Such improvements in the operating and fiscal balances will result in lower net debt levels and set the pathway for the net debt to revenue ratio to return to the long‑term average of 40 per cent, as experienced over the last 10 financial years. However over the immediate budget cycle, as shown in Table 3.7, net debt to revenue is projected to increase to 87 per cent by 2020‑21.
Table 3.7: Non Financial Public Sector – Net Debt to Revenue
2016‑17 2017‑18 2018‑19 2019‑20 2020‑21
Estimate Budget Forward Estimate
% % % % %
2016 PEFO 41 47 48 46 n.a.
2016‑17 Mid‑Year Report 40 47 49 46 n.a.
2017‑18 Budget 36 58 73 80 87
Variation from 2016 PEFO ‑ 5 11 25 34 n.a.
n.a.: not available at the time of publishing the August 2016 PEFO and 2016‑17 Mid‑Year ReportSource: Department of Treasury and Finance
ConclusionThe 2016‑17 Mid‑Year Report contained fiscal outcomes that set the Budget on a pathway to surplus by 2019‑20. The decline in revenues, largely GST, in excess of about $2 billion since PEFO, together with moderating economic conditions in the Territory have presented immediate challenges to the Government acheiving this aim. Despite a number of budget improvement measures that will realise cumulative savings of about $800 million over the budget cycle, the deterioration in all fiscal measures since the 2016‑17 Mid‑Year Report is pronounced. Without a significant rebound in revenues and ongoing expenditure containment measures, a return to a surplus position is unlikely over the medium term. However the commitment of government to restrain recurrent expenditure, thereby avoiding structural deficits, should allow a pathway over the longer term for the budget to return to surplus as soon as it is economically prudent to do so.

32
2017-18 Budget

Risks and Contingent Liabilities 33
Budget Strategy and Outlook
Chapter 4Risks and Contingent Liabilities
As required under section 10(1)(e) of the Fiscal Integrity and Transparency Act (FITA) each fiscal outlook report is required to contain ‘a statement of the risks, quantified as far as practicable, that could materially affect the updated financial projections, including any contingent liabilities and any related Government negotiations that have yet to be finalised’.
This chapter outlines the potential effect of risks to the Budget due to changes in revenue and expense estimates and the likelihood of contingent liabilities becoming actual liabilities.
Risks to the BudgetRevenue
GST RevenueVolatility in GST revenue represents the largest revenue risk for the Northern Territory, with GST revenue accounting for about 47 per cent in 2017‑18 of the Territory’s total revenue. The risk is evident in the context of the 2017‑18 Budget where GST revenue has been reduced by $397 million in the Budget year and around $2 billion over the budget cycle, when compared to estimates in the August 2016 Pre‑Election Fiscal Outlook. These changes in GST revenue estimates have significantly affected the Territory’s fiscal capacity across the forward estimates period.
The Territory’s GST entitlement is dependent on three parameters: national GST collections, the Territory’s share of the national population, and GST relativities as determined by the Commonwealth Treasurer based on recommendations of the Commonwealth Grants Commission (CGC). There are many variables that influence each of these parameters, adding to the complexity of forecasting GST revenue over the budget and forward estimates period.
Given the higher than anticipated fall in the Territory’s share of GST revenue and subdued national consumption, the Territory considers there is reasonable downside risk for each of the three GST parameters over the forward estimates that would adversely impact the Territory’s GST revenue estimates.
GST Pool – The Territory’s estimates of the GST pool in 2017‑18 and over the forward estimates period are informed by the Commonwealth’s published advice and forecasts of national economic indicators.
The Territory’s GST revenue is directly affected by variations in the GST pool. A ±1 percentage point change in the GST pool growth rate is estimated to have a ±$28 million impact on the Territory’s GST revenue in 2017‑18. If variations of ±1 percentage point occurred in each of the budget and forward estimates years, the cumulative impact on Territory GST revenue is about ±$304 million.
Territory’s Share of National Population – The Territory’s population is expected to grow at a slower rate than nationally over the budget and forward estimates period. Estimates of the Territory’s population growth relative to the national rate influence the Territory’s share of the national population, and therefore affect forecasts of the Territory’s GST revenue. The effect of a ±1 percentage point variation in the Territory’s forecast population growth is estimated at ±$28 million in 2017‑18, all other things being equal. The cumulative impact of a ±1 percentage point variation in the estimate of the Territory’s population growth rate over the budget and forward estimates period is about ±$303 million.
GST Relativities – The CGC is responsible for recommending GST relativities, which are updated each year to incorporate new data and changes in states’ fiscal capacities. In its 2017 Update, the

34 Risks and Contingent Liabilities
2017-18 Budget
CGC recommended a significant decrease in the Territory’s GST relativity from 5.28450 in 2016‑17 to 4.66024 in 2017‑18.
The impact of a 1 per cent variation in the Territory’s GST relativity is around ±$28 million per annum. A ±1 percentage point variation in the Territory’s GST relativity in each year of the forward estimates period would have a cumulative effect of around ±$118 million.
The above analysis examines the effect of variations in estimates of each parameter in isolation. However, these parameters interact and, as a result, variations in each parameter could have a compounding or offsetting effect on GST revenue estimates.
Other Commonwealth Grants and SubsidiesCommonwealth funding is provided under the Intergovernmental Agreement on Federal Financial Relations (IGA), through specific purpose payments (SPPs), National Health Reform (NHR) payments, Students First Funding and national partnership (NP) payments, and through Commonwealth own‑purpose expenses (COPEs) provided directly to agencies.
The IGA provides for flexibility of expenditure of SPPs across the relevant sector (skills and workforce, disability and housing sectors) without input controls, co‑investment or maintenance of effort requirements. These payments are ongoing and indexed on a sector‑specific basis, providing a degree of certainty for the Territory’s funding, although adequacy of indexation in terms of capturing growth in costs remains an ongoing risk.
NHR payments are based on either hospital activity or block funding for smaller hospitals in recognition of their circumstances. Between 2017‑18 and 2019‑20, the Commonwealth will cap its total contribution to NHR payments at 6.5 per cent, with arrangements in place for distributing this funding across states. In addition, the Territory has negotiated an annual contingency amount of up to $15 million should there be a gap between the Territory’s hospital activity and the Commonwealth’s cap during this period.
NP agreements continue to include many risks to states including co‑investment, input controls, burdensome reporting and administrative arrangements, and the Commonwealth’s potential withdrawal of funding. The expiry of NP agreements, which by their nature are time limited, also potentially poses a risk to the Territory’s Budget, particularly where funding has raised service delivery expectations.
The Territory has 13 NP agreements, including schedules under agreements, for which funding is expected to expire during 2016‑17, totalling $26.7 million in 2016‑17. Funding associated with a further nine NP agreements, including schedules under agreements, totalling $152.5 million is due to expire by the end of 2017‑18. Should the funding under these agreements not be renewed or rolled into an existing SPP, the Territory would need to either reduce service delivery levels or provide additional funding. In addition, timing of Commonwealth decisions regarding the treatment of expiring NP agreements and their funding is also critical to ensure appropriate planning and continuity of service delivery or to allow for alternative approaches to be considered should funding be declined or not available.
The Commonwealth has not committed to funding arrangements for schools beyond 2019‑20. Uncertainty around the long‑term funding arrangements for this core service represents a potential further risk to all states and territories.
Additionally, if future Commonwealth reform agendas are introduced that affect the delivery and funding arrangements for core government services and do not adequately recognise the needs of the Territory, there is a risk that funding for these services may be insufficient to continue the delivery of services at current levels, requiring either budget reprioritisation or a reduction in the scope of services provided.

Risks and Contingent Liabilities 35
Budget Strategy and Outlook
Own‑Source RevenueThe amount of revenue received from Territory taxes and royalties is dependent on the performance of the Territory economy and other external factors. Forecasting such revenue involves judgements and assumptions made about the performance of the various economic factors and indicators that directly affect Territory taxes and royalties, such as growth in wages, employment, average hours worked, commodity prices, market activity and exchange rates.
It is challenging to accurately predict revenue collections into the future, particularly for the later years of the forward estimates. The most difficult source of revenue to forecast is mining royalty revenue because it is influenced by a number of factors, but predominantly mineral pricing, production levels and exchange rate conditions.
Mining revenue forecasts rely mainly on advice from mining companies of their expected liability for the financial year. Unpredicted market changes in mineral prices, production or exchange rates will have a material effect on this forecast. Notwithstanding this volatility, the importance of royalties as a source of revenue is evident in the 2017‑18 Budget.
Forecasting conveyance stamp duty is linked to the outlook for the property market. The extent and timing of any market changes in terms of property prices and transaction levels is difficult to predict and can have a significant effect on conveyance duty collections. In particular, residential property demand is heavily influenced by market sentiment, and the continued softness in prices and transaction volumes will be impacted by the labour market and interstate migration flows.
In addition, the Territory has a relatively small conveyance duty base, which includes valuable commercial properties such as pastoral properties and mining projects. These factors introduce significant variability in collections as a result of the impact of the duty collected from large commercial transactions.
Growth in gambling taxes tend to trend towards long‑term population growth rates, although structural shifts in gambling habits toward online gambling has made forecasting of some tax types more uncertain. An additional risk in forecasting gambling taxes lies around uncertainty of the effect of proposed point of consumption taxes on online bookmakers. It is difficult to forecast how such taxes or changes to the regulation of online gambling affect the business of online bookmakers registered in the Territory.
Payroll tax generally provides more stable revenue than royalties and conveyance stamp duty. With a range of potential major projects not included in forecasts given the uncertainty around final investment decisions and timing, payroll tax collections are expected to decline in the next two financial years before recovering modestly from 2019‑20. Given the size of the Ichthys liquefied natural gas (LNG) project, there is a risk in this forecast relating to the timing of the relevant phases of the project. Forecasts are based on publicly available information and delays in the transition of the project from construction to a much smaller ongoing production workforce will influence payroll tax collections. More broadly any variations to projected employment and wages growth across the Territory would also affect estimated payroll tax collections.
In total, a variation of ±1 per cent to the parameters used to forecast Territory taxes and royalties would affect revenue by about $8 million for 2017‑18.

36 Risks and Contingent Liabilities
2017-18 Budget
Expenses and PaymentsThe forward estimates for expenses are based on known policy decisions, with adjustments for non‑policy changes.
The most significant risk to the expense estimates is budget pressures due to increased cost and demand and the inability to meet savings measures factored into agency budgets.
The 2017‑18 Budget includes a reduction to the approved wage parameter from 3 per cent to 2.5 per cent from 2017‑18 ongoing in line with Government’s wages policy. Future enterprise bargaining agreements represent a risk to the Budget to the extent that the outcome of negotiations exceeds amounts currently factored into the forward estimates.
The 2017‑18 Budget also includes a reduction in the consumer price index from 1.5 per cent to zero in 2017‑18 and from 2.5 per cent to 1.5 per cent in 2018‑19, with the forward estimates remaining unchanged at 2.5 per cent from 2019‑20 ongoing. A reduction in the efficiency dividend discount for frontline agencies from 75 per cent to 67 per cent from 2017‑18 ongoing has also been incorporated in the 2017‑18 Budget, to the extent agencies are unable to achieve the efficiencies built into their budgets, represents a risk to the fiscal projections contained in this report.
In accordance with FITA, the 2017‑18 Budget includes forward estimates up to 2020‑21. There is the potential for the fiscal aggregates beyond the forward estimates period to be affected by existing commitments. These could either take the form of recurrent costs not expected to crystallise until later in the forward estimates period, recurrent initiatives that roll out over time and have therefore not yet reached their peak of funding, or capital infrastructure for which the associated recurrent costs are not fully incorporated into forward years as their completion falls either close to or outside of the forward estimates period.
Royal Commission into the Protection and Detention of Children in the Northern TerritoryThe Royal Commission into the Protection and Detention of Children in the Northern Territory was announced by the Prime Minister on 26 July 2016. The Commission delivered an interim report on 31 March 2017 and is expected to deliver its final report by 1 August 2017. The Territory’s contribution to the Commonwealth to conduct the Royal Commission has now been factored into this report. However, the costs of implementing any recommendations that arise from the Royal Commission are not quantifiable at this time and therefore are not included in the revised fiscal projections but are likely to affect the fiscal aggregates contained in the 2017‑18 Budget.
Government Owned CorporationsHigher than anticipated expenses have emerged following the separation of the Power and Water Corporation into three stand‑alone government owned corporations. These expenses predominantly reflect the corporations establishing their own back office functions, standalone business systems and processes, and establishing short‑term project management roles to manage specific one‑off transformation projects. However, the benefits from improved competition and strengthened corporate transparency and accountability are expected to result in future financial improvements.
Further increases in government owned corporation expenses have been mitigated through the preparation of each government owned corporation’s Statement of Corporate Intent, the annual performance agreement between the board and the shareholding minister. Through this process, the corporations’ corporate and operational structures have been reviewed to ensure in the future they are operating efficiently and are financially sustainable.
To the extent that each corporation is unable to achieve its Statement of Corporate Intent targets represents an ongoing risk to the Budget.

Risks and Contingent Liabilities 37
Budget Strategy and Outlook
Risks to Economic ForecastsEconomic forecasts incorporated in the Budget Papers are subject to a number of upside and downside risks and uncertainties. Economic conditions in the Territory also tend to be highly volatile due to the relatively small size of the Territory’s economy and this is often reflected in the available data, which can be subject to significant revisions.
The availability, range of sources and volatility of data for the Territory’s economy presents an underlying risk to forecasts, particularly in relation to the reporting of capital expenditure for major projects. Some data is confidentialised, making it difficult to report when actual expenditure occurs. There are also difficulties associated with the measurement of interstate trade flows and other complexities associated with the balancing item of gross state product (GSP), the components of which are not available publicly.
Most significant for current Territory forecasts is the timing and quantum of investment associated with the Ichthys LNG project. Given the size of the project, it has been factored into forecasts based on publicly available information, including timing of completion and anticipated commencement of production. However, further delays in the transition of the project from construction to the production and export phase will potentially influence a range of economic indicators, particularly GSP growth, employment and population forecasts.
There is also a range of other major projects not included in the Territory’s economic forecasts, given the uncertainty around final investment decisions, timing, levels of proposed expenditure and other impacts on the economy, including projects such as the Mount Peake rare earths mine, Ammaroo phosphate mine, Project Sea Dragon and some initiatives outlined in the 2016 Defence White Paper.
The Territory economy is heavily exposed to changes in the global economy. Movements in global commodity prices can have significant impacts on the viability of mining activity in the Territory, as experienced in recent years. Also, global oil prices can impact the cost of living and doing business in the Territory, affecting not only the price of automotive fuel for consumers but also transport costs, as well as other goods and services.
Movements in the Australian dollar against other currencies (mainly the United States dollar) will influence the cost of the Territory’s imports and the competitiveness of Territory goods and service exports, largely affecting industries such as tourism, agriculture, and mining and manufacturing.
Economic conditions in other Australian jurisdictions also present risks to the Territory’s economic forecasts. This includes effects on the labour market and interstate migration flows. The relative labour market conditions in other jurisdictions can affect the availability of labour in the Territory. Interest rate movements also present uncertainty for the Territory economy, particularly influencing business, residential property, and household consumption and investment.
Adverse weather conditions and natural disasters (such as cyclones, flooding, drought and climate variability) are also key risks to many of the Territory’s economic forecasts and have the potential to place upward pressure on food prices due to effects on agricultural production across the country.
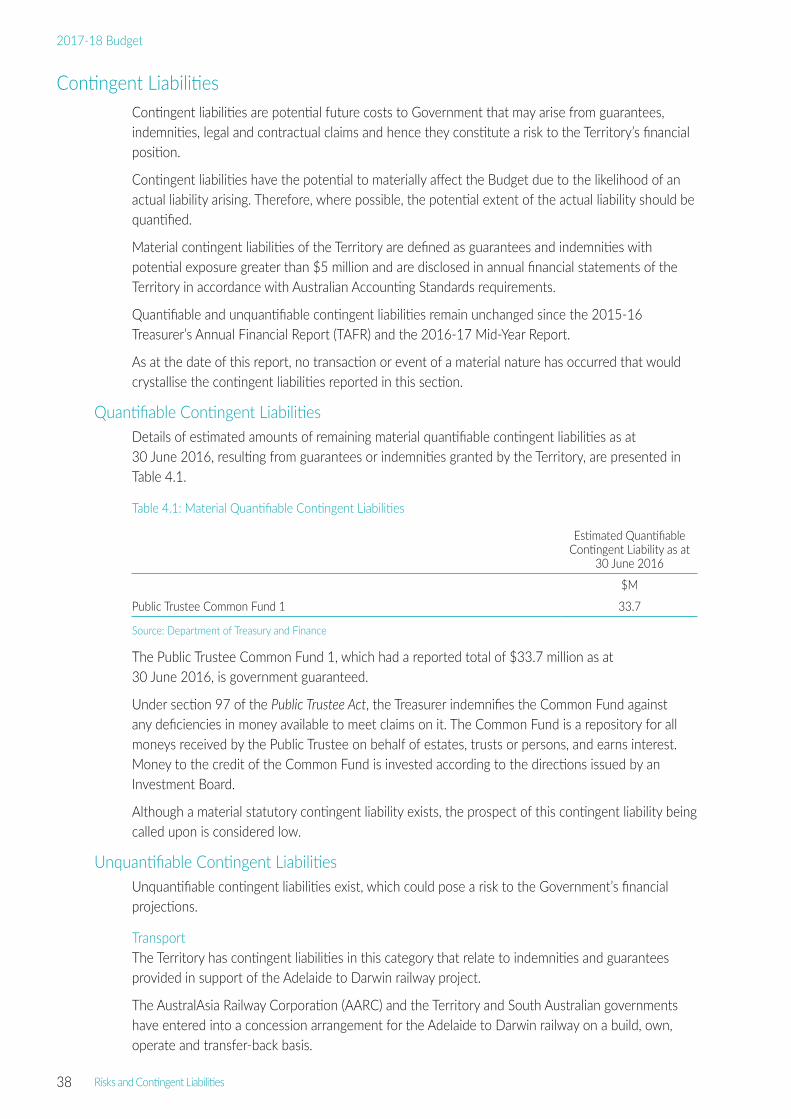
38 Risks and Contingent Liabilities
2017-18 Budget
Contingent LiabilitiesContingent liabilities are potential future costs to Government that may arise from guarantees, indemnities, legal and contractual claims and hence they constitute a risk to the Territory’s financial position.
Contingent liabilities have the potential to materially affect the Budget due to the likelihood of an actual liability arising. Therefore, where possible, the potential extent of the actual liability should be quantified.
Material contingent liabilities of the Territory are defined as guarantees and indemnities with potential exposure greater than $5 million and are disclosed in annual financial statements of the Territory in accordance with Australian Accounting Standards requirements.
Quantifiable and unquantifiable contingent liabilities remain unchanged since the 2015‑16 Treasurer’s Annual Financial Report (TAFR) and the 2016‑17 Mid‑Year Report.
As at the date of this report, no transaction or event of a material nature has occurred that would crystallise the contingent liabilities reported in this section.
Quantifiable Contingent LiabilitiesDetails of estimated amounts of remaining material quantifiable contingent liabilities as at 30 June 2016, resulting from guarantees or indemnities granted by the Territory, are presented in Table 4.1.
Table 4.1: Material Quantifiable Contingent Liabilities
Estimated Quantifiable Contingent Liability as at
30 June 2016
$M
Public Trustee Common Fund 1 33.7
Source: Department of Treasury and Finance
The Public Trustee Common Fund 1, which had a reported total of $33.7 million as at 30 June 2016, is government guaranteed.
Under section 97 of the Public Trustee Act, the Treasurer indemnifies the Common Fund against any deficiencies in money available to meet claims on it. The Common Fund is a repository for all moneys received by the Public Trustee on behalf of estates, trusts or persons, and earns interest. Money to the credit of the Common Fund is invested according to the directions issued by an Investment Board.
Although a material statutory contingent liability exists, the prospect of this contingent liability being called upon is considered low.
Unquantifiable Contingent LiabilitiesUnquantifiable contingent liabilities exist, which could pose a risk to the Government’s financial projections.
TransportThe Territory has contingent liabilities in this category that relate to indemnities and guarantees provided in support of the Adelaide to Darwin railway project.
The AustralAsia Railway Corporation (AARC) and the Territory and South Australian governments have entered into a concession arrangement for the Adelaide to Darwin railway on a build, own, operate and transfer‑back basis.

Risks and Contingent Liabilities 39
Budget Strategy and Outlook
Unquantifiable contingent liabilities of the Territory in relation to the Adelaide to Darwin railway project relate to the following:
• joint guarantee of the obligations of AARC; and
• indemnities granted in relation to title over the railway corridor (title is secure but the indemnity continues).
Prior to the long‑term lease of the Port of Darwin, the railway corridor interfacing the port was owned by Darwin Port Corporation (DPC), which leased the facilities to the concession holder. As part of the restructure of the port arrangements, the railway corridor was transferred to the Territory and leased to the concession holder. There are contingent liabilities that arise out of any loss or claim incurred or suffered as a result of the Territory’s failure to comply with its environmental obligation contained in the lease. The lease contains similar indemnities given by the lessee with respect to contamination caused by the lessee and a failure to comply with its environmental obligations. To the extent that DPC had contingent liabilities prior to the Port of Darwin transaction, the Territory Government has the same contingent liabilities now.
AARC and the governments have comprehensive risk management procedures in place for all events that would give rise to liabilities.
The Territory Government has entered into agreements for the relocation of fuel terminals from near the Darwin central business district to East Arm industrial estate. The agreements include certain unquantifiable contingent liabilities in favour of the developer of the fuel terminal and Shell, an oil company. Government has put in place comprehensive risk management processes to address potential exposure.
The Territory has assumed DPC’s indemnity in relation to certain remedial works at East Arm Port. The indemnity covers third‑party claims, loss, damage, cost and expenses that may be incurred or sustained by Shell arising out of any breach of the Territory’s obligation under the agreement, or in connection with any failure of defect in the integrity of the bunker lines, as well as rectification of damage to the wharf. Comprehensive risk management procedures are in place to minimise risk exposure to the Territory.
Contingent considerations in relation to the long‑term lease of the Port of Darwin are considered unlikely and consequently no contingent liabilities have been disclosed at this time. The Territory will continue to assess any risks under the arrangement and determine whether any future disclosure is required.
Gas The Territory has entered into a number of agreements in relation to the Northern Gas Pipeline. Contingent considerations in relation to these agreements are considered unlikely and consequently no contingent liabilities have been disclosed at this time. The Territory will continue to assess any risks under the arrangement and determine whether any future disclosure is required.
Health and Community Services The Territory has granted a series of health‑related indemnities for various purposes including indemnities to specialist medical practitioners employed or undertaking work in public hospitals, indemnities provided to medical professionals requested to give expert advice on inquiries before the Medical Board and indemnities to midwives.
Although the risks associated with health indemnities are potentially high, the beneficiaries of the indemnities are highly trained and qualified professionals. The indemnities generally cannot be called upon where there is wilful or gross misconduct on the part of the beneficiary.
There are no reportable contingent liabilities in this category.

40 Risks and Contingent Liabilities
2017-18 Budget
Government AdministrationWhere the Territory has invited the participation of private sector persons and government officers on boards of government owned or funded companies, the Territory may grant indemnities to the board members to cover them for any losses that may result from good faith actions.
These indemnities are generally consistent with cover available through Directors and Officers Insurance and the policy of issuing an indemnity rather than purchasing commercial insurance is in line with the Government’s self‑insurance arrangements.
In relation to corporations established in accordance with the Government Owned Corporations Act, an indemnity given by the Territory to board members is limited to actions arising from compliance with a direction issued by the shareholding minister or the portfolio minister pursuant to the Government Owned Corporations Act.
The resulting contingent liabilities are considered low risk as board members are professionals, selected based on their expertise and knowledge. Further, the indemnities are restricted to good faith actions only. These contingent liabilities are unquantifiable.
Indemnities are also granted to the Commonwealth and other entities involved in funding or sponsoring activities and programs initiated or undertaken by the Territory. Under the indemnities, the Territory generally accepts liability for damage or losses occurring as a result of the activities or programs and acknowledges that, while the Commonwealth or another party has contributed financially or provided in‑kind support, the Territory is ultimately liable for the consequences of the activity or program.
Although the resulting contingent liability may, depending on the activity undertaken, not always be low risk, the Territory’s financial exposure is no greater than would have been the case without funding or sponsorship assistance. These contingent liabilities are unquantifiable.
Where the Territory is engaged in legal proceedings and disputes, due to the wide variety and nature of these cases and the uncertainty of any potential liability, no value can be attributed to these cases. In addition, the attribution of a value to these cases also has the potential to prejudice the outcome of the proceedings and disputes.
Secure FacilitiesThe Territory has contingent liabilities in this category that relate to indemnities and guarantees provided in support of the Darwin Correctional Precinct that was constructed and is operated under a public private partnership agreement.
The Territory has indemnified the proponent for losses arising from uninsurable risks.
FinanceThe Territory’s financial management framework is underpinned by centralised banking arrangements. The sole provider of banking‑related services has been granted indemnities under the whole of government banking contract. These indemnities are considered not to involve significant risk.
There are no reportable contingent liabilities in this category.
Property and Business ServicesAgreements for leases or licences of property, plant or equipment generally contain standard indemnity provisions, similar to those commonly found in commercial leases, covering the lessor or licensor for any losses suffered as a result of the lease or licence arrangement. The contingent liabilities resulting from the indemnities are unquantifiable.

Risks and Contingent Liabilities 41
Budget Strategy and Outlook
The granting of a concession to Darwin Cove Convention Centre Pty Ltd, gives rise to contingent liabilities associated with:
• discriminatory changes in law;
• environmental cleanup costs;
• incentive payments to the operator if performance targets established for the centre are exceeded; and
• negotiated payments to the operator in the early years of the centre’s operation.
For the categories listed above, neither the probability nor the amount that the Territory might be called upon to pay at some future date can be determined reliably. As a result, these items are regarded as contingent liabilities, where the existence of an actual liability in the future will be confirmed only by the occurrence of uncertain future events that lie outside the control of the Territory.
A contingent asset also arises as a consequence of the concession arrangement. The Territory Availability Payment (TAP) is recognised as a liability on the general government sector and whole of government balance sheets. However, the Territory has the right to recover up to 75 per cent of that liability if the operator should not achieve certain performance criteria. Because neither the probability of such a recovery nor the amount that might be recovered can be determined reliably, the part of the TAP that may be subject to abatement is classified as a contingent asset.

42
2017-18 Budget

Budget Initiatives 43
Budget Strategy and Outlook
Chapter 5Budget Initiatives
This chapter summarises the Government’s new expenditure and revenue initiatives including Budget improvement measures incorporated in the 2017‑18 Budget.
New InitiativesNew initiatives identify the funding allocated to implement election commitments and new policy decisions. For more detail on initiatives, as well as capital works projects proceeding in 2017‑18 by agency, refer to Budget Paper No. 3.
Budget Improvement MeasuresThe 2017‑18 Budget includes approved Budget improvement measures for a number of agencies. The measures have been grouped under the following categories.
Operational reforms are initiatives delivering savings through more efficient use of existing administrative resources and rationalisation of administration tasks to focus on core agency functions.
Program rationalisation delivers savings through more efficient use of existing program resources and program rationalisation to focus on efficient delivery of priority programs and functions.
Natural attrition involves agencies not filling vacant positions in targeted areas.
Wages policy relate to savings arising from reducing wages indexation in agency budgets from 3 per cent to 2.5 per cent, consistent with Government’s wages policy.
Productivity improvements – consumer price index (CPI) reduces CPI indexation in agency budgets to zero per cent in 2017‑18 and 1.5 per cent in 2018‑19, with 2.5 per cent thereafter, consistent with updated economic forecasts.
Productivity improvements – efficiency adjustments reduces the efficiency dividend discount on frontline agencies from 75 per cent to 67 per cent. It reflects increased efficiencies in support areas rather than frontline services.
Agencies that do not have new budget initiatives or Budget improvement measures other than wages policy reductions and CPI have not been listed in this chapter.
Other MeasuresConsistent with Government’s election commitments, whole of government savings have also been achieved through reducing agency travel expenditure, rationalisation of the former Communications and Marketing Bureau, a reduction in marketing, advertising placement and production costs across government, and an increase in fees and charges to offset the cost of regulation or providing services to the community.
A discussion on whole of government revenue initiatives is also presented in the last section of this chapter.

44 Budget Initiatives
2017-18 Budget
2016‑17 Estimate
2017‑18 Budget
$000 $000
Department of the Chief MinisterNew initiatives 3 865 41 054
Funding to establish a Hydraulic Fracturing Taskforce 3 050
Establishment of the Independent Commission Against Corruption 3 000
Support for Aboriginal Peak Organisations Northern Territory 250 250
Research and development funds for Charles Darwin University and the Centre for Appropriate Technology
500
Funding for a Centre for Excellence in Solar Energy in Alice Springs 1 500
Funding to develop the Roadmap to Renewables to support Government’s environmental regulation and renewable reform agenda
565 204
Funding to support local decision making 1 300
Develop and implement a Territory Aboriginal land and sea strategy, including prioritising the resolution of outstanding Aboriginal land claims
1 515
Support for governance capacity and capability building in Aboriginal organisations 1 000
Funding to support the Royal Commission into the Protection and Detention of Children in the Northern Territory and inquiries
450
Capacity to provide social, economic and environmental policy advice and coordination 2 635
Funding to support security and emergency recovery 300
Support for peak organisations 1 000
Support and enhance partnerships and systems reform in the non‑government sector 400
Territory Government’s contribution towards the cost of conducting the Royal Commission 27 000
Budget improvement measures ‑ 984
Program rationalisation ‑ 323
Natural attrition ‑ 304
Wages policy ‑ 193
Productivity improvements – CPI ‑ 164
Other measures ‑ 41 ‑ 1 082
Communications and marketing ‑ 1 000
Travel ‑ 41 ‑ 82
Total 3 824 38 988
(continued)

Budget Initiatives 45
Budget Strategy and Outlook
2016‑17 Estimate
2017‑18 Budget
$000 $000
Department of the Legislative AssemblyNew initiatives 1 000
Economic stimulus program – additional repairs and maintenance 1 000
Budget improvement measures ‑ 159
Wages policy ‑ 88
Productivity improvements – CPI ‑ 71
Total 841
Northern Territory Police, Fire and Emergency ServicesNew initiatives 13 000
Funding to purchase and maintain additional closed‑circuit television (CCTV) cameras and related network equipment
2 000
Funding to support increased police resourcing and recruitment 5 000
Economic stimulus program – additional repairs and maintenance 6 000
Budget improvement measures ‑ 5 143
Operational reforms ‑ 2 070
Wages policy ‑ 1 390
Productivity improvements – CPI ‑ 903
Productivity improvements – efficiency adjustments ‑ 780
Other measures ‑ 67 ‑ 1 934
Communications and marketing ‑ 421
Travel ‑ 67 ‑ 133
Revenue measures ‑ 1 380
Total ‑ 67 5 923
(continued)

46 Budget Initiatives
2017-18 Budget
2016‑17 Estimate
2017‑18 Budget
$000 $000
Department of Trade, Business and InnovationNew initiatives 12 378 68 780
Additional funding for business innovation support initiatives 1 000
Contribution to the construction of the ship lift facility 5 000
Supporting Malak markets 60
Home owner grants program for Territory first home owner‑occupiers 2 200 5 700
Grant funding to the Trailer Boat Club 450
Additional funding to coordinate and deliver major Government‑initiated projects and facilitate private sector major projects
500
Funding to establish an independent Buy Local industry advocate 200
Establishment of a Canberra‑based Northern Territory Defence Advocate 500
Public infrastructure to support the Darwin luxury hotel development 10 000
Funding to support economic development and employment initiatives 1 000
Immediate Work Grants program to enable incorporated not‑for‑profit and community organisations to carry out repairs, maintenance and improvements
3 000 27 000
Extend the Home Improvement Scheme for Territory home owner‑occupiers 5 475 10 824
Security Systems Assistance Grants program for Territory businesses to install or upgrade security 5 000
Support for peak organisations 680
Economic summits 1 193
Bring back the Arafura Games 376
Funding for feasibility and market testing for seniors’ villages and a Darwin‑based water park 1 000
Budget improvement measures ‑ 1 997
Program rationalisation ‑ 1 066
Wages policy ‑ 466
Productivity improvements – CPI ‑ 465
Other measures ‑ 33 ‑ 533
Communications and marketing ‑ 467
Travel ‑ 33 ‑ 66
Total 12 345 66 250
(continued)
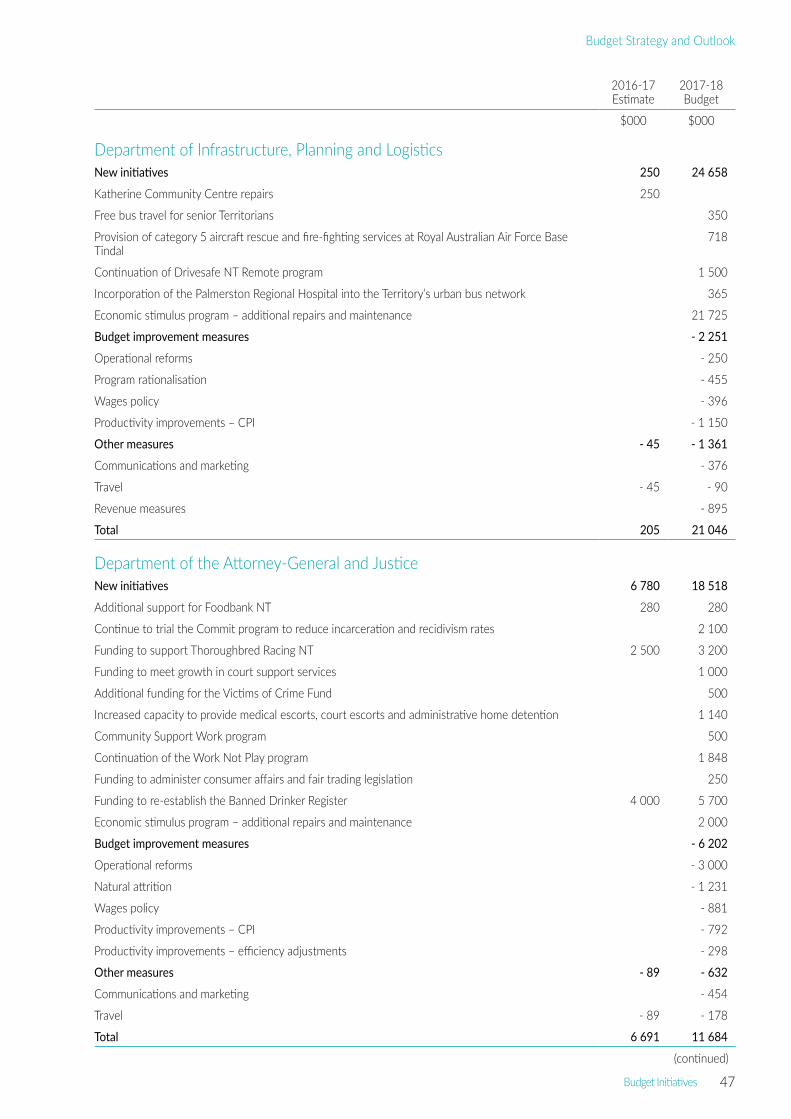
Budget Initiatives 47
Budget Strategy and Outlook
2016‑17 Estimate
2017‑18 Budget
$000 $000
Department of Infrastructure, Planning and LogisticsNew initiatives 250 24 658
Katherine Community Centre repairs 250
Free bus travel for senior Territorians 350
Provision of category 5 aircraft rescue and fire‑fighting services at Royal Australian Air Force Base Tindal
718
Continuation of Drivesafe NT Remote program 1 500
Incorporation of the Palmerston Regional Hospital into the Territory’s urban bus network 365
Economic stimulus program – additional repairs and maintenance 21 725
Budget improvement measures ‑ 2 251
Operational reforms ‑ 250
Program rationalisation ‑ 455
Wages policy ‑ 396
Productivity improvements – CPI ‑ 1 150
Other measures ‑ 45 ‑ 1 361
Communications and marketing ‑ 376
Travel ‑ 45 ‑ 90
Revenue measures ‑ 895
Total 205 21 046
Department of the Attorney‑General and JusticeNew initiatives 6 780 18 518
Additional support for Foodbank NT 280 280
Continue to trial the Commit program to reduce incarceration and recidivism rates 2 100
Funding to support Thoroughbred Racing NT 2 500 3 200
Funding to meet growth in court support services 1 000
Additional funding for the Victims of Crime Fund 500
Increased capacity to provide medical escorts, court escorts and administrative home detention 1 140
Community Support Work program 500
Continuation of the Work Not Play program 1 848
Funding to administer consumer affairs and fair trading legislation 250
Funding to re‑establish the Banned Drinker Register 4 000 5 700
Economic stimulus program – additional repairs and maintenance 2 000
Budget improvement measures ‑ 6 202
Operational reforms ‑ 3 000
Natural attrition ‑ 1 231
Wages policy ‑ 881
Productivity improvements – CPI ‑ 792
Productivity improvements – efficiency adjustments ‑ 298
Other measures ‑ 89 ‑ 632
Communications and marketing ‑ 454
Travel ‑ 89 ‑ 178
Total 6 691 11 684
(continued)

48 Budget Initiatives
2017-18 Budget
2016‑17 Estimate
2017‑18 Budget
$000 $000
Department of HealthNew initiatives 950 28 200
Additional funding to expand the Nurse‑Family Partnership Program 1 000
Funding to support youth substance misuse in remote communities 750
Trial housing accommodation support in Darwin and Palmerston for mental health clients 750 750
Funding for the provision of scholarships to specialise in mental health nursing 200 200
Funding to provide assessment, withdrawal and specialised alcohol treatment services to assist people with alcohol misuse and dependence, as part of the reintroduction of the Banned Drinker Register
15 500
Economic stimulus program – additional repairs and maintenance 10 000
Budget improvement measures ‑ 17 992
Operational reforms ‑ 6 150
Program rationalisation ‑ 700
Natural attrition ‑ 1 938
Wages policy ‑ 3 662
Productivity improvements – CPI ‑ 3 888
Productivity improvements – efficiency adjustments ‑ 1 654
Other measures ‑ 345 ‑ 1 983
Communications and marketing ‑ 1 292
Travel ‑ 345 ‑ 691
Total 605 8 225
(continued)

Budget Initiatives 49
Budget Strategy and Outlook
2016‑17 Estimate
2017‑18 Budget
$000 $000
Department of Housing and Community DevelopmentNew initiatives 11 168 59 820
Expansion of the Homelands Extra Allowance program 1 000
Additional repairs and maintenance funding for remote housing under the Remote Housing Investment Package
20 000
Funding to establish a Strategic Local Government Infrastructure Fund 5 000
Fast‑tracked repairs and maintenance for remote housing 5 000
Additional funding for urban public housing repairs and maintenance 5 000
Operational funding for Apmere Mwerre Visitor Park in Alice Springs 1 300
Additional funding for property management 3 000
Funding for the Territory’s Urban Housing Strategy 4 052
Additional Aboriginal Interpreters to support the Remote Housing Investment Package 1 000
Budget assistance grants to support the Victoria and West Daly regional councils 1 300
Increased funding to support Territory home ownership incentives 1 168 1 168
Incentive funding to support development proposals to construct dwellings for social housing headleasing
10 000
Program management to support the delivery of the Remote Housing Investment Package and land servicing and essential services upgrades in remote communities
7 000
Economic stimulus program – additional repairs and maintenance 5 000
Budget improvement measures ‑ 3 530
Operational reforms ‑ 1 846
Wages policy ‑ 744
Productivity improvements – CPI ‑ 940
Other measures ‑ 55 ‑ 353
Communications and marketing ‑ 243
Travel ‑ 55 ‑ 110
Total 11 113 55 937
Department of Primary Industry and ResourcesNew initiatives 4 100 2 000
Capital grant for the Northern Territory Live Export Association 4 100
Economic stimulus program – additional repairs and maintenance 2 000
Budget improvement measures ‑ 1 250
Program rationalisation ‑ 501
Natural attrition ‑ 276
Wages policy ‑ 237
Productivity improvements – CPI ‑ 236
Other measures ‑ 41 ‑ 311
Communications and marketing ‑ 229
Travel ‑ 41 ‑ 82
Total 4 059 439
(continued)

50 Budget Initiatives
2017-18 Budget
2016‑17 Estimate
2017‑18 Budget
$000 $000
Department of Environment and Natural ResourcesNew initiatives 450 6 350
Grant funding to support Indigenous ranger groups with the purchase of equipment 2 000
Establishment of a Land Management and Conservation Fund to improve conservation practices on Aboriginal lands and sea country
2 000
Increased capacity for the Arid Lands Environment Centre, Environmental Defenders Office and Environment Centre NT
250 250
Charles Darwin University mangrove research grant 200
Establishment of an Indigenous Carbon Unit 500
Intensified cabomba eradication program at Darwin River 600
Additional funding to reduce the fire risks associated with gamba grass infestation 300
Economic stimulus program – additional repairs and maintenance 500
Additional funding of $9.9 million over 5 years to accelerate land resource mapping activities 200
Budget improvement measures ‑ 489
Operational reforms ‑ 14
Natural attrition ‑ 158
Wages policy ‑ 152
Productivity improvements – CPI ‑ 165
Other measures ‑ 48 ‑ 198
Communications and marketing ‑ 102
Travel ‑ 48 ‑ 96
Total 402 5 663
(continued)

Budget Initiatives 51
Budget Strategy and Outlook
2016‑17 Estimate
2017‑18 Budget
$000 $000
Department of Tourism and CultureNew initiatives 3 000 43 875
Funding for tourism initiatives to attract visitors from China and India 1 000 4 000
Upgrades to Purkiss Reserve sporting facilities 5 000
Additional funding for Blatherskite Park 150
National Women’s AFL sponsorship 150
Community Art Gallery grants for a National Iconic Arts Trail 2 000
Funding to support MotorSports NT 2 000 2 000
Urban and Regional Oval Lights Program 3 500
Remote Community Sports Infrastructure Program 5 000
Investing in the tourism industry 8 000
Establishment of an Alcoota megafauna fossil exhibit in the Alice Springs central business district 765
Funding to support the future of the Territory Wildlife Park 4 310
Economic stimulus program – additional repairs and maintenance to support tourism and culture 8 000
Economic stimulus program – additional repairs and maintenance for the Territory Wildlife Park 1 000
Budget improvement measures ‑ 1 750
Operational reforms ‑ 300
Wages policy ‑ 517
Productivity improvements – CPI ‑ 933
Other measures ‑ 60 ‑ 120
Travel ‑ 60 ‑ 120
Total 2 940 42 005
Department of Corporate and Information ServicesNew initiatives 10 387
Additional funding to support the Department of Health through project management of the Core Clinical Systems Renewal Program
1 800
Funding to support a new policing management system to replace the Police Real‑time Online Management Information System
8 587
Budget improvement measures ‑ 2 900
Operational reforms ‑ 2 450
Wages policy ‑ 176
Productivity improvements – CPI ‑ 274
Total 7 487
(continued)

52 Budget Initiatives
2017-18 Budget
2016‑17 Estimate
2017‑18 Budget
$000 $000
Department of EducationNew initiatives 18 606 40 118
Additional funding for increased resourcing of government schools 15 500 31 000
Funding for homelands schools repairs and maintenance 1 000
Capital grants for non‑government Territory schools as part of the Building Better Schools commitment 2 700
Additional funding to support increased enrolments in government schools 2 100 4 200
Funding to support training, mentoring and up‑skilling teachers and principals 1 006 1 218
Budget improvement measures ‑ 8 617
Operational reforms ‑ 1 500
Program rationalisation ‑ 2 490
Natural attrition ‑ 495
Wages policy ‑ 2 265
Productivity improvements – CPI ‑ 950
Productivity improvements – efficiency adjustments ‑ 917
Other measures ‑ 91 ‑ 838
Communications and marketing ‑ 657
Travel ‑ 91 ‑ 181
Total 18 515 30 663
Territory FamiliesNew initiatives 20 403 37 152
Additional support for after‑hours youth activities in Tennant Creek and Alice Springs 375 1 750
Implementation of Dual Pathways to enhance child protection activities 3 000
Funding to support the Pensioner and Carer’s Concession Scheme 3 000 2 100
Funding to conduct an out of home care audit 400
Additional resources to improve the youth justice diversion system 1 627 9 726
Funding to redevelop the Alice Springs women’s shelter 6 000
Extension of the Domestic and Family Violence Reduction Strategy 6 211
Funding to meet the rising cost of out of home care and support youth justice reforms 15 001 5 590
Economic stimulus program – additional repairs and maintenance 2 775
Budget improvement measures ‑ 1 379
Wages policy ‑ 768
Productivity improvements – CPI ‑ 611
Other measures ‑ 85 ‑ 508
Communications and marketing ‑ 337
Travel ‑ 85 ‑ 171
Total 20 318 35 265

Budget Initiatives 53
Budget Strategy and Outlook
Revenue InitiativesElection Commitment – First Home Owner Discount
From 1 September 2016, the Government met an election commitment by introducing significantly increased stamp duty assistance for first home buyers who purchase an established home in the Territory. The First Home Owner Discount (FHOD) is a full stamp duty concession on the initial $500 000 value of an established home valued up to $650 000, which equates to stamp duty savings of up to $23 928.60.
The FHOD is expected to provide $4.8 million in 2016‑17 and $13.2 million per annum from 2017‑18 of stamp duty savings to first home buyers.
Budget Revenue InitiativesSeveral key revenue initiatives are included in the 2017‑18 Budget and are described in detail below.
Return of gaming machine tax closer to pre‑2009 settingsCommunity gaming machine tax is based on the gross profits (that is, net player losses) from gaming machines located in clubs and hotels. Prior to 1 January 2009, a flat rate of 42.91 per cent applied to gaming machines in hotels, in addition to a 10 per cent community benefit levy. Gaming machines in clubs were taxed at marginal rates of between 12.91 and 42.91 per cent, with the rate increasing as monthly profits increased.
To assist clubs and hotels with the expected temporary reduction in patronage and profits resulting from the introduction of indoor smoking bans in 2009, the tax rates applying to hotels were aligned with clubs, and the marginal rate thresholds were increased. While gaming machine profits dropped following the introduction of indoor smoking bans, patrons have since adjusted and tax savings have contributed to necessary renovations to provide outdoor smoking areas. The return to normal patronage levels, coupled with an increase in the venue cap for gaming machines from 45 to 55 for clubs and 10 to 20 for hotels has seen profits from community gaming machines recover to higher than 2009 levels.
As part of the 2017‑18 Budget, community gaming machine taxes and thresholds will be adjusted to return closer to pre‑1 January 2009 levels. From 1 July 2017, marginal tax thresholds for clubs and hotels will be reduced, raising an additional $3.1 million. From 1 July 2018, there will be a further adjustment of thresholds and tax rates for gaming machines in hotels, raising $4.6 million in revenue in 2018‑19 and ongoing.
Increased stamp duty on high value transactionsConveyance stamp duty is derived from conveyances of dutiable property in the Territory, such as real estate and transfers of businesses.
Stamp duty is calculated by a formula that determines a rate applicable to the value of dutiable property conveyed. Currently, the Territory’s maximum rate of conveyance duty is 5.45 per cent, applying where the dutiable value of the property is $3 million or more.
As part of the 2017‑18 Budget, from 1 July 2017, the rate will increase to 5.75 per cent for high value properties with a dutiable value between $3 million and $5 million and 5.95 per cent where the dutiable value is $5 million or more. This measure will generally have no impact on small to medium business and home buyers and the existing rate of 4.95 per cent will continue to apply to property valued from $525 000 to under $3 million. This measure is expected to raise an additional $4.2 million from 2017‑18.

54 Budget Initiatives
2017-18 Budget
Increase in motor vehicle registration feesMotorists are required to pay an annual or six‑monthly fee to register their vehicles for use on Australian roads. Motor vehicle registration ensures the roadworthiness of each vehicle and promotes simple and reliable identification of vehicles.
Heavy vehicle registration fees are uniform across Australia and set by the National Transport Commission. Light vehicle registration fees are determined by each state and territory. In the Territory, the fee component of overall total registration costs for light vehicles is calculated by reference to a differential rate scale based on engine capacity and number of cylinders. In addition to the registration fee component, total motor vehicle registration costs in all states include compulsory third‑party insurance, motor taxes and or emergency service levies, traffic improvement levies, road rescue fees, road safety contribution fees and other fees such as administrative fees.
Territory registration fees are currently among the lowest of all the states and territories across all categories. Fees are expressed in revenue units, meaning they rise in line with CPI. In the Territory’s current low‑inflation environment, the value of a revenue unit has not changed since 2015. Consequently, motor vehicle registration fees have also not risen in that period of time.
As part of the 2017‑18 Budget, the registration fee component of total light vehicle registration costs increases moderately from 1 July 2017.
Annual registration fee increases range from $5 to $7 for motorcycles, $22 for a small car, up to $30 for most medium to medium‑large cars and about $60 for a large four‑wheel‑drive vehicle. Overall, this equates to the total cost of registering a motor vehicle increasing by about 4 per cent or less for most vehicles and about 7 per cent for large four‑wheel‑drive vehicles. Following these moderate increases, total registration costs for vehicles in the Territory still remain at or below the national average. This measure is expected to raise an additional $5.3 million from 2017‑18.

Intergovernmental Financial Relations Issues 55
Budget Strategy and Outlook
Chapter 6Intergovernmental Financial Relations IssuesOverview
In 2017‑18 it is estimated that the Territory will receive $4260 million in Commonwealth funding, representing about 68 per cent of the Territory’s total non‑financial public sector revenue. This comprises $2912 million in untied payments, largely GST revenue, and $1348 million in tied funding.
GST revenue is the largest single fiscal transfer from the Commonwealth, representing about half of the Territory’s total revenue. In 2017‑18, the Territory is expected to receive $2909 million in GST revenue, a $274 million decrease from the estimate of $3183 million for 2016‑17. The estimated decrease is driven by a reduction in the Territory’s GST relativity from 5.28450 to 4.66024 and a reduction in the Territory’s share of the national population, partially offset by an increase in the GST pool, albeit lower than previously estimated.
GST revenue is projected to remain below 2016‑17 levels over the three‑year period to 2019‑20, significantly hampering the Territory’s capacity to meet its fiscal targets.
The decrease in the Territory’s GST relativity is the outcome of the Commonwealth Grants Commission’s (CGC’s) Report on GST Revenue Sharing Relativities 2017 Update. The main contributors to the lower relativity were a decline in the Territory’s population growth, a decline nationally in the use of community health services in remote areas combined with an increase in private sector provision of these services in the Territory, and a greater share of a number of tied Commonwealth payments including Remote Indigenous Housing and road maintenance under the Infrastructure Investment Program.
Tied Commonwealth revenue is estimated to contribute $1348 million or 22 per cent of the Territory’s total revenue in 2017‑18 compared to $1409 million in 2016‑17. The lower revenue in 2017‑18 is primarily attributed to reduced other Commonwealth revenue.
Federal Financial RelationsAustralia’s federal system is characterised by a high level of vertical fiscal imbalance, necessitating significant revenue transfers from the Commonwealth to the states and territories (states). These transfers are in recognition that states’ expenditure obligations under the Australian Constitution far outweigh their capacities to raise revenue, while for the Commonwealth the opposite applies.
Chart 6.1 highlights the level of vertical fiscal imbalance in Australia. In 2015‑16, states were responsible for around 42 per cent of total government expenditure in Australia, but only raised around 25 per cent of total revenue. Conversely, the Commonwealth raised around 75 per cent of total national revenue but its expenditure obligations only accounted for around 58 per cent of total expenditure. As a result, the Commonwealth makes transfers to the states to support the provision of states’ expenditure obligations, such as health care, education, public safety and transport.

56 Intergovernmental Financial Relations Issues
2017-18 Budget
Chart 6.1: Comparison of Commonwealth and States’ Total Expenditure and Revenues, 2015‑16
Source: Commonwealth 2015‑16 Final Budget Outcome; state and territory 2015‑16 annual financial reports
The Australian federation is also characterised by significant differences in the fiscal capacities of the states, or horizontal fiscal imbalance, arising from differences in states’ demographic, geographic and economic circumstances. Consequently, the Commonwealth provides differing levels of per capita funding to each state in recognition of these imbalances. Table 6.1 shows that in 2015‑16 Commonwealth payments accounted for 72.5 per cent of the Territory’s revenue, compared to an average of 44 per cent across the states.
Table 6.1: Commonwealth Funding as a Percentage of States’ Total General Government Revenue, 2015‑16
NSW Vic Qld WA SA Tas ACT NT Average
Revenue from the Commonwealth, $ per capita
4 273 3 980 4 822 3 066 5 225 6 619 4 686 18 438 4 436
Commonwealth proportion of total state revenue, %
43.7 44.4 45.5 30.1 50.0 63.0 38.5 72.5 44.3
Source: Commonwealth 2015‑16 Final Budget Outcome; state and territory 2015‑16 annual financial reports
Commonwealth funding to the Territory includes both general revenue assistance (comprising GST revenue and grants in lieu of uranium royalties arising from the Commonwealth’s ownership of uranium), which the Territory can use in accordance with its own policy priorities, and tied funding to be used for specific purposes. Tied funding includes specific purpose payments (SPPs), national partnership (NP) payments, Students First funding and National Health Reform funding.
The majority of Commonwealth revenue to the Territory is provided under the Intergovernmental Agreement on Federal Financial Relations (IGA). Funding is also provided through Commonwealth own purpose expenses (COPEs), which are primarily fee‑for‑service arrangements payable to either government or non‑government entities. COPE funding is outside the IGA payment arrangements.
Table 6.2 shows that in 2017‑18, total Commonwealth payments to the Territory are estimated to be $4260 million, of which 32 per cent is tied funding, with the remaining 68 per cent comprising GST revenue and grants in lieu of uranium royalties.
Compared with 2016‑17, total revenue from the Commonwealth is expected to decrease by $335 million, or around 7 per cent, in 2017‑18. The decrease is primarily due to a $274 million reduction in GST revenue from 2016‑17 to 2017‑18 and a $71 million reduction in COPE funding.
Overall NP payments have increased by $28 million due to increased payments, such as for the Northern Australia Road Infrastructure Project, partly offset by a reduction in other capital payments such as the Remote Indigenous Housing funding and the Palmerston Hospital.
0
10
20
30
40
50
60
70
80
90
100
Revenue ExpenditureCommonwealth States
Vertical fiscal imbalance
%

Intergovernmental Financial Relations Issues 57
Budget Strategy and Outlook
Table 6.2: Components of Territory Revenue1
2015‑16 Actual
2016‑17 Estimate
2017‑18 Budget
$M $M $MGeneral revenue assistance
GST revenue2 3 266 3 183 2 909
Grants in lieu of uranium royalties 4 3 3Tied revenue
Specific purpose payments 43 44 44
Students First funding3 297 333 330
National partnership payments 658 538 566
National Health Reform funding 199 244 229
Other Commonwealth payments4 227 250 179Total Commonwealth revenue 4 694 4 595 4 260
Territory own‑source revenue 2 043 1 897 1 969
Total revenue 6 7375 6 492 6 229
1 Includes non financial public sector.2 Includes balancing adjustments for over or under payment of GST in the previous financial year.3 Includes payments ‘through’ the Territory for non‑government schools.4 For consistency of reporting with the Commonwealth, funding under the Natural Disaster Relief and Recovery Arrangements is
reported as tied funding.5. The difference between total operating revenue and the comprehensive operating statement for the non financial public sector
relates to revenue associated with discontinued operations of $1.99 million.Source: Department of Treasury and Finance
Intergovernmental Agreement on Federal Financial Relations The IGA, agreed by all states and the Commonwealth in 2008, provides a framework for national collaboration on policy development and service delivery, and facilitates the implementation of national economic and social reforms.
The aim of the IGA is to improve the effectiveness of government services through:
• fair and sustainable federal financial arrangements that focus on long‑term policy development and enhanced government service delivery;
• clearly defined roles and responsibilities between the Commonwealth and states;
• enhanced public accountability through simpler, standardised and more transparent performance reporting;
• performance reporting that focuses on the achievement of outcomes and outputs;
• reduced administration and compliance overheads;
• elimination of financial and other input controls imposed on states, for service delivery, in Commonwealth funding agreements; and
• the equalisation of fiscal capacities between states.
These arrangements are formalised through:
• national agreements (NAs) for significant state services (health care, school education, skills and workforce development, disability, affordable housing and Aboriginal reform);
• NP agreements for nationally significant reforms, service delivery initiatives and or projects; and

58 Intergovernmental Financial Relations Issues
2017-18 Budget
• the provision of GST revenue to the states, with all proceeds from the GST provided on an untied basis and distributed among the states in accordance with the principle of horizontal fiscal equalisation (HFE).
Current Issues in Federal Financial RelationsIn recent years, the Commonwealth has been moving away from the principles of the IGA regarding NP agreements by increasingly including input controls, matched funding requirements and prescriptive performance benchmarks in new agreements. Further, while it is recognised that NPs are time‑limited funding arrangements, the Commonwealth has been reducing the terms of new, or renewed NPs, with many issued for just one or two years, significantly reducing states’ budget certainty and the ability to manage public expectations regarding the continuity of services or programs delivered through NP agreements.
Growth in the GST pool has been subdued since the global financial crisis, however states’ expenditure continues to grow. The Commonwealth and states will need to consider ways to provide states with greater fiscal capacity to meet growth in demand for services.
These issues are discussed further in the relevant sections of this chapter.
GST RevenueGST revenue is the largest revenue transfer from the Commonwealth, representing an estimated 53 per cent of Commonwealth payments to the states. For the Territory, GST revenue is estimated to account for about 68 per cent of total Commonwealth payments in 2017‑18.
A state’s GST revenue entitlement is dependent on three factors: the state’s share of the national population, its GST relativity as determined by the Commonwealth Treasurer, and the total amount of GST revenue available for distribution to the states (usually referred to as the GST pool). The Commonwealth determines states’ GST entitlements by:
• multiplying each state’s population by its GST relativity to derive its weighted population;
• adding up the weighted populations of the states to derive a total weighted population; and
• calculating each state’s share of the total weighted population. A state’s share of GST revenue is equivalent to its share of the total weighted population.
Table 6.3 shows the Territory’s GST revenue since 2011‑12 and the parameters used to calculate it.
Table 6.3: Territory GST Revenue Parameters, 2011‑12 to 2018‑19
2011‑12Actual
2012‑13Actual
2013‑14Actual
2014‑15Actual
2015‑16Actual
2016‑17Estimate
2017‑18Budget
2018‑19Forward Estimate
GST pool ($M) 46 040 48 061 51 090 54 342 57 352 59 740 62 740 65 940
Change in GST pool (%) 0.3 4.4 6.3 6.4 5.5 4.2 5.0 5.1
Territory GST relativity 5.35708 5.52818 5.31414 5.66061 5.57053 5.28450 4.66024 4.66024
Territory share of national population (%)
1.0336 1.0342 1.0404 1.0340 1.0195 1.0076 0.9920 0.9823
Territory GST revenue1 ($M) 2 507 2 793 2 828 3 225 3 266 3 183 2 909 3 030
Change in Territory GST revenue (%) 6.9 11.4 1.3 14.1 1.3 ‑ 2.5 ‑ 8.6 4.2
1 GST revenue amounts for 2011‑12 to 2016‑17 include balancing adjustments for the over or under payment of GST revenue to the Territory in the preceding year.
Source: Commonwealth Grants Commission, Department of Treasury and Finance

Intergovernmental Financial Relations Issues 59
Budget Strategy and Outlook
As Table 6.3 shows, the Territory’s GST revenue can be highly volatile, with actual annual growth rates ranging between 1.3 and 14.1 per cent in the period 2011‑12 to 2015‑16, due to the combined changes in shares of the national population, GST relativities and the GST pool. This presents a significant challenge in attempting to forecast GST parameters, particularly relativities, into the future. Consequently, the Territory has adopted a conservative approach to forecasting GST revenue.
A further challenge in forecasting the Territory’s GST revenue is the volatility of the GST pool. Between 2011‑12 and 2015‑16, the annual GST pool growth rate ranged from 0.3 per cent to 6.4 per cent. On this basis, the Territory has aligned its forecasts of GST pool growth with those of the Commonwealth in the 2016‑17 Mid‑Year Economic and Fiscal Outlook, which, at the time of developing the Territory Budget, represented the most recent published Commonwealth forecasts.
In 2016‑17, the Territory is expected to receive $3183 million in GST revenue, representing a decrease of $83 million or 2.5 per cent compared to 2015‑16. This was driven by declines in the Territory’s share of the national population from 1.0195 per cent to 1.0076 per cent and GST relativity from 5.57053 to 5.28450, partially offset by a 4.2 per cent increase in the GST pool. The estimate for 2016‑17 also incorporates an $8 million reduction in the Territory’s GST entitlement in respect of an equivalent overpayment of GST to the Territory in 2015‑16.
In 2017‑18, the Territory’s GST revenue is expected to decrease by $274 million, or 8.6 per cent, to $2909 million. The expected decrease is mainly due to a 12 per cent reduction in the Territory’s GST relativity, the largest year‑on‑year reduction in the Territory’s relativity since the introduction of the GST, and a decline in the Territory’s share of the national population from 1.0076 per cent to 0.9920 per cent, its lowest level in 23 years. These factors will more than offset the impact of an expected 5 per cent increase in the GST pool in 2017‑18 (Table 6.4).
Table 6.4: Drivers of Change in GST Revenue from 2016‑17 to 2017‑18
$M
Estimated GST revenue in 2016‑17 3 183
Impact of:
Increase in GST pool 160
Decrease in GST relativity ‑ 380
Decrease in population share ‑ 46
Interaction between GST parameters ‑ 8
Estimated GST revenue in 2017‑18 2 909
Source: Department of Treasury and Finance
As shown in Table 6.5, current estimates of the Territory’s GST revenue in 2016‑17 and 2017‑18 are lower than estimated in the 2016‑17 Mid‑Year Report due to downward revisions of all the GST parameters since last year.

60 Intergovernmental Financial Relations Issues
2017-18 Budget
Table 6.5: Factors Contributing to Revisions in the Territory’s GST Revenue Estimates
2016‑17 2017‑18
$M $M
GST revenue
As at 2016‑17 Mid‑Year Report 3 239 3 294
As at 2017‑18 Budget 3 183 2 909
Difference ‑ 56 ‑ 385
Change caused by:
National GST collections ‑ 34 ‑ 44
Relativities 0 ‑ 296
Population ‑ 22 ‑ 56
Interactions1 0 11
Total ‑ 56 ‑ 385
Note: Numbers may not add due to rounding.1 Impact of rounding and the interaction between the updated parameters in the calculation of states’ GST shares.Source: Department of Treasury and Finance
As indicated, the volatility experienced in the Territory’s annual GST revenue growth in recent years represents a significant challenge in attempting to forecast estimates of the Territory’s share of the GST from 2017‑18 onwards.
Of the three GST parameters, the GST relativity is the most challenging to forecast, given the wide range of factors influencing relativities. In calculating GST relativities, CGC considers:
• the average state policy and revenue raised by states for seven own‑source revenue categories, each made up of a number of subcategories or assessments (for example, the Mining Revenue category is made up of seven individual mineral assessments, a residual ‘other minerals’ assessment and a ‘grants in lieu of royalties’ assessment);
• average state policy and spending in 13 expenditure categories, each made up of a number of subcategories or assessments (for example, the Health category comprises separate assessments for admitted patients, emergency departments, non‑admitted patients, non‑hospital patient transport and community health);
• the amount of Commonwealth‑tied payments received by each state; and
• how each state’s revenue‑raising capacity and expenditure‑related needs differ from the state average.
Generally, the four large states have greater influence than the smaller states on the average revenue and expenditure against which all states’ fiscal capacities are assessed. In recent years, changes in relativities have been driven mainly by the revenue assessments, particularly in the mining revenue category (dominated by Western Australia) and the stamp duty category (dominated by New South Wales and Victoria). In 2015‑16, Western Australia accounted for 55 per cent of all mining revenue assessed by CGC, while New South Wales and Victoria accounted for 68 per cent of stamp duty revenue. Consequently, a large change in the factors that drive these states’ revenue collections, such as commodity and residential property prices, would have a significant effect on GST relativities, particularly for the Territory, which receives a significant share of the GST redistributed by CGC’s assessments.
The Territory’s relativity is also affected by the expenditure patterns of the large states, particularly in relation to services provided in remote areas. The large states drive the average cost of remote service delivery (against which all states are assessed), as the majority of Australia’s remote population reside in these states. However, a change in average remote service delivery costs

Intergovernmental Financial Relations Issues 61
Budget Strategy and Outlook
affects the Territory’s relativity more substantially than it does any other state’s relativity, given a large proportion of the Territory’s population resides in remote areas.
In 2015‑16, New South Wales, Queensland and Western Australia accounted for around 66 per cent of Australia’s remote population. Consequently, changes in the spending patterns of these states drive changes in the national average cost of providing services in remote areas. For example, if their spending decreases, the national average service delivery cost also decreases, meaning all states are then assessed as needing to spend less to provide average services in remote areas. The magnitude of the impact on each state depends on the proportion of its own population that resides in remote areas. In 2015‑16, around 42 per cent of the Territory’s population resided in remote areas. In other jurisdictions, remote residents ranged between 0 per cent (ACT) to 6 per cent (Western Australia) of the state population. While the Territory’s GST relativity reflects its large remote population, the Territory is the most significantly impacted jurisdiction when the large states change their spending patterns in remote areas, as this directly affects the assessed expenditure needs of this group.
Given the current uncertainty surrounding changes in the revenue and expenditure patterns of some states in the short to medium term, it is difficult to reliably forecast GST relativities over the forward estimates. As a result, the Territory has held its relativity estimates constant at 2017‑18 levels over the forward estimates. This is a relatively conservative approach, considering the Territory’s 2017‑18 relativity is its lowest since 2008‑09. However, there remains a risk that the Territory’s relativity may decrease further in subsequent years.
Combined with the other GST parameters (GST pool and population share), the Territory is estimated to receive around $3030 million in GST revenue in 2018‑19. While this represents an increase of $121 million compared to 2017‑18, it is $444 million lower than estimated in the August 2016 PEFO.
A detailed discussion of the GST parameters follows.
GST RelativitiesThe GST relativity component determines whether a state will receive more or less than its population share of the GST revenue pool. The relativities are calculated by CGC, as the independent body responsible for recommending to the Commonwealth Treasurer the distribution of GST revenue between the states each year, in accordance with the principle of HFE. CGC defines HFE as follows:
State governments should receive funding from the pool of goods and services tax such that, after allowing for material factors affecting revenues and expenditures, each would have the fiscal capacity to provide services and the associated infrastructure at the same standard, if each made the same effort to raise revenue from its own sources and operated at the same level of efficiency (CGC 2015 Review Final Report).
HFE aims to ensure each state and territory has the fiscal capacity to provide its residents with the same access to government services and infrastructure as residents of other states and territories. Given that each state’s population has different characteristics, which in turn results in differences in the cost of providing a particular standard of service across states, the achievement of HFE requires that states receive different amounts of GST revenue. Simply distributing the GST on a population basis, as proposed by some states, would not achieve HFE and would result in states having different capacities to provide services.

62 Intergovernmental Financial Relations Issues
2017-18 Budget
Assessing fiscal capacitiesTo assess states’ fiscal capacities, CGC determines the average state policy by examining what all states do across all areas of state responsibility and takes into account unavoidable differences between states that affect their capacities to deliver an average level of services. This includes factors influencing expenditure needs, such as population characteristics, geographic size and remoteness, and factors affecting the capacity to raise revenue to finance these expenditure needs, such as the structure of the economy and natural resource endowments.
The Territory is assessed as having the lowest fiscal capacity in Australia, mainly due to the significantly above‑average cost of providing the average standard of services in the Territory and a slightly below‑average capacity to raise own‑source revenue.
The major drivers of the Territory’s above‑average service delivery costs are its small and sparsely distributed population (a significant proportion of which resides in remote areas), a relatively large Aboriginal population, isolation from major supply centres in the eastern states and the lack of economies of scale in service delivery and central administration.
On the revenue side, while the Territory is assessed as having above‑average capacity to raise mining revenue and payroll tax, it has below‑average capacity to raise all other types of revenues due to its relatively small tax base compared to other jurisdictions.
Changes in state circumstances over timeIt is important to note that states’ shares of GST revenue change over time as factors affecting state revenues and expenses change. For example, a state’s school education expenditure needs will increase over time if it has an increasing share of national government school enrolments, or a state’s share of GST revenue will decrease over time if its capacity to raise revenue from its own sources increases relative to other states’ revenue‑raising capacities (all other things remaining equal).
States are sometimes classified into ‘donor’ and ‘recipient’ states, where the donor states are those that receive less than their population share of GST revenue and the recipient states are those that receive more. Chart 6.2 shows changes in the contributions of the donor states to the redistribution of GST revenue to the other states over time. It shows that between 2004‑05 and 2006‑07, New South Wales and Victoria were the only donor states, with all other states receiving more than their population share of GST revenue.
Chart 6.2 also shows that Western Australia increasingly became a donor state from 2007‑08, reflecting its significantly above‑average revenue capacity driven by the mining boom, but its share of the redistribution is now beginning to decline as HFE begins to reflect the recent decline in its capacity to raise mining revenue. Conversely, New South Wales’ share of redistribution is increasing, reflecting its strengthening capacity to raise own‑source revenue, particularly stamp duty due to strong growth in property sales and land values. Victoria’s share of redistribution is declining, reflecting its growing need to invest in infrastructure due to above‑average population growth, while Queensland has changed from being a donor state between 2008‑09 and 2012‑13 to a recipient state, mainly due to high natural disaster expenses and the impact of natural disasters on its capacity to raise revenue.

Intergovernmental Financial Relations Issues 63
Budget Strategy and Outlook
Chart 6.2: ‘Donor’ States’ Share of the Redistribution of GST Revenue to Other States
Source: Commonwealth Grants Commission
Commonwealth Grants Commission Report on GST Revenue‑Sharing Relativities – 2017 UpdateIn March 2017, the CGC released its Report on GST Revenue Sharing Relativities – 2017 Update, which recommended a decrease in the Territory’s GST relativity from 5.28450 to 4.66024 (Table 6.6). The effect of the decline in the Territory’s GST relativity is a decrease in its share of the GST pool from 5.3 per cent in 2016‑17 to 4.7 per cent in 2017‑18.
CGC estimates the financial impact of the change in relativities by applying the 2017 Update relativities to the Commonwealth’s latest GST pool and population estimates for 2017‑18, and comparing this to the Commonwealth’s GST and revenue estimates for 2016‑17. Based on this approach, CGC estimates that the Territory’s GST revenue will decline by $269 million, comparable to the $274 million when using the Territory’s calculation of its share of the national population. This translates to a reduction of $1094 per capita, which is more than 28 times the impact on New South Wales, the only other state that will experience a reduction in its GST relativity. As shown in Table 6.6, this reduction reflects the combined impact of a declining GST relativity and declining share of the national population, reducing the Territory’s GST revenue by $427 million, partially offset by an expected increase in the GST pool, increasing the Territory’s GST revenue by $159 million.
Table 6.6: CGC Estimates of the GST Impact of 2017 Update Relativities
NSW VIC Qld WA SA TAS ACT NT
2016‑17 0.90464 0.90967 1.17109 0.30330 1.41695 1.77693 1.15648 5.28450
2017‑18 0.87672 0.93239 1.18769 0.34434 1.43997 1.80477 1.19496 4.66024
Impact ($M) 311 1 112 889 378 360 125 94 ‑ 269
Drivers of change:
Population 22 75 ‑9 1 ‑ 33 ‑ 23 ‑ 1 ‑ 32
Pool 873 693 706 99 300 113 57 159
GST relativities ‑ 585 344 191 278 94 34 38 ‑ 395
Impact ($ per capita) 39 178 180 141 208 239 233 ‑ 1 094
Source: CGC 2017 Update
0
20
40
60
80
100
01 02 03 04 05 06 07 08 09 10 11 12 13 14 15 16 17 18
NSW Vic Qld WA
%
Year ended June

64 Intergovernmental Financial Relations Issues
2017-18 Budget
The main contributors to the decline in the Territory’s GST relativity in the 2017 Update are the following changes in the Territory’s circumstances between the years assessed in the 2016 and 2017 updates:
• a decline in the Territory’s population growth from record levels in 2012‑13 to very low relative growth in 2015‑16, which reduced the Territory’s share of the national population. This in turn reduced the Territory’s assessed need to invest in new infrastructure and its GST requirement by $77 million;
• a decline nationally in the use of community health services in remote areas, and an increase in non‑state sector provision of these services in the Territory, which reduced its assessed expenditure and its GST requirement by $53 million;
• an increase in the Territory’s share of tied Commonwealth payments, which reduced its assessed need for GST funding by $44 million;
• a decrease in the average cost of providing school education services in remote areas, below average growth in Aboriginal enrolments in the Territory and above average growth in non‑government enrolments, all of which reduced the Territory’s assessed education expenditure needs and its GST requirement by $31 million; and
• a decline nationally of expenditure on rural and local roads, which reduced its assessed expenditure need and its GST requirement by $28 million.
Given the zero‑sum nature of GST distribution, changes in the circumstances of other states also have an impact on the Territory’s GST share.
GST PoolThe GST pool is expected to increase by 4.2 per cent in 2016‑17 and around 5 per cent per annum between 2017‑18 and 2020‑21. The GST pool is significantly affected by consumer sentiment and the resulting consumption patterns, particularly in relation to discretionary spending on goods and services subject to GST.
Since the global financial crisis, there has been a notable shift in consumer spending patterns from items that attract GST (mainly discretionary spending) to those GST‑exempt, resulting in a moderation in GST collections over time. The shift mainly reflects the higher growth in prices and demand for non‑discretionary items, such as health and education since the introduction of GST. This trend is expected to continue over the medium term.
Chart 6.3 shows that consumption of items attracting GST as a proportion of private consumption was on a downward trajectory between 2005‑06 and 2012‑13, reflecting a decline in consumer spending on discretionary items. Overall private consumption as a proportion of gross domestic product (GDP) also trended downwards over this period, reflecting an increase in consumer saving, particularly in the immediate aftermath of the global financial crisis. Since 2012‑13, private consumption has increased as a proportion of GDP, supported mainly by low interest rates. This trend is expected to continue over the budget and forward estimates period, however if consumer spending on items that attract GST continues to be subdued then it is unlikely to return to the pre‑2007‑08 levels in the medium term.

Intergovernmental Financial Relations Issues 65
Budget Strategy and Outlook
Chart 6.3: Index of GST and Private Consumption as a Proportion of GDP
Source: Australian Bureau of Statistics, national accounts, taxation revenue and Department of Treasury and Finance calculations.
Due to the shift in consumption patterns discussed above, there has been a significant moderation in the growth rate of the GST pool. As Chart 6.4 shows, prior to the global financial crisis, the GST pool grew at an average rate of 8.3 per cent per annum. However, since the global financial crisis, growth has been subdued, averaging 3.9 per cent per annum.
Chart 6.4: Growth in the GST pool, 2001‑02 to 2015‑16
Source: Commonwealth Final Budget Outcomes, 2001‑02 to 2015‑16
GST Reform MeasuresRecent trends in the growth of GST collections are concerning for all states, given the importance of the GST as a revenue source and the growing demand for government services financed in part by GST revenue, particularly in the health and education sectors. This was exacerbated by the Commonwealth’s decision in the 2014‑15 Budget to significantly reduce health and education funding to the states from 2017‑18 onwards compared to previous commitments. While the states and the Commonwealth have subsequently been negotiating changes to health and education funding, these negotiations are unlikely to provide guaranteed long‑term funding that meets future demands for these services. The low GST pool growth as well as the potential fiscal gap faced by the states and uncertainty of tied Commonwealth payments, necessitate fundamental reform to the way the federation is financed and highlights the need for the Commonwealth and states to re‑engage on broader tax reform discussions.
0.90
0.92
0.94
0.96
0.98
1.00
1.02
1.04
03 04 05 06 07 08 09 10 11 12 13 14 15 16 17 18 19 20 21
GST/Private consumption
Private consumption/GDP
Index: 2002-03 = 100
Year ended June
- 4
- 2
0
2
4
6
8
10
12
14
16
02 03 04 05 06 07 08 09 10 11 12 13 14 15 16
%
Year ended June
Average growth 8.3%
Average growth 3.9%

66 Intergovernmental Financial Relations Issues
2017-18 Budget
Consequently, the Commonwealth has recently undertaken some measures to strengthen the GST base, including applying GST on previously untaxed digital goods and services and low value imported goods.
Applying GST on digital goods and servicesIn recent years, there has been a significant shift in consumption patterns in ways that were not envisaged when the GST was introduced in July 2000, such as the increasing consumption of digital goods and services from providers such as Netflix and Amazon. As a result, these goods and services have been effectively GST‑exempt since their introduction into the Australian market, presenting a GST base integrity concern. Consequently, in its 2015‑16 Budget, the Commonwealth announced that it would extend the GST to intangible goods and services from 1 July 2017. This measure was supported by all states and is expected to increase GST collections by around $150 million in 2017‑18 and $200 million in 2018‑19.
Removal of the low value thresholdThe GST low value threshold exempts most imported goods with a value of less than $1000 from GST. This is inconsistent with the treatment of similar goods and services purchased from sellers based in Australia, which are subject to GST. In its 2016‑17 Budget, the Commonwealth announced that from 1 July 2017, the GST will apply to all imported goods and services, which will ensure the same GST treatment of similar goods sold by Australian and international sellers. This measure was unanimously supported by the states and is estimated to increase the GST pool by around $270 million between 2017‑18 and 2019‑20.
Further reformStates have sought to ensure tax reform remains on the agenda. At the 1 April 2016 Council of Australian Governments meeting, First Ministers agreed to consider proposals whereby the Commonwealth would provide a share of its personal income tax revenue to the states to:
• provide the states with access to a broad revenue base that grows in line with the economy;
• reduce the number of tied Commonwealth grants to the states, providing them with greater autonomy and reducing administrative burden; and
• create flexibility for states to meet their ongoing expenditure needs.
While an income tax sharing arrangement could provide states with access to a more sustainable growth revenue source, it presents a budgetary risk for the Commonwealth and may reduce the Commonwealth’s policy influence in key sectors through the associated reduction in tied funding agreements. It would also likely involve requirements for states to pursue ambitious state tax reforms, such as abolishing inefficient transaction taxes.
Options under this proposal will continue to be progressed by state Treasurers via the Council on Federal Financial Relations (CFFR) in 2017‑18, and the Department of Treasury and Finance is working collaboratively with the Commonwealth and other states to progress this.
PopulationThe final component that determines a state’s share of the GST revenue is its share of the national population. This estimate is influenced by the population growth rate in all states, not just the individual state’s actual population growth.
The Territory’s share of the national population is estimated to decline over the budget and forward estimates period from 1.008 per cent in 2016‑17 to 0.974 per cent in 2020‑21. Chapter 4 of the Northern Territory Economy book provides more detail on the Territory’s population characteristics and forecast growth patterns.

Intergovernmental Financial Relations Issues 67
Budget Strategy and Outlook
Specific Purpose PaymentsSPPs are provided by the Commonwealth to the states to support the achievement of the outputs and outcomes agreed under the relevant sector’s NA. In 2017‑18 it is expected that there will be three SPPs associated with an NA (disability, affordable housing, and skills and workforce development). Under the IGA, SPP funding is ongoing, indexed annually and untied within the relevant sector. SPPs are distributed amongst the states on a population‑share basis.
In 2017‑18, the Territory expects to receive $44.4 million in SPPs for skills and workforce development, affordable housing and disability.
The National Health Reform Agreement replaced the former National Healthcare Agreement in July 2011, and introduced activity‑based funding of hospitals across Australia, based on a national efficient price. Similarly, the Students First funding arrangements replaced the National Education Agreement from January 2014, introducing needs‑based, per‑student funding across Australia. While these payments are no longer considered SPPs, funds are similarly linked to longer‑term reform objectives and are untied within the health and education sectors.
Table 6.7 provides estimates of SPP, National Health Reform and Students First funding to be received by the Territory in 2016‑17 and 2017‑18.
Table 6.7: Specific Purpose Payments, National Health Reform and Student First Funding
2016‑17 Estimate
2017‑18 Budget
$M $M
National Disability 15.1 15.5
National Skills and Workforce Development 15.0 15.1
National Affordable Housing 13.6 13.8
National Health Reform Funding 243.9 228.6
Students First Funding 332.8 329.8
Total 620.4 602.8
Source: Department of Treasury and Finance
National Partnership PaymentsThe IGA established NP agreements to implement projects of national importance and or involving significant reform or service delivery initiatives. NP agreements have been developed for initiatives across a broad range of state services, including where the initiatives relate to reform directions outlined in NAs. Project agreements, simpler forms of NP agreements, are for initiatives that require relatively less funding than NP agreements and are considered low risk. Some NP agreements require implementation plans or schedules to outline state‑specific arrangements where sufficient detail cannot be provided in the overarching NP agreement.
The Territory currently has around 58 NP and project agreements, with the Territory expected to receive associated revenue of $538.3 million in 2016‑17 and $565.8 million in 2017‑18. While NP payments may be provided as upfront payments to facilitate initiatives, the majority are paid on achievement of specified performance benchmarks or milestones. The Commonwealth and Territory also provide additional own‑purpose funding for a small number of NPs. Table 6.8 provides estimates of NP revenue to the Territory by agency responsible for delivering the service.

68 Intergovernmental Financial Relations Issues
2017-18 Budget
Table 6.8: National Partnership Payments
2016‑17 Estimate
2017‑18 Budget
$M $M
Northern Territory Police, Fire and Emergency Services 39.4 37.4
Department of Trade, Business and Innovation 5.3 0.0
Department of Infrastructure, Planning and Logistics 77.6 201.5
Department of the Attorney‑General and Justice 9.0 8.4
Department of Health 119.6 57.3
Department of Housing and Community Development 218.3 199.8
Department of Primary Industry and Resources 10.0 8.3
Department of the Environment and Natural Resources 2.1 2.2
Department of Tourism and Culture 0.8 0.8
Department of Education 39.3 37.4
Territory Families 16.9 12.6
Total1 538.3 565.8
1 Includes Department of Infrastructure, Planning and Logistics‑managed projects on behalf of government agencies.Source: Department of Treasury and Finance
NP revenue included in the Territory’s Budget represents funding agreed by the Territory and Commonwealth governments. As additional agreements are finalised throughout the year, the Territory’s NP revenue for 2017‑18 and forward estimates will be adjusted accordingly. The timing and quantum of revenue over the life of an agreement may vary subject to the achievement of agreed milestones and or performance benchmarks, and the nature of the initiative.
The $27.5 million increase in NP revenue from 2016‑17 to 2017‑18 is predominantly due to changes in funding provided under capital‑related NPs. These include a $138.5 million increase in capital funding for road projects under the Commonwealth’s Infrastructure Investment Program associated with the White Paper on Developing Northern Australia and the Infrastructure Growth Package. This will be offset by: a $61.3 million reduction in NP revenue from the Health and Hospital Fund, as capital projects near completion including the Palmerston Hospital and remote health centre upgrades; a $14.6 million reduction in funding under the Asset Recycling Initiative; and a $18.2 million reduction in funding under the NP on Remote Housing.
Expiring National Partnership Agreements The Territory has 13 NP agreements, or schedules under agreements, for which funding expires in 2016‑17, with a total of $26.7 million expected to be received in 2016‑17. Funding for a further nine NP agreements is due to expire by the end of 2017‑18, for which total expected funding is $152.5 million in 2017‑18, with the majority related to remote housing. While the majority of these agreements have a high service delivery component, particularly in the sectors of skills, affordable housing, education and health, around 38 per cent of the total funding during this period is capital.
Table 6.9 shows the NP agreements and associated funding that is due to expire in 2016‑17.

Intergovernmental Financial Relations Issues 69
Budget Strategy and Outlook
Table 6.9: Expiring National Partnership Agreements
Expiring in 2016‑17
$M
Health and Hospitals Fund – projects in Gove and Alice Springs 7.76
Building Australia’s Future Workforce – skills reform 5.34
Affordable Housing – homelessness 5.32
Natural Disaster Resilience 2.61
Renal Infrastructure in the Northern Territory 2.08
Improving Trachoma Control Services for Indigenous Australians 1.59
Rheumatic Fever Strategy 0.91
Independent Public Schools initiative 0.46
National Bushfire Mitigation 0.30
MoneySmart Teaching 0.13
Expansion of the Breastscreen Australia Program 0.09
Vaccine Preventable Diseases Surveillance Program 0.05
National Whale Stranding Action Plan 0.03
Total 26.7
Source: Department of Treasury and Finance
Under the IGA, the CFFR, which comprises all state and Commonwealth Treasurers, may make recommendations as to the treatment of expiring NP agreements. States provide annual reports to CFFR on expiring NPs and have continually sought commitment from the Commonwealth to engage early on expiring agreements. Generally, details regarding the continuation of the majority of expiring NP agreements are not known until the Commonwealth Budget is handed down, and given NP agreements are generally based on a financial‑year basis, this timing makes it extremely difficult for governments to budget appropriately.
If NP payments cease, additional demands may be placed on state finances to continue to deliver relevant services. While the expiry of NP agreements that focus on discrete initiatives (such as infrastructure) can be relatively easily managed by states, it is more problematic where the NP agreement creates expectations of ongoing service delivery that may or may not accord with state priorities. While the Territory takes steps to manage public expectations of Commonwealth‑funded programs and services, the effect of expiring NP agreements on the Territory’s budget remains a risk and will continue to be closely monitored.
In November 2016, the states wrote and provided a report to the Commonwealth Treasurer regarding the future of expiring agreements, highlighting the lack of advanced notice provided by the Commonwealth on future expiring national agreements. In particular, the states noted the need for increased budget certainty as the current processes fail to provide states with a clear indication of the Commonwealth’s policy and expenditure priorities over the forward estimates period. States proposed that the terms of NP agreements be changed from financial years to calendar years, providing at least six months’ notice to states on the future of expiring NP agreements, and allowing additional time for states to determine whether or not to continue or discontinue services delivered under expiring NP agreements.

70 Intergovernmental Financial Relations Issues
2017-18 Budget
Commonwealth Revenue Received by Territory AgenciesDetails of the significant SPPs and NP payments received by Territory agencies are provided in the following section.
Department of Trade, Business and InnovationNational Skills and Workforce Development Specific Purpose PaymentThe National Skills and Workforce Development SPP supports the achievement of the objectives included in the National Agreement on Skills and Workforce Development. In 2017‑18, the Territory expects to receive $15.1 million for the National Skills and Workforce Development SPP.
The NA on Skills and Workforce Development aims to achieve a vocational education and training (VET) system that delivers a more productive and highly skilled workforce, enabling all working‑age Australians to participate effectively in the labour market and contribute to Australia’s economic future. It was revised in April 2012 and, while it maintains a broadly similar intent to the previous NA, the revised agreement has a stronger focus on VET reform and economic participation.
Department of Infrastructure, Planning and LogisticsNational Partnership Agreements as part of the Infrastructure Investment Program and Infrastructure Growth Package in the Northern TerritoryThe NP agreements that are part of the Infrastructure Investment Program and Infrastructure Growth Package aim to improve the productivity, efficiency and safety of an integrated national land transport network in the Territory, to enhance Australia’s economic growth and international competitiveness. They encompass a number of road programs including national network construction and maintenance and off‑network projects. In 2017‑18, the Territory anticipates receiving $201.2 million under these NP agreements.
Department of HealthNational Health Reform AgreementThe National Health Reform (NHR) Agreement provides a framework for reforms of public hospital funding and governance across Australia and was signed by the Council of Australian Governments (COAG) in August 2011. The NHR agreement aims to improve health outcomes for all Australians and the sustainability of the Australian health system, and builds on the service delivery principles and objectives of the health system agreed in the National Healthcare Agreement.
From 1 July 2014, new funding arrangements for hospitals under the NHR agreement were implemented resulting in public hospitals being funded based on levels of activity. The activity‑based funding arrangements aim to improve patient access to services and increase public hospital efficiencies by funding agreed services based on a national efficient price rather than a historical basis.
In its 2014‑15 Budget, the Commonwealth withdrew its commitment to the NHR Agreement from 2017‑18 onwards, limiting growth in its contribution to hospital funding to indexation by the consumer price index (CPI) and population growth instead of growth in hospital activity, creating significant financial uncertainty for the states.
Subsequently, at the 1 April 2016 COAG meeting, a Heads of Agreement on Public Hospital Funding was signed, outlining the Commonwealth’s contribution to health funding from 1 July 2017 to 30 June 2020. The revised arrangement caps the growth in the Commonwealth’s contribution nationally at 6.5 per cent. This is considered to be an interim arrangement until a longer‑term agreement on health and hospitals funding is agreed.

Intergovernmental Financial Relations Issues 71
Budget Strategy and Outlook
In 2017‑18, the Territory anticipates receiving $228.6 million, to support the implementation of the NHR agreement through funding for hospital services, teaching, training and research, and public health activities.
National Disability Specific Purpose PaymentThe National Disability SPP supports the achievement of outputs and outcomes under the National Disability Agreement, which aims to enable people with a disability to achieve economic participation and social inclusion, and to enjoy choice, wellbeing and the opportunity to live as independently as possible. It also aims to ensure families and carers of people with a disability are supported. The Commonwealth has assumed funding and policy responsibility for all aged care services for non‑Aboriginal people aged 65 years and over, and Aboriginal people aged 50 years and over. The Territory has funding and program responsibility for basic community care services for people under these ages in line with its principal responsibility for the delivery of other disability services under the National Disability Agreement. In 2017‑18, the Territory expects to receive $15.5 million for the National Disability SPP.
Project Agreement for National Critical Care and Trauma Response CentreThe Project Agreement for National Critical Care and Trauma Response Centre supports the continued operation and development of the Centre in Darwin as a hub for emergency care and health responses to incidents of national and international significance, and for maintaining and building disaster response research and education capabilities, with $16.0 million expected to be received in 2017‑18.
National Partnership Agreement on Health InfrastructureThe NP Agreement on Health Infrastructure encompasses existing Health and Hospital Fund infrastructure projects in the Territory, including the establishment of new remote renal clinics as well as minor upgrades to most regional hospitals. The Territory anticipates it will receive $8.9 million in 2017‑18 for health infrastructure initiatives.
Department of Housing and Community DevelopmentNational Affordable Housing Specific Purpose PaymentThe National Affordable Housing SPP supports the achievement of the National Affordable Housing Agreement’s objectives. In 2017‑18, the Territory expects to receive $13.8 million for the National Affordable Housing SPP to fund supported accommodation projects.
The National Affordable Housing Agreement aims to provide support and accommodation for people who are homeless or at risk of homelessness and to assist people with social housing and those in the private rental market who are purchasing houses. Improving affordable housing opportunities and reducing overcrowding for Aboriginal people is a specific focus of this agreement.
National Partnership Agreement on Remote HousingThe NP Agreement on Remote Housing, which replaces the former NP Agreement on Remote Indigenous Housing, aims to facilitate significant reform in the provision of housing for Aboriginal people in remote communities and to address overcrowding, homelessness, poor housing conditions and severe housing shortages in these communities. Key elements of the NP Agreement on Remote Housing include: increasing the supply of new houses; improving the condition of existing houses; ensuring social housing is well maintained and managed; and providing opportunities for Aboriginal employment and business engagement. In 2017‑18 it is anticipated that the Territory will receive $137.1 million under this agreement.

72 Intergovernmental Financial Relations Issues
2017-18 Budget
As part of the NP Agreement on Northern Territory Remote Aboriginal Investment, the Territory also anticipates receiving Commonwealth funding of $47.4 million in 2017‑18 for housing‑related works in remote areas.
Department of Primary Industry and ResourcesProject Agreement for the Management of the Former Rum Jungle Mine Site (Stage 2A)The Project Agreement for the Management of the Former Rum Jungle Mine Site aims to support the delivery of the Rum Jungle Mine Site Rehabilitation Project (stage 2a) at sites within the former Rum Jungle uranium mine to ensure it continues to meet Australia’s public radiation protection standards. The Territory is expected to receive approximately $6.0 million in 2017‑18 and $4.0 million in 2018‑19.
Department of EducationStudents First – A Fairer Funding Agreement for SchoolsFrom 1 January 2014, the Commonwealth commenced a new national funding arrangement for schools under the Students First program. This program focuses on the key areas of teacher quality, school autonomy, engaging parents in education and strengthening the curriculum.
Changes to the Students First funding arrangements from 2018 were announced as part of the Commonwealth’s 2014‑15 Budget, whereby funding increases to the states will be limited to reflecting CPI growth, with an allowance for changes in enrolments, rather than being based on the scheduled transition to the National Students Resource Standard.
The Commonwealth subsequently announced, as part of its 2016‑17 Budget, it will provide additional funding between 2018 and 2020 for both government and non‑government schools. At the national level, this additional funding is expected to grow by 3.56 per cent each year, with an allowance for changes in enrolments, and is contingent on reform efforts to improve education outcomes, however the means of distributing this funding amongst the estates is not yet known. The Territory expects to receive Commonwealth funding totalling $329.8 million in 2017‑18.
National Partnership Agreement on Universal Access to Early Childhood EducationThe Territory continues to participate in the NP Agreement on Universal Access to Early Childhood Education, which aims to improve access to quality early childhood education and preschool programs in the year before full‑time schooling. The Territory expects to receive $3.6 million in 2017‑18 from the Commonwealth under this NP agreement.
Multi‑Agency AgreementsNational Partnership on Northern Territory Remote Aboriginal InvestmentThe NP Agreement on Stronger Futures in the Northern Territory was signed by the Commonwealth and Territory governments in August 2012 and was a 10‑year funding package that commenced in 2012‑13, totalling $3.5 billion. Its aim was to improve Aboriginal outcomes through funding programs in the areas of health; schooling; community safety and justice; tackling alcohol abuse; child, youth, family and community wellbeing; housing; municipal and essential services; Alice Springs transformation; remote engagement and coordination; and jobs.
The NP Agreement on Stronger Futures was renegotiated in 2014, reducing the number of implementation plans under the agreement, clarifying and amending performance benchmarks, reducing the reporting burden and increasing flexibility around the purposes and direction of investment.
The renegotiation has resulted in a rebadging of the former agreement into the National Partnership on Northern Territory Remote Aboriginal Investment (NTRAI). Under NTRAI, the Territory will be

Intergovernmental Financial Relations Issues 73
Budget Strategy and Outlook
eligible to receive up to $1028.7 million between 2015‑16 and 2021‑22, including funding for non‑government schools of around $42.6 million.
Eight agencies are directly engaged in delivering initiatives under this NP agreement, with Commonwealth NP payments of $159.0 million anticipated in 2017‑18. Commonwealth and Territory own‑purpose funding will also contribute to achieving the intended outcomes of this NP.
Performance ReportingA key principle of the IGA is enhanced accountability to both governments and the public through simpler, standardised and more transparent performance reporting. Performance measures in both NAs and NPs are required to be outcome and or output focused and reported in a timely manner.
The 2017 COAG Performance Report provides a high‑level overview of performance against the majority of benchmarks and indicators for six NAs, updating a number of results since the 2016 Report. The 2017 Report shows that nationally there has been mixed progress against performance benchmarks. Since 2016, the Territory has seen improvements in relation to various healthcare, education and affordable housing indicators.
The Territory has highlighted a number of issues for consideration as part of any future reports, including the need to have credible indicators, trajectory mapping that emphasises improvements in states’ performance and gaps in Aboriginal data, particularly remote area reporting, and good contextual information.
National Disability Insurance SchemeThe National Disability Insurance Scheme (NDIS) was a key recommendation from the Productivity Commission’s report into a national long‑term disability care and support scheme. The NDIS will reform the way the Commonwealth and states fund and deliver disability services in Australia.
The NDIS is aimed at providing lifelong care and support for people with a significant disability, including greater choice and control over the supports received and a focus on early intervention.
In December 2012, COAG signed an Intergovernmental Agreement for the NDIS launch. The agreement sets out the objectives, roles and responsibilities of all parties during the first stage of the NDIS and provides a framework for progressing to a full scheme.
In May 2016, the Territory Government signed a bilateral agreement for transition to the full scheme that provides for a staged region‑by‑region rollout, built on the lessons learnt from the Barkly trial. Transition to the full scheme commenced on 1 January 2017.

74
2017-18 Budget

Territory Taxes and Royalties 75
Budget Strategy and Outlook
Chapter 7Territory Taxes and RoyaltiesOverview
Although the Territory is more reliant on Commonwealth grants than other jurisdictions, the Territory’s own‑source revenue forms an important component of total revenue. Own‑source revenue provides states with the fiscal autonomy to tailor infrastructure and services to meet the needs of their respective jurisdiction.
Territory own‑source revenue predominantly comprises taxes and mining revenue but also includes fees and charges, rent and tenancy income, interest and dividend revenue, and profit and loss on the disposal of assets.
This chapter provides details of the Territory’s own‑source revenue categories of taxes and royalties, information on revenue forecasts and a comparison of the Territory’s taxation revenue with other jurisdictions. It also includes a statement of the Territory’s forecast tax expenditure as a result of concessions and exemptions for 2017‑18 through to 2020‑21, as required by the Fiscal Integrity and Transparency Act (FITA).
Analysis of Territory Taxes and RoyaltiesThe projected revenue from taxes and royalties for 2017‑18 totals $782.6 million. The main contributors are taxes on employers (payroll tax) estimated at $260 million or 33 per cent, mining royalties at $225 million or 28.7 per cent, and taxes on property (stamp duties on capital transactions) at $103.5 million or 13.2 per cent.
Chart 7.1 shows the Territory’s estimated main own‑source revenues for 2017‑18 according to the classification used in the Uniform Presentation Framework adopted for the Territory’s reporting requirements.
Chart 7.1: Main Own‑Source Revenue Categories, 2017‑18
Note: Excludes payroll tax from the non‑financial public sector.Source: Department of Treasury and Finance
As shown in Table 7.1, the estimated revenue in 2016‑17 from taxes and royalties totals $758.4 million, compared to the Pre‑Election Fiscal Outlook Report (PEFO) forecast of $730.5 million. The $27.9 million increase is mainly due to higher payroll tax and royalty collections as a result of continued growth in both employment and wages among the large employers making
Mining royalties$225M
Taxes on employers $260M
Taxes on property $103.5M
Taxes on gambling $78M
Motor vehicle taxes $76.7M
Taxes on insurance $39.3M

76 Territory Taxes and Royalties
2017-18 Budget
up the bulk of the Territory’s payroll tax base, such as employers associated with the Ichthys liquefied natural gas (LNG) project, and in the value of mineral production.
For 2017‑18 an overall increase in own‑source revenue from taxes and royalties is expected. This increase is predominantly due to significantly higher mineral royalty forecasts, based on royalty payer estimates, combined with the 2017‑18 Budget revenue initiatives in relation to taxes on gambling and motor vehicles. This is expected to be partially offset by a reduction in payroll tax collections, largely related to the expected timing of construction completion of the Ichthys LNG project, as well as a slight decline in taxes on property due to subdued conditions in the residential property market and several very large commercial transactions increasing receipts in 2016‑17. Overall growth of $24 million in own‑source revenue collections is expected in 2017‑18.
Table 7.1: Main Own‑Source Revenue Categories
2016‑17PEFO
2016‑17 Estimate
2017‑18 Budget
$000 $000 $000
Mining and petroleum royalties 153 434 169 538 225 037
Taxes on employers 284 239 301 187 260 030
Taxes on property 104 295 106 914 103 532
Taxes on gambling 76 210 72 721 78 016
Motor vehicle taxes 70 803 69 544 76 713
Taxes on insurance 41 507 38 485 39 255
Total 730 488 758 389 782 583
Source: Department of Treasury and Finance
Revenue InitiativesThe 2017‑18 Budget includes several changes in revenue policy, which were described in detail in Chapter 5. In summary, the main policy changes are:
• changing community gaming machine tax rates and thresholds to return closer to pre‑1 January 2009 levels, which will mean a reduction in thresholds for clubs and hotels from 1 July 2017, along with further rate and threshold changes for hotels from 1 July 2018;
• a new stamp duty rate of 5.75 per cent for conveyances where the unencumbered value of the property or the consideration payable is $3 million or more but less than $5 million and a rate of 5.95 per cent where it is $5 million or more, effective from 1 July 2017; and
• an increase in motor vehicle registration fees for light vehicles, from 1 July 2017, by means of an increase in revenue unit amounts.
Mining and Petroleum RevenueMining revenue is obtained from royalties levied on the recovery of mineral commodities from mining tenements in the Territory. Similarly, petroleum revenue accrues from royalties imposed on the production of petroleum resources in the Territory. Mineral and petroleum royalties are a charge for resource usage, payable to the Territory as the owner of the site or the mineral or petroleum rights over the site.
The Territory’s mining royalty revenues are generally based on a profit‑based regime specified under the Mineral Royalty Act. Conversely, the other states primarily use output‑based royalty schemes that impose a royalty rate on the value of production (ad valorem) or on the tonnage extracted.

Territory Taxes and Royalties 77
Budget Strategy and Outlook
The Territory’s profit‑based regime uses the net value of a mine’s production to calculate royalty. This is the operating revenue derived from mining activities in excess of $50 000 after deducting allowable project costs, prior year carried forward losses, the cost of capital employed in the mine and the cost of capital and exploration expenditure on the mine site.
Mineral royalties are collected in the Territory from mining for gold, silver, bauxite, manganese, lead, zinc and limestone. Other mineral commodities, such as copper, phosphate, rare earths and iron, are also subject to royalties under the Territory’s Mineral Royalty Act. However, the Territory Government is unable to impose royalties on uranium mined in the Territory as, unlike the states, the Commonwealth retains the ownership of uranium. Nonetheless, the Territory receives a grant in lieu of uranium royalty from the Commonwealth.
The only uranium mine in the Territory is the Ranger Project, which has a longstanding ad valorem royalty scheme applied by the Commonwealth. The Territory receives grant payments reflecting the royalty regime that applied at the time the Ranger Project arrangements were settled. However, Commonwealth legislation provides that royalty on any future uranium mines in the Territory would be based on the Mineral Royalty Act. The royalties would continue to be paid to the Territory as a grant in lieu of royalty.
A key feature of the Territory’s Mineral Royalty Act is that both prices and mining costs, including mine set‑up costs carried forward to profitable years, are taken into account in royalty calculations. If commodity prices, production costs or the value of the Australian dollar rise or fall, royalty liabilities vary accordingly. This variability produces stronger growth in royalty revenues in times of high mineral prices than under ad valorem royalties.
In terms of petroleum royalties, the Territory’s Petroleum Act imposes an ad valorem royalty on the value of production, which is generally consistent with the position across Australia.
In 2016‑17, it is expected that the Territory will receive $169.5 million in mining and petroleum revenue, $16.1 million higher than forecast in PEFO, based on collections to date.
Mining and petroleum revenue forecasts are reliant on advice from mining companies and petroleum producers of estimated liability and related company estimates of commodity price movements, production levels and the value of the Australian dollar. The forecast for royalty revenue in 2017‑18 is $225 million and is based on forecasts from royalty payers of improved profitability. Also, forecasts are based on the assumption that the Australian dollar and commodity prices, especially in relation to gold, bauxite and manganese, do not materially change. However, royalties are expected to moderate to $175.4 million per annum over the forward estimates based on estimates provided by royalty payers.

78 Territory Taxes and Royalties
2017-18 Budget
Taxation Revenue The Territory’s taxation revenue for 2016‑17 is expected to total $588.9 million. In 2017‑18, taxation revenue is expected to decrease by 5.4 per cent to $557.5 million.
The components of the Territory’s taxation revenue are payroll tax, stamp duty on conveyances, taxes on gambling, taxes on insurance, and motor vehicle fees and taxes. Table 7.2 shows the PEFO and revised Estimate of the Territory’s taxation revenue for 2016‑17 and the Budget for 2017‑18.
Table 7.2: Northern Territory Taxation Revenue
2016‑17 PEFO
2016‑17 Estimate
2017‑18 Budget
$000 $000 $000
Taxes on employers
Payroll tax 284 239 301 187 260 030
Taxes on property
Conveyance and related duty 104 295 106 914 103 532
Taxes on the provision of goods and services
Taxes on gambling 76 210 72 721 78 016
Taxes on insurance 41 507 38 485 39 255
Taxes on use of goods and performance of activities
Motor vehicle taxes 70 803 69 544 76 713
Total 577 054 588 852 557 547
Source: Department of Treasury and Finance
Payroll TaxPayroll tax is payable in the Territory when the total annual Australian wages of an employer (or group of employers) exceeds the Territory’s annual threshold amount, which is $1.5 million. The threshold reduces proportionately if an employer pays wages in another state or territory. The threshold amount is a deduction from taxable wages, which operates so businesses with total Australian wages of up to $1.5 million do not pay any payroll tax. The deduction reduces by $1 for every $4 in wages paid by an employer above the $1.5 million threshold. This means that an employer who pays wages of $7.5 million or more does not receive a deduction.
Payroll tax is calculated at the rate of 5.5 per cent, based on taxable wages (less the deduction) paid by an employer for services rendered by employees in the Territory.
In 2016‑17, payroll tax revenue is expected to be $301.2 million, an increase of about $17 million from the estimate of $284.2 million in PEFO. This reflects continued employment and wages growth in the Territory during 2016‑17, particularly among the larger employers making up the Territory’s payroll tax base.
With a range of potential major projects not included in tax forecasts given the uncertainty around final investment decisions and timing, payroll tax collections are expected to decline in the next two financial years before recovering modestly with growth of 2.5 per cent per annum expected from 2019‑20. In 2017‑18, payroll tax receipts are expected to be lower at $260 million, before declining to $249 million in 2018‑19.
This is mainly due to compositional changes in the payroll tax base as the Ichthys LNG project transitions from construction to a much smaller ongoing production workforce. The level of ongoing employment required for operational and maintenance work at the Ichthys LNG project, together with any changes in the timing of the transition of the project from the construction to production

Territory Taxes and Royalties 79
Budget Strategy and Outlook
phase, as well as assumptions around the broader economic outlook and lower projected employment and wages growth, will impact on the extent of the decline in payroll tax collections.
Stamp DutyConveyance and Related DutyThe Territory’s conveyance and related duty is derived from direct and indirect conveyances of dutiable property in the Territory. Such property comprises real estate and transfers of businesses.
Conveyance and related duty in the Territory is calculated by a formula that determines a rate applicable to the value of dutiable property conveyed. This is different from the other states, which levy stamp duty on the basis of marginal rates. A comparison of the Territory’s stamp duty regime with the other states is provided later in this chapter.
Currently, the Territory’s maximum rate of conveyance duty is 5.45 per cent, applying where the dutiable value of the property is $3 million or more. As part of the 2017 Budget, from 1 July 2017, the rate will increase to 5.75 per cent for high value properties with a dutiable value between $3 million and $5 million and 5.95 per cent where the dutiable value is $5 million or more. This measure will generally have no impact on small to medium business and home buyers and the existing rate of 4.95 per cent will continue to apply to property valued from $525 000 to under $3 million.
In 2016‑17, the Territory is expected to collect $106.9 million in conveyance and related duty, broadly in line with the forecast in PEFO. This is mainly due to duty from a larger than expected number of high value commercial transactions offsetting continued softness in the residential property market and the cost of increasing the maximum stamp duty First Home Owner Discount to almost $24 000.
In 2017‑18, conveyance and related duty is estimated to decline slightly to $103.5 million, reflecting subdued conditions in the residential property market, in terms of both transaction volumes and prices, and the full‑year cost of the increase in the First Home Owner Discount. This will be partially offset by the proposed increase in the high value conveyance duty rates. Conveyance duty collections are forecast to increase over the forward estimates with a growth rate of 2.5 per cent per annum.
Stamp Duty on Insurance Insurance duty is imposed on general insurance policies. Stamp duty on general insurance is calculated at a rate of 10 per cent of the premium paid on all general insurance products that relate to property or risk in the Territory. Where the policy also relates to a risk or property outside the Territory, the premium is apportioned.
Revenue from insurance duty is estimated to be $38.5 million in 2016‑17. Insurance duty is forecast to grow marginally to $39.3 million in 2017‑18, and 2 per cent per annum over the forward estimates.
Motor Vehicle Taxes Motor vehicle taxes comprise stamp duty on the transfer and initial registration of motor vehicles and motor vehicle registration fees.
Generally, stamp duty is levied on the purchase price of the vehicle at a rate of $3 per $100 or part thereof. Revenue from this source in 2016‑17 is estimated to be $22.2 million. In 2017‑18, it is expected to increase to $22.8 million, which includes the long‑term growth rate applied to the forward estimates of 2.5 per cent per annum.
Motor vehicle registrations comprise heavy vehicle and light vehicle registrations. Heavy vehicle registration fees are determined by the Standing Council on Transport and Infrastructure.

80 Territory Taxes and Royalties
2017-18 Budget
Light vehicle registration fees are determined by each state. In the Territory, the light vehicle registration fee is calculated by reference to a differential rate scale based on the engine capacity of the vehicle and would usually be adjusted each year in line with movements in the consumer price index (CPI) as registration fees are expressed in revenue units.
In 2016‑17, the Territory is forecast to receive $47.3 million in motor vehicle fees, increasing to $53.9 million in 2017‑18. This reflects the Budget measure of an increase in the registration fee component of total light vehicle registration costs from 1 July 2017. It is also in response to Territory registration fees currently among the lowest of all the states and territories across all categories and fee, last increasing in 2015.
Annual registration fee increases range from $5 to $7 for motorcycles, $22 for a small car, up to $30 for most medium to medium‑large cars and about $60 for a large four wheel drive vehicle. Overall, this equates to the total cost of registering a motor vehicle increasing by about 4 per cent or less for most vehicles and about 7 per cent for large four‑wheel‑drive vehicles, and maintains registration costs at or below the national average.
Revenue from motor vehicle fees are forecast to increase marginally over the forward estimates in line with long‑term growth rates plus expected CPI adjustments to light vehicle registration fees, as these fees are expressed in revenue units that are indexed to annual CPI changes.
Gambling TaxesIn 2017‑18, gambling tax revenue is forecast to be $78 million, or the fourth largest contributor to the Territory’s own‑source revenue. The components of gambling taxes in the Territory are community gaming machine tax, lotteries tax, wagering tax, bookmaker tax, betting exchange tax, casino/internet tax and the community benefit levy.
In 2016‑17, the Territory expects to receive $72.7 million in gambling taxes, which is lower than the PEFO forecast of $76.2 million, due to reduced estimates of wagering, casino and lotteries tax.
Table 7.3 shows the estimated revenue from each of the Territory’s gambling taxes.
Table 7.3: Estimated Revenue from Gambling Taxes
2016‑17 PEFO
2016‑17 Estimate
2017‑18 Budget
$000 $000 $000
Wagering tax 2 241 763 763
Casino/internet tax 5 108 3 690 3 782
Bookmaker tax – racing and sports betting 5 397 5 397 5 397
Betting exchange tax N/A 575 575
Community gaming machine tax 25 760 27 995 32 494
Community benefit levy 11 041 11 461 11 593
Lotteries tax 26 664 22 841 23 412
Total 76 210 72 721 78 016
Source: Department of Treasury and Finance; Department of the Attorney‑General and Justice
Community gaming machine tax is based on the gross profits (that is, net player losses) from gaming machines, and the Territory is expected to receive $2.2 million more tax than initially forecast in 2016‑17. Clubs and hotels have been receiving significant gaming machine tax concessions since 2009 due to the decision to introduce indoor smoking bans. However, following venue renovations and patrons adjusting to a smoke‑free environment, combined with increases in community gaming machine numbers, profits have now more than recovered.

Territory Taxes and Royalties 81
Budget Strategy and Outlook
As part of the 2017 Budget, from 1 July 2017, community gaming machine taxes will return more closely to pre‑2009 rates and thresholds. Although prior to 2001, hotels were subject to a flat 42.91 per cent rate, from 1 July 2017, tax will continue to be imposed on hotels and clubs at marginal rates, ranging from 12.91 per cent to 42.91 per cent, but tax will apply at lower monthly profit scales. From 1 July 2018, there will be a further adjustment to hotel tax rates and thresholds.
As a result of these changes, community gaming machine tax is expected to increase from a forecast of $28 million in 2016‑17 to over $32 million in 2017‑18, $35 million in 2018‑19 and continued growth of 5 per cent per annum over the forward estimates. Similarly, the community benefit levy, which is directed to the Community Benefit Fund and reinvested community needs and gambling amelioration programs, is expected to record growth of 5 per cent per annum over the forward estimates.
In 2017‑18, bookmaker tax is expected to remain at $5.4 million and betting exchange tax at $0.6 million, following a betting exchange licensing scheme established in 2016. Similarly, minimal change in casino/internet tax is expected after previous decreases. Limited growth is also expected over the forward estimates.
Lotteries tax for 2017‑18 is expected to increase, from a lower 2016‑17 base, reflecting the annual growth rate of 2.5 per cent used in the forward estimates. The decrease in 2016‑17 may be due to fewer large jackpots than in 2015‑16, with jackpots conducive to additional lottery ticket sales.
Wagering tax is expected to remain stagnant over the forward estimates, reflecting the market impact of consumers continuing to switch from betting with totalisators to utilising fixed‑odds betting services provided by UBET and corporate bookmakers.
Interstate Tax ComparisonThe composition of state taxes is broadly similar between the states, however there are differences in the application of particular taxes. These differences primarily relate to rates, exemptions and thresholds. The ability of states to modify their rates and tax base promotes competition between states and provides the autonomy and capacity to structure their tax system to accommodate their specific fiscal, economic and social circumstances.
Various approaches to measuring tax competitiveness can be adopted. Two common approaches are the Commonwealth Grants Commission (CGC) measures of taxation effort and capacity, and the representative taxpayer model.

82 Territory Taxes and Royalties
2017-18 Budget
Commonwealth Grants CommissionRevenue EffortCGC assesses each state’s revenue‑raising effort on an annual basis. Revenue effort is the ratio of the actual amount of revenue a state raises to the amount of tax revenue CGC assesses could be raised if the state applied national average tax rates to its tax base.
Average revenue effort is assessed as 100 per cent. A state with an above‑average revenue effort will score more than 100 per cent, while a below‑average effort scores less than 100 per cent.
Table 7.5 provides a comparison of the CGC’s assessment of taxation and own‑source revenue‑raising effort in 2015‑16 (the latest year an assessment is available). The total own‑source revenue figures include taxation, mining revenue, contributions by trading enterprises and public safety user charges. The table shows that the Territory’s taxation and own‑source revenue‑raising effort has returned to below the national average; the lowest of all the states with respect to total taxation and equal second lowest with respect to total own‑source revenue.
This is a significant change from 2014‑15, when the Territory’s taxation and own‑source revenue‑raising effort was above average due to the effect of a one‑off very high value commercial transaction substantially increasing conveyance duty collections. The Territory’s effort in 2015‑16 is broadly consistent with 2013‑14 when the Territory’s taxation and own‑source revenue effort was 88 per cent and 96 per cent, respectively.
Table 7.5: 2015‑16 Revenue Effort by Jurisdiction
NSW Vic Qld WA SA Tas ACT NT
% % % % % % % %
Total taxation 105 101 88 102 103 90 102 85
Total own‑source revenue 97 95 106 103 100 83 152 95
Source: Commonwealth Grants Commission 2017 Update
The Territory’s low total taxation and own‑source revenue effort largely reflects the position adopted by the Territory not to impose a land tax and to levy lower than average motor vehicle taxes.
Revenue Capacity States are limited to growing their own‑source revenues by either replacing current taxes with a new growth tax or by expanding existing tax bases. Nationally, state own‑source revenue comprises only about 50 per cent of total state revenue. However, in 2016‑17 the Territory’s taxation and royalty own‑source revenue is much lower, comprising about 13 per cent of total revenue for the non financial public sector.
The revenue limitations imposed on the states are the result of the Australian Constitution and Commonwealth‑state financial relations. For instance, states are unable to raise excise and customs duties and the Commonwealth has long assumed the collection of income tax.
In addition, state taxation policy provides a balance between raising sufficient revenue to deliver government services, minimising the tax burden on the community, fostering business development and creating a tax environment that is competitive with other jurisdictions.
Although all states face similar constraints in raising own‑source revenue, the Territory’s capacity to raise revenue is further weakened by its relatively small revenue base. This is illustrated in Table 7.6, which shows the CGC’s assessed revenue‑raising capacity for the major taxes and mining revenue. Revenue capacity is the ratio of the per capita amount a state could raise if it applied the national

Territory Taxes and Royalties 83
Budget Strategy and Outlook
average policy to its tax base, compared to the per capita average revenue raised on the national tax base. This measure removes differences in state policies.
Table 7.6: Assessed Revenue‑Raising Capacity, 2015‑16
NSW Vic Qld WA SA Tas ACT NT
% % % % % % % %
Payroll tax 107 94 90 134 79 62 86 118
Land tax 116 105 82 115 65 59 65 77
Stamp duty 125 107 88 75 56 55 92 61
Insurance tax 106 94 99 95 112 81 99 102
Motor tax 90 102 104 115 105 114 84 92
Total taxation 111 101 92 105 78 70 88 90
Mining revenue 43 5 118 515 43 19 0 179
Source: Commonwealth Grants Commission 2017 Update
Other than payroll tax and insurance tax, the Territory is assessed as having a relatively low capacity to raise taxes. This is especially for land tax and conveyance duty, where the Territory’s capacity is significantly below the national average of 100 per cent. This reflects the Territory’s different circumstances, such as a relatively small number of very high value commercial and residential properties.
Representative Taxpayer ModelComparisons can also be made of states’ tax schemes by comparing the amount of tax payable by a representative household or firm. This approach takes into account the different circumstances of each state by applying each state’s tax rate to a representative or average standard.
Payroll TaxTable 7.7 compares the payroll tax rates and thresholds for each jurisdiction. The table shows that the Territory’s payroll tax annual threshold is the second highest in Australia and its payroll tax rate is equal to the national average.
Table 7.7: State and Territory Payroll Tax Rates and Annual Thresholds
NSW Vic1 Qld2 WA3 SA4 Tas ACT NT3 Average
Threshold ($M) 0.75 0.575 1.1 0.85 0.6 1.25 2.0 1.5 1.08
Rate (%) 5.45 4.85 4.75 5.5 4.95 6.1 6.85 5.5 5.49
1 Threshold to increase to $0.6 million from 1 July 2017.2 Threshold reduces as an employer’s wages increase, so no exemption is provided for employers with wages over $5.5 million.3 Threshold reduces as an employer’s wages increase, so no exemption is provided for employers with wages over $7.5 million.4 A small business payroll tax rebate is provided to eligible employers with payrolls up to $1.2 million up to 2019‑20.Source: State legislation and information available at 12 April 2017

84 Territory Taxes and Royalties
2017-18 Budget
Table 7.8 provides the effective payroll tax rate at various wage levels for each jurisdiction after considering individual state thresholds and the payroll tax rates. For businesses with wages of $3 million and below, the Territory has a very competitive payroll tax scheme with an effective tax rate below the national average. For very large businesses with wage costs of $20 million or more, the Territory has a more favourable effective payroll tax rate than the Australian Capital Territory and Tasmania, and is comparable to Western Australia and New South Wales.
Table 7.8: Effective State and Territory Payroll Tax Rates at Various Wage Levels
Wages NSW Vic Qld WA SA1 Tas ACT NT Average
$M % % % % % % % % %
1 1.36 2.06 0.00 0.93 1.98 0.00 0.00 0.00 0.79
2 3.41 3.46 2.67 3.57 3.47 2.29 0.00 1.72 2.57
3 4.09 3.92 3.76 4.45 3.96 3.56 2.28 3.44 3.68
4 4.43 4.15 4.30 4.88 4.21 4.19 3.43 4.30 4.24
5 4.63 4.29 4.63 5.15 4.36 4.58 4.11 4.81 4.57
10 5.04 4.57 4.75 5.50 4.65 5.34 5.48 5.50 5.10
20 5.25 4.71 4.75 5.50 4.80 5.72 6.17 5.50 5.30
1 Ignoring the small business payroll tax rebate provided to eligible employers with payrolls up to $1.2 million.Source: State legislation and information available at 12 April 2017
Stamp Duty on Conveyances in the TerritoryThe Territory Government provides significant incentives to encourage home ownership in the Territory. Non‑first home buyers receive a rebate of $7000 on the purchase of a new home to be used as a principal place of residence, which is equivalent to a stamp duty concession on around the first $231 500 of the value of the residence.
Senior, Pensioner and Carer’s Concession cardholders receive a concession of $10 000 on the purchase of a principal place of residence for property values up to $750 000. This is equivalent to a stamp duty concession on the first $292 300 of the value of the residence.
From 1 September 2016, first home buyers of established homes receive a concession of up to $23 928.60 for property values up to $650 000. This is equivalent to a stamp duty concession on the first $500 000 of the value of the home. A home renovation grant of $10 000 is also available to this cohort of home buyers.
Rather than receiving stamp duty assistance, a grant of $26 000 is available to first home owners of new homes, together with a household goods grant of $2000.
Overall it is difficult to compare stamp duty on houses in each state, given the significant variation in median house prices. Chart 7.2 shows that Darwin has the fifth highest median house price behind Perth, Canberra, Melbourne and Sydney.
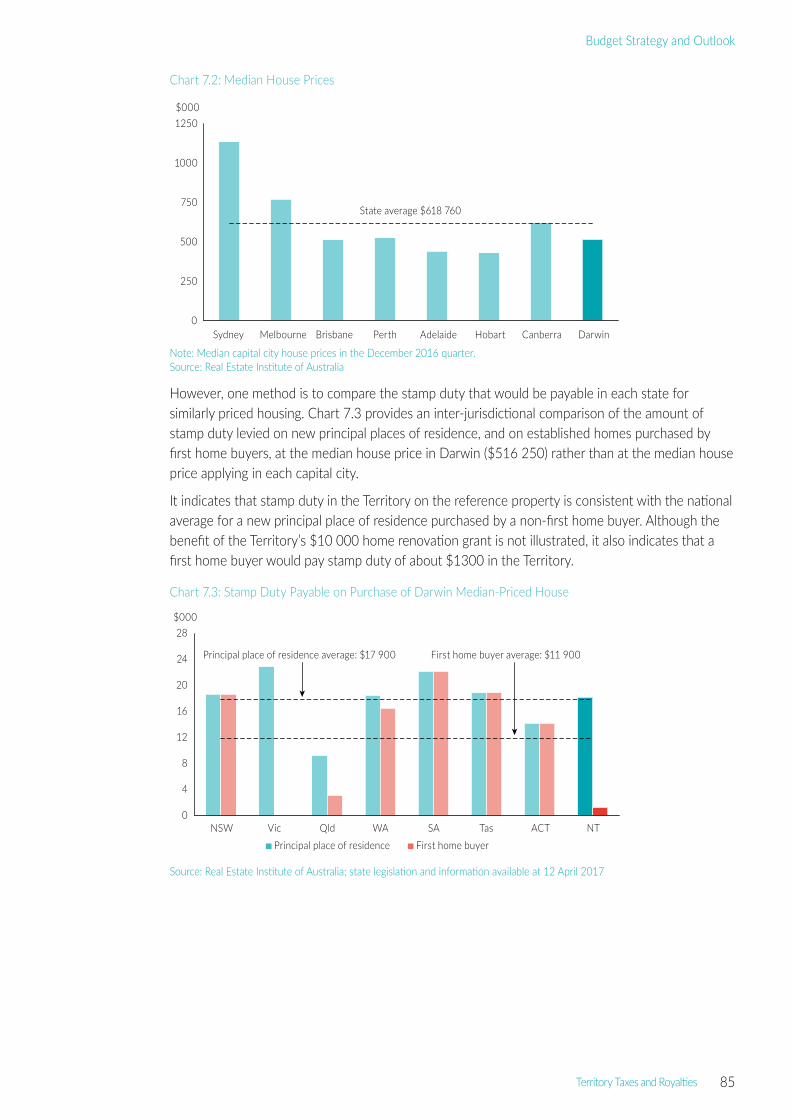
Territory Taxes and Royalties 85
Budget Strategy and Outlook
Chart 7.2: Median House Prices
Note: Median capital city house prices in the December 2016 quarter.Source: Real Estate Institute of Australia
However, one method is to compare the stamp duty that would be payable in each state for similarly priced housing. Chart 7.3 provides an inter‑jurisdictional comparison of the amount of stamp duty levied on new principal places of residence, and on established homes purchased by first home buyers, at the median house price in Darwin ($516 250) rather than at the median house price applying in each capital city.
It indicates that stamp duty in the Territory on the reference property is consistent with the national average for a new principal place of residence purchased by a non‑first home buyer. Although the benefit of the Territory’s $10 000 home renovation grant is not illustrated, it also indicates that a first home buyer would pay stamp duty of about $1300 in the Territory.
Chart 7.3: Stamp Duty Payable on Purchase of Darwin Median‑Priced House
Source: Real Estate Institute of Australia; state legislation and information available at 12 April 2017
0
250
500
750
1000
1250
Sydney Melbourne Brisbane Perth Adelaide Hobart Canberra Darwin
State average $618 760
$000
0
4
8
12
16
20
24
28
NSW Vic Qld WA SA Tas ACT NTPrincipal place of residence First home buyer
$000
Principal place of residence average: $17 900 First home buyer average: $11 900

86 Territory Taxes and Royalties
2017-18 Budget
Insurance DutyAs shown in Chart 7.4, the Territory is an average taxing jurisdiction for insurance. By comparison, the total tax load on insurance in Tasmania is significantly above the national average when fire service levies are taken into account. New South Wales will abolish its emergency services levy on insurance policies from 1 July 2017, replacing it with a Fire and Emergency Services Levy to be paid alongside council rates.
All states impose taxes on general insurance premiums at rates between 9 per cent and 11 per cent, with New South Wales, Queensland and Tasmania having special rates on particular classes of general insurance business. The only exception is the Australian Capital Territory where insurance duty was abolished on 1 July 2016. In addition to the Australian Capital Territory, Victoria, Western Australia and the Northern Territory are the other jurisdictions that do not collect taxes on life insurance policies.
Tasmania collects a portion of it’s fire service levies through a charge on insurers. While Tasmania raises a levy on insurance, a large proportion of the levy is sourced from a charge on property owners through local councils, which is similar to Victoria, Queensland, South Australia and Western Australia, and New South Wales from 1 July 2017. The Territory does not impose any emergency or fire service levies on the general public, although, like the states, it does charge for commercial fire alarm monitoring.
Chart 7.4: Average State Tax Rate on General Insurance Premiums
Source: State legislation and information available at 12 April 2017
0
5
10
15
20
25
30
35
40
45
NSW Vic Qld WA SA Tas ACT NT
%
Stamp duty Fire service levy
State average including fire service levy State average

Territory Taxes and Royalties 87
Budget Strategy and Outlook
Stamp Duty on Motor Vehicles Chart 7.5 compares the stamp duty applicable for a new motor vehicle, represented by a six cylinder, 2017 Holden Commodore VF Evoke automatic valued at $35 490. The chart shows that the stamp duty payable in the Territory is below the national average and the equal lowest in Australia.
Chart 7.5: Stamp Duty on Purchase of $35 490 Motor Vehicle
Source: State legislation and information available at 12 April 2017
Motor Vehicle Registration Motor vehicle registration fees comprise registration, compulsory third‑party insurance and other fees, and therefore vary significantly between jurisdictions. Chart 7.6 compares the costs of registering a medium‑sized passenger vehicle in each jurisdiction. Despite the increased fees as part of Budget 2017, at $228, the Territory has the equal lowest registration fees in Australia and at $785, the Territory has the third lowest total registration costs.
Chart 7.6: Annual Registration Fees and Charges for a Medium‑Sized Passenger Vehicle
Note: Based on six‑cylinder, 2017 Holden Commodore VF evoke automatic.Source: State legislation and information available at 12 April 2017
The higher than average compulsory third‑party insurance premiums in the Territory reflect the inherently higher costs associated with the small population size of the Territory and relatively high incidence of road accident casualties. Motor Accident Compensation scheme premiums aim to ensure likely compensation claims for the upcoming year can be met and the scheme maintains a prudent solvency margin.
0
400
800
1200
1600
NSW Vic Qld WA SA Tas ACT NT
$
State average $1197
0
200
400
600
800
1000
1200
1400
1600
1800
NSW Vic Qld WA SA Tas ACT NT
$
Registration fees Third-party insurance Administration fee Tax/levy
Average registration
Average total registration

88 Territory Taxes and Royalties
2017-18 Budget
Despite this, total registration costs in the Territory remain the third lowest in Australia and significantly below the national average. This is due to relatively low registration fees and because the Territory does not, unlike some jurisdictions, also add ancillary taxes and levies. These additional levies imposed in other jurisdictions include fire and emergency service levies, motor taxes, traffic improvement levies and road safety contributions.
Land Revenue This category includes taxes on the ownership of land, where the tax is based on the assessed unimproved value of the land. It also includes any metropolitan land planning, development, and fire and emergency service levies included in the land tax base of some states.
Land tax is an important source of income for states, estimated to generate more than $8.4 billion in revenue in 2016‑17. Land tax is levied on the landowner’s total holdings of commercial land and investment residential property, although generally an exclusion is provided for land used for primary production. Land tax rates are generally progressive and most jurisdictions have tax‑free thresholds.
The Territory does not impose a land tax. However, in its 2017 Update, the CGC assessed that the Territory could raise about $72 million if it adopted the average state policies on land tax.
Tax Expenditure StatementTax concessions are often provided to benefit a specified activity or class of taxpayer. They are expenditures in the sense that their impact on the budget is similar to direct outlays and can be used to achieve similar goals to grant programs.
Tax expenditure can be provided in a variety of ways, including by way of exemption, deduction, rebate or a concessionary tax rate.
The tax expenditure statement details revenue estimated to be forgone by the Government or financial benefits obtained by taxpayers as a result of tax exemptions or concessions provided. Identifying this expenditure assists in providing a more accurate picture of the Government’s contributions by way of taxation concessions to assist various groups or industries.
The tax expenditure identified in this statement relates to the more important and material concessions available in the Territory. In accordance with FITA, the tax expenditure statement provides an estimate of expenditure in 2016‑17, and forecast information for 2017‑18 and the following three financial years.
MethodologyTax expenditure has been estimated by applying the benchmark rate of taxation to the forecast volume of activities or assets exempted by a particular concession. Only future events certain or highly likely to affect assumed tax bases or tax rates have been considered in estimating future tax expenditure. Otherwise, existing taxation arrangements are assumed to apply for future years.
Measuring tax expenditure requires the identification of:
• a benchmark tax base;
• concessionary taxed components of the benchmark tax base, such as specific activity or class of taxpayer; and
• a benchmark tax rate to apply to the concessionary taxed components of the tax base.
The establishment of a benchmark tax base provides a basis against which each tax concession can be evaluated. The aim of the benchmark is to determine which concessions are tax expenditures rather than structural elements of the tax.
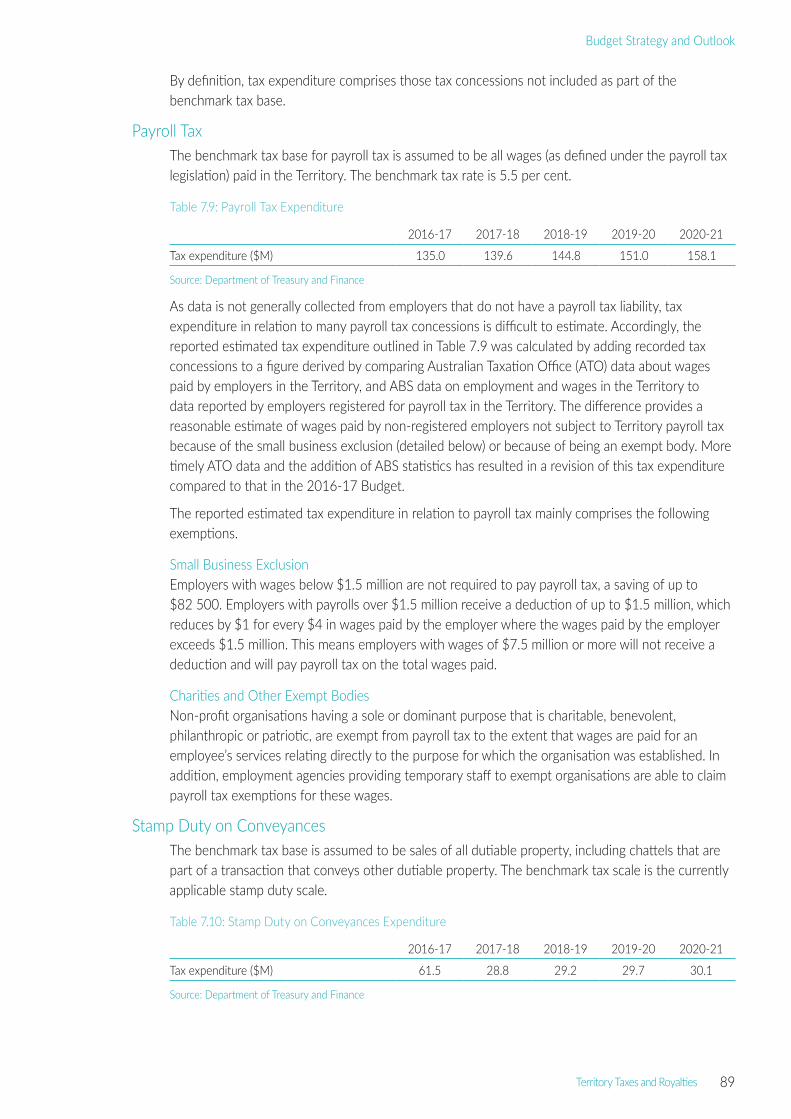
Territory Taxes and Royalties 89
Budget Strategy and Outlook
By definition, tax expenditure comprises those tax concessions not included as part of the benchmark tax base.
Payroll TaxThe benchmark tax base for payroll tax is assumed to be all wages (as defined under the payroll tax legislation) paid in the Territory. The benchmark tax rate is 5.5 per cent.
Table 7.9: Payroll Tax Expenditure
2016‑17 2017‑18 2018‑19 2019‑20 2020‑21
Tax expenditure ($M) 135.0 139.6 144.8 151.0 158.1
Source: Department of Treasury and Finance
As data is not generally collected from employers that do not have a payroll tax liability, tax expenditure in relation to many payroll tax concessions is difficult to estimate. Accordingly, the reported estimated tax expenditure outlined in Table 7.9 was calculated by adding recorded tax concessions to a figure derived by comparing Australian Taxation Office (ATO) data about wages paid by employers in the Territory, and ABS data on employment and wages in the Territory to data reported by employers registered for payroll tax in the Territory. The difference provides a reasonable estimate of wages paid by non‑registered employers not subject to Territory payroll tax because of the small business exclusion (detailed below) or because of being an exempt body. More timely ATO data and the addition of ABS statistics has resulted in a revision of this tax expenditure compared to that in the 2016‑17 Budget.
The reported estimated tax expenditure in relation to payroll tax mainly comprises the following exemptions.
Small Business ExclusionEmployers with wages below $1.5 million are not required to pay payroll tax, a saving of up to $82 500. Employers with payrolls over $1.5 million receive a deduction of up to $1.5 million, which reduces by $1 for every $4 in wages paid by the employer where the wages paid by the employer exceeds $1.5 million. This means employers with wages of $7.5 million or more will not receive a deduction and will pay payroll tax on the total wages paid.
Charities and Other Exempt BodiesNon‑profit organisations having a sole or dominant purpose that is charitable, benevolent, philanthropic or patriotic, are exempt from payroll tax to the extent that wages are paid for an employee’s services relating directly to the purpose for which the organisation was established. In addition, employment agencies providing temporary staff to exempt organisations are able to claim payroll tax exemptions for these wages.
Stamp Duty on ConveyancesThe benchmark tax base is assumed to be sales of all dutiable property, including chattels that are part of a transaction that conveys other dutiable property. The benchmark tax scale is the currently applicable stamp duty scale.
Table 7.10: Stamp Duty on Conveyances Expenditure
2016‑17 2017‑18 2018‑19 2019‑20 2020‑21
Tax expenditure ($M) 61.5 28.8 29.2 29.7 30.1
Source: Department of Treasury and Finance

90 Territory Taxes and Royalties
2017-18 Budget
Tax expenditure estimates in Table 7.10 are based on an historical revenue base indexed by normal growth parameters. However, the tax expenditure for 2016‑17 reflects a larger than usual number of high value corporate reconstruction exemptions. Expenditure will also increase from prior years due to the increase in, and continuation of, the First Home Owner Discount. The tax expenditure estimates mainly comprise the following concessions.
Corporate Reconstructions ExemptionCorporate groups formed by commonly owned corporations are able to reorganise the ownership of assets without incurring a stamp duty liability. The estimated tax expenditure is the actual stamp duty foregone for approved reconstruction exemptions.
Principal Place of Residence RebateHome buyers who purchase a new home are entitled to a rebate of $7000 when purchasing a principal place of residence. Tax expenditure is estimated by actual collections in relation to the rebate.
Senior, Pensioner and Carer’s ConcessionA concession of $10 000 is provided for Senior, Pensioner and Carer’s Concession cardholders when purchasing a principal place of residence to the value of $750 000. Tax expenditure is estimated by actual collections in relation to the concession.
First Home Owner DiscountFrom 1 September 2016, first home buyers of established homes with dutiable value of up to $650 000 receive a stamp duty discount of up to $23 928.60. Tax expenditure is estimated by actual collections in relation to the discount.
For 24 May 2016 to 31 August 2016, first home buyers of established homes received a stamp duty discount of 50 per cent on the duty otherwise payable to a maximum discount of $10 000. Also, for first home buyers of established homes with a value greater than $650 000, the 50 per cent discount also applied up until 31 December 2016.
Other Conveyance Duty ExemptionsSeveral other conveyance stamp duty exemptions are provided that together result in significant revenue foregone by the Territory, the largest of these being exemptions for:
• property transferred to charitable organisations having a sole or dominant purpose that is charitable, benevolent, philanthropic or patriotic;
• the transfer of a company’s property, on its winding up, to a shareholder of the company entitled to the property on a distribution in‑kind;
• an exemption under the Commonwealth Family Law Act for instruments made pursuant to a court order that alter the interests of the parties to a marriage or de facto partnership; and
• the conveyance of property between partners of a de facto relationship on the breakdown of the relationship.
The estimated tax expenditure for these concessions is based on actual historical data collected in relation to the various exemptions granted and how these relate to overall conveyance stamp duty collections.

Territory Taxes and Royalties 91
Budget Strategy and Outlook
Stamp Duty on General Insurance PoliciesThe benchmark tax base is all classes of general insurance policies. This does not include life insurance policies, which are treated differently for stamp duty purposes. The benchmark tax rate is 10 per cent of the premium.
Table 7.11: Stamp Duty on General Insurance
2016‑17 2017‑18 2018‑19 2019‑20 2020‑21
Tax expenditure ($M) 27.6 27.9 28.2 28.4 28.7
Source: Department of Treasury and Finance
The Territory provides stamp duty concessions on certain insurance products to reduce the costs of such insurance, namely workers compensation insurance and private health insurance. Tax expenditure outlined in Table 7.11 has been estimated using total work health insurance policy premiums paid during past years compared to total payroll data of employers in the Territory and data on private health insurance premiums obtained from the Private Health Insurance Administration Council.
Motor Vehicle Registration FeesMotor vehicle registration concessions are available under the Northern Territory Pensioner and Carer’s Concession Scheme and to Northern Territory Seniors cardholders. Table 7.12 shows the motor vehicle registration fees expenditure. Actual registration fee data has been used to estimate this item of tax expenditure.
Table 7.12: Motor Vehicle Registration Fees Expenditure
2016‑17 2017‑18 2018‑19 2019‑20 2020‑21
Tax expenditure ($M) 2.9 2.9 2.9 2.9 2.9
Source: Department of Treasury and Finance

92
2017-18 Budget

The Territory Economy 93
Budget Strategy and Outlook
Chapter 8The Territory EconomyOverview
This overview section is a summarised assessment of the Northern Territory Economy, including a brief description of recent economic performance and the outlook across a number of key indicators, including economic growth, population, labour market, prices and wages as well as a description of the structure of the economy and the external economic environment. The Territory’s key economic forecasts for the 2017‑18 Budget are detailed in Table 8.1.
Table 8.1: Territory Key Economic Indicators (%)
2015‑16 2016‑17e 2017‑18f 2018‑19f 2019‑20f 2020‑21f
Gross state product1 2.7 1.0 1.0 5.1 2.0 2.1
State final demand1 ‑ 12.5 0.2 ‑ 2.8 ‑ 5.0 0.1 1.5
Population2 0.5 0.3 ‑ 0.3 0.3 0.8 1.2
Employment3 1.4 2.9 0.5 0.6 0.8 1.2
Unemployment rate4 4.2 3.6 4.0 4.2 4.3 4.3
Consumer price index3 0.1 0.1 0.4 1.3 1.9 2.4
Wage price index3 2.2 2.1 1.9 2.0 2.3 2.6
e: estimate; f: forecast1 Year ended June, year‑on‑year percentage change, inflation adjusted.2 As at December, annual percentage change.3 Year ended June, year‑on‑year percentage change.4 Year average.Source: Department of Treasury and Finance, ABS
Structure of the EconomyThe Territory is a relatively small open economy that is significantly influenced by major projects, with abundant natural resources, and a large public sector and defence presence. The Territory economy is also influenced by economic performance in its major trading partners including China, Japan, Indonesia and Thailand. Commodity prices and exchange rates also have significant impacts on the Territory’s major industries of mining, agriculture and tourism.
The Territory economy has grown considerably over the past decade. Total gross state product (GSP) has grown from $16.9 billion in 2006‑07 to $23.6 billion in 2015‑16, with population increasing during this period by approximately 31 000 people to over 245 000. The Territory’s labour force has also expanded over this period, increasing by more than 26 000 to over 140 000 people. The economy is more diverse, with a greater spread of employment and output across both goods and service industries (Chart 8.1).

94 The Territory Economy
2017-18 Budget
Chart 8.1: Contributions to GSP, 2015‑16
GSP: gross state product1 Non‑industry components of GSP include ownership of dwellings, taxes less subsidies and statistical discrepancy.2 Other services components of GSP include personal services and general repair and maintenance activities, however excludes
units engaged in providing buildings or dwelling repair and maintenance services.Source: ABS, Australian National Accounts: State Accounts, Cat. No. 5220.0
From 2017‑18, the Territory economy is forecast to continue to face the challenging conditions being experienced in 2016‑17. Following a sustained period of record growth across many key industries, as a result of the significant construction and investment associated with the Ichthys liquefied natural gas (LNG) project and other mineral resource projects, the Territory now faces the challenge of maintaining population growth, which is an essential driver of key components of the economy, including retail trade, housing and tourism. As the impact of large resource‑based projects move beyond peak growth, GSP, business investment, construction activity, dwelling supply and demand, employment and population are all expected to remain subdued when compared to recent historical highs.
The outlook for the structure of the Territory economy in 2017‑18 will be heavily influenced by the transition of the Ichthys LNG project to the production and export phase. This will shift the emphasis from construction as the main contributor to GSP to mining and manufacturing. The contribution of the project to total employment will be substantially less, mainly due to the smaller work force requirements of the operational phase. As a result of increased LNG production, Territory net exports are expected to grow substantially over 2018‑19 and emerge as the primary driver of Territory economic growth over the forecast period, supporting international trade into the future.
Despite the current and forecast challenges, the Territory is well positioned to take advantage of a number of opportunities likely to re‑shape the structure of the Territory economy throughout the forecast period and into the next decade. The Territory’s position as a gateway to Asia, a key defence hub, home to world renowned tourist attractions and with a rich diversity of mineral, gas, petroleum and agricultural resources, all provide the strategic opportunities required to support a sustainable economy.
The Territory Government’s Economic Development Framework provides a plan that is focused on unlocking economic opportunities for all Territorians, with policies that support growth and investment strategies to build a strong economy for the future. There are also a number of defence projects along with private sector projects in the pipeline, including agriculture and resource
Public administration and safety (10.2%)
Education and training (3.5%)
Health care and social assistance (6.4%)
Electricity, gas and water (2.2%)Accommodation and food services (1.7%)
Transport, postal and warehousing (5.0%)
Information media and telecommunication (1.0%)
Financial and insurance services (2.6%)
Rental, hiring and real estate services (4.9%)
Professional, scientific and technical services (3.3%)
Administrative and support services (2.6%)
Arts and recreation services (1.2%)Other services (1.5%)2
Agriculture, forestry and fisheries (2.0%)
Mining and manufacturing (14.3%)
Service industries (26.0%)
Retail and wholesale trade (4.4%)
Government and community services (20.1%)
Construction (19.3%)
Non-industry1 (13.9%)

The Territory Economy 95
Budget Strategy and Outlook
opportunities that are subject to final investment approvals. If realised, these projects have the potential to provide significant upside to the Territory’s economic forecasts.
Economic GrowthThe Territory recorded economic growth of 2.7 per cent to $23.6 billion in 2015‑16, reflecting an improvement from growth of 2.0 per cent in 2014‑15, and in‑line with the national economic growth rate of 2.8 per cent. The Territory recorded the fourth highest economic growth rate of the jurisdictions.
Economic growth in 2015‑16 was underpinned by a significant improvement in the Territory’s net exports and consumption, partly offset by a moderation in investment, largely reflecting construction works related to the Ichthys LNG project compared to the previous year.
The outlook for the Territory economy reflects a transition from economic growth driven by significant increases in private investment, towards export‑driven growth. This transition will be largely dominated by activity related to the US$34 billion Ichthys LNG project, which is the largest ever project in the Territory. As construction of the Ichthys LNG project nears completion and the project commences production in 2017‑18, Territory economic activity is expected to moderate. However commencement of the production phase will benefit the economy significantly due to a boost in LNG, liquid petroleum gas (LPG) and condensate exports, beginning in 2017‑18, increasing in 2018‑19 and then being sustained for a projected 40 years.
Territory economic growth is forecast to be moderate, at 1.0 per cent in 2016‑17 and 2017‑18, largely reflecting the substantial declines in business investment being somewhat offset by an increase in household consumption and public investment, including the Territory Government’s significant infrastructure spend in both years. Despite the relatively low growth forecasts for GSP in 2017‑18, the size of the economy will be over 40 per cent larger than 10 years ago.
Chart 8.2: Components of Territory GSP
GSP: gross state product1 Inflation adjusted.Source: Department of Treasury and Finance, ABS, Australian National Accounts: State Accounts, Cat. No. 5220.0
Economic growth will peak at 5.1 per cent in 2018‑19, which is expected to be almost entirely driven by continued growth in exports, reflecting a full year of production at the Ichthys LNG project. In the outer years, the Territory economy is expected to stabilise as a number of components return to long‑term trend levels. In 2019‑20 and 2020‑21 growth is forecast to be 2.0 per cent and 2.1 per cent, respectively. This reflects LNG export levels stabilising at full production and is also generally in line with forecasts for the Territory’s population and employment in the outer years, which will underpin growth in household consumption and dwelling investment.
0
4
8
12
16
20
24
98 99 00 01 02 03 04 05 06 07 08 09 10 11 12 13 14 15 16Year ended June
Privateinvestment
Public investment
$B
Railway
DarwinLNG Alcan G3
expansion
Blacktip, Kitan oilfield
Ichthys LNG, Montara oilfield, mine expansionsLaminaria
– Corallina
GSP
Consumption
Net exports

96 The Territory Economy
2017-18 Budget
The change in the Territory’s state final demand (SFD) over the forecast period reflects the impact of the Territory’s economic transition in terms of investment and consumption only. This represents domestic demand, which does not incorporate the Territory’s interstate or overseas trade. SFD is estimated to grow moderately in 2016‑17, increasing by 0.2 per cent, largely driven by improvements in public investment and consumption.
Over the forecast period, the Territory’s SFD is expected to contract, down 2.8 per cent in 2017‑18 and 5.0 per cent in 2018‑19. This will be driven by a significant reduction in private investment, which, unlike economic growth, will not be offset by an increase in net exports. Growth in SFD is expected to recover in the outer years, up 0.1 per cent in 2019‑20 and 1.5 per cent in 2020‑21, mainly due to recovering levels of household consumption and improved levels of private investment, with some support from smaller scale projects.
InvestmentThe balance between consumption and investment in the Territory has shifted over the past few years following record high levels of private investment activity associated with major projects, particularly in the resource sector. This balance has begun to shift back in favour of consumption with investment contributing 37.0 per cent to state final demand (SFD) in 2015‑16, decreasing from 47.0 per cent in 2014‑15. This mainly reflects the level of private investment contracting in line with the construction timetable of the Ichthys LNG project. In contrast, household consumption has had a greater contribution to SFD compared to recent years (Chart 8.3).
Chart 8.3 Territory Investment and Consumption as a Proportion of SFD1
SFD: state final demand; e: estimate; f: forecast1 Current prices.Source: ABS, Australian National Accounts: State Accounts, Cat. No. 5220.0
Private investment decreased by 32.6 per cent in 2015‑16 and was a major detractor from economic growth. This was the first recorded decrease in private investment since 2010‑11 and follows a 5.5 per cent increase in the previous year and 79.2 per cent growth in 2012‑13. The 2015‑16 decrease was driven by declines in business and dwelling investment, as well as ownership transfers of new and existing dwellings.
Of all components, business investment has been the strongest contributor to economic growth in the Territory for the previous four years, increasing from $2.8 billion in 2010‑11 to $12.2 billion in 2014‑15. In 2015‑16, business investment decreased 34.4 per cent to $8.0 billion. Dwelling investment decreased 9.1 per cent to $839 million in 2015‑16, reflecting the continued subdued conditions in the housing market following record growth in 2013‑14. The level of dwelling investment recorded for 2015‑16 is below the 10‑year average level of $873 million.
%
0
10
20
30
40
50
60
70
80
90
100
07 08 09 10 11 12 13 14 15 16 17e 18f 19f 20f 21f
Public consumption Private consumption Private investment Public investmentYear ended June

The Territory Economy 97
Budget Strategy and Outlook
Private investment is expected to contract further in the medium term, largely associated with the completion of construction of the Ichthys LNG project. However this will be partially softened by the $800 million Northern Gas Pipeline project, and dwelling investment growth of 2.0 per cent per annum over the same period. In the outer years, private investment in the Territory is expected to return to long‑term trend levels of around $6.0 billion per annum. Private investment over this period will be supported by smaller‑scale projects in both dwelling and business investment.
Public investment decreased by 16.4 per cent in 2015‑16, to $1.3 billion. The major driver of the decline was lower general government investment by local, state and Commonwealth governments by 25.2 per cent to $966 million. Total public corporations investment partially offset the decline with an increase in investment of 22.0 per cent to $360 million, reflecting a number of projects such as the ongoing roll out of the National Broadband Network and upgrades to power stations in Alice Springs and Tennant Creek.
Public investment is expected to play an important role in supporting economic activity over the forecast period and providing a significant contribution to economic growth, particularly in 2016‑17 and 2017‑18, including the Territory Government’s $1.75 billion infrastructure investment program in 2017‑18. The Territory Government’s investment and the Commonwealth’s large‑scale defence projects are expected to be the key drivers of public investment over the forecast period.
ConsumptionTotal household consumption in the Territory increased by 5.2 per cent to $10.5 billion in 2015‑16, which was the highest growth recorded since 2010‑11 and well above the 10‑year average growth rate of 3.8 per cent. The growth in household consumption in 2015‑16 outpaced the Territory’s population growth, however is broadly in line with improvements in year‑on‑year employment growth throughout the year.
Household consumption is expected to provide support for the Territory economy across the forward estimates period, although growth will initially moderate to 0.7 per cent in 2017‑18 due to lower population growth expectations, before increasing to 2.5 per cent by 2020‑21. However growth in household consumption will remain below the 10‑year average of 3.8 per cent, consistent with below‑trend population, wages and employment growth.
Growth in public consumption expenditure moderated to 2.0 per cent in 2015‑16 to $7.2 billion, compared to growth of 3.8 per cent in 2014‑15. Growth in 2015‑16 was largely driven by a 3.0 per cent increase in Commonwealth consumption to $3.0 billion, as well as an increase in state and local consumption of 1.4 per cent to $4.2 billion.
Growth in public consumption is expected to moderate over the forecast period from growth of 2.2 per cent in 2016‑17 to a low of 0.4 per cent in 2018‑19, before increasing in the outer years to 2.7 per cent in 2019‑20 and 2020‑21. The moderation in public consumption in 2018‑19 partly reflects announced Territory Government budget constraints.
External Economic EnvironmentNational and international economic activity influences the Territory economy through changes to exchange rates, commodity prices, population flows, interstate trade volumes, tourism activity and the availability of workers to meet the Territory’s labour requirements. Additionally, monetary policy set by the Reserve Bank of Australia (RBA) influences household consumption, business confidence and investment in the Territory.
Global growth in 2016 was 3.1 per cent, which was higher than in 2015. The International Monetary Fund (IMF) forecasts an improvement in growth to 3.5 per cent in 2017, with advanced economies to grow at 2.0 per cent and emerging economies and developing markets to grow at

98 The Territory Economy
2017-18 Budget
4.5 per cent. Forecasts for advanced economies are largely driven by growth increasing in the United States, as well as cyclical recovery in Europe following the financial crisis in 2011‑12 and strong growth in the United Kingdom.
IMF forecasts for emerging markets and developing economies are the main driver behind global economic growth, and reflect improvement in a number of commodity exporters and stronger growth in India. Partially offsetting growth in emerging and developing economies is the moderation in the Chinese economy and its transition away from manufacturing and investment to consumption‑led growth.
The Australian economy grew by 2.8 per cent to $1.7 trillion in 2015‑16 and the latest data shows an increase of 2.4 per cent in 2016. Growth was largely driven by an increase in household and government consumption. This reflects a transition for the Australian economy away from mining and manufacturing to service‑based sectors. The 2016‑17 Commonwealth Mid‑Year Economic and Fiscal Outlook forecasts national economic growth in Australia to be 2.0 per cent in 2016‑17 and average 2.9 per cent over the next three financial years to 2019‑20. Economic growth will largely be supported by household consumption, as well as a relatively weaker Australian dollar benefiting from goods and services exports, partly offset by lower investment in the resources sector. The RBA has maintained the official cash rate at 1.5 per cent since August 2016, which is the lowest level in two decades. The Territory economy should benefit from relatively low interest rates due to the impact on business confidence, consumption and investment decisions.
International TradeIn 2015‑16, the Territory’s net international trade balance increased to $3.9 billion, up from $2.6 billion in 2014‑15. This was driven by a 36.4 per cent decline in total imports relating to the slowdown in major project construction activities, partly offset by a 7.2 per cent decline in total exports. Major exports included live animals, metalliferous ores and metal scraps, and confidentialised items.
In the forward years, net exports are forecast to increase sharply as production from the Ichthys LNG project commences with LNG, LPG and condensate product exported to Japan, Taiwan and other global destinations, while imports are forecast to remain subdued, in line with lower expectations for private investment and consumption.
PopulationThe Territory’s population, compromising 1 per cent of the total Australian population, is spread over the third largest Australian jurisdiction by geographic area. The Territory has a younger population than Australia as a whole, with a median age of 32.5 years, in comparison with 37.4 years for Australia (based on the latest pre‑Census 2016 data). Over half (58.6 per cent) of the Territory’s population resides in Greater Darwin and the remainder is dispersed over remote and very remote areas. About one third of the Territory’s population is Aboriginal, 79.7 per cent of whom live in remote and very remote areas.
The Territory’s estimated resident population (ERP) was 245 191 as at 30 June 2016, a 0.2 per cent increase from 30 June 2015. Annual growth in the Territory population was well below national growth over the same period (1.4 per cent) and below the Territory’s 20‑year average of 1.4 per cent.
Natural increase is a stable contributor to annual population growth in the Territory and has been a major driver of growth over the past 20 years. In 2015‑16 natural increase added 2810 people to the Territory population, in line with the 20‑year average of 2834. Net overseas migration (NOM) added 420 people, down from the high of 4966 in 2012‑13 and less than a third of the

The Territory Economy 99
Budget Strategy and Outlook
20‑year average of 1340 people. Net interstate migration (NIM), the most volatile of the three components, detracted from population growth with a loss of 2696 people to other jurisdictions in 2015‑16, a significantly greater annual loss than the 20‑year average loss of 1027 people (Chart 8.4). Variations in NIM and NOM highlight the volatility in the mobility of the Territory population, driven by movements of the non‑Aboriginal population to and from the Territory, largely in response to changing employment opportunities within and external to the Territory.
Population growth over 2016 is expected to remain subdued, continuing the trend from 2015 and weakening to 0.3 per cent as a consequence of historically high levels of migration outflows as the economy adjusts to a general slowdown of the mining and construction sectors. Population is expected to decline in 2017, with a forecast change of ‑0.3 per cent, as a significant proportion of resident construction workers are expected to depart the Territory with the Ichthys LNG project transitioning from the construction to operational phase during the year. These departures are expected to continue into 2018, albeit to a lesser extent, resulting in a small recovery in annual population growth to 0.3 per cent. Population growth is then forecast to steadily increase to 1.2 per cent in 2020.
Chart 8.4: Components of Territory Population Growth (moving annual total)
Source: ABS, Australian Demographic Statistics, Cat. No. 3101.0
Labour MarketThe Territory has consistently recorded low unemployment and high labour force participation rates compared to other jurisdictions in Australia. These features mean the Territory is reliant on interstate and overseas workers to meet growth in the demand for labour associated with major projects and other economic activity.
Resident employment in the Territory strengthened from a decline of 0.6 per cent in 2014‑15 to an increase of 1.4 per cent in 2015‑16 (Chart 8.5). The Territory’s year‑on‑year employment growth was driven by a 3.7 per cent increase in part‑time employment and a 0.9 per cent increase in full‑time employment. The Ichthys LNG project has been a strong driver of employment in the Territory in recent years and as such, fluctuations in its workforce will have a strong influence on employment forecasts over the short term.
- 4
- 2
0
2
4
6
8
96 97 98 99 00 01 02 03 04 05 06 07 08 09 10 11 12 13 14 15 16 17
Total growth
Natural increase
Netoverseasmigration
Net interstate migration
Year ended June
Number (persons) (000)

100 The Territory Economy
2017-18 Budget
Chart 8.5: Year‑on‑Year Change in Employment
e: estimate; f: forecastSource: ABS, Labour Force, Australia, Cat. No. 6202.0
In 2015‑16, the Territory’s average annual unemployment rate remained unchanged at 4.2 per cent. The Territory recorded the lowest annual average unemployment rate of all jurisdictions in 2015‑16 and below the national annual average unemployment rate of 5.9 per cent. The Territory’s participation rate averaged 74.8 per cent, while the national average rate was 65.0 per cent in 2015‑16.
Employment growth in the Territory is estimated to be 2.9 per cent in 2016‑17 in line with peak construction employment levels achieved on the Ichthys LNG project site. Employment growth is forecast to be 0.5 per cent in 2017‑18 as the Ichthys LNG project completes construction during this period. It is the largest project in the Territory’s history and the employment loss caused by its transition to the operational and export phase will be a one‑off impact on the level of employment. From 2018‑19 onwards, employment is forecast to increase due to the expected commencement of several major projects in the Territory. The unemployment rate is estimated at 3.6 per cent in 2016‑17, with the Territory economy close to full employment before increasing and stabilising at 4.3 per cent in 2019‑20, which is slightly above the 10‑year average of 4.0 per cent.
Prices and WagesThere was a marginal 0.1 per cent increase in the Darwin consumer price index (CPI) in 2015‑16, continuing a substantial decline in the Darwin CPI in recent years and a lower rate than the eight capital cities’ CPI movements of 1.4 per cent. The moderation in prices growth primarily reflects declines in the costs of transport (fuel prices and motor vehicle prices), recreation and culture, and food and non‑alcoholic beverages, respectively declining 3.1 per cent, 1.4 per cent and 0.2 per cent in 2015‑16. The continuing impact of low population growth and expanded housing supply through new land releases and medium and high‑density housing developments have led to significant reductions in housing cost pressures. Contributors to growth in the Darwin CPI over 2015‑16 were alcohol and tobacco (mainly tobacco excise tax), health and education costs, with respective increases of 5.7 per cent, 4.3 per cent and 4.0 per cent.
The Darwin CPI is forecast to remain near flat in 2016‑17 at 0.1 per cent with modest growth over the forecast period of 0.4 per cent in 2017‑18 and trending upwards to 2.4 per cent through the outer years as a number of categories are forecast to return to moderate levels of price growth, but nevertheless remaining below the historical trend. This growth in the outer years is forecast to be mainly driven by growth in transport prices (due to oil prices), alcohol and tobacco (mainly tobacco excise tax) and the housing category beginning to contribute to growth.
- 2
0
2
4
6
8
07 08 09 10 11 12 13 14 15 16 17
%
Year ended June
Australia
Territory

The Territory Economy 101
Budget Strategy and Outlook
In 2015‑16, the Territory’s wage price index (WPI) recorded an increase of 2.2 per cent compared to 2.1 per cent nationally. WPI growth in the Territory continued a moderating path, reaching historically low levels in 2015‑16 and remaining below the 10‑year average of 3.4 per cent. This largely reflects declining private sector wage growth and is consistent with increased capacity of the Territory labour market.
Wage growth is expected to continue to moderate to 2.1 per cent in 2016‑17, reflecting spare capacity in the national labour market and subdued inflation expectations. The Territory WPI is forecast to remain subdued over the medium term, primarily driven by soft labour market conditions in the private sector and tightening wages policies across all levels of government.

102
2017-18 Budget

Uniform Presentation Framework 103
Budget Strategy and Outlook
Chapter 9Uniform Presentation Framework
Under the Uniform Presentation Framework (UPF), Commonwealth, state and territory governments have agreed to publish information in a standard format in budget papers. The UPF is based on accounting standard AASB 1049 Whole of Government and General Government Sector Financial Reporting, which harmonises Government Finance Statistics and generally accepted accounting principles with the objective of improving the clarity and transparency of government financial statements.
The harmonised standard means that government financial reports are now presented on the same basis by all jurisdictions, resulting in greater transparency and consistency.
The Fiscal Integrity and Transparency Act requires that fiscal outlook reports be prepared in accordance with external reporting standards, including the Australian Accounting Standards or the UPF.
The tables in this chapter meet the Territory’s reporting obligations under both the Fiscal Integrity and Transparency Act and the UPF. For each sector of government, they include a:
• Comprehensive Operating Statement;
• Balance Sheet; and
• Cash Flow Statement.
Also included are supplementary tables for the general government sector presenting:
• taxes;
• grant revenue and expenses;
• dividend and income tax equivalent income;
• operating expenses by function;
• purchases of non‑financial assets by function; and
• a revised 2017‑18 Loan Council Allocation.
The financial statements for the general government, public non financial corporation and non financial public sectors include the revised 2016‑17 Estimate, 2017‑18 Budget and 2018‑19 to 2020‑21 Forward Estimates. The statements for the public financial corporation sector and total public sector present the 2016‑17 Estimate only, with the remaining supplementary tables presenting both the 2016‑17 Estimate and the 2017‑18 Budget.
The classification of government functions incorporated in tables 9.20 and 9.21 are presented in accordance with the revised 2015 Australian System of Government Finance Statistics manual that is effective from 1 July 2017.

104 Uniform Presentation Framework
2017-18 Budget
Table 9.1
General Government Sector Comprehensive Operating Statement 2016‑17 2017‑18 2018‑19 2019‑20 2020‑21
Estimate Budget Forward Estimates
$000 $000 $000 $000 $000
REVENUE
Taxation revenue 598 691 567 381 566 903 585 266 601 334
Current grants 4 239 787 3 886 959 3 882 411 4 026 682 4 124 856
Capital grants 327 711 361 944 109 399 50 056 11 996
Sales of goods and services 386 163 377 119 409 969 413 334 414 471
Interest income 70 201 65 051 67 047 69 348 71 036
Dividend and income tax equivalent income 66 234 77 856 82 106 96 906 109 192
Other revenue 222 549 270 418 220 240 219 095 219 095
TOTAL REVENUE 5 911 336 5 606 728 5 338 075 5 460 687 5 551 980
less EXPENSES
Employee benefits expense 2 229 536 2 258 075 2 251 373 2 306 834 2 358 555
Superannuation expenses
Superannuation interest cost 133 639 129 094 128 080 128 080 128 080
Other superannuation expenses 207 701 210 899 212 368 213 907 210 891
Depreciation and amortisation 336 542 353 562 351 151 349 362 348 976
Other operating expenses 1 434 299 1 575 269 1 449 699 1 495 478 1 525 609
Interest expenses 208 512 221 613 257 819 292 595 322 687
Other property expenses
Current grants 985 297 963 289 897 818 931 978 908 031
Capital grants 145 020 121 456 45 747 40 360 35 483
Subsidies and personal benefit payments 280 600 276 225 252 716 262 616 269 873
TOTAL EXPENSES 5 961 146 6 109 482 5 846 771 6 021 210 6 108 185
equals NET OPERATING BALANCE ‑ 49 810 ‑ 502 754 ‑ 508 696 ‑ 560 523 ‑ 556 205
plus Other economic flows – included in operating result 29 291 44 538 46 274 48 287 49 975
equals OPERATING RESULT ‑ 20 519 ‑ 458 216 ‑ 462 422 ‑ 512 236 ‑ 506 230
plus Other economic flows – other comprehensive income
248 167 206 828 211 927 204 076 202 787
equals COMPREHENSIVE RESULT – total change in net worth before transactions with owners in their capacity as owners
227 648 ‑ 251 388 ‑ 250 495 ‑ 308 160 ‑ 303 443
NET OPERATING BALANCE ‑ 49 810 ‑ 502 754 ‑ 508 696 ‑ 560 523 ‑ 556 205
less Net acquisition of non financial assets
Purchases of non financial assets 867 729 1 134 033 795 487 473 425 437 156
Sales of non financial assets ‑ 75 082 ‑ 62 051 ‑ 67 424 ‑ 58 221 ‑ 58 221
less Depreciation 336 542 353 562 351 151 349 362 348 976
plus Change in inventories
plus Other movements in non financial assets
equals Total net acquisition of non financial assets 456 105 718 420 376 912 65 842 29 959
equals FISCAL BALANCE ‑ 505 915 ‑ 1 221 174 ‑ 885 608 ‑ 626 365 ‑ 586 164

Uniform Presentation Framework 105
Budget Strategy and Outlook
Table 9.2
General Government Sector Balance Sheet 2016‑17 2017‑18 2018‑19 2019‑20 2020‑21
Estimate Budget Forward Estimates
$000 $000 $000 $000 $000
ASSETS
Financial assets
Cash and deposits 449 474 205 932 96 558 74 104 120 270
Advances paid 158 371 144 155 126 840 112 712 98 584
Investments, loans and placements 1 843 524 1 799 389 1 908 833 2 011 733 2 075 433
Receivables 323 797 337 516 345 474 354 075 365 915
Equity
Investments in other public sector entities 2 189 784 2 175 460 2 177 458 2 177 581 2 181 356
Investments – other
Other financial assets 16 249 16 249 16 249 16 249 16 249
Total financial assets 4 981 199 4 678 701 4 671 412 4 746 454 4 857 807
Non financial assets
Inventories 13 468 13 468 13 468 13 468 13 468
Property, plant and equipment 14 146 362 14 881 104 15 274 338 15 356 502 15 402 783
Investment property 99 694 88 694 77 694 66 694 55 694
Other non financial assets 122 567 122 545 122 523 122 501 122 479
Total non financial assets 14 382 091 15 105 811 15 488 023 15 559 165 15 594 424
TOTAL ASSETS 19 363 290 19 784 512 20 159 435 20 305 619 20 452 231
LIABILITIES
Deposits held 360 776 263 843 278 635 309 036 332 496
Advances received 282 881 274 895 266 315 257 083 247 135
Borrowing 2 988 940 3 931 813 4 718 883 5 320 059 5 960 235
Superannuation 4 058 130 3 852 410 3 646 690 3 440 970 3 235 250
Other employee benefits 600 956 600 956 600 956 600 956 600 956
Payables 204 618 207 243 209 167 210 428 212 515
Other liabilities 839 453 877 204 913 136 949 594 949 594
TOTAL LIABILITIES 9 335 754 10 008 364 10 633 782 11 088 126 11 538 181
NET ASSETS/(LIABILITIES) 10 027 536 9 776 148 9 525 653 9 217 493 8 914 050
Contributed equity
Accumulated surplus/(deficit) 2 128 390 1 891 326 1 638 833 1 330 550 1 023 332
Reserves 7 899 146 7 884 822 7 886 820 7 886 943 7 890 718
NET WORTH 10 027 536 9 776 148 9 525 653 9 217 493 8 914 050
NET FINANCIAL WORTH1 ‑ 4 354 555 ‑ 5 329 663 ‑ 5 962 370 ‑ 6 341 672 ‑ 6 680 374
NET FINANCIAL LIABILITIES2 6 544 339 7 505 123 8 139 828 8 519 253 8 861 730
NET DEBT3 1 181 228 2 321 075 3 131 602 3 687 629 4 245 579
1 Net financial worth equals total financial assets minus total liabilities.2 Net financial liabilities equals the sum of total liabilities less total financial assets excluding investments in other public sector entities. 3 Net debt equals the sum of deposits held, advances received and borrowing, minus the sum of cash and deposits, advances paid and
investments, loans and placements.

106 Uniform Presentation Framework
2017-18 Budget
Table 9.3
General Government Sector Cash Flow Statement 2016‑17 2017‑18 2018‑19 2019‑20 2020‑21 Estimate Budget Forward Estimates
$000 $000 $000 $000 $000Cash receipts from operating activitiesTaxes received 599 292 567 381 566 903 585 266 601 334Receipts from sales of goods and services 417 216 407 449 439 806 443 464 444 501Grants and subsidies received 4 567 498 4 248 903 3 991 810 4 076 738 4 136 852Interest receipts 70 201 65 051 67 047 69 348 71 036Dividends and income tax equivalents 87 687 62 310 81 713 84 395 97 352Other receipts 467 172 515 013 465 634 464 776 463 253Total operating receipts 6 209 066 5 866 107 5 612 913 5 723 987 5 814 328Cash payments for operating activitiesPayments for employees ‑ 2 542 343 ‑ 2 579 782 ‑ 2 584 758 ‑ 2 647 734 ‑ 2 701 380Payment for goods and services ‑ 1 710 490 ‑ 1 812 987 ‑ 1 700 421 ‑ 1 733 815 ‑ 1 801 902Grants and subsidies paid ‑ 1 410 631 ‑ 1 360 415 ‑ 1 194 910 ‑ 1 234 954 ‑ 1 213 387Interest paid ‑ 208 687 ‑ 220 037 ‑ 256 273 ‑ 291 305 ‑ 321 360Other paymentsTotal operating payments ‑ 5 872 151 ‑ 5 973 221 ‑ 5 736 362 ‑ 5 907 808 ‑ 6 038 029NET CASH FLOWS FROM OPERATING ACTIVITIES 336 915 ‑ 107 114 ‑ 123 449 ‑ 183 821 ‑ 223 701Cash flows from investments in non financial assetsSales of non financial assets 75 082 62 051 67 424 58 221 58 221Purchases of non financial assets ‑ 867 729 ‑ 1 134 033 ‑ 795 487 ‑ 473 425 ‑ 437 156Net cash flows from investments in non financial assets ‑ 792 647 ‑ 1 071 982 ‑ 728 063 ‑ 415 204 ‑ 378 935NET CASH FROM OPERATING ACTIVITIES AND INVESTMENTS IN NON FINANCIAL ASSETS
‑ 455 732 ‑ 1 179 096 ‑ 851 512 ‑ 599 025 ‑ 602 636
Net cash flows from investments in financial assets for policy purposes1
4 596 14 216 17 315 14 128 14 128
Net cash flows from investments in financial assets for liquidity purposes
396 543 83 384 ‑ 68 459 ‑ 59 902 ‑ 19 014
NET CASH FLOWS FROM INVESTING ACTIVITIES ‑ 391 508 ‑ 974 382 ‑ 779 207 ‑ 460 978 ‑ 383 821Net cash flows from financing activitiesAdvances received (net) ‑ 10 583 ‑ 7 986 ‑ 8 580 ‑ 9 232 ‑ 9 948Borrowing (net) ‑ 108 448 942 873 787 070 601 176 640 176Deposits received (net) ‑ 555 ‑ 96 933 14 792 30 401 23 460Other financing (net) NET CASH FLOWS FROM FINANCING ACTIVITIES ‑ 119 586 837 954 793 282 622 345 653 688NET INCREASE/DECREASE IN CASH HELD ‑ 174 179 ‑ 243 542 ‑ 109 374 ‑ 22 454 46 166Net cash flows from operating activities 336 915 ‑ 107 114 ‑ 123 449 ‑ 183 821 ‑ 223 701Net cash flows from investments in non financial assets ‑ 792 647 ‑ 1 071 982 ‑ 728 063 ‑ 415 204 ‑ 378 935CASH SURPLUS (+)/DEFICIT (‑) ‑ 455 732 ‑ 1 179 096 ‑ 851 512 ‑ 599 025 ‑ 602 636Future infrastructure and superannuation contributions/ earnings2
‑ 23 527 ‑ 21 849 ‑ 23 160 ‑ 24 550 ‑ 26 023
UNDERLYING SURPLUS (+)/DEFICIT (‑) ‑ 479 259 ‑ 1 200 945 ‑ 874 672 ‑ 623 575 ‑ 628 659Additional information to the Cash Flow StatementCASH SURPLUS (+)/DEFICIT (‑) ‑ 455 732 ‑ 1 179 096 ‑ 851 512 ‑ 599 025 ‑ 602 636Acquisitions under finance leases and similar arrangements ABS GFS SURPLUS (+)/DEFICIT (‑) including finance leases and similar arrangements
‑ 455 732 ‑ 1 179 096 ‑ 851 512 ‑ 599 025 ‑ 602 636
1 Includes equity acquisitions, disposals and privatisations (net).2 Contributions for future infrastructure and superannuation requirements.

Uniform Presentation Framework 107
Budget Strategy and Outlook
Table 9.4
Public Non Financial Corporation Sector Comprehensive Operating Statement 2016‑17 2017‑18 2018‑19 2019‑20 2020‑21
Estimate Budget Forward Estimates
$000 $000 $000 $000 $000
REVENUE
Current grants 191 629 187 547 163 899 170 861 176 314
Capital grants 59 504 28 713 23 179 21 031 21 492
Sales of goods and services 643 573 708 770 773 420 827 513 854 401
Interest income 3 209 2 613 2 862 2 970 3 125
Other revenue 38 194 36 567 24 499 24 407 29 533
TOTAL REVENUE 936 109 964 210 987 859 1 046 782 1 084 865
less EXPENSES
Employee benefits expense 119 834 126 317 128 480 127 187 126 036
Superannuation expenses 16 905 17 096 16 934 16 934 16 934
Depreciation and amortisation 181 288 187 194 193 125 197 410 200 762
Other operating expenses 476 824 502 465 508 215 551 439 567 072
Interest expenses 65 044 69 729 70 329 75 332 73 644
Other property expenses 22 051 28 246 29 654 33 242 40 165
Current grants 45 45 46 47 48
Capital grants
Subsidies and personal benefit payments 1 428 1 514 1 530 1 548 1 568
TOTAL EXPENSES 883 419 932 606 948 313 1 003 139 1 026 229
equals NET OPERATING BALANCE 52 690 31 604 39 546 43 643 58 636
plus Other economic flows – included in operating result ‑ 107 405 ‑ 15 811 ‑ 3 160 ‑ 3 297 ‑ 3 440
equals OPERATING RESULT ‑ 54 715 15 793 36 386 40 346 55 196
plus Other economic flows – other comprehensive income
111 000 ‑ 3 333
equals COMPREHENSIVE RESULT – total change in net worth before transactions with owners in their capacity as owners
56 285 15 793 36 386 40 346 51 863
NET OPERATING BALANCE 52 690 31 604 39 546 43 643 58 636
less Net acquisition of non financial assets
Purchases of non financial assets 233 490 223 525 152 288 165 153 173 062
Sales of non financial assets ‑ 4 719
less Depreciation 181 288 187 194 193 125 197 410 200 762
plus Change in inventories ‑ 2 399 37 525 6 012 7 141 6 106
plus Other movements in non financial assets 19 122 23 500 13 500 13 500 17 500
equals Total net acquisition of non financial assets 68 925 92 637 ‑ 21 325 ‑ 11 616 ‑ 4 094
equals FISCAL BALANCE ‑ 16 235 ‑ 61 033 60 871 55 259 62 730

108 Uniform Presentation Framework
2017-18 Budget
Table 9.5
Public Non Financial Corporation Sector Balance Sheet 2016‑17 2017‑18 2018‑19 2019‑20 2020‑21
Estimate Budget Forward Estimates
$000 $000 $000 $000 $000
ASSETS
Financial assets
Cash and deposits 217 723 162 427 169 667 180 834 194 504
Advances paid
Investments, loans and placements
Receivables 153 124 151 740 144 683 149 728 152 003
Equity 3 3 3 3 3
Other financial assets
Total financial assets 370 850 314 170 314 353 330 565 346 510
Non financial assets
Inventories 182 471 219 996 226 008 233 149 239 255
Property, plant and equipment 3 206 243 3 278 834 3 247 035 3 224 024 3 210 904
Investment property
Other non financial assets 34 864 31 281 33 242 36 038 38 958
Total non financial assets 3 423 578 3 530 111 3 506 285 3 493 211 3 489 117
TOTAL ASSETS 3 794 428 3 844 281 3 820 638 3 823 776 3 835 627
LIABILITIES
Deposits held 495 495 495 495 495
Advances received
Borrowing 1 394 174 1 445 162 1 441 151 1 432 140 1 427 130
Superannuation
Other employee benefits 18 420 19 248 20 871 21 573 21 614
Payables 81 254 66 793 62 962 69 600 70 626
Other liabilities 131 932 158 754 139 332 144 018 156 037
TOTAL LIABILITIES 1 626 275 1 690 452 1 664 811 1 667 826 1 675 902
NET ASSETS/(LIABILITIES) 2 168 153 2 153 829 2 155 827 2 155 950 2 159 725
Contributed equity 628 300 628 300 628 300 628 300 628 300
Accumulated surplus/(deficit) 750 089 735 765 737 763 737 886 741 661
Reserves 789 764 789 764 789 764 789 764 789 764
TOTAL EQUITY 2 168 153 2 153 829 2 155 827 2 155 950 2 159 725
NET FINANCIAL WORTH1 ‑ 1 255 425 ‑ 1 376 282 ‑ 1 350 458 ‑ 1 337 261 ‑ 1 329 392
NET DEBT2 1 176 946 1 283 230 1 271 979 1 251 801 1 233 121
1 Net financial worth equals total financial assets minus total liabilities.2 Net debt equals the sum of deposits held, advances received and borrowing, minus the sum of cash and deposits, advances paid and
investments, loans and placements.

Uniform Presentation Framework 109
Budget Strategy and Outlook
Table 9.6
Public Non Financial Corporation Sector Cash Flow Statement 2016‑17 2017‑18 2018‑19 2019‑20 2020‑21
Estimate Budget Forward Estimates
$000 $000 $000 $000 $000
Cash receipts from operating activitiesReceipts from sales of goods and services 660 857 714 552 767 595 818 791 850 407Grants and subsidies received 251 131 216 260 187 078 191 894 197 806Interest receipts 3 282 2 624 2 855 2 966 3 118Other receipts 17 790 13 567 11 490 11 407 12 533Total operating receipts 933 060 947 003 969 018 1 025 058 1 063 864Cash payments for operating activitiesIncome tax equivalents paid ‑ 54 214 ‑ 22 051 ‑ 28 246 ‑ 29 654 ‑ 33 242Payments for employees ‑ 180 770 ‑ 152 419 ‑ 153 523 ‑ 153 151 ‑ 152 661Payment for goods and services ‑ 498 917 ‑ 561 426 ‑ 517 119 ‑ 543 147 ‑ 569 315Grants and subsidies paid ‑ 1 473 ‑ 1 559 ‑ 1 576 ‑ 1 595 ‑ 1 616Interest paid ‑ 64 940 ‑ 70 635 ‑ 70 541 ‑ 75 003 ‑ 74 119Other payments Total operating payments ‑ 800 314 ‑ 808 090 ‑ 771 005 ‑ 802 550 ‑ 830 953NET CASH FLOWS FROM OPERATING ACTIVITIES 132 746 138 913 198 013 222 508 232 911Cash flows from investments in non financial assetsSales of non financial assets 4 719 Purchases of non financial assets ‑ 233 490 ‑ 223 525 ‑ 152 288 ‑ 165 153 ‑ 173 062Net cash flows from investments in non financial assets ‑ 233 490 ‑ 218 806 ‑ 152 288 ‑ 165 153 ‑ 173 062NET CASH FROM OPERATING ACTIVITIES AND INVESTMENTS IN NON FINANCIAL ASSETS
‑ 100 744 ‑ 79 893 45 725 57 355 59 849
Net cash flows from investments in financial assets for policy purposes1
Net cash flows from investments in financial assets for liquidity purposes
NET CASH FLOWS FROM INVESTING ACTIVITIES ‑ 233 490 ‑ 218 806 ‑ 152 288 ‑ 165 153 ‑ 173 062Net cash flows from financing activitiesAdvances received (net) Borrowing (net) 73 353 50 488 ‑ 4 511 ‑ 9 511 ‑ 5 510Deposits received (net) ‑ 834 Dividends paid ‑ 9 341 ‑ 25 891 ‑ 33 974 ‑ 36 677 ‑ 40 669Other financing (net) 15 000 NET CASH FLOWS FROM FINANCING ACTIVITIES 78 178 24 597 ‑ 38 485 ‑ 46 188 ‑ 46 179NET INCREASE/DECREASE IN CASH HELD ‑ 22 566 ‑ 55 296 7 240 11 167 13 670Net cash flows from operating activities 132 746 138 913 198 013 222 508 232 911Net cash flows from investments in non financial assets ‑ 233 490 ‑ 218 806 ‑ 152 288 ‑ 165 153 ‑ 173 062Dividends paid ‑ 9 341 ‑ 25 891 ‑ 33 974 ‑ 36 677 ‑ 40 669CASH SURPLUS (+)/DEFICIT (‑) ‑ 110 085 ‑ 105 784 11 751 20 678 19 180Additional information to the Cash Flow StatementCASH SURPLUS (+)/DEFICIT (‑) ‑ 110 085 ‑ 105 784 11 751 20 678 19 180Acquisitions under finance leases and similar arrangements ‑ 500 ‑ 500 ‑ 500 ‑ 500 ‑ 500ABS GFS SURPLUS (+)/DEFICIT (‑) including finance leases and similar arrangements
‑ 110 585 ‑ 106 284 11 251 20 178 18 680
1 Includes equity acquisitions, disposals and privatisations (net).

110 Uniform Presentation Framework
2017-18 Budget
Table 9.7
Non Financial Public Sector Comprehensive Operating Statement 2016‑17 2017‑18 2018‑19 2019‑20 2020‑21
Estimate Budget Forward Estimates
$000 $000 $000 $000 $000
REVENUE
Taxation revenue 588 852 557 547 557 171 575 534 591 602
Current grants 4 239 377 3 887 459 3 882 911 4 027 182 4 125 356
Capital grants 355 899 372 941 114 596 52 656 14 596
Sales of goods and services 965 225 1 021 792 1 119 594 1 177 166 1 205 191
Interest income 70 201 65 051 67 047 69 348 71 036
Dividend and income tax equivalent income 14 368 19 493 18 064 23 441 20 939
Other revenue 258 335 304 577 242 331 241 094 246 220
TOTAL REVENUE 6 492 257 6 228 860 6 001 714 6 166 421 6 274 940
less EXPENSES
Employee benefits expense 2 349 370 2 384 392 2 379 853 2 434 021 2 484 591
Superannuation expenses
Superannuation interest cost 133 639 129 094 128 080 128 080 128 080
Other superannuation expenses 222 473 225 862 227 169 228 708 225 692
Depreciation and amortisation 517 830 540 756 544 276 546 772 549 738
Other operating expenses 1 836 498 2 003 528 1 884 112 1 973 229 2 018 993
Interest expenses 270 347 288 729 325 286 364 957 393 206
Other property expenses
Current grants 923 473 905 957 839 484 872 186 846 744
Capital grants 113 704 103 740 27 765 21 929 16 591
Subsidies and personal benefit payments 151 858 148 069 149 227 153 642 156 962
TOTAL EXPENSES 6 519 192 6 730 127 6 505 252 6 723 524 6 820 597
equals NET OPERATING BALANCE ‑ 26 935 ‑ 501 267 ‑ 503 538 ‑ 557 103 ‑ 545 657
plus Other economic flows – included in operating result ‑ 78 114 28 727 43 114 44 990 46 535
equals OPERATING RESULT ‑ 105 049 ‑ 472 540 ‑ 460 424 ‑ 512 113 ‑ 499 122
plus Other economic flows – other comprehensive income
332 697 221 152 209 929 203 953 195 679
equals COMPREHENSIVE RESULT – total change in net worth before transactions with owners in their capacity as owners
227 648 ‑ 251 388 ‑ 250 495 ‑ 308 160 ‑ 303 443
NET OPERATING BALANCE ‑ 26 935 ‑ 501 267 ‑ 503 538 ‑ 557 103 ‑ 545 657
less Net acquisition of non financial assets
Purchases of non financial assets 1 101 219 1 357 558 947 775 638 578 610 218
Sales of non financial assets ‑ 75 082 ‑ 66 770 ‑ 67 424 ‑ 58 221 ‑ 58 221
less Depreciation 517 830 540 756 544 276 546 772 549 738
plus Change in inventories ‑ 2 399 37 525 6 012 7 141 6 106
plus Other movements in non financial assets 19 122 23 500 13 500 13 500 17 500
equals Total net acquisition of non financial assets 525 030 811 057 355 587 54 226 25 865
equals FISCAL BALANCE ‑ 551 965 ‑ 1 312 324 ‑ 859 125 ‑ 611 329 ‑ 571 522

Uniform Presentation Framework 111
Budget Strategy and Outlook
Table 9.8
Non Financial Public Sector Balance Sheet 2016‑17 2017‑18 2018‑19 2019‑20 2020‑21
Estimate Budget Forward Estimates
$000 $000 $000 $000 $000
ASSETS
Financial assets
Cash and deposits 449 497 205 955 96 581 74 127 120 293
Advances paid 158 371 144 155 126 840 112 712 98 584
Investments, loans and placements 1 843 524 1 799 389 1 908 833 2 011 733 2 075 433
Receivables 438 026 439 951 439 023 445 531 445 297
Equity
Investments in other public sector entities 21 631 21 631 21 631 21 631 21 631
Investments – other 3 3 3 3 3
Other financial assets 16 249 16 249 16 249 16 249 16 249
Total financial assets 2 927 301 2 627 333 2 609 160 2 681 986 2 777 490
Non financial assets
Inventories 195 939 233 464 239 476 246 617 252 723
Property, plant and equipment 17 352 605 18 159 938 18 521 373 18 580 526 18 613 687
Investment property 99 694 88 694 77 694 66 694 55 694
Other non financial assets 157 431 153 826 155 765 158 539 161 437
Total non financial assets 17 805 669 18 635 922 18 994 308 19 052 376 19 083 541
TOTAL ASSETS 20 732 970 21 263 255 21 603 468 21 734 362 21 861 031
LIABILITIES
Deposits held 143 571 101 934 109 486 128 720 138 510
Advances received 282 881 274 895 266 315 257 083 247 135
Borrowing 4 383 114 5 376 975 6 160 034 6 752 199 7 387 365
Superannuation 4 058 130 3 852 410 3 646 690 3 440 970 3 235 250
Other employee benefits 619 376 620 204 621 827 622 529 622 570
Payables 273 621 261 796 259 882 267 777 270 883
Other liabilities 944 741 998 893 1 013 581 1 047 591 1 045 268
TOTAL LIABILITIES 10 705 434 11 487 107 12 077 815 12 516 869 12 946 981
NET ASSETS/(LIABILITIES) 10 027 536 9 776 148 9 525 653 9 217 493 8 914 050
Contributed equity
Accumulated surplus/(deficit) 2 878 479 2 627 091 2 376 596 2 068 436 1 764 993
Reserves 7 149 057 7 149 057 7 149 057 7 149 057 7 149 057
NET WORTH 10 027 536 9 776 148 9 525 653 9 217 493 8 914 050
NET FINANCIAL WORTH1 ‑ 7 778 133 ‑ 8 859 774 ‑ 9 468 655 ‑ 9 834 883 ‑ 10 169 491
NET FINANCIAL LIABILITIES2 7 799 764 8 881 405 9 490 286 9 856 514 10 191 122
NET DEBT3 2 358 174 3 604 305 4 403 581 4 939 430 5 478 700
1 Net financial worth equals total financial assets minus total liabilities.2 Net financial liabilities equals the sum of total liabilities less total financial assets excluding investments in other public sector entities. 3 Net debt equals the sum of deposits held, advances received and borrowing, minus the sum of cash and deposits, advances paid and
investments, loans and placements.

112 Uniform Presentation Framework
2017-18 Budget
Table 9.9
Non Financial Public Sector Cash Flow Statement
2016‑17 2017‑18 2018‑19 2019‑20 2020‑21
Estimate Budget Forward Estimates
$000 $000 $000 $000 $000Cash receipts from operating activitiesTaxes received 588 852 557 547 557 171 575 534 591 602Receipts from sales of goods and services 1 013 493 1 057 904 1 143 606 1 198 574 1 231 227Grants and subsidies received 4 595 274 4 260 400 3 997 507 4 079 840 4 139 952Interest receipts 70 201 65 051 67 047 69 348 71 036Dividends and income tax equivalents 24 132 14 368 19 493 18 064 23 441Other receipts 484 687 528 305 476 849 475 908 475 511Total operating receipts 6 776 639 6 483 575 6 261 673 6 417 268 6 532 769Cash payments for operating activitiesPayments for employees ‑ 2 712 673 ‑ 2 722 367 ‑ 2 728 549 ‑ 2 791 153 ‑ 2 844 309Payment for goods and services ‑ 2 144 552 ‑ 2 310 041 ‑ 2 153 470 ‑ 2 213 006 ‑ 2 307 261Grants and subsidies paid ‑ 1 188 749 ‑ 1 157 211 ‑ 1 015 105 ‑ 1 047 757 ‑ 1 020 297Interest paid ‑ 270 345 ‑ 288 048 ‑ 323 959 ‑ 363 342 ‑ 392 361Other payments Total operating payments ‑ 6 316 319 ‑ 6 477 667 ‑ 6 221 083 ‑ 6 415 258 ‑ 6 564 228NET CASH FLOWS FROM OPERATING ACTIVITIES 460 320 5 908 40 590 2 010 ‑ 31 459Cash flows from investments in non financial assetsSales of non financial assets 75 082 66 770 67 424 58 221 58 221Purchases of non financial assets ‑ 1 101 219 ‑ 1 357 558 ‑ 947 775 ‑ 638 578 ‑ 610 218Net cash flows from investments in non financial assets ‑ 1 026 137 ‑ 1 290 788 ‑ 880 351 ‑ 580 357 ‑ 551 997NET CASH FROM OPERATING ACTIVITIES AND INVESTMENTS IN NON FINANCIAL ASSETS
‑ 565 817 ‑ 1 284 880 ‑ 839 761 ‑ 578 347 ‑ 583 456
Net cash flows from investments in financial assets for policy purposes1
19 596 14 216 17 315 14 128 14 128
Net cash flows from investments in financial assets for liquidity purposes
396 543 83 384 ‑ 68 459 ‑ 59 902 ‑ 19 014
NET CASH FLOWS FROM INVESTING ACTIVITIES ‑ 609 998 ‑ 1 193 188 ‑ 931 495 ‑ 626 131 ‑ 556 883Net cash flows from financing activitiesAdvances received (net) ‑ 10 583 ‑ 7 986 ‑ 8 580 ‑ 9 232 ‑ 9 948Borrowing (net) ‑ 35 095 993 361 782 559 591 665 634 666Deposits received (net) 21 177 ‑ 41 637 7 552 19 234 9 790Other financing (net) NET CASH FLOWS FROM FINANCING ACTIVITIES ‑ 24 501 943 738 781 531 601 667 634 508NET INCREASE/DECREASE IN CASH HELD ‑ 174 179 ‑ 243 542 ‑ 109 374 ‑ 22 454 46 166Net cash flows from operating activities 460 320 5 908 40 590 2 010 ‑ 31 459Net cash flows from investments in non financial assets ‑ 1 026 137 ‑ 1 290 788 ‑ 880 351 ‑ 580 357 ‑ 551 997CASH SURPLUS (+)/DEFICIT (‑) ‑ 565 817 ‑1 284 880 ‑ 839 761 ‑ 578 347 ‑ 583 456Future infrastructure and superannuation contributions/ earnings2
‑ 23 527 ‑ 21 849 ‑ 23 160 ‑ 24 550 ‑ 26 023
UNDERLYING SURPLUS (+)/DEFICIT (‑) ‑ 589 344 ‑ 1 306 729 ‑ 862 921 ‑ 602 897 ‑ 609 479Additional information to the Cash Flow StatementCASH SURPLUS (+)/DEFICIT (‑) ‑ 565 817 ‑ 1 284 880 ‑ 839 761 ‑ 578 347 ‑ 583 456Acquisitions under finance leases and similar arrangements ‑ 500 ‑ 500 ‑ 500 ‑ 500 ‑ 500ABS GFS SURPLUS (+)/DEFICIT (‑) including finance leases and similar arrangements
‑ 566 317 ‑ 1 285 380 ‑ 840 261 ‑ 578 847 ‑ 583 956
1 Includes equity acquisitions, disposals and privatisations (net).2 Contributions for future infrastructure and superannuation requirements.

Uniform Presentation Framework 113
Budget Strategy and Outlook
Table 9.10
Public Financial Corporation Sector Comprehensive Operating Statement2016‑17 Estimate
$000
REVENUE
Current grants
Capital grants
Sales of goods and services 820
Interest income 213 568
Other revenue
TOTAL REVENUE 214 388
less EXPENSES
Employee benefits expense 853
Superannuation expenses 100
Depreciation and amortisation
Other operating expenses 1 652
Interest expenses 197 415
Other property expenses 4 310
Current grants
Capital grants
Subsidies and personal benefit payments
TOTAL EXPENSES 204 330
equals NET OPERATING BALANCE 10 058
plus Other economic flows – included in operating result
equals OPERATING RESULT 10 058
plus Other economic flows – other comprehensive income
equals COMPREHENSIVE RESULT – total change in net worth before transactions with owners in their capacity as owners
10 058
NET OPERATING BALANCE 10 058
less Net acquisition of non financial assets
Purchases of non financial assets
Sales of non financial assets
less Depreciation
plus Change in inventories
plus Other movements in non financial assets
equals Total net acquisition of non financial assets
equals FISCAL BALANCE 10 058

114 Uniform Presentation Framework
2017-18 Budget
Table 9.11
Public Financial Corporation Sector Balance Sheet 2016‑17 Estimate
$000
ASSETS
Financial assets
Cash and deposits 61 078
Advances paid 76 354
Investments, loans and placements 3 925 163
Receivables 5 990
Equity
Other financial assets
Total financial assets 4 068 585
Non financial assets
Inventories
Property, plant and equipment
Investment property
Other non financial assets
Total non financial assets
TOTAL ASSETS 4 068 585
LIABILITIES
Deposits held 521
Advances received 216 169
Borrowing 3 768 271
Superannuation
Other employee benefits 139
Payables 47 484
Other liabilities 14 370
TOTAL LIABILITIES 4 046 954
NET ASSETS/(LIABILITIES) 21 631
Contributed equity 18 714
Accumulated surplus/(deficit) 2 917
Reserves
TOTAL EQUITY 21 631
NET FINANCIAL WORTH1 21 631
NET DEBT2 ‑ 77 634
1 Net financial worth equals total financial assets minus total liabilities.2 Net debt equals the sum of deposits held, advances received and borrowing, minus the sum of cash and deposits, advances paid and
investments, loans and placements.

Uniform Presentation Framework 115
Budget Strategy and Outlook
Table 9.12
Public Financial Corporation Sector Cash Flow Statement 2016‑17 Estimate
$000
Cash receipts from operating activities
Receipts from sales of goods and services 820
Grants and subsidies received
Interest receipts 213 277
Other receipts
Total operating receipts 214 097
Cash payments for operating activities
Income tax equivalents paid ‑ 7 240
Payments for employees ‑ 953
Payment for goods and services ‑ 1 652
Grants and subsidies paid
Interest paid ‑ 195 735
Other payments
Total operating payments ‑ 205 580
NET CASH FLOWS FROM OPERATING ACTIVITIES 8 517
Cash flows from investments in non financial assets
Sales of non financial assets
Purchases of non financial assets
Net cash flows from investments in non financial assets
NET CASH FROM OPERATING ACTIVITIES AND INVESTMENTS IN NON FINANCIAL ASSETS 8 517
Net cash flows from investments in financial assets for policy purposes1
Net cash flows from investments in financial assets for liquidity purposes 38 430
NET CASH FLOWS FROM INVESTING ACTIVITIES 38 430
Net cash flows from financing activities
Advances received (net) ‑ 7 104
Borrowing (net) ‑ 1 000
Deposits received (net)
Dividends paid ‑ 16 892
Other financing (net)
NET CASH FLOWS FROM FINANCING ACTIVITIES ‑ 24 996
NET INCREASE/DECREASE IN CASH HELD 21 951
Net cash flows from operating activities 8 517
Net cash flows from investments in non financial assets
Distributions paid ‑ 16 892
CASH SURPLUS (+)/DEFICIT (‑) ‑ 8 375
Additional information to the Cash Flow Statement
CASH SURPLUS (+)/DEFICIT (‑) ‑ 8 375
Acquisitions under finance leases and similar arrangements
ABS GFS SURPLUS (+)/DEFICIT (‑) including finance leases and similar arrangements ‑ 8 375
1 Includes equity acquisitions, disposals and privatisations (net).

116 Uniform Presentation Framework
2017-18 Budget
Table 9.13
Total Public Sector Comprehensive Operating Statement 2016‑17 Estimate
$000
REVENUE
Taxation revenue 588 852
Current grants 4 239 377
Capital grants 355 899
Sales of goods and services 964 549
Interest income 70 401
Dividend and income tax equivalent income
Other revenue 258 279
TOTAL REVENUE 6 477 357
less EXPENSES
Employee benefits expense 2 350 223
Superannuation expenses
Superannuation interest cost 133 639
Other superannuation expenses 222 517
Depreciation and amortisation 517 830
Other operating expenses 1 836 654
Interest expenses 254 394
Other property expenses
Current grants 923 473
Capital grants 113 704
Subsidies and personal benefit payments 151 858
TOTAL EXPENSES 6 504 292
equals NET OPERATING BALANCE ‑ 26 935
plus Other economic flows – included in operating result ‑ 78 114
equals OPERATING RESULT ‑ 105 049
plus Other economic flows – other comprehensive income 332 697
equals COMPREHENSIVE RESULT – total change in net worth before transactions with owners in their capacity as owners
227 648
NET OPERATING BALANCE ‑ 26 935
less Net acquisition of non financial assets
Purchases of non financial assets 1 101 219
Sales of non financial assets ‑ 75 082
less Depreciation 517 830
plus Change in inventories ‑ 2 399
plus Other movements in non financial assets 19 122
equals Total net acquisition of non financial assets 525 030
equals FISCAL BALANCE ‑ 551 965

Uniform Presentation Framework 117
Budget Strategy and Outlook
Table 9.14
Total Public Sector Balance Sheet 2016‑17 Estimate
$000
ASSETS
Financial assets
Cash and deposits 449 497
Advances paid 158 371
Investments, loans and placements 1 843 524
Receivables 423 652
Equity
Investments in other public sector entities
Investments – other 3
Other financial assets 16 249
Total financial assets 2 891 296
Non financial assets
Inventories 195 939
Property, plant and equipment 17 352 605
Investment property 99 694
Other non financial assets 157 431
Total non financial assets 17 805 669
TOTAL ASSETS 20 696 965
LIABILITIES
Deposits held 83 014
Advances received 222 486
Borrowing 4 426 432
Superannuation 4 058 130
Other employee benefits 619 515
Payables 315 109
Other liabilities 944 743
TOTAL LIABILITIES 10 669 429
NET ASSETS/(LIABILITIES) 10 027 536
Contributed equity
Accumulated surplus/(deficit) 2 881 396
Reserves 7 146 140
NET WORTH 10 027 536
NET FINANCIAL WORTH1 ‑ 7 778 133
NET DEBT2 2 280 540
1 Net financial worth equals total financial assets minus total liabilities.2 Net debt equals the sum of deposits held, advances received and borrowing, minus the sum of cash and deposits, advances paid and
investments, loans and placements.

118 Uniform Presentation Framework
2017-18 Budget
Table 9.15
Total Public Sector Cash Flow Statement 2016‑17 Estimate
$000
Cash receipts from operating activities
Taxes received 588 852
Receipts from sales of goods and services 1 012 817
Grants and subsidies received 4 595 274
Interest receipts 70 201
Other receipts 484 687
Total operating receipts 6 751 831
Cash payments for operating activities
Payments for employees ‑ 2 713 626
Payment for goods and services ‑ 2 144 708
Grants and subsidies paid ‑ 1 188 749
Interest paid ‑ 252 803
Other payments
Total operating payments ‑ 6 299 886
NET CASH FLOWS FROM OPERATING ACTIVITIES 451 945
Cash flows from investments in non financial assets
Sales of non financial assets 75 082
Purchases of non financial assets ‑ 1 101 219
Net cash flows from investments in non financial assets ‑ 1 026 137
NET CASH FROM OPERATING ACTIVITIES AND INVESTMENTS IN NON FINANCIAL ASSETS ‑ 574 192
Net cash flows from investments in financial assets for policy purposes1 19 596
Net cash flows from investments in financial assets for liquidity purposes 396 543
NET CASH FLOWS FROM INVESTING ACTIVITIES ‑ 609 998
Net cash flows from financing activities
Advances received (net) ‑ 7 104
Borrowing (net) ‑ 8 248
Deposits received (net) ‑ 774
Other financing (net)
NET CASH FLOWS FROM FINANCING ACTIVITIES ‑ 16 126
NET INCREASE/DECREASE IN CASH HELD ‑ 174 179
Net cash flows from operating activities 451 945
Net cash flows from investments in non financial assets ‑ 1 026 137
CASH SURPLUS (+)/DEFICIT (‑) ‑ 574 192
Future infrastructure and superannuation contributions/earnings2 ‑ 23 527
UNDERLYING SURPLUS (+)/DEFICIT (‑) ‑ 597 719
Additional information to the Cash Flow Statement
CASH SURPLUS (+)/DEFICIT (‑) ‑ 574 192
Acquisitions under finance leases and similar arrangements ‑ 500
ABS GFS SURPLUS (+)/DEFICIT (‑) including finance leases and similar arrangements ‑ 574 692
1 Includes equity acquisitions, disposals and privatisations (net).2 Contributions for future infrastructure and superannuation requirements.

Uniform Presentation Framework 119
Budget Strategy and Outlook
Table 9.16
General Government Sector Taxes 2016‑17 Estimate
2017‑18 Budget
$M $M
Taxes on employers’ payroll and labour force 311 270
Payroll taxes 311 270
Taxes on property 107 103
Stamp duties on financial and capital transactions 107 103
Taxes on the provision of goods and services 111 117
Taxes on gambling 73 78
Taxes on insurance 38 39
Taxes on the use of goods and performance of activities 70 77
Motor vehicle registration fees 70 77
TOTAL TAXES 599 567
Table 9.17
State and Territory General Government Sector Grant Revenue 2016‑17 Estimate
2017‑18 Budget
$M $M
Current grant revenue
Current grants from the Commonwealth (including for on‑passing)
National partnership payments 260 242
Specific purpose payments 343 357
General purpose grants 3 637 3 288
Total current grant revenue 4 240 3 887
Capital grant revenue
Capital grants from the Commonwealth (including for on‑passing)
National partnership payments 278 324
Specific purpose payments 33 18
General purpose grants 16 20
Total capital grant revenue 328 362
TOTAL GRANTS REVENUE 4 567 4 249

120 Uniform Presentation Framework
2017-18 Budget
Table 9.18
State and Territory General Government Sector Grant Expenses 2016‑17 Estimate
2017‑18 Budget
$M $M
Current grant expenses including subsidies and personal benefit payments
Local Government 133 135
Private and not‑for‑profit sector (including for on‑passing) 845 854
Grants to other sectors of Government 62 57
Other 226 194
Total current grant expenses including subsidies and personal benefit payments 1 266 1 240
Capital grant expenses
Local Government 42 16
Private and not‑for‑profit sector (including for on‑passing) 72 87
Grants to other sectors of Government 31 18
Other
Total capital grant expenses 145 121
TOTAL GRANT EXPENSES 1 411 1 361
Table 9.19
General Government Sector Dividend and Income Tax Equivalent Income
2016‑17 Estimate
2017‑18 Budget
$M $M
Dividend and income tax equivalent income from public non financial corporations sector 52 59
Dividend and income tax equivalent income from public financial corporations sector 14 19
TOTAL DIVIDEND AND INCOME TAX EQUIVALENT INCOME 66 78

Uniform Presentation Framework 121
Budget Strategy and Outlook
Table 9.20
General Government Sector Operating Expenses by Function 2016‑17 Estimate
2017‑18 Budget
$M $M
General public services 485 492
Public order and safety 742 757
Economic affairs 461 496
Environmental protection 118 119
Housing and community amenities 567 571
Health 1 473 1 490
Recreation, culture and religion 169 171
Education 1 184 1 187
Social protection 532 597
Transport 229 229
TOTAL OPERATING EXPENSES 5 961 6 109
Table 9.21
General Government Sector Purchases of Non Financial Assets by Function 2016‑17 Estimate
2017‑18 Budget
$M $M
General public services 12 11
Public order and safety 68 76
Economic affairs 13 111
Environmental protection 5 5
Housing and community amenities 209 250
Health 196 169
Recreation, culture and religion 41 74
Education 110 83
Social protection 9 30
Transport 205 325
TOTAL PURCHASES OF NON FINANCIAL ASSETS 868 1 134

122 Uniform Presentation Framework
2017-18 Budget
Table 9.22
2017‑18 Loan Council AllocationLoan Council
AllocationBudget‑time
Estimate
$M $M
General government sector cash deficit (+)/surplus (‑) 400 1 179
Public non financial corporations sector cash deficit (+)/surplus (‑) 18 106
Non financial public sector cash deficit (+)/surplus (‑) 418 1 285
less Acquisitions under finance leases and similar arrangements
equals ABS GFS cash deficit (+)/surplus (‑) 418 1 285
less Net cash flows from investments in financial assets for policy purposes 14 14
plus Memorandum items
2017‑18 LOAN COUNCIL NOMINATION 404 1 271
Tolerance limit (2% of non financial public sector cash receipts from operating activities) 132
Change in loan council allocation 867
Note: This table sets out the Territory’s 2017‑18 Loan Council Allocation (LCA) Budget update of $1 271 million as compared to that nominated and endorsed with the Loan Council of $404 million. Nominations for 2017‑18 were provided by all jurisdictions on the basis of policies commenced up to and included in their Mid‑Year budget updates. The budget‑time estimate reflects reduced GST revenue combined with spending decisions aimed at stimulating the Territory economy, and revised timing of Commonwealth funding being spent in 2017‑18 rather than 2016‑17.

Appendix B 123
Budget Strategy and Outlook
Appendices

124
2017-18 Budget

125
Budget Strategy and Outlook
Appendix A
Appendix A Classification of Entities in the Northern Territory
Non Financial Public SectorGeneral GovernmentAboriginal Areas Protection AuthorityAuditor‑General’s OfficeAustralAsia Railway Corporation1
Batchelor Institute of Indigenous Tertiary Education1
Central Australia Health Service2
Central Holding AuthorityDarwin Waterfront Corporation1
Data Centre Services2
Department of the Attorney‑General and JusticeDepartment of the Chief MinisterDepartment of Corporate and Information ServicesDepartment of EducationDepartment of Environment and Natural ResourcesDepartment of Health Department of Housing and Community DevelopmentDepartment of Infrastructure, Planning and LogisticsDepartment of the Legislative AssemblyDepartment of Primary Industry and ResourcesDepartment of Tourism and CultureDepartment of Trade, Business and InnovationDepartment of Treasury and Finance Desert Knowledge Australia1
Motor Accidents (Compensation) Commission1
Museums and Art Galleries Board of the Northern Territory1
Nominal Insurer’s Fund1
Northern Territory Electoral CommissionNorthern Territory Legal Aid Commission1
Northern Territory Major Events Company Pty Ltd1
Northern Territory Police, Fire and Emergency ServicesNT Build Statutory Corporation1
NT Fleet2
NT Home Ownership2
Office of the Commissioner for Public EmploymentOmbudsman’s OfficeTerritory FamiliesTerritory Wildlife Parks2
Top End Health Service2
Public Non Financial CorporationsIndigenous Essential Services Pty Ltd1
Jacana Energy1, 3
Land Development Corporation2
Power and Water Corporation1, 3
Territory Generation1, 3
Public Financial CorporationNorthern Territory Treasury Corporation2
1 Non‑budget sector entity.2 Government business division.3 Government owned corporation.

126 Appendix B
2017-18 Budget
Appendix B Glossary
Advances/advances paidAdvances are the creation of financial assets (that is, an increase in the indebtedness to government units) with the aim of funding particular enterprise, household or government activities.
AgencyA unit of government administration, office or statutory corporation, nominated in an Administrative Arrangements Order for the purposes of the Financial Management Act and including, where the case requires, a part or division (by whatever name called) of an agency.
AppropriationAn authority given by the Legislative Assembly to make payments, now or at some future time, for the purposes stated, up to the limit of the amount in the particular Act.
Australian accounting standardsStatements of accounting standards that can be applied in preparation and presentation of financial statements.
Australian Bureau of Statistics (ABS) The ABS is a Commonwealth agency that coordinates statical activities and collaborates with official bodies in the collection, compilation analysis and distribution of statistics. This assists in maximising the value of government investment, and ensures outputs are fit for purpose.
Capital grantsTransactions in which the ownership of an asset (other than cash and inventories) is transferred from one institutional unit to another, cash is transferred to enable the recipient to acquire another asset, or the funds realised by the disposal of another asset are transferred, for which no economic benefits of equal value are receivable or payable in return.
Cash surplus/deficitReported in the Cash Flow Statement and measures the net impact of cash flows during the period. It equals net cash flows from operating activities plus net cash flows from acquisition and disposal of non financial assets, less distributions paid, less value of assets acquired under finance leases and similar arrangements.
Commonwealth Grants Commission (CGC)The CGC is a Commonwealth statutory body that makes recommendations to the Commonwealth Treasurer on how the revenues raised from GST should be distributed to the states and territories to achieve horizontal fiscal equalisation.
Commonwealth own‑purpose expenses (COPE) Payments by the Commonwealth for goods and services and associated transfer payments for the conduct of its general government activities.
Community service obligation (CSO)A CSO arises when the Government requires a government business division or government owned corporation to carry out activities that it would not choose to do on a commercial basis or would

Appendix B 127
Budget Strategy and Outlook
only do at higher commercial prices. CSOs allow the Government to achieve identifiable community or social objectives that would not be achieved if left to commercial considerations.
Comprehensive resultThe net result of all items of income and expense recognised for the period. It is the aggregate of operating result and other movements in equity, other than transactions with owners as owners.
Consumer price index (CPI)A general indicator of the prices paid by household consumers for a specific basket of goods and services in one period relative to the cost of the same basket in a base period.
Contingent liabilityA potential financial obligation arising out of a condition, situation, guarantee or indemnity, the ultimate effect of which will be confirmed only on the occurrence or nonoccurrence of one or more uncertain future events.
Current grantsAmounts payable or receivable for current purposes for which no economic benefits of equal value are receivable or payable in return.
Finance leaseLease agreements that transfer substantially all the risks and benefits relating to ownership of an asset from the lessor (legal owner) to the lessee (party using the asset).
Financial assetAny asset that is:
• cash;
• an equity instrument of another entity;
• a contractual right:
− to receive cash or another financial asset from another entity; or
− to exchange financial assets or financial liabilities with another entity under conditions that are potentially favourable to the entity; or
• a contract that will or may be settled in the entity’s own equity instruments and is:
− a non‑derivative for which the entity is or may be obliged to receive a variable number of the entity’s own equity instruments; or
− a derivative that will or may be settled other than by the exchange of a fixed amount of cash or another financial asset for a fixed number of the entity’s own equity instruments.
For this purpose, the entity’s own equity instruments do not include instruments that are themselves contracts for the future receipt or delivery of the entity’s own equity instruments.
Fiscal balance (net lending/borrowing)Fiscal balance, also referred to as net lending/borrowing, is an operating statement measure that differs from the net operating balance in that it includes spending on capital items but excludes depreciation. A net lending (or fiscal surplus) balance indicates that a government is saving more than enough to finance all its investment spending. A net borrowing (or fiscal deficit) position indicates that a government’s level of investment is greater than its level of savings.

128 Appendix B
2017-18 Budget
General government sectorDefined in Government Finance Statistics as an entity or group of entities that are mainly engaged in the production of goods and or services outside the normal market mechanism. Goods and services are provided free of charge or at nominal charges well below costs of production.
Generally accepted accounting principles (GAAP)Term used to describe broadly the body of principles that governs the accounting for financial transactions underlying the preparation of a set of financial statements.
Goods and services tax (GST) revenueThe Territory’s share of nationally collected GST, based on the Territory’s population share weighted by its GST relativity. Revenue‑sharing relativities are determined by the Commonwealth Treasurer, as informed by the recommendations of the CGC.
Government business division (GBD)A Territory‑controlled trading entity that follows commercial practices and is required to comply with competitive neutrality principles.
Government finance statistics (GFS)Refers to statistics that measure the financial transactions of governments and reflect the impact of those transactions on other sectors of the economy. GFS in Australia are developed by the ABS in conjunction with all governments and are mainly based on international statistical standards developed, in consultation with member countries, by the International Monetary Fund.
Government owned corporationAn entity in which its objectives are to operate at least as efficiently as any corporate business and maximise sustainable return to government. The Government Owned Corporations Act adopts the shareholder model of corporate governance. The Territory has three government owned corporations: Power and Water Corporation, Territory Generation (power generation) and Jacana Energy (power retail corporation).
Government purpose classification (GPC)Classifies outlays or expenditure transactions by the purpose served, for example, health or education.
GrantsTransactions in which one unit provides goods, services, assets (or extinguishes a liability) or labour to another unit without receiving approximately equal value in return. Grants can either be of a current or capital nature (see current grants and capital grants).
Grants can be paid as general purpose grants, which refer to grants that are not subject to conditions regarding their use. Alternatively, they may be paid as specific purpose grants, which are paid for a particular purpose and or have conditions attached regarding their use.
Grants for on‑passingAll grants paid to one institutional sector (for example, a state general government) to be passed on to another institutional sector (for example, local government or a non‑profit institution).
Gross domestic product (GDP)The total value of goods and services produced in Australia over the period for final consumption. Intermediate goods, or those used in the production of other goods, are excluded. Gross domestic product can be calculated by summing total output, total income or total expenditure.

Appendix B 129
Budget Strategy and Outlook
Gross state product (GSP)Measures the total value of goods and services produced in a jurisdiction. It is the sum of all income, namely wages, salaries and profits, plus indirect taxes less subsidies. It can also be calculated by measuring expenditure, where it is the sum of state final demand and international and interstate trade, changes in the level of stocks and a balancing item.
GuaranteeAn undertaking to answer for the debt or obligations of another person or entity.
IndemnityA written undertaking to compensate, protect or insure another person or entity against future financial loss, damage or liability.
Intergovernmental agreementAn agreement signed by all states and the Commonwealth in December 2008 defining the framework for federal financial relations, encompassing Commonwealth funding to states and territories through general revenue assistance, specific purpose payments and national partnership payments.
Loan Council The Australian Loan Council coordinates borrowing by Commonwealth and state and territory governments. Current arrangements seek to emphasise transparency of public sector finances, through financial market scrutiny of proposed borrowing to restrict borrowing to prudent levels.
Loan Council Allocation The nomination to the Loan Council of the level of financing required.
Memorandum items – Loan CouncilMemorandum items are used to adjust the cash surplus/deficit to include in the Loan Council Allocation certain transactions that may have the characteristics of public sector borrowings but do not constitute formal borrowings.
National partnership agreementsNational partnership (NP) agreements are agreements between the Commonwealth, states and territories with defined objectives, outcomes, outputs and performance measures related to the delivery of projects of national significance or to facilitate reforms.
National partnership paymentsNP payments are tied Commonwealth grants provided to states and territories to enable them to achieve the outcomes and outputs of an NP agreement.
Net acquisition/(disposal) of non financial assets from transactionsPurchases (or acquisitions) of non financial assets less sales (or disposals) of non financial assets less depreciation plus changes in inventories and other movements in non financial assets.
Purchases and sales (or net acquisitions) of non financial assets generally include accrued expenses and payables for capital items. Purchases exclude non‑produced assets and valuables, which are included in other movements in non financial assets.
Net actuarial gainsIncludes actuarial gains and losses on defined benefit superannuation plans.

130 Appendix B
2017-18 Budget
Net cash flows from investments in financial assets (liquidity management purposes)Cash receipts from liquidation or repayment of investments in financial assets for liquidity management purposes less cash payments for such investments. Investment for liquidity management purposes means making funds available to others with no policy intent and with the aim of earning a commercial rate of return.
Net cash flows from investments in financial assets (policy purposes) Cash receipts from the repayment and liquidation of investments in financial assets for policy purposes less cash payments for acquiring financial assets for policy purposes. Acquisition of financial assets for policy purposes is distinguished from investments in financial assets (liquidity management purposes) by the underlying government motivation for acquiring the assets. Acquisition of financial assets for policy purposes is motivated by government policies such as encouraging the development of certain industries or assisting citizens affected by natural disasters.
Net debtNet debt measures a government’s net stock of selected gross financial liabilities less financial assets.
It equals the sum of deposits held, advances received, government securities, loans and other borrowing less the sum of cash and deposits, advances paid and investments, loans and placements.
Net financial liabilitiesTotal liabilities less financial assets, other than equity in public non financial corporations and public financial corporations. This measure is broader than net debt, as it includes significant liabilities, other than borrowings (for example, accrued employee liabilities such as superannuation and long service leave entitlements). For the public non financial corporation and public financial corporation sectors, it is equal to negative net financial worth.
Net financial worthA measure of a government’s net holdings of financial assets. It is calculated from the Uniform Presentation Framework Balance Sheet as financial assets minus liabilities. Net financial worth is a broader measure than net debt as it incorporates provisions (such as superannuation, but excludes depreciation and doubtful debts) as well as holdings of equity. Net financial worth includes all classes of financial assets and liabilities.
Net operating balance Total revenue from transactions less total expenses from transactions. It is a summary measure of the ongoing sustainability of operations and excludes gains and losses resulting from changes in price levels and other changes in the volume of assets. It is the component of the change in net worth that is due to transactions and can be attributed directly to government policies.
Net worthProvides a relatively comprehensive picture of a government’s overall financial position. It is calculated as total assets less total liabilities less shares and other contributed capital. It includes a government’s non financial assets, such as land and other fixed assets, which may be sold and used to repay debt, as well as its financial assets and liabilities including debtors, creditors and superannuation liabilities. Net worth also shows asset acquisitions over time, giving an indication of the extent to which borrowings are used to finance asset purchases, rather than only current expenditure.

Appendix B 131
Budget Strategy and Outlook
Non‑budget sector entityAn entity in which the Territory has a controlling interest. The entity is consolidated at whole‑of‑government level but is not presented separately in the Territory’s financial reports. Outside the scope of the Financial Management Act, it is generally a statutory body that does not meet the definition of a general government sector entity, public non financial corporation or public financial corporation.
Non financial assetsAssets that are not financial assets and predominantly comprise of land and other fixed assets.
Non financial public sectorThe sector formed through a consolidation of the general government and public non financial corporation subsectors.
Other economic flowsChanges in the volume or value of an asset or liability that do not result from transactions (such as revaluations and other changes in the volume of assets).
Other superannuation expenseIncludes all superannuation expenses from transactions except superannuation interest cost. It generally includes current service cost, which is the increase in entitlements associated with the employment services provided by employees in the current period. Superannuation actuarial gains/losses are excluded as they are considered other economic flows.
PayablesIncludes short‑term and long‑term trade debt and accounts payable, grants and interest payable.
Public financial corporationsGovernment‑controlled entities that perform central bank functions, and or have the authority to incur liabilities and acquire financial assets in the market on their own account.
Public non financial corporationsPublic enterprises primarily engaged in the production of goods or services of a non financial nature, for sale in the market place, at prices that aim to recover most of the costs involved.
ReceivablesIncludes short‑term and long‑term trade credit and accounts receivable, grants, taxes and interest receivable.
Sale of goods and servicesRevenue from the direct provision of goods and services and includes fees and charges for services rendered, sale of goods and services, fees from regulatory services and work done as an agent for private enterprises. It also includes rental income under operating leases and on produced assets such as buildings and entertainment, but excludes rental income from the use of non‑produced assets such as land. User charges include sale of goods and services revenue.
Specific purpose payments (SPPs)A Commonwealth financial contribution to support delivery of services in a particular sector. Payments are made from the Commonwealth Treasury to state and territory treasuries and are appropriated to the relevant government agency.

132 Appendix B
2017-18 Budget
State final demand Final consumption expenditure plus gross fixed capital formation in each jurisdiction. It represents the total expenditure on consumption and investment in a jurisdiction.
Superannuation interest costThe expense resulting from the increase in the liability due to the fact that, for all participants in the scheme, retirement (and death) is one year nearer, and so one fewer discount factors must be used to calculate the present value of the benefits for each future year. Interest cost is the increase during a period in the present value of a defined benefit obligation that arises because the benefits are one period closer to settlement, as per the relevant accounting standard. The cost is measured net of the return on plan assets of defined benefit schemes.
Tax equivalents regimeThe mechanism to ensure government business divisions and government owned corporations incur similar tax liabilities to privately owned organisations. Thus, greater parity exists between the cost structures of government‑controlled trading entities and the private sector, aiding in the achievement of competitive neutrality.
Total public sectorThe total public sector is formed through a consolidation of the non financial public sector and public financial corporations.
Treasurer’s AdvanceAn appropriation purpose of that name as specified in an Appropriation Act, which provides a pool of funds specifically set aside in each Budget to meet one‑off unexpected costs that arise during the year and are substantial enough to warrant additional appropriation.
Uniform Presentation Framework (UPF) A uniform framework agreed by the Australian Loan Council in 2000 and incorporating accounting standard AASB 1049 Whole of Government and General Government Sector Financial Reporting. The UPF requires Commonwealth, state and territory governments to present a minimum set of budget and financial outcome information based on the Government Finance Statistics, according to an agreed format, and specified Loan Council reporting arrangements.